Article

Vibration Analysis for Diagnosis of Diesel Engines with Air Flow Sensor Failure †

by
Ali Helali
1,*,
Ines Belkacem
2,
Jamila Abdellaoui
3 and
Achraf Zegnani
3
1
Laboratory of Mechanics of Sousse (LMS), Higher Institute of Transport and Logistics of Sousse, University of Sousse, Sousse 4002, Tunisia
2
Laboratory of Thermal and Energy Systems Studies (LESTE), Higher Institute of Transport and Logistics of Sousse, University of Sousse, Sousse 4002, Tunisia
3
Laboratory of Mechanics of Sousse (LMS), National Engineering School of Sousse, University of Sousse, Sousse 4002, Tunisia
*
Author to whom correspondence should be addressed.
This article is a revised and expanded version of a paper entitled Vibration Diagnosis of Diesel Engines with Air Flow Sensor Failure. In Proceedings of the ICAMEM 2024, Sousse, Tunisia, 28–30 June 2024.
Technologies 2025, 13(9), 380; https://doi.org/10.3390/technologies13090380
Submission received: 1 June 2025 / Revised: 2 August 2025 / Accepted: 6 August 2025 / Published: 27 August 2025

Abstract

Carrying out automobile stability and dynamic comfort involves a close examination of engine performance, such that fault detection at the early stage must be of the highest priority to reliability and effectiveness. The study evaluates the impact of malfunctions in mass air flow (MAF) sensors on diesel engine performance and stability, particularly on vibratory emissions. Employing experimental methods, defect and normal engine vibrations were analyzed in both time-domain and frequency spectral domain methodologies. Some statistical values, such as root mean square (RMS), kurtosis, mean, standard deviation, clearance factor, and shape factor, were employed to compare and characterize the vibration pattern. The results indicate that malfunctions in the MAF sensor are characterized by striking vibration amplitude enhancement and instability at high engine revolutions. These defects cause poor starting, misfire, and rough engine running, which affect combustion efficiency. Conclusions show excellent correlation among MAF sensor fault, combustion activity, and engine vibration, and this confirms the need for fault detection at the initial stage. With its enhancement in vibration analysis diagnostic capability, this contribution is significant to condition monitoring and predictive maintenance activities. Lastly, the study contributes to improving engine reliability, efficiency in operation, and performance overall in the automotive industry.

1. Introduction

Over the past few years, technological progress in the servicing of motor vehicles has been facilitated by the necessity for increased efficiency, safety, and reliability. One of the most significant developments is predictive and preventive maintenance techniques that have come into vogue through analysis of data to foretell mechanical failure and maximize vehicle performance. These methods leverage real-time information on engine performance, tire wear and tear, and battery health to predict looming failures before they happen, enabling prophylactic actions and minimizing downtime [1].
Condition-based maintenance (CBM) is one of the cornerstones of predictive maintenance, basing maintenance planning on real-time monitoring of the equipment condition. The approach is generally defined in three phases: acquisition of operational data, degradation indications analysis, and decision-making [2,3,4]. The architecture accommodates both fault diagnosis—through sensor-based monitoring—and fault prognosis through predictions of failures before they occur. In internal combustion engines, vibration signal analysis has been highly effective in mechanical anomaly detection [5]. Vibration-based approaches are now prominent components in larger predictive maintenance (PdM) and prognostics and health management (PHM) systems, indicating real-time system health. With the extraction of salient features in both the time and frequency domains, the approaches comprise a credible, non-invasive, cost-effective solution for incipient fault detection.
Enhanced developments have further enhanced the application range of these methods. For instance, reinforcement learning has been employed in the scheduling of advanced engine systems maintenance [6], and deep learning models have been applied successfully on rotating equipment with demonstrated tolerance to dynamic conditions [7]. Integration of PHM tools into Industry 4.0 platforms—facilitated by distributed processing and intelligent data processing—has further established the value of advanced predictive methods in present industrial maintenance [8].
One of the best diagnostic tools in predictive maintenance is vibration analysis, and it is centrally crucial to detect fault signatures and anomalies in engine components. A classic example is fault measurement in the mass air flow (MAF) sensor, a very vital function that calibrates the air–fuel ratio by measuring the quantity of air existing in the engine so that the engine control unit (ECU) can thus precisely adjust the fuel injection to facilitate proper combustion. A faulty mass air flow sensor can extensively affect the efficiency of an engine in a vehicle. However, defective MAF sensors provide incorrect readings that are responsible for creating a series of performance issues.
Studies reveal that monitoring and analysis of vibration patterns allow for detection of MAF sensor faults at an early stage to offer prevention against engine inefficiencies and emission losses [9,10]. Also, studies have proved that the failures in the air filter, intake manifold, and exhaust system may have a significant impact on air flow patterns with the outcome of impaired engine performance [11]. By means of online vibration monitoring, engine performance degradation may be reduced and reliability enhanced by taking measures in time [12]. Optimization of diesel engine performance needs a complicated strategy based on several parameters on which power output and efficiency are dependent. The size of the engine, the type, and the configuration of the engine are significant points to keep in mind, with large displacement engines being ideally placed to give more power since they have more volume of combustion chambers [12,13,14]. Another efficiency booster can be created by embracing sophisticated air intake and exhaust systems via optimized flow and reduced backpressure [15,16]. However, mechanical malfunctions such as sensor failure will have a major impact on engine performance and pollution emissions.
Failure of the MAF sensor, for instance, results in disruption of the air–fuel ratio, where the engine runs too rich or lean, with resultant higher emissions, poor fuel economy, and erratic idling conditions [17]. Faults in other sensors, such as the oxygen sensor or air pressure transducer, have also been put down to the same inefficiencies, making it necessary to use proper fault diagnostics [18].
Vibration analysis has also been a very useful tool for fault diagnosis in diesel engines, including faults that involve the MAF sensor. Multiple studies have confirmed as a fact that vibration-based diagnosis techniques are effective for the detection of engine misfire, cracked pistons, worn bearings, and sensor faults [19,20,21,22,23]. Furthermore, more recent works include the integration of acoustic emission and frequency-domain analysis to improve the accuracy of fault detection [24]. By inspecting vibrational and acoustic signals, faults in internal combustion engines can be detected before they progress to become important mechanical malfunctions [25,26]. The technique not only improves maintenance efficiency but also decreases operating costs in terms of averted progressive damage as well as extended engine life [27].
The present paper aims to investigate the effect of faulty MAF sensors on the vibrational dynamics of diesel engines by obtaining diagnostic characteristics through temporal [28] and frequency domain analysis. The intention is to measure vibration in real-time at healthy and defective operation and apply statistical and spectral analysis techniques to identify fault characteristics. Parametric statistical measures like root mean square (RMS), kurtosis, mean, standard deviation, shape factor, and clearance factor are used to calculate vibrational deviations [29]. Frequency analysis techniques like spectral analysis are also used to achieve known fault signatures of MAF sensor faults [30]. The research considers constant monitoring and monitoring at the correct time to be significant in gaining maximum engine performance and reducing environmental pollution [31].
Experimental work conducted utilizing fast Fourier transform (FFT) analyzers has confirmed that vibrating analysis can be applied successfully to detect faults in MAF sensors. Vibrations are measured under varied operating conditions through the application of an accelerometer with an eddy current dynamometer in the study, which indicates the significance of such parameters as displacement vibrations and velocity vibrations in fault detection [32]. Vibration control is crucial to ensure engine reliability as well as to prevent performance loss as research has discovered [33].
Signal feature extraction quality relies heavily on fault diagnosis accuracy of diesel engines. The time-domain and hybrid-domain analysis techniques are critical to detect the subtle change of a signal; hence, the capability of large-scale features characterization [34] is required. Statistical features such as mean value, RMS, kurtosis, and shape factor provide useful information regarding energy distribution in vibration signals and oscillatory properties [35]. Larger RMS values tend to indicate larger vibrational intensities, an indicator of mechanical failure, and high kurtosis values are an indicator of abrupt hits typical of anomalies such as bearing faults or gear misalignments [36]. By inspecting these measures methodically, it is possible to distinguish between normal and fault conditions and thereby for proactive maintenance strategies [37].
The results validate the importance of frequent maintenance of the MAF sensor to prevent engine inefficiency and costly repairs. Multi-scan vibration monitoring coupled with frequency-domain analysis provides a good foundation for sensor fault diagnosis as well as optimal diesel engine performance [38,39].
The paper is organized as follows: Section 2 is reserved for research methodology, including experimental setup and data acquisition method. Section 3 provides key findings, with special focus on the impact of faults in MAF sensors on vibration behavior. Section 4 provides results, with special focus on statistical and spectral analysis techniques. Section 5 provides concluding remarks, with special focus on the importance of real-time vibration monitoring in modern engine diagnostics.
With the establishment of a sound practice in condition-based maintenance and sophisticated diagnostic techniques, the current research is part of the process of improving auto-motive fault detection means. By way of a blend of vibration analysis and predictive maintenance systems, there is a promising scope for enhanced engine efficiency and reliability, towards long-term sustainable vehicle performance [40,41,42].

2. Materials and Methods

2.1. Materials

The experimental setup involved a four-cylinder PSA DV4TD diesel engine (Peugeot 206 manufactured by PSA, Paris, France), delivering 68 hp and 130 Nm of torque, with a total weight of 125 kg. The engine used in Figure 1 has all the pieces of equipment required for any normal passenger car application, e.g., a measurement and diagnostic case in the wiring harness. The diagnostic tool employed for fault and measurement in the automotive industry is the “Fault and Measurement Panel (FMP)” and the engine used here is FMP enabled.
Diesel engines were chosen since they produce higher torque at lower revolutions compared to gasoline engines and handle urban driving and heavy loads well. This equates to better acceleration and increased towing capacity, which benefits individuals who require a boost of motive energy to tow heavy trailers or navigate heavy urban traffic.
A fault simulation involved cutting the fuse of the mass air flow sensor directly. This prevented the sensor from providing a true value for the incoming amount of air and resulted in supplying a defective signal to the engine control unit (ECU). The engine behavior would be interrupted and faults like irregular consumption of fuel, poor engine performance, and irregular engine operation would be simulated.
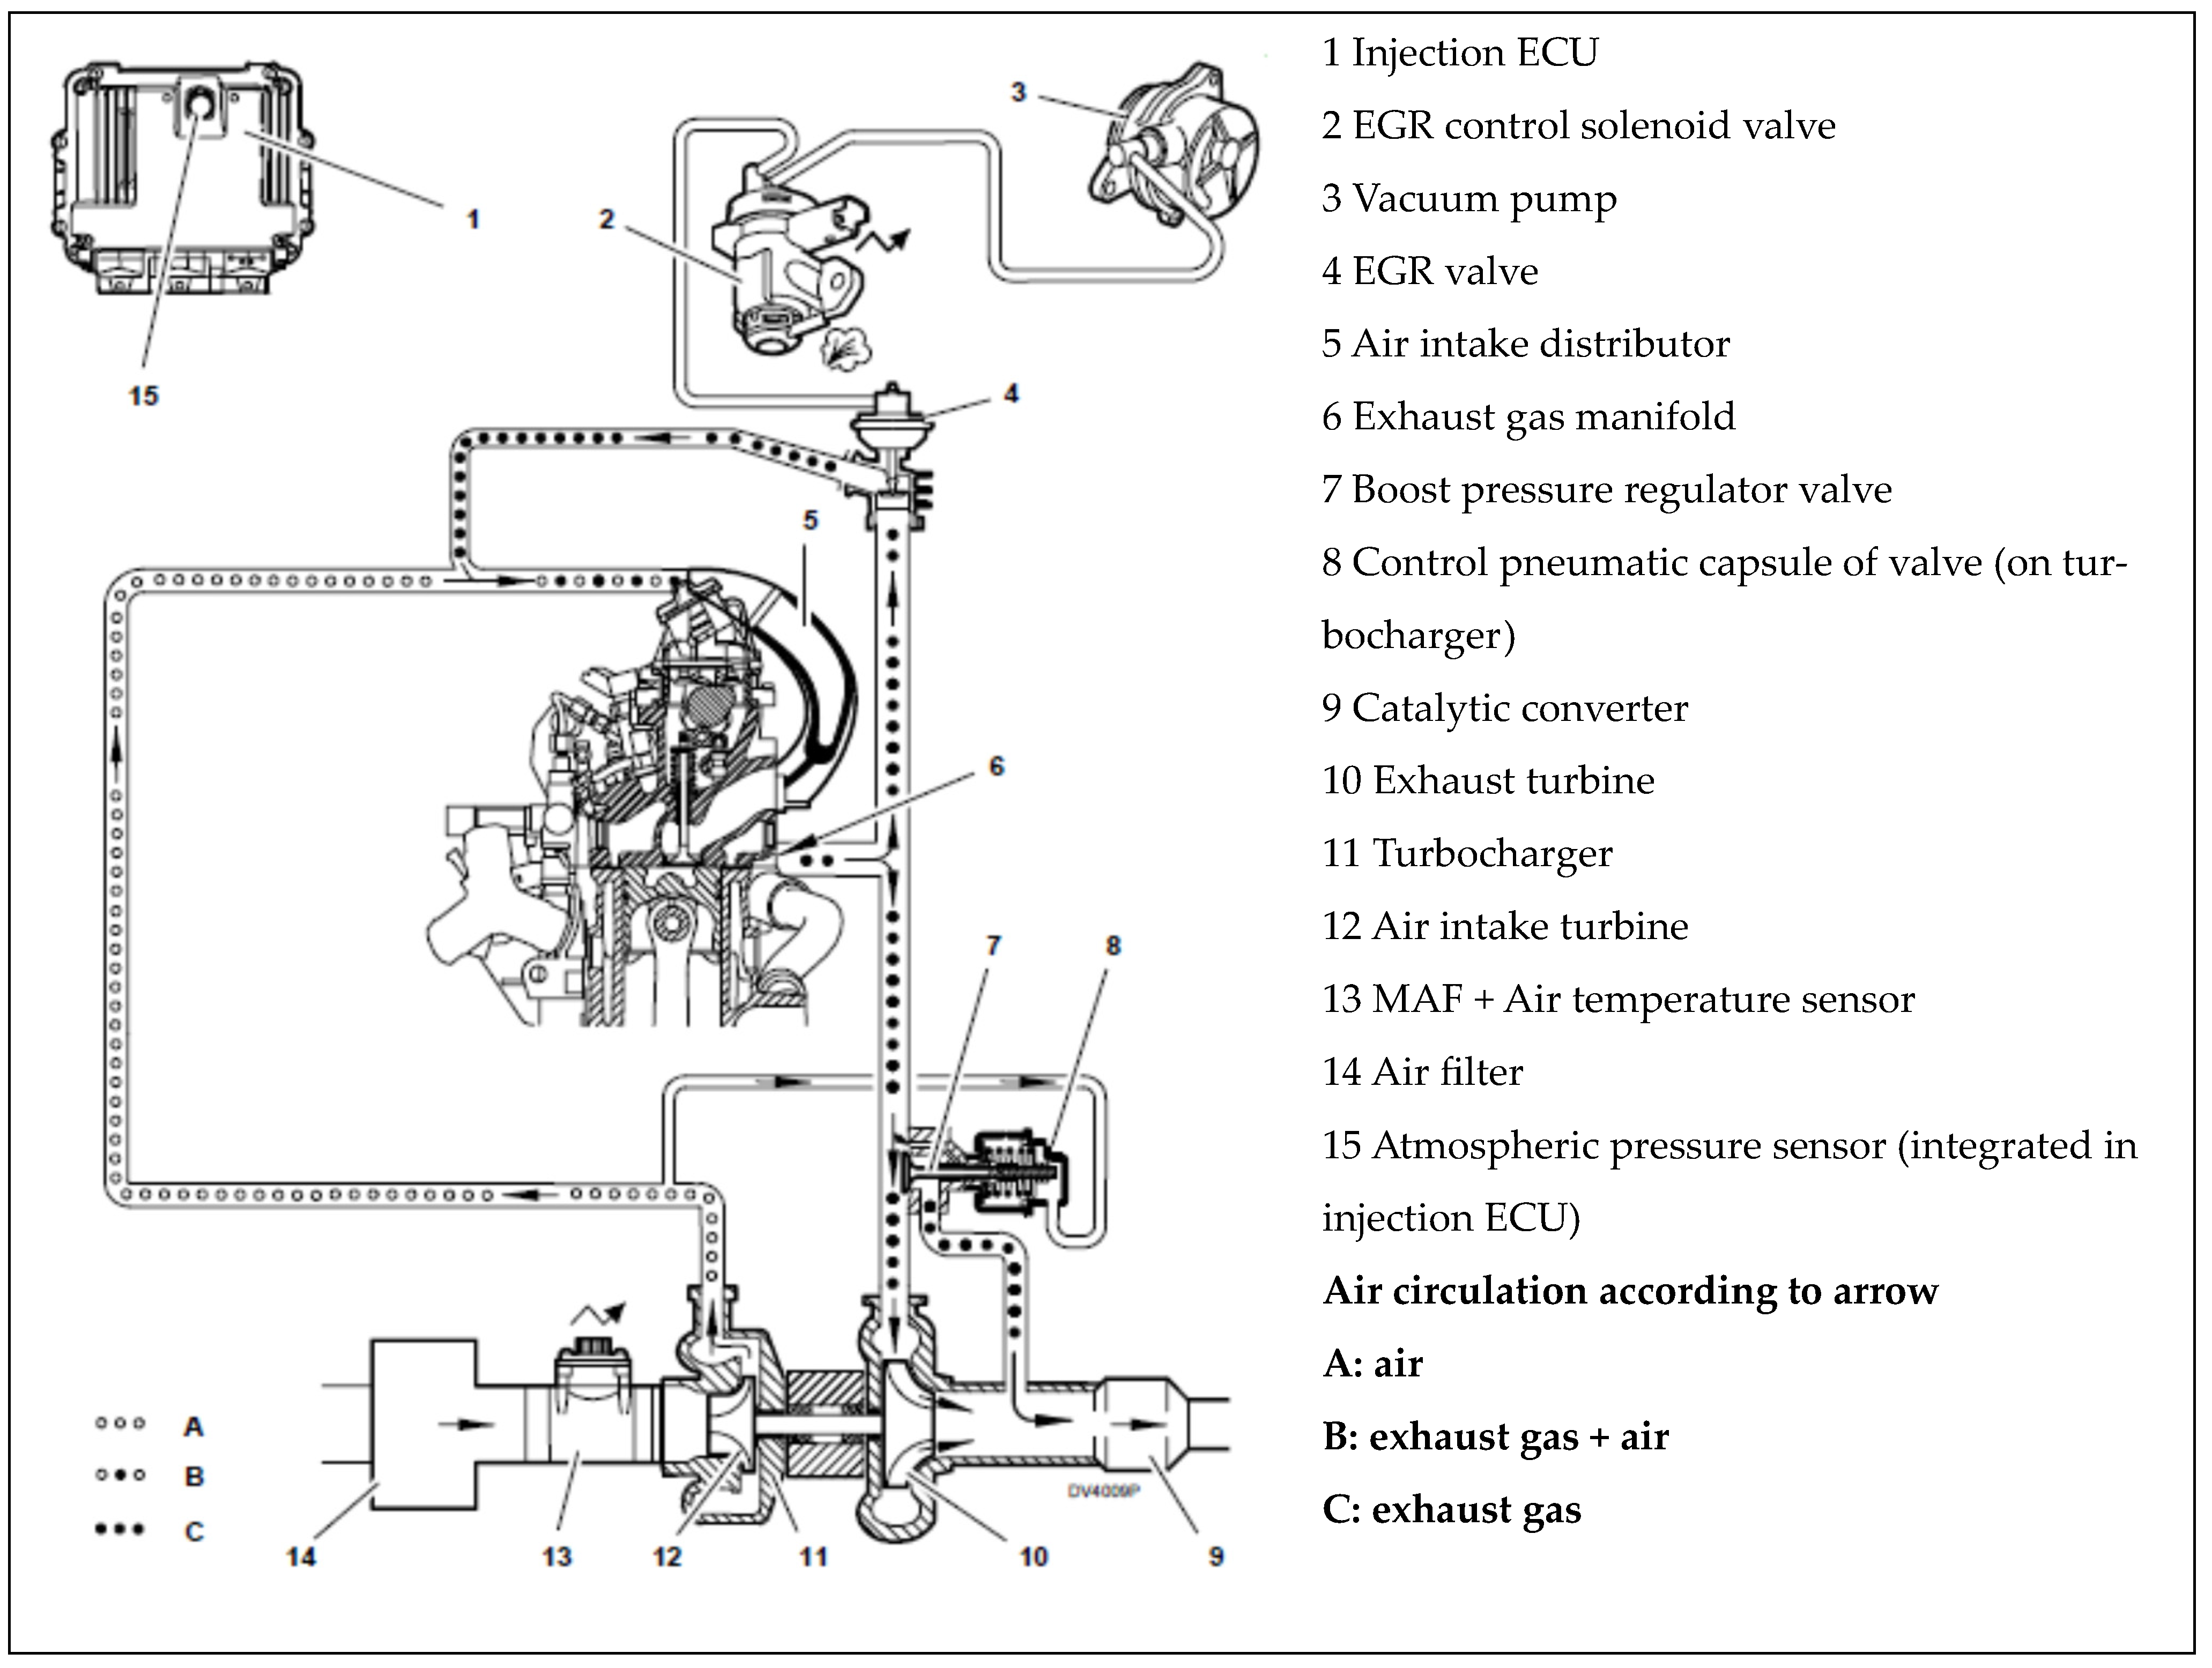
The MAF sensor is an important unit that helps to control and maximize the burning of diesel engines by sensing the quantity of incoming air with high accuracy entering the air intake system. The ECU uses this information to govern several parameters for maximizing engine efficiency and reducing pollutant emissions (Figure 2). First, the ECU regulates the exhaust gas recirculation (EGR) rate, a critical operation to reduce the emission of nitrogen oxide (NOx) according to the suggested data from the MAF sensor. Secondly, the ECU regulates fuel injection rate to restrict smoke generation, particularly when the engine runs under transient modes of acceleration and deceleration, in which sudden changes in load can destroy the air–fuel ratio.
Technically, the MAF sensor is located halfway between the turbocharger and the air filter. Two components are used: a heated metal film (hot film sensor) and an air temperature sensor (Figure 3). The metal film thin detects the mass of entering air by detecting changes in temperature induced by air flow. It is compensated in ambient temperature terms using the respective sensors to give an accurate reading for air mass flow rate [42].
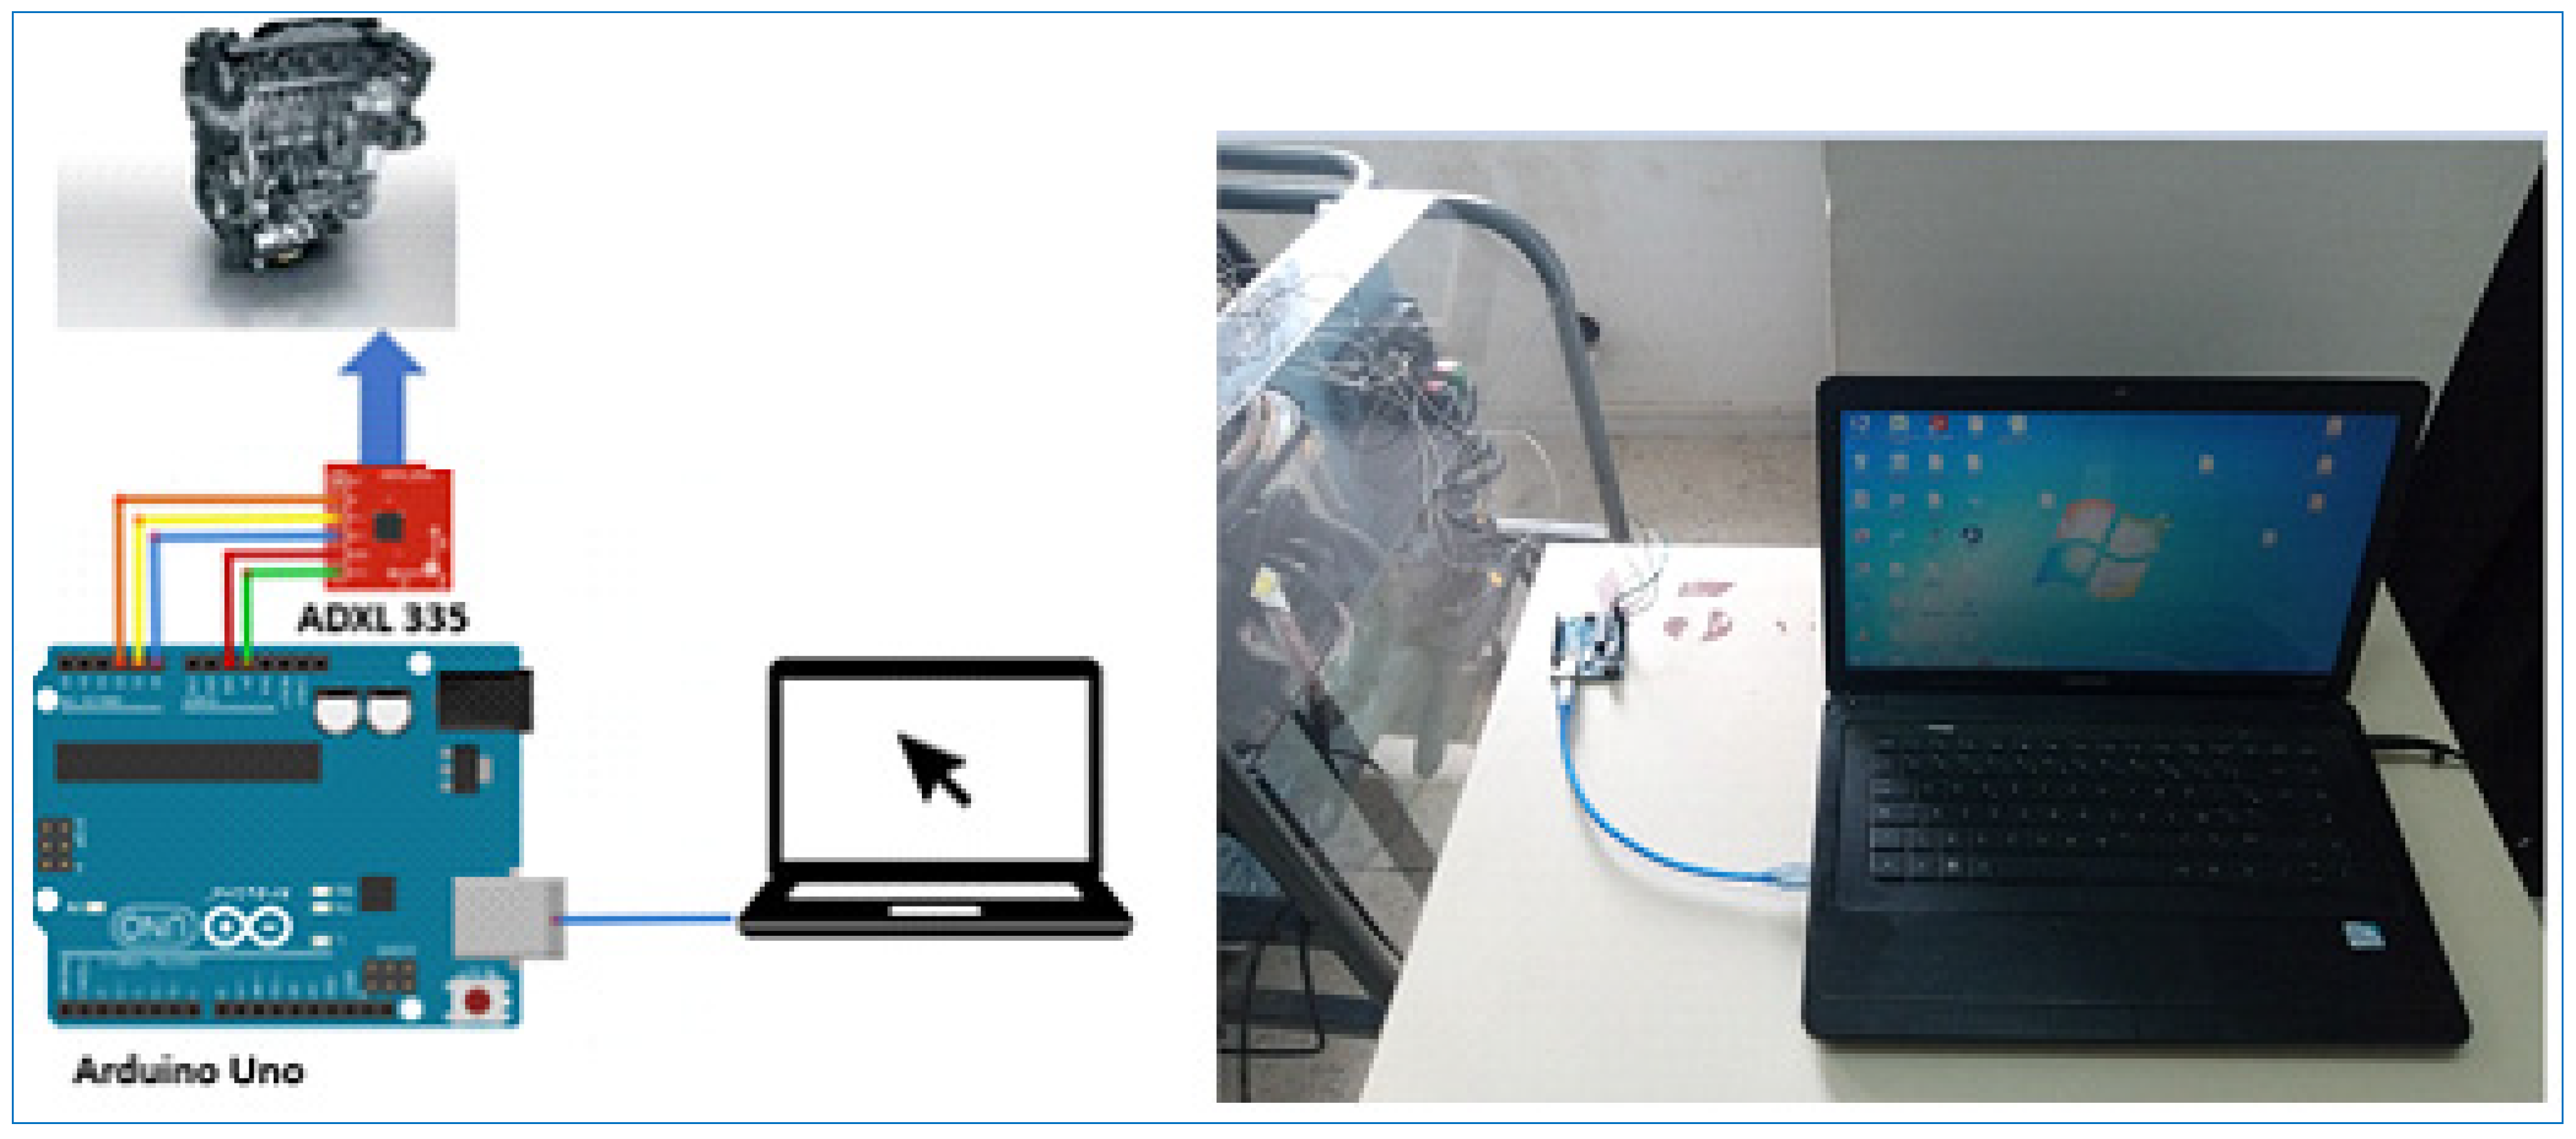
An accelerometer model ADXL335 was employed in obtaining various axes (X, Y, Z) measurements of engine vibrations. This device has dimensions of 36 × 18 mm and is a 3-axis MEMS (micro-electromechanical systems) accelerometer that provides signal-conditioned analog voltage outputs. This accelerometer has a full-scale range of ±3 g and will find static accelerations (gravity) as well as dynamic accelerations (e.g., motion, shock, or vibration). The accelerometer in Figure 4 was connected to an Arduino Uno board, programmable electronic board/devices, and an ATmega328 microcontroller capable of communicating with the sensor. Capacitive sensing of the accelerometer incorporates acceleration-induced deflections of micro-machined structures. The resulting capacitance change generates analog voltage outputs for the X, Y, and Z axes. The frequency bandwidth of the accelerometer was adjustable through external capacitors at the output pins and was 0.5 Hz–1600 Hz for the X and Y axes, and 0.5 Hz–550 Hz for the Z axis.
In this study, the accelerometer was mounted directly on the cylinder head of the diesel engine. This conforms to conventional techniques of vibration-based diagnostics of internal combustion engines, for which a point in proximity to the combustion chamber helps detection of vibrations developed due to compression pressure as well as activation of the valve mechanism. Both directly indicating combustion quality as well as timing, this point is especially well suited for detection of faults such as misfires or air–fuel mixture mal deviations commonly associated with mass air flow (MAF) sensor faults. Experimental investigations have revealed cylinder head-mounted sensors to have more correlation with in-cylinder pressure than sensors located elsewhere, due to a more accurate detection of combustion events [44,45].
Another parameter considered for signal reliability is the sensor attachment method. Rigid mounting using a high-grade adhesive or stud on a well-turned surface eliminates signal distortion and maintains accurate preservation of high-frequency vibrations. Improper mounting, on the other hand, produces damping effects or structural resonance, though if irregularly or weakly coupled with engine mass. In our setup, a tight mechanical coupling of the accelerometer was guaranteed with industrial adhesive fastening on a degreased flat cylinder head region. This guaranteed preservation of fidelity of signal in a wide range of frequencies [46].
Although our measurements were for cylinder head location alone, we acknowledge that an engine environment and configuration, like stiffening of transmission support, transmission conduction pathways of vibration, or thermal gradients, potentially can modify outcomes. Other researchers have demonstrated that a multi-sensor deployment at multiple sites, for example, on an engine block or on brackets, can distinguish combustion-associated vibrations from a mechanically related source such as a piston train or crank train [47,48,49]. Future applications of this research would thus potentially investigate multi-sensor deployment as a diagnostic sensitivity-enhancing tool as well as for guaranteeing a more comprehensive understanding of engine behavior.
Real-time time-domain vibration signals were recorded by mounting sensors onto the engine to acquire a time-variant vibration amplitude signature. Instantaneous data were recorded second by second at each trial for a time interval equalling 20 s to time average. Engine speeds of 750, 1500, 2250, and 3000 rpm were tested in healthy and faulty conditions.

2.2. Methods

In this study, we focus specifically on the failure of the mass air flow (MAF) sensor as a representative case to clearly demonstrate the effectiveness and practical relevance of vibration-based diagnostic methods. While multiple engine faults were initially explored, concentrating on the MAF sensor allows for a deeper analytical and experimental validation of the proposed approach. This targeted focus also highlights the key advantages of vibration-based monitoring, particularly in terms of early fault detection and non-intrusive diagnostics, when compared to traditional sensor-based techniques, and lays the foundation for combining this framework with machine learning models to diagnose other categories of faults in the future.
The proposed vibration-based diagnostic framework offers notable benefits over conventional methods, especially in its ability to identify subtle and incipient faults that typically go undetected by standard engine diagnostics. Traditional approaches rely on predefined sensor thresholds or ECU-generated fault codes; however, these often fail to capture progressive degradation or non-critical anomalies that do not trigger explicit alerts [50]. In contrast, vibration analysis has demonstrated a strong capacity to detect early signs of mechanical deterioration—such as bearing wear, injector inconsistencies, or minor imbalances—well before they evolve into critical failures [26]. For example, partial degradation of the MAF sensor can lead to minute alterations in engine vibration behavior, even in the absence of ECU fault indicators.
By applying advanced signal processing techniques, diagnostic accuracy can be significantly improved [5,51]. Moreover, intermittent electronic faults such as wiring noise, sensor voltage instability, or embedded software glitches—often elusive to ECU diagnostics—can manifest in the vibration signatures of the engine [52]. Due to its reduced reliance on physical sensors, lower cost, and compatibility with real-time monitoring, the vibration-based approach provides a scalable, efficient, and highly promising solution for modern diesel engine fault diagnosis and predictive maintenance [53]. Table 1 presents the differences between the proposed diagnosis method and conventional methods.
An extensive analysis of the vibration signals collected was achieved by applying temporal and frequency analysis techniques.
  • Temporal Analysis: An analysis was made in the time domain to observe how the vibrating amplitude varies with time, representing engine operating condition information in different states.
  • Frequency Analysis: Frequency spectral-domain analysis was employed for identification of characteristic frequencies associated with a particular engine component and fault. The short-time Fourier transform (STFT) was utilized as a non-stationary signal processing technique, giving a time-frequency view of vibration signals [18].
Applying these methods, this work attempted to focus attention on the principal contribution made by vibration analysis techniques like temporal and frequency spectral analysis towards combustion engine fault detection. Various statistical tests were applied for efficient fault diagnosis of engine faults during vibration signal analysis. The tests provide a view into the nature of the vibration data, enabling detection of fault-related anomalies concerned with engine malfunctioning.
Root Mean Square (RMS): One of the ways a variable quantity can be described is by using the RMS value which is easily applied to AC waveforms or signals. The RMS can be used to measure the energy level of a vibration signal and is well-suited to offer a gauge of its quantity. It can be determined by the following:
R M S = 1 N 1 N X i 2
X i : The vibration level measured.
N : Number of samples.
High RMS levels are a sign of increased vibration levels, which may be related to mechanical problems. Although other works have shown that the RMS method can detect diesel engine faults and is sensitive towards the variations of vibration amplitude [55].
Kurtosis (K): K is the measure of the “tailedness” of the probability distribution of a real-valued random variable. In vibration analysis, for instance, kurtosis gives an idea of whether the signal has peaks or is quite flat, which can be an indication of impulsive events like bearing defects and gear tooth faults. For non-Gaussian distributions of kurtosis, large values of kurtosis show maverick cases of rare extreme departures from normality, often as impulsive signatures from mechanical faults. It is defined as following:
k u r t o s i s = 1 N 1 N X i 4 R M S 4
Standard Deviation (SD): SD quantifies the degree of dispersion or variation in a set of values, indicating how much each data point deviates from the mean. High standard deviation in vibration analysis indicates high oscillation of the vibration signal, which is equivalent to abnormal operation of the engine. Standard deviation is one of the fundamental measurements in condition monitoring that reports on the stability of operation of the engine. It is calculated as follows:
S D = ( X i μ ) 2 N
X i : The value in the data distribution
N : Total number of observations
μ : The population mean
Clearance Factor (CF): CF is used to describe the ratio of the peak-to-peak amplitude of a signal (Xpp) to its root mean square (RMS). It is used to identify spikes or peaks in the signal that are usually associated with faults or abnormalities. The following formula is used to calculate the clearance factor:
C F = X p p R M S
Shape Factor ( S F ): SF defines the ratio of the root mean square (RMS) value of a signal with respect to the mean of its absolute value ( μ ). It is a measure of information in terms of the signal energy distribution as a function of signal magnitude. It is a signal shape function but not of signal size and gives a normalized measure of waveform shape and can be expressed as follows:
S F = R M S μ
By comparing these statistical values, the study aims to create a refined understanding of vibration modes under normal and fault conditions. This approach facilitates the identification of deviations from standard operational patterns, thereby enhancing the accuracy of fault detection in diesel engines. The results will highlight the correlation between MAF sensor faults and observed vibration patterns, providing insight into the broader implications for engine performance and operational stability.
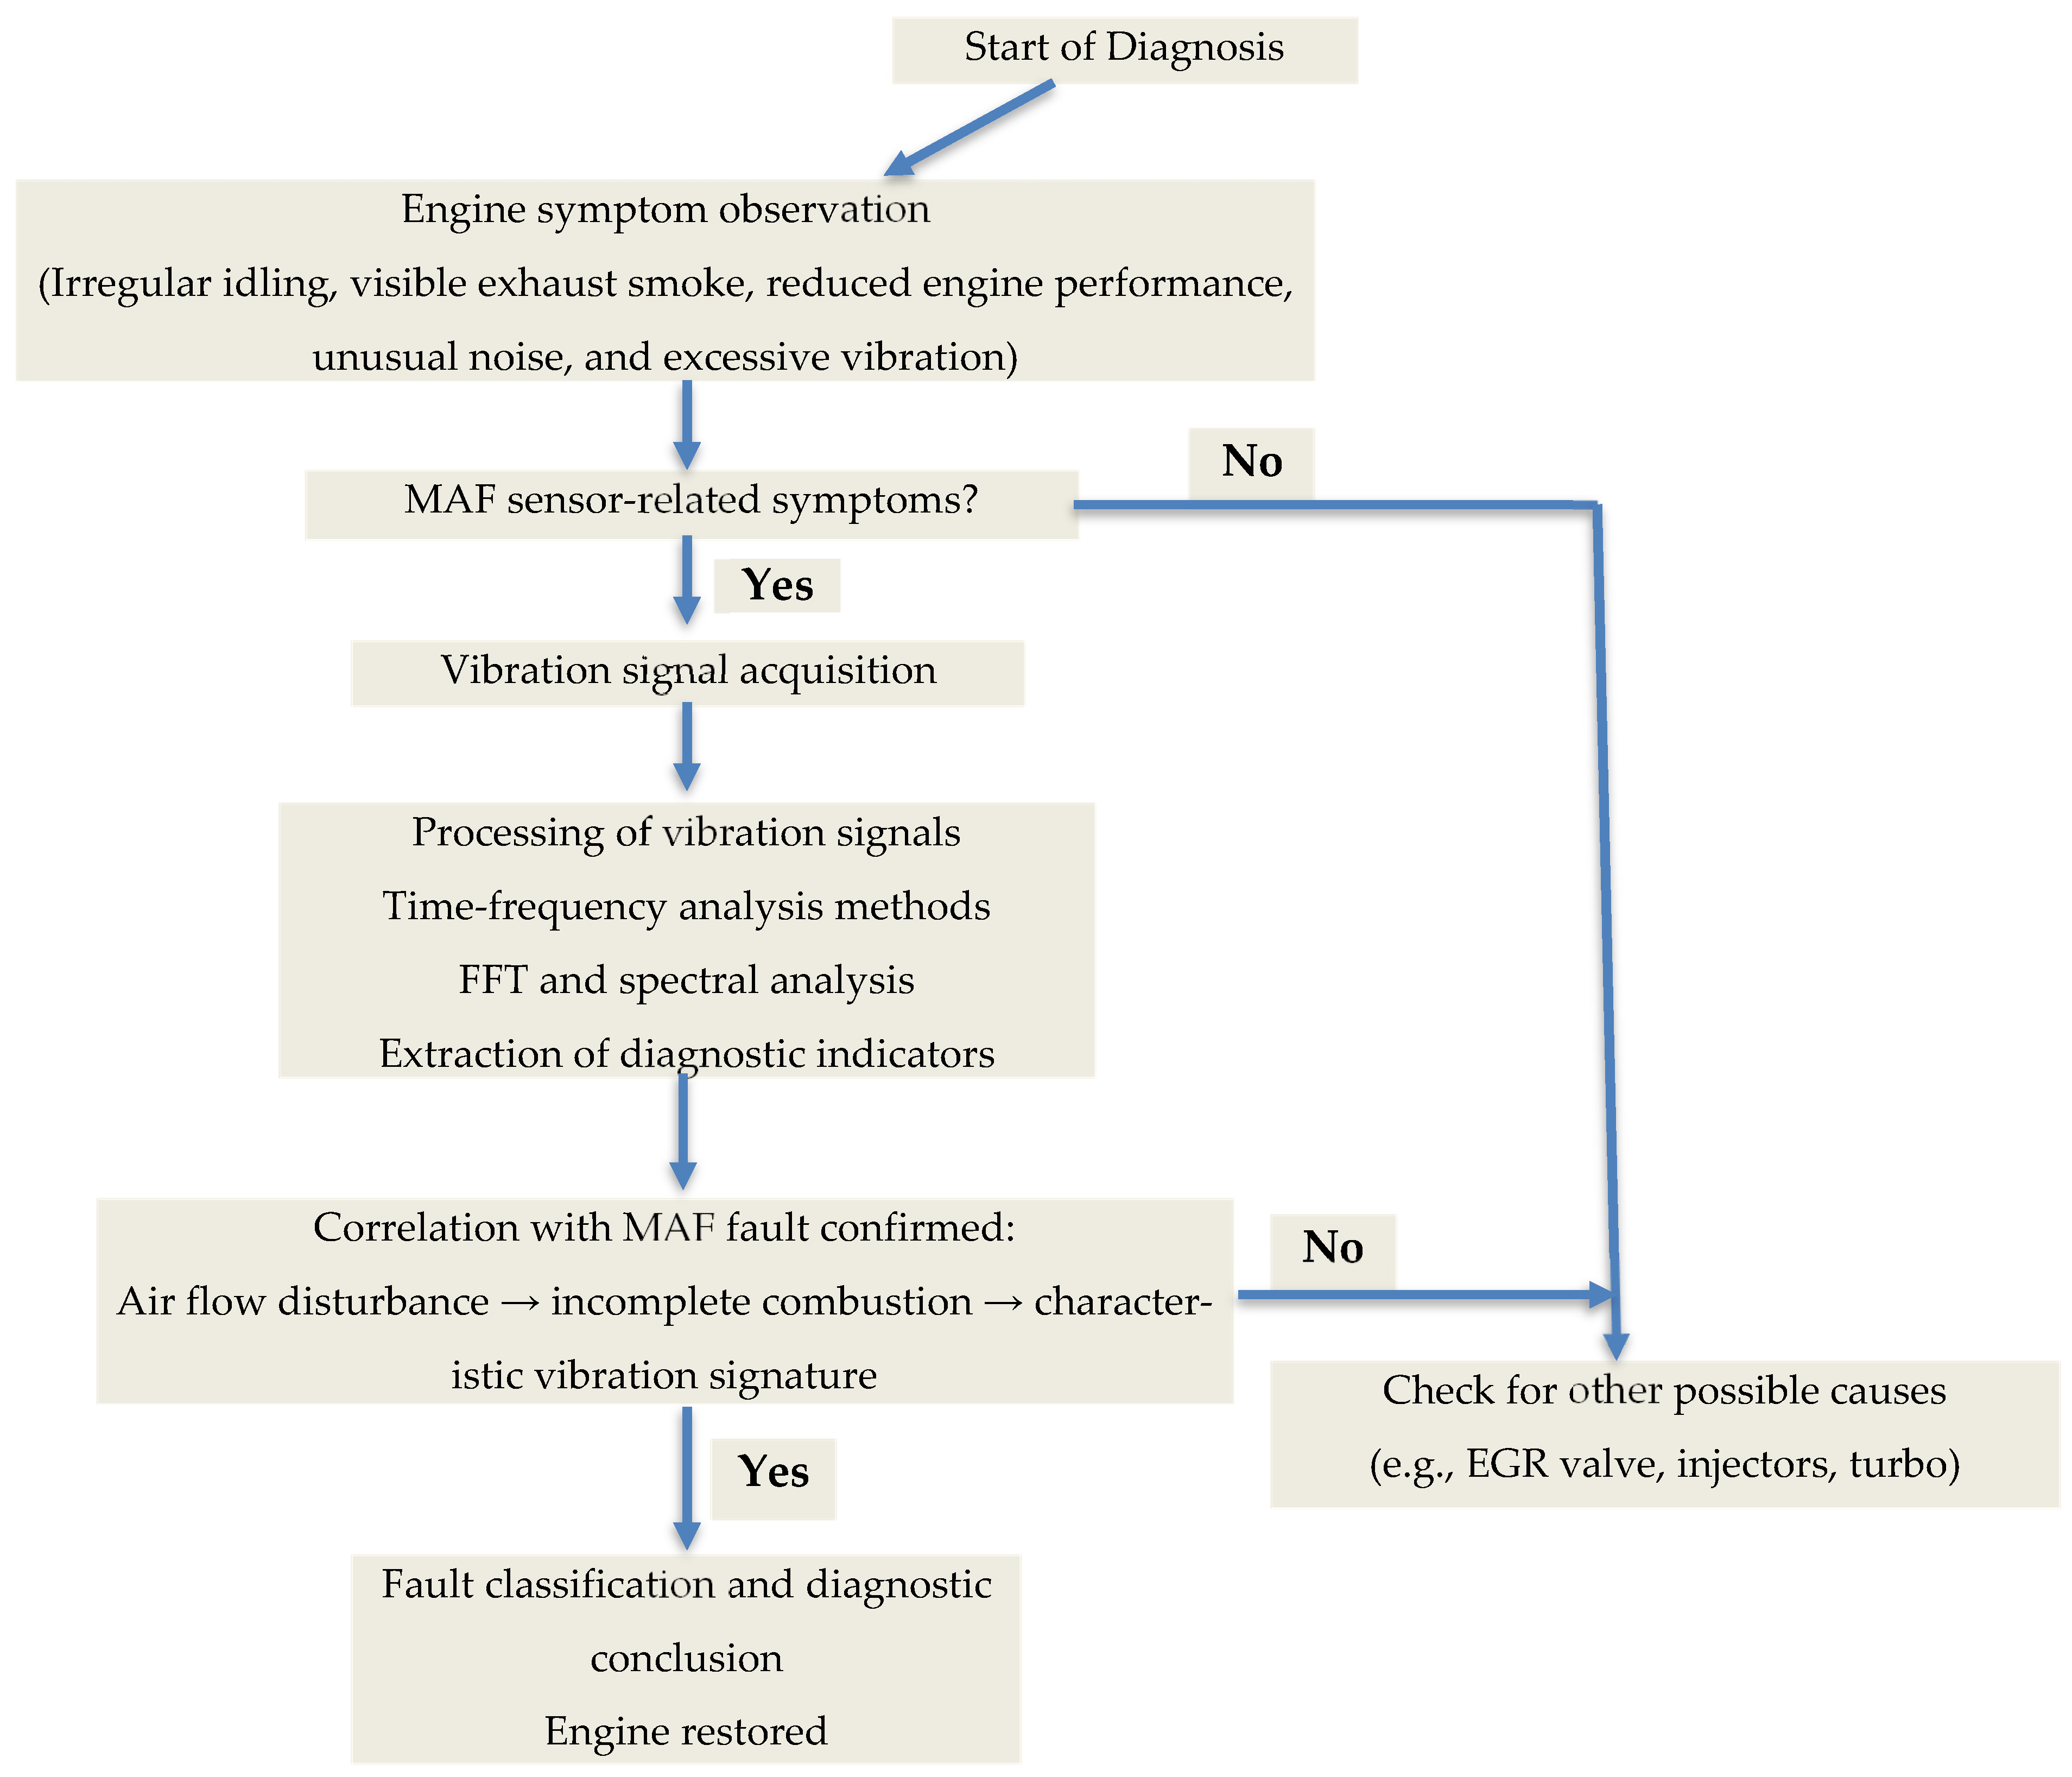
To improve the clarity of our proposed diagnostic method, we have included a flowchart (Figure 5) that outlines the step-by-step process used to detect faults related to the mass air flow (MAF) sensor through vibration analysis. The approach begins with a practical evaluation of engine behavior, looking for symptoms such as irregular idling, excessive smoke, reduced power, or unusual vibrations and noise. If these signs are consistent with a potential MAF issue, vibration signals are recorded using appropriately placed accelerometers under controlled engine conditions.
These vibration signals are then processed using time-frequency domain techniques, including FFT and spectral analysis, to extract diagnostic features. The goal is to identify patterns or anomalies that may point to a disruption in air flow, which in turn can cause incomplete combustion and generate a distinct vibration signature. If the analysis confirms this correlation, the fault is classified accordingly, and the diagnostic process concludes with a recommended intervention. If not, attention is shifted to other potential sources of malfunction, such as the EGR valve, turbocharger, or fuel injection system.
While this flowchart is tailored to MAF sensor issues, the same diagnostic logic can be adapted to a broader range of internal combustion engine faults using vibration analysis.

3. Results

3.1. Temporal Analysis

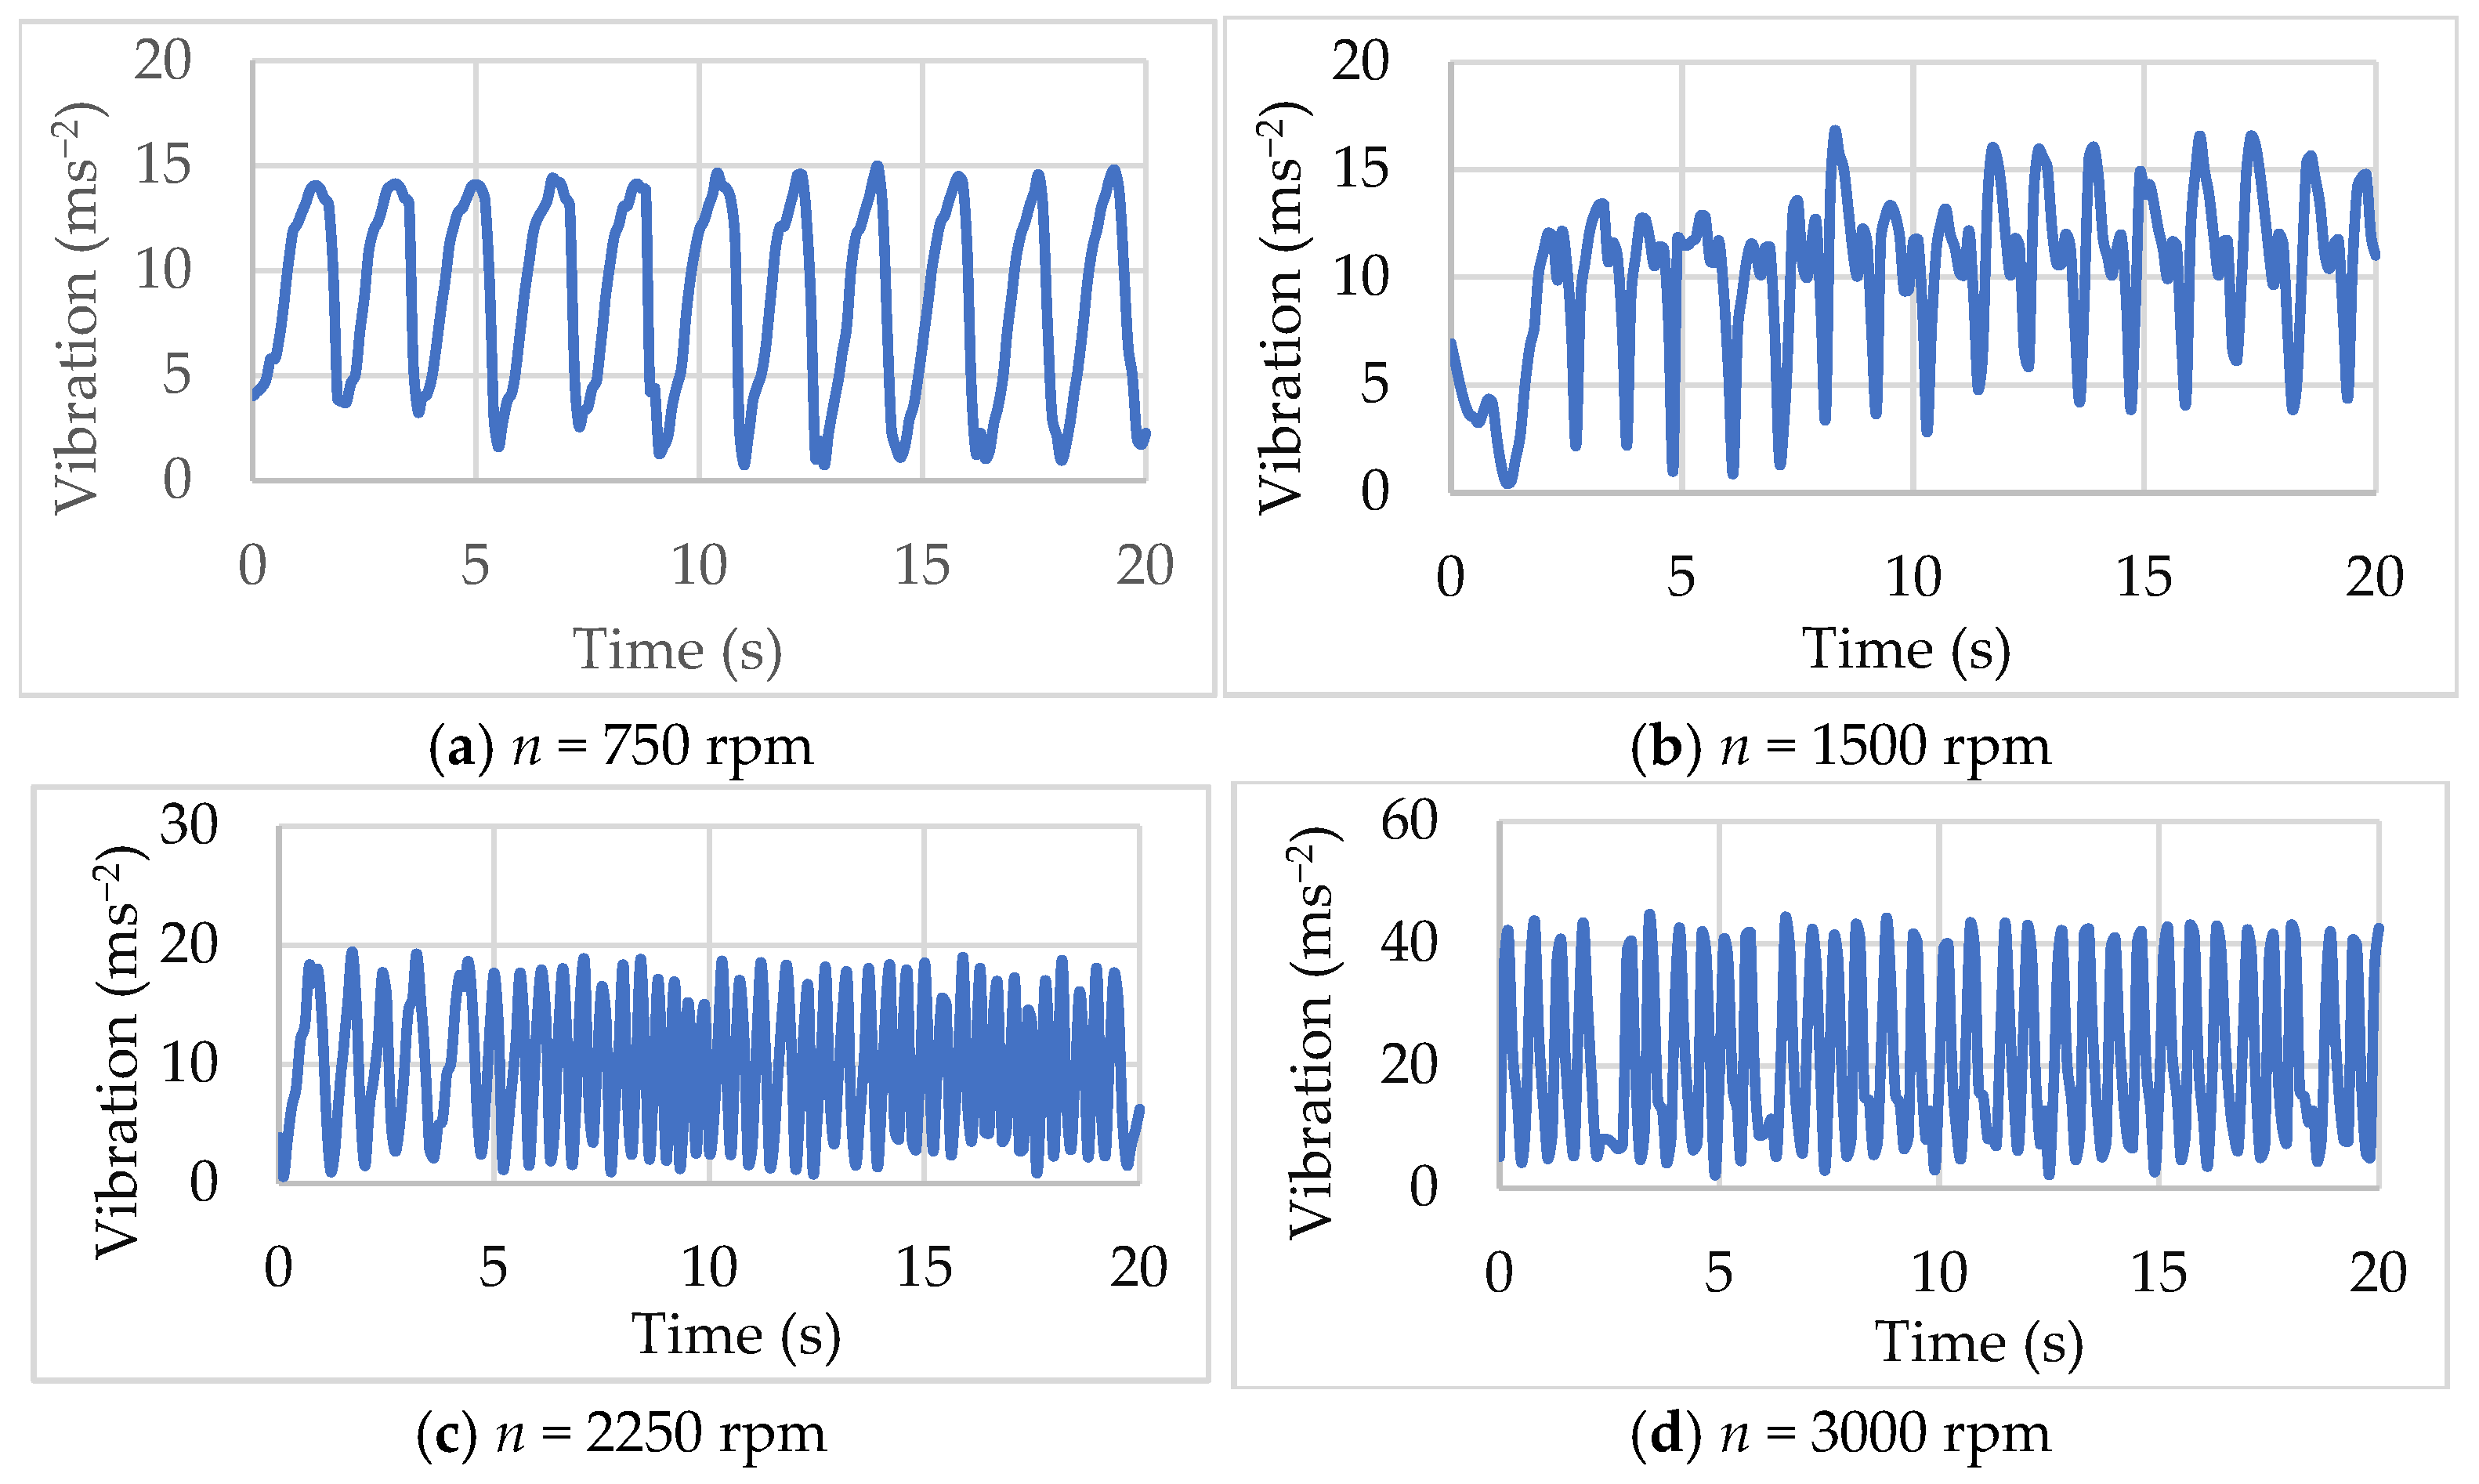
Figure 6 presents the vibration response of a motor under its normal working condition at various rotational speeds. Total vibration acceleration of 0.17 ms−2 to 14.95 ms−2 with mean and standard deviation of 8.67 ms−2 and 4.59 ms−2, respectively, are measured at 750 rpm (a). Raising the rotational speed to 1500 rpm (b) results in a change in overall vibration acceleration from 0.4 ms−2 to 16.79 ms−2, with an average of 10.17 ms−2 and a standard deviation of 3.8 ms−2. Likewise, at 2250 rpm (c), vibration variations are from 0.14 ms−2 to 19.46 ms−2, with an average of 9.7 ms−2 and a standard deviation of 5.7 ms−2. Finally, at 3000 rpm (d), the vibration acceleration amplitudes are between 0.80 ms−2 and 44.10 ms−2 with a mean and standard deviation of 21.35 ms−2 and 14.15 ms−2, respectively.
This is in line with typical engine performance, where vibration variability is well controlled at mid-speeds but shows expected increases at higher operation limits. All the measurements were within normal limits of performance, with normal system response throughout the whole range of speed.
Figure 7 illustrates the vibration characteristics of the engine affected by a faulty MAF sensor across various rotational speeds. The plot represents the frequency content of the vibration signals over time, with the x-axis indicating the measurement duration spanning 20 s. This time-frequency representation allows for a detailed analysis of how vibration frequencies evolve during engine operation under fault conditions.
At 750 rpm (a), vibration accelerations range from 4.09 ms−2 to 24.77 ms−2, with an average value of 10.9 ms−2 and a standard deviation of 6.04 ms−2. By raising the rotational speed to 1500 rpm (b), where the fault remains within the MAF sensor, the overall amplitude of the vibrations ranges from 0.9 ms−2 to 15.86 ms−2 with a mean value of 7.65 ms−2 and a standard deviation of 3.54 ms−2. Similarly, at 2250 rpm (c), there is measurement of engine vibration ranging from an overall vibration of 2.09 ms−2 to 14.27 ms−2, mean value of 7.98 ms−2, and standard deviation of 2.16 ms−2. Finally, at 3000 rpm (d), the vibration amplitude fluctuates excessively, ranging from 1.35 ms−2 to 21.4 ms−2 with mean values and standard deviation of 12.98 ms−2 and 4.19 ms−2, respectively, reflecting the influence of the fault on engine vibration at high speed.
  • Average
This section discusses the mean vibration amplitude resulting from an air flow sensor fault from experimental measurements at important engine speeds—750, 1500, 2250, and 3000 rpm, under normal and faulted operating conditions. In normal operation, vibration amplitude increases linearly with engine speed as expected due to the increase in combustion severity and inertial loads with engine components moving faster [51,56]. This trend is observed through the constant increase in Figure 8.
Fault cases yield a different response. For low engine speed of 750 rpm, there is a slight increase in vibration amplitude from the baseline. This may be due to the destabilizing effect of the faulty air flow sensor on the air–fuel mixture, resulting in incomplete combustion and increased cycle-to-cycle variation [57].
At higher engine speeds (1500 rpm and above), the average vibration amplitude is significantly smaller than in normal conditions. This reduction could be attributed to low volumetric efficiency and delayed combustion phases due to inaccurate air mass measurement, dissipating pressure peaks, and overall vibrational energy [58]. These comments highlight the observation that the influence of an air flow sensor fault is more pronounced when the rotational speed is greater. The vibrational response change highlights the diagnostic capability of vibration analysis, especially as it applies to supporting condition-based monitoring approaches towards early fault detection of automotive powertrains [59,60].
Figure 8 illustrates a non-linear correlation between mean vibration amplitude and rising engine speed. In the range of 750 rpm to 1500 rpm, an appreciable decrease in mean vibrations is observed. This reduction can be attributed to the low combustion conditions at this intermediate speed. Exactly, the quantity of air inducted during the intake phase is insufficient to ensure complete combustion, thereby causing lower combustion pressures and less intense excitations on the engine frame. This is consistent with findings in internal combustion engine studies in which low air-to-fuel ratios at mid-range speeds result in incomplete combustion as well as reduced mechanical excitation [51].
But when engine speed increases further from 1500 rpm to 3000 rpm, the mean vibration amplitude rises again. This could be due to higher turbulence and improved mixing of fuel and air at higher speeds and resulting in better and more complete combustion. These higher combustion pressures generate stronger cyclical forces that excite engine components more strongly and increase vibration levels. This is a testified correlation between burning effectiveness, speed, and vibratory behavior in vibration diagnostics and engine dynamics research [56,57].
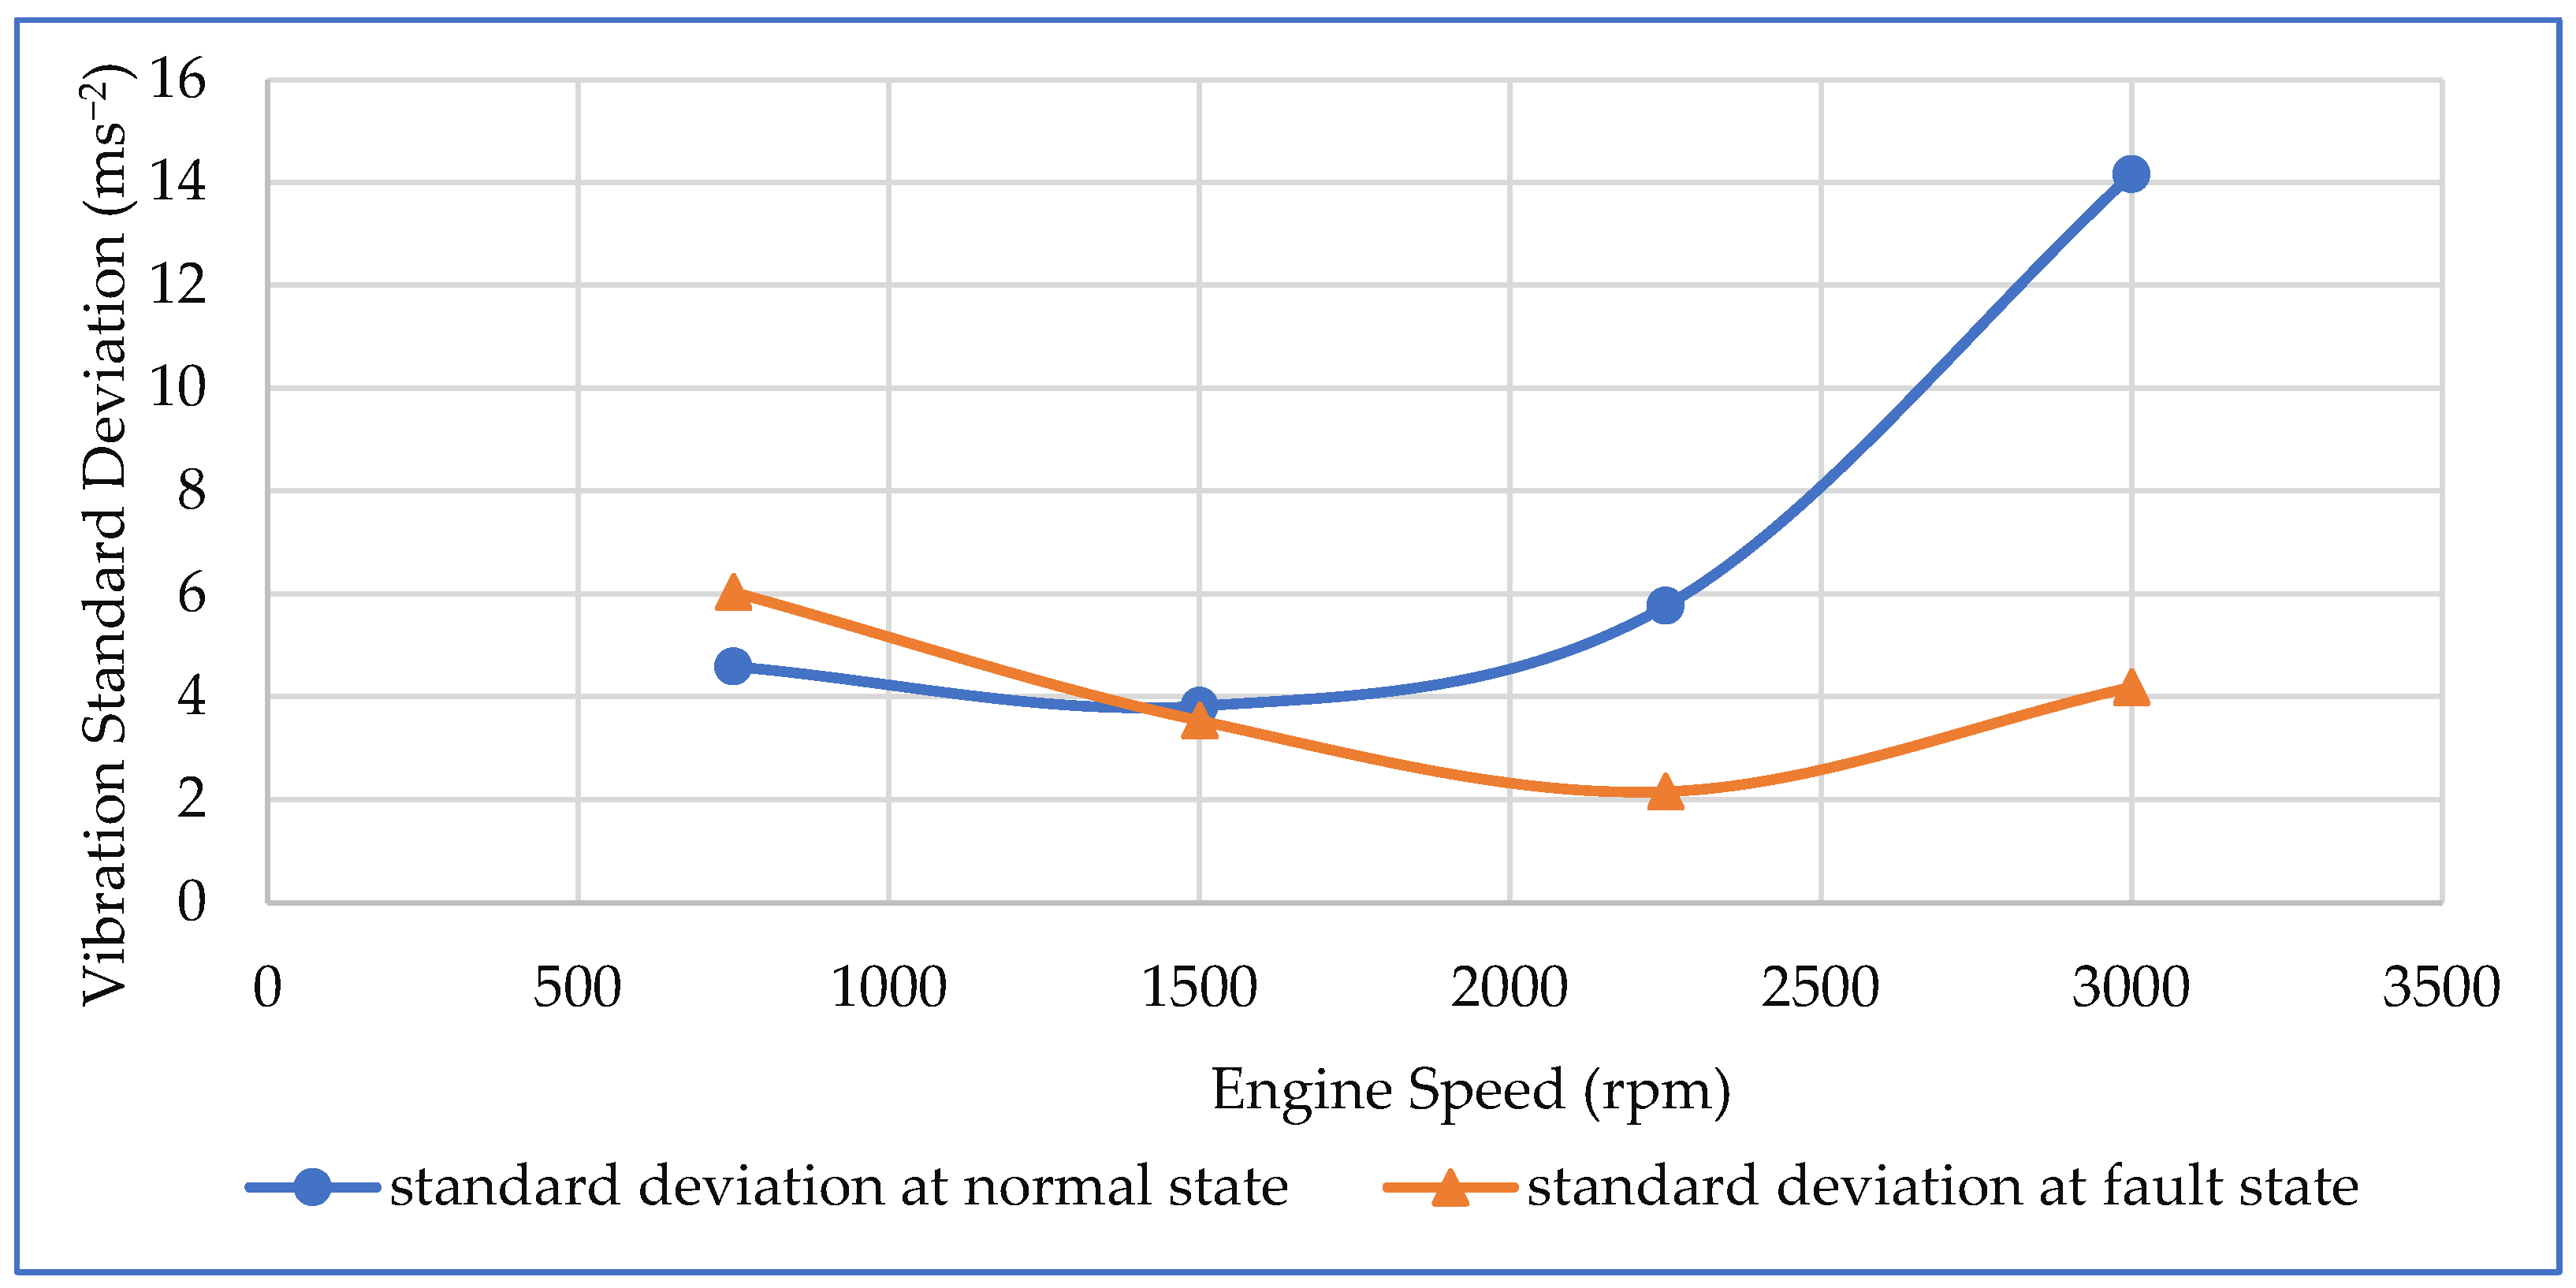
At the engine speed of 3000 rpm, the mean vibration amplitude is significantly higher, indicating an increased level of vibrational activity. This is largely due to the enhanced fuel demand at high-speed operation, which introduces more severe combustion-pressure oscillation and mechanical excitations, enhancing the vibration response accordingly. Further, the analysis of standard deviation of vibration signals at various engine speeds shows more dispersion and instability at 750 rpm and 3000 rpm. These are low-load idling and high-load conditions, respectively, where the engine is in a non-optimum dynamic balance mode, resulting in higher irregularity and variation in vibrational behavior.
  • Standard deviation
The standard deviation in normal conditions shows a significant increase with engine speed (Figure 9), reflecting more inconsistent vibration as speed increases. With things in a fault condition, the standard deviation remains very stable at all speeds with a rise at 3000 rpm. Under lower speeds (750 rpm), fault condition registers greater standard deviation values, yet with higher speeds (1500, 2250, and 3000 rpm), variation in normal conditions is far greater. The findings demonstrate that the fault reduces vibration variation at high speeds, confirming the utility of monitoring standard deviation trends to identify performance anomalies and assess fault influence.
The analysis of average vibration amplitude and standard deviation under normal and fault conditions of the mass air flow sensor gives useful information about engine performance. The findings indicate that while average vibration amplitude increases with engine speed under normal conditions, air flow sensor faults led to higher vibration at lower speeds but reduced vibration at higher speeds. This highlights the importance of vibration analysis as a diagnostic tool for identifying faults and planning maintenance strategies.
Additionally, the standard deviation analysis identifies that the normal state exhibits greater variability in vibration with increasing speeds, whereas the faulty state stabilizes this variability. Monitoring these trends is essential to the detection of performance anomalies and the establishment of the impact of sensor faults on engine performance, ultimately in supporting condition-based maintenance.
  • RMS
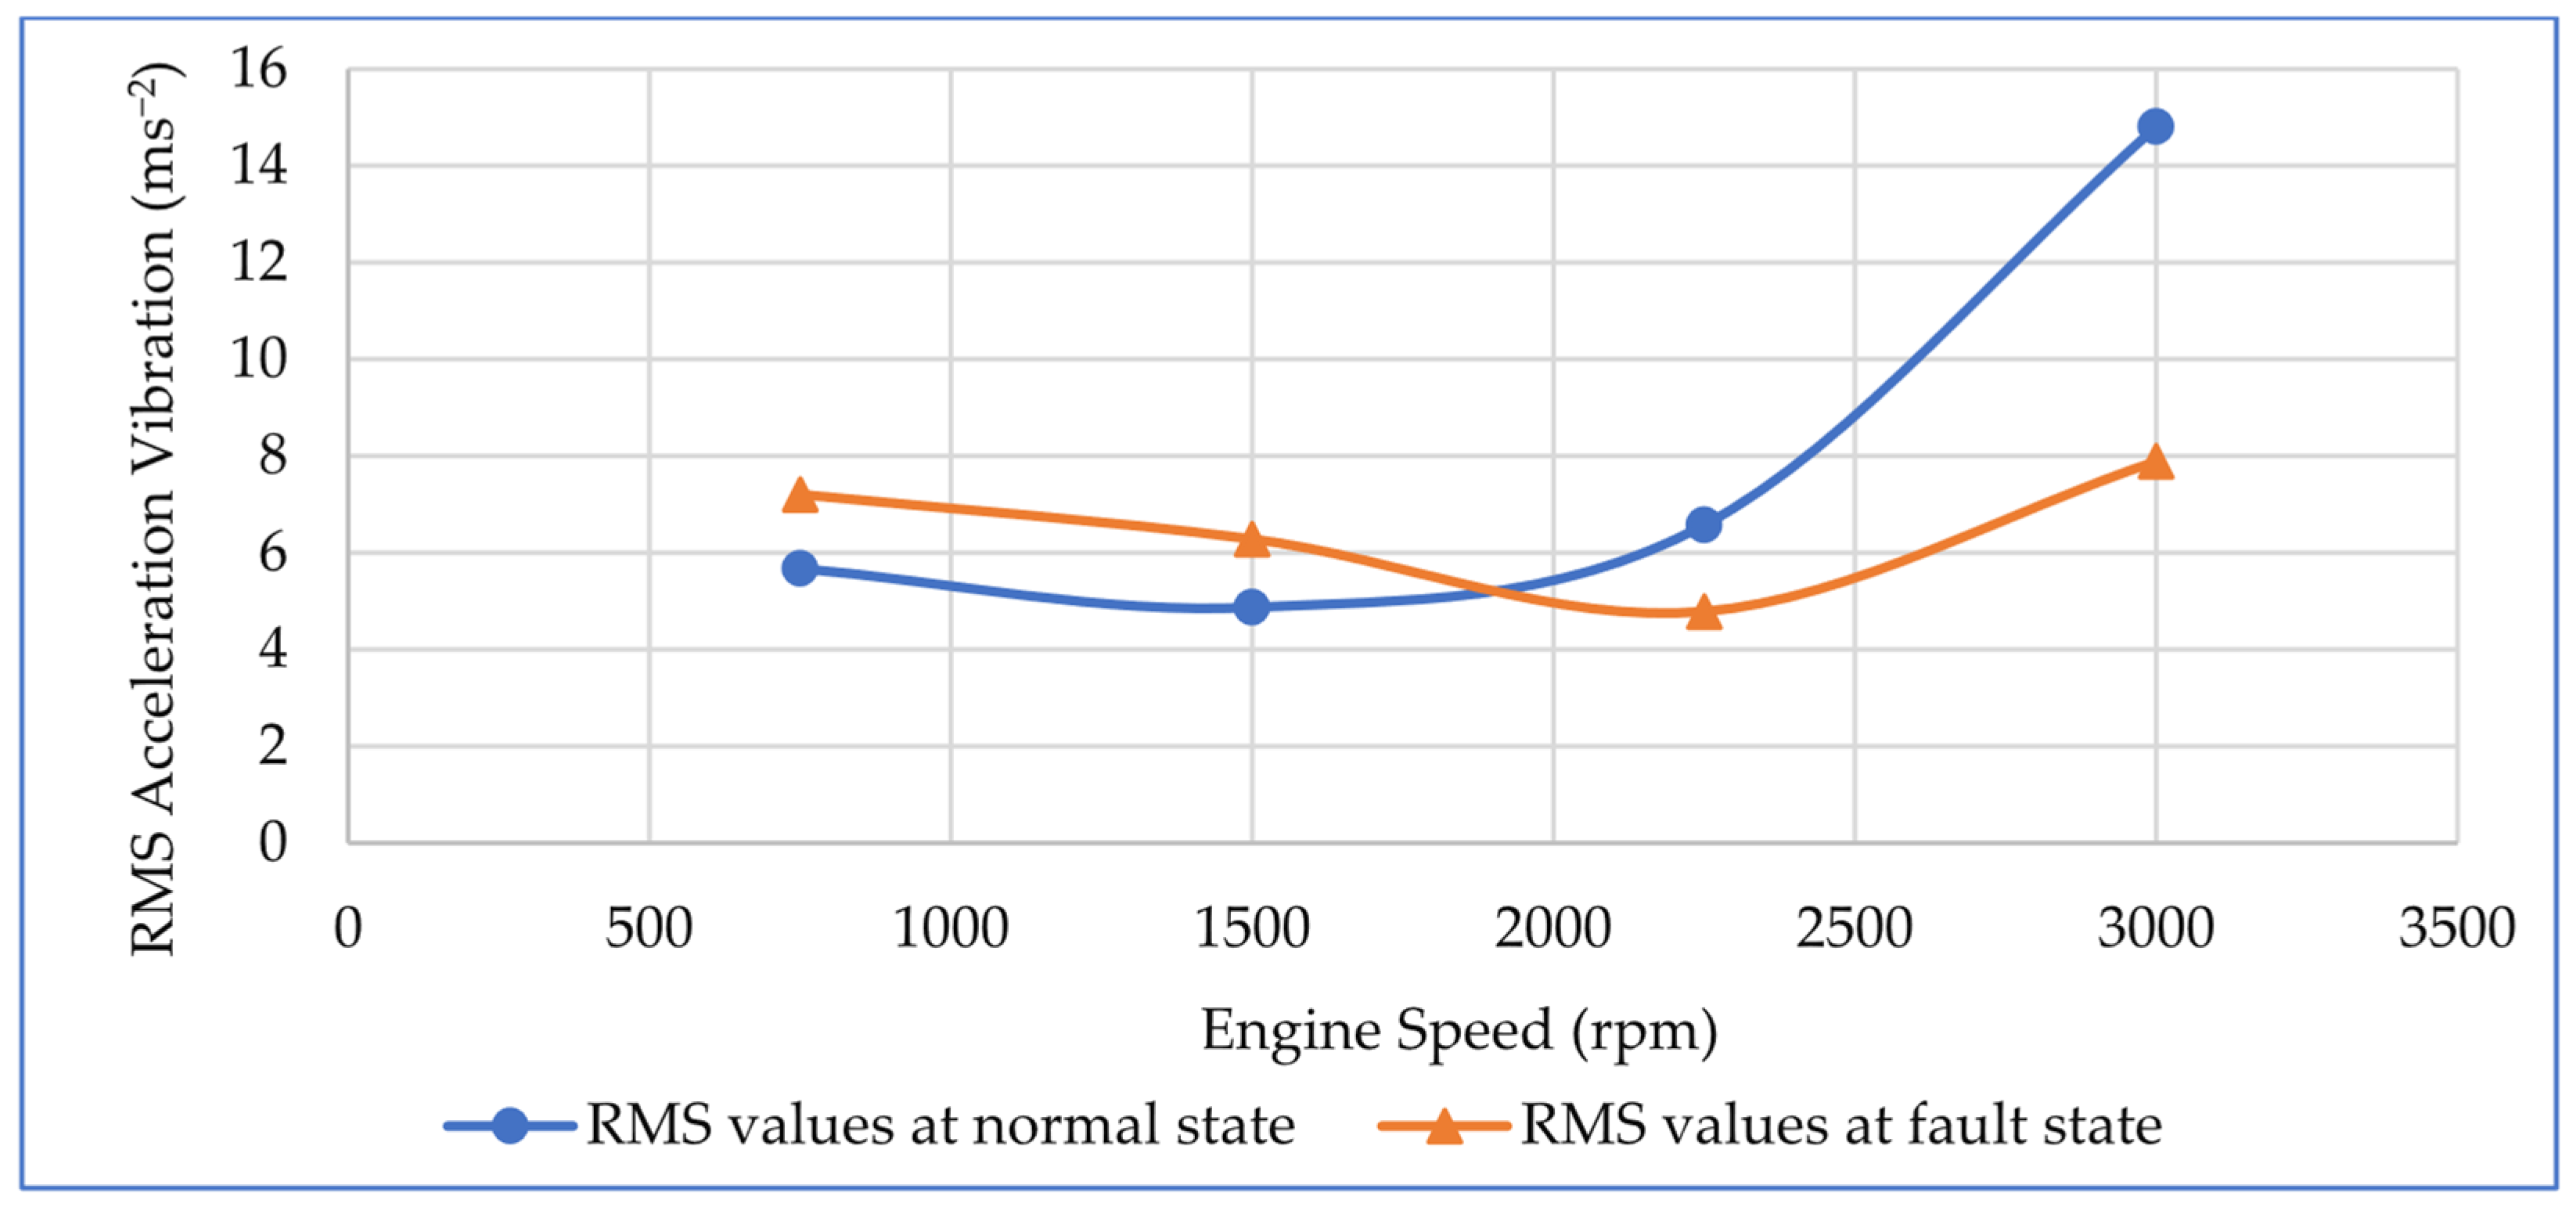
Figure 10 shows the RMS signal values for the various speeds at both functional conditions. At 750 rpm and 1500 rpm, in the case of a fault, the effective values are greater than in normal conditions, i.e., the engine vibrates slightly more at the two speeds when this type of fault exists. This increased vibration is because at these two speeds, the engine draws less fuel with a heavy load and incomplete combustion in all four cylinders, owing to the low volume of air drawn during intake. Thus, the engine struggles at these two speeds, vibrates more than usual, and tends to stall and stop.
A decrease in the effective value compared to the normal state has been observed at 2250 rpm and will be even greater in amplitude at 3000 rpm. Hence, the engine vibrates less at these two speeds when the air intake system is faulty because the engine control unit (ECU) requires more fuel but with a lower volume of air compared to the normal state. At these speeds, then, incomplete combustion of the air–fuel mixture causes lower engine performance compared to the normal state.
  • Kurtosis
Figure 11 illustrates the variation of the kurtosis indicator versus engine rotation speed in the two conditions of with and without an air flow meter fault. The impacts on the signals in the case of a fault are more than in normal operation at 750 rpm and 1500 rpm. This is because piston knocking in the case of a fault is larger than in the normal state. But at 2250 rpm and 3000 rpm, kurtosis values in the fault are less than in normal conditions, which indicates that the number of impacts in the signals in these speeds is less than in normal operation.
Positive kurtosis implies that the distribution has a higher concentration of values near its mean, with heavier tails than a normal distribution. This shows that the distribution is more “peaked” or “pointed” compared to a normal distribution.
The paper highlights the necessity of monitoring engine parameters to diagnose engine intake system air flow sensor, the necessity of detecting and identifying air leaks and false information quickly to avoid excessive emissions, fuel consumption, driving problems, and potential engine component damage.
  • Clearance Factor
The clearance factor shows (Figure 12) the obvious distinction between normal and faulty conditions of the mass air flow (MAF) sensor over engine speeds. Under normal conditions, the clearance factor steadily increases with speed, starting at around 2.5 at 750 rpm and reaching around 2.83 at 3000 rpm, indicating an augmenting ratio of peak-to-RMS vibration signals. This rise reflects the engine’s greater ability to handle air flow variations for effective combustion and stable operation at elevated speeds. In contrast, in the fault condition, the clearance factor peaks at 1500 rpm (~3) prior to dropping and plateauing at 2.5 after 2250 and 3000 rpm. The drop reflects reduced signal variability and responsiveness caused by the sensor’s inability to validly measure air flow, leading to ineffective combustion and impaired engine performance. The widening difference between normal and fault conditions at intermediaries’ speeds indicates the clearance factor’s prospects as a diagnostic metric for determining MAF sensor condition and engine performance.
  • Shape Factor
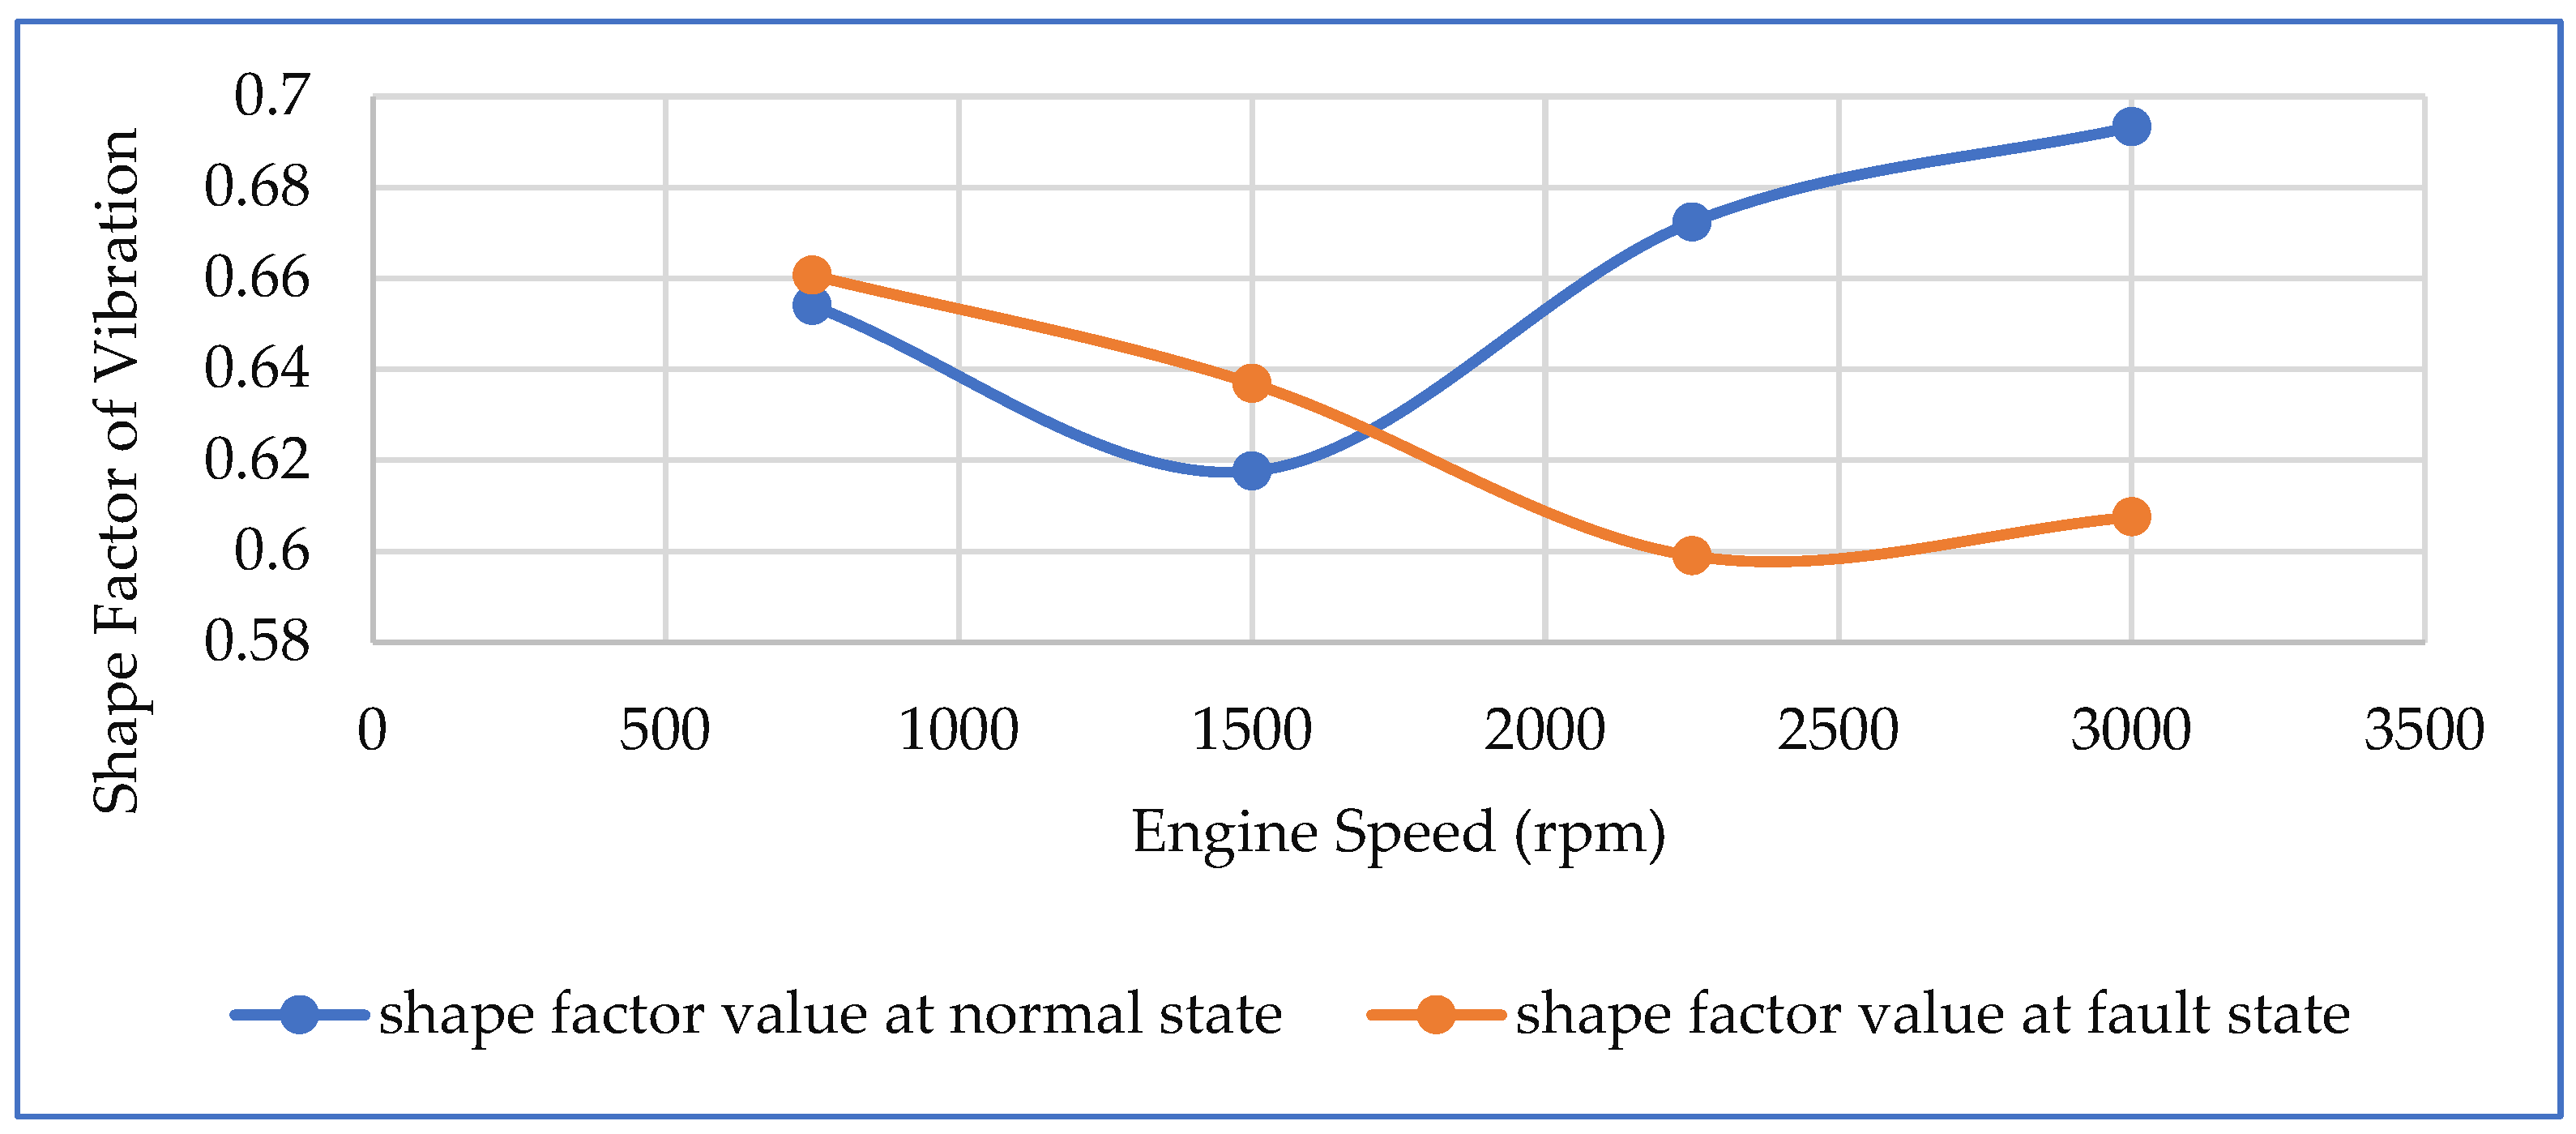
The shape factor fluctuation shows the dynamic response of engine vibration signals to speed change under normal and faulty mass air flow (MAF) sensor conditions (Figure 13). In the case of normal conditions, the shape factor is at its maximum at 2250 and 3000 rpm, denoting efficient engine operation with a well-distributed energy profile, especially since the MAF sensor senses air flow properly for ideal combustion. Conversely, under fault conditions, the shape factor is always smaller, reflecting reduced signal variability due to the failure of the sensor to properly measure air flow, leading to poor engine combustion and inefficiency.
The distinction reflects the sensitivity of the shape factor to operating changes and its utility as a diagnostic tool for MAF sensor fault detection and engine performance determination.
The findings of our analysis yield valuable conclusions regarding the effects of MAF sensor faults on the performance of the engine. As will be discussed, these results are explained with respect to existing literature, noting the practical considerations for maintenance policy in the automotive industry and suggesting directions for future research.

3.2. Temporal Indicators Evolution

A faulty mass Air Flow sensor can significantly disrupt the diesel engine cycle, which includes intake, compression, power, and exhaust stages. The MAF sensor measures the air entering the engine and sends this data to the engine control module (ECM). If the sensor is faulty, it can cause an incorrect air–fuel mixture, leading to rough idling, poor fuel economy, slow acceleration, engine stalling, and triggering the check engine light. These issues affect the engine’s performance and efficiency, making it essential to diagnose and repair a faulty MAF sensor promptly.
Table 2 shows the vibration signature of a diesel engine with an air flow meter fault. The presence of a fault in the air flow meter leads to noticeable changes in the vibration signature of the diesel engine, as quantified by several statistical parameters: root mean square (RMS), kurtosis (K), peak value, mean (Av), shape factor (SF), clearance factor (CF), and standard deviation (SD). The relative error (RE %) is defined as follows:
RE   ( % )   =   F C _ V a l u e N C _ V a l u e N C _ V a l u e 100
where FC is the value under fault condition and NC under normal condition, enabling the quantification of deviations caused by the fault.
RMS values were significantly higher with RE % values of 27.01% at 750 rpm and 46.72% at 3000 rpm due to increased vibrational energy from unstable combustion events. These increases show the influence of abnormal pressure oscillations in the combustion chamber and non-equilibrium forces imparted to the engine structure. The effect is particularly significant at high speeds, in which high-order cyclic combustion anomalies excite higher-order harmonic vibrations of rotating parts such as the crankshaft and camshaft. The reaction is a continuation of research [58], whose vibration signals during occurrences of valve clearance faults showed higher RMS values that are indications of increasing energy fluctuations due to defects of a mechanical nature.
Kurtosis (K) was significantly greater during fault conditions at 27.77% and 35.43% at 750 rpm and 3000 rpm, respectively. This is because there is an increased percentage of impulsive components in the signal caused by misfire or late combustion phases, producing sharp acoustical bursts. Transients are also generated by faulty valve motion or impacts in the timing system (chain or cam-lobe contacts).
Peak, which represents the maximum values of signal vibration, showed the largest relative change: 65.64% at 750 rpm and 51.47% at 3000 rpm. They are characteristic of extreme dynamic responses, which are likely generated by combustion pressure surges and mechanical backlash. Slow cycle at low speed permits more exaggerated pressure build-up, and high speed suffers from inertial effects amplifying vibration peaks owing to the crank-slider mechanism and valve-train.
Standard deviation (SD) registered considerable increases, at 31.56% at 750 rpm and up to 70.38% at 3000 rpm. This secondary fluctuation is an indication of unsymmetrical combustion and mechanical vibration of greater frequency, which has a greater tendency to excite higher frequencies. It directly affects reciprocating parts such as pistons and connecting rods, whose movement relies on combustion symmetry and timing.
The average (Av) was increased by 25.72% at 750 rpm and 39.20% at 3000 rpm with repeated rises in vibration level. It represents persistent loading of the engine structure, particularly at the cylinder head and crankcase, by faulty combustion and torque fluctuation.
Shape factor (SF) and clearance factor (CF) are less variable. SF exhibits a maximum RE % of 12.36% at 3000 rpm and CF exhibits a maximum of 17.34% at 1500 rpm. This minimal variability of waveform structure reflects nugatory change in the mechanical response but is less compromised than under RMS or kurtosis. But such variables also assist in bringing about a multidimensional diagnosis strategy [59,60].
According to Table 2, standard deviation (SD) and peak value are the most responsive to a faulty MAF sensor, with maximum relative error (RE %) of around 70.4% and 65.6%, respectively. These large changes are indicative of erratic combustion and high-frequency mechanical oscillations brought about by imbalanced air–fuel mixtures. Next are RMS and kurtosis (K) with RE % of about 27% to 46.7% for RMS, and up to 35.4% for kurtosis, suggesting rises in overall vibrational energy and impulsive signal components like misfires or timing errors. Mean (Av) is moderately sensitive (~39.2% RE) and likely reflects sustained torque fluctuations under faulty conditions. Shape factor (SF) and clearance factor (CF), however, show minimal deviation (≤12.4% and ~17.3% RE) and are thus less useful as stand-alone diagnostics but may still prove useful as complementary metrics for a multivariate diagnostic approach. In general, the features can be ranked in order of reducing diagnostic sensitivity as follows:
SD > Peak > RMS > Kurtosis > Mean > Clearance Factor > Shape Factor.
This ordering is consistent with general results in vibration-based fault detection research, wherein dispersion and amplitude-based measures (e.g., SD, Peak, RMS) tend to outperform higher-order shape statistics in the detection of equipment faults. For example, when analyzing time-domain vibrations, peak and RMS features tend to be the strongest indicators of dynamic faults, whereas kurtosis is effective at picking up impulsive events [1,61,62,63,64,65]. Our findings are in line with these tendencies and partly explain why these measures differ across the various engine speeds—higher RPMs amplify high-frequency harmonics and impulse-like behavior that disproportionately increase SD and peak values

3.3. Frequency (Spectral) Analysis

Frequency analysis is the strongest vibration signal decomposition method that breaks down the signals into their frequency components and thus allowing pattern and anomaly detection in machines. Applications of spectral analysis are illustrated below with specific emphasis placed on the fast Fourier transform (FFT), a very useful tool for determining dominant frequencies for normal or failed operating conditions.
Table 3 is a frequency correlation of the major engine components at four engine speeds (750, 1500, 2250, and 3000 rpm) that can be used for spectral vibration result analysis. Each component has characteristic frequencies because of rotating or actuating action, i.e., crankshaft (direct engine speed), camshaft (half engine speed), and injectors or valves (equal to combustion cycles). This map is required to identify which of the spectral peaks are representative of individual mechanical sources under normal operating conditions.
Under fault conditions, a MAF (mass air flow) sensor fault, frequencies will very often have increased amplitudes or altered harmonic content because of irregular combustion or imbalance forces. Therefore, the correlation of measured spectral components with values determined in this table allows one to distinguish between normal and faulty operating conditions and trace the source of vibrational faults.
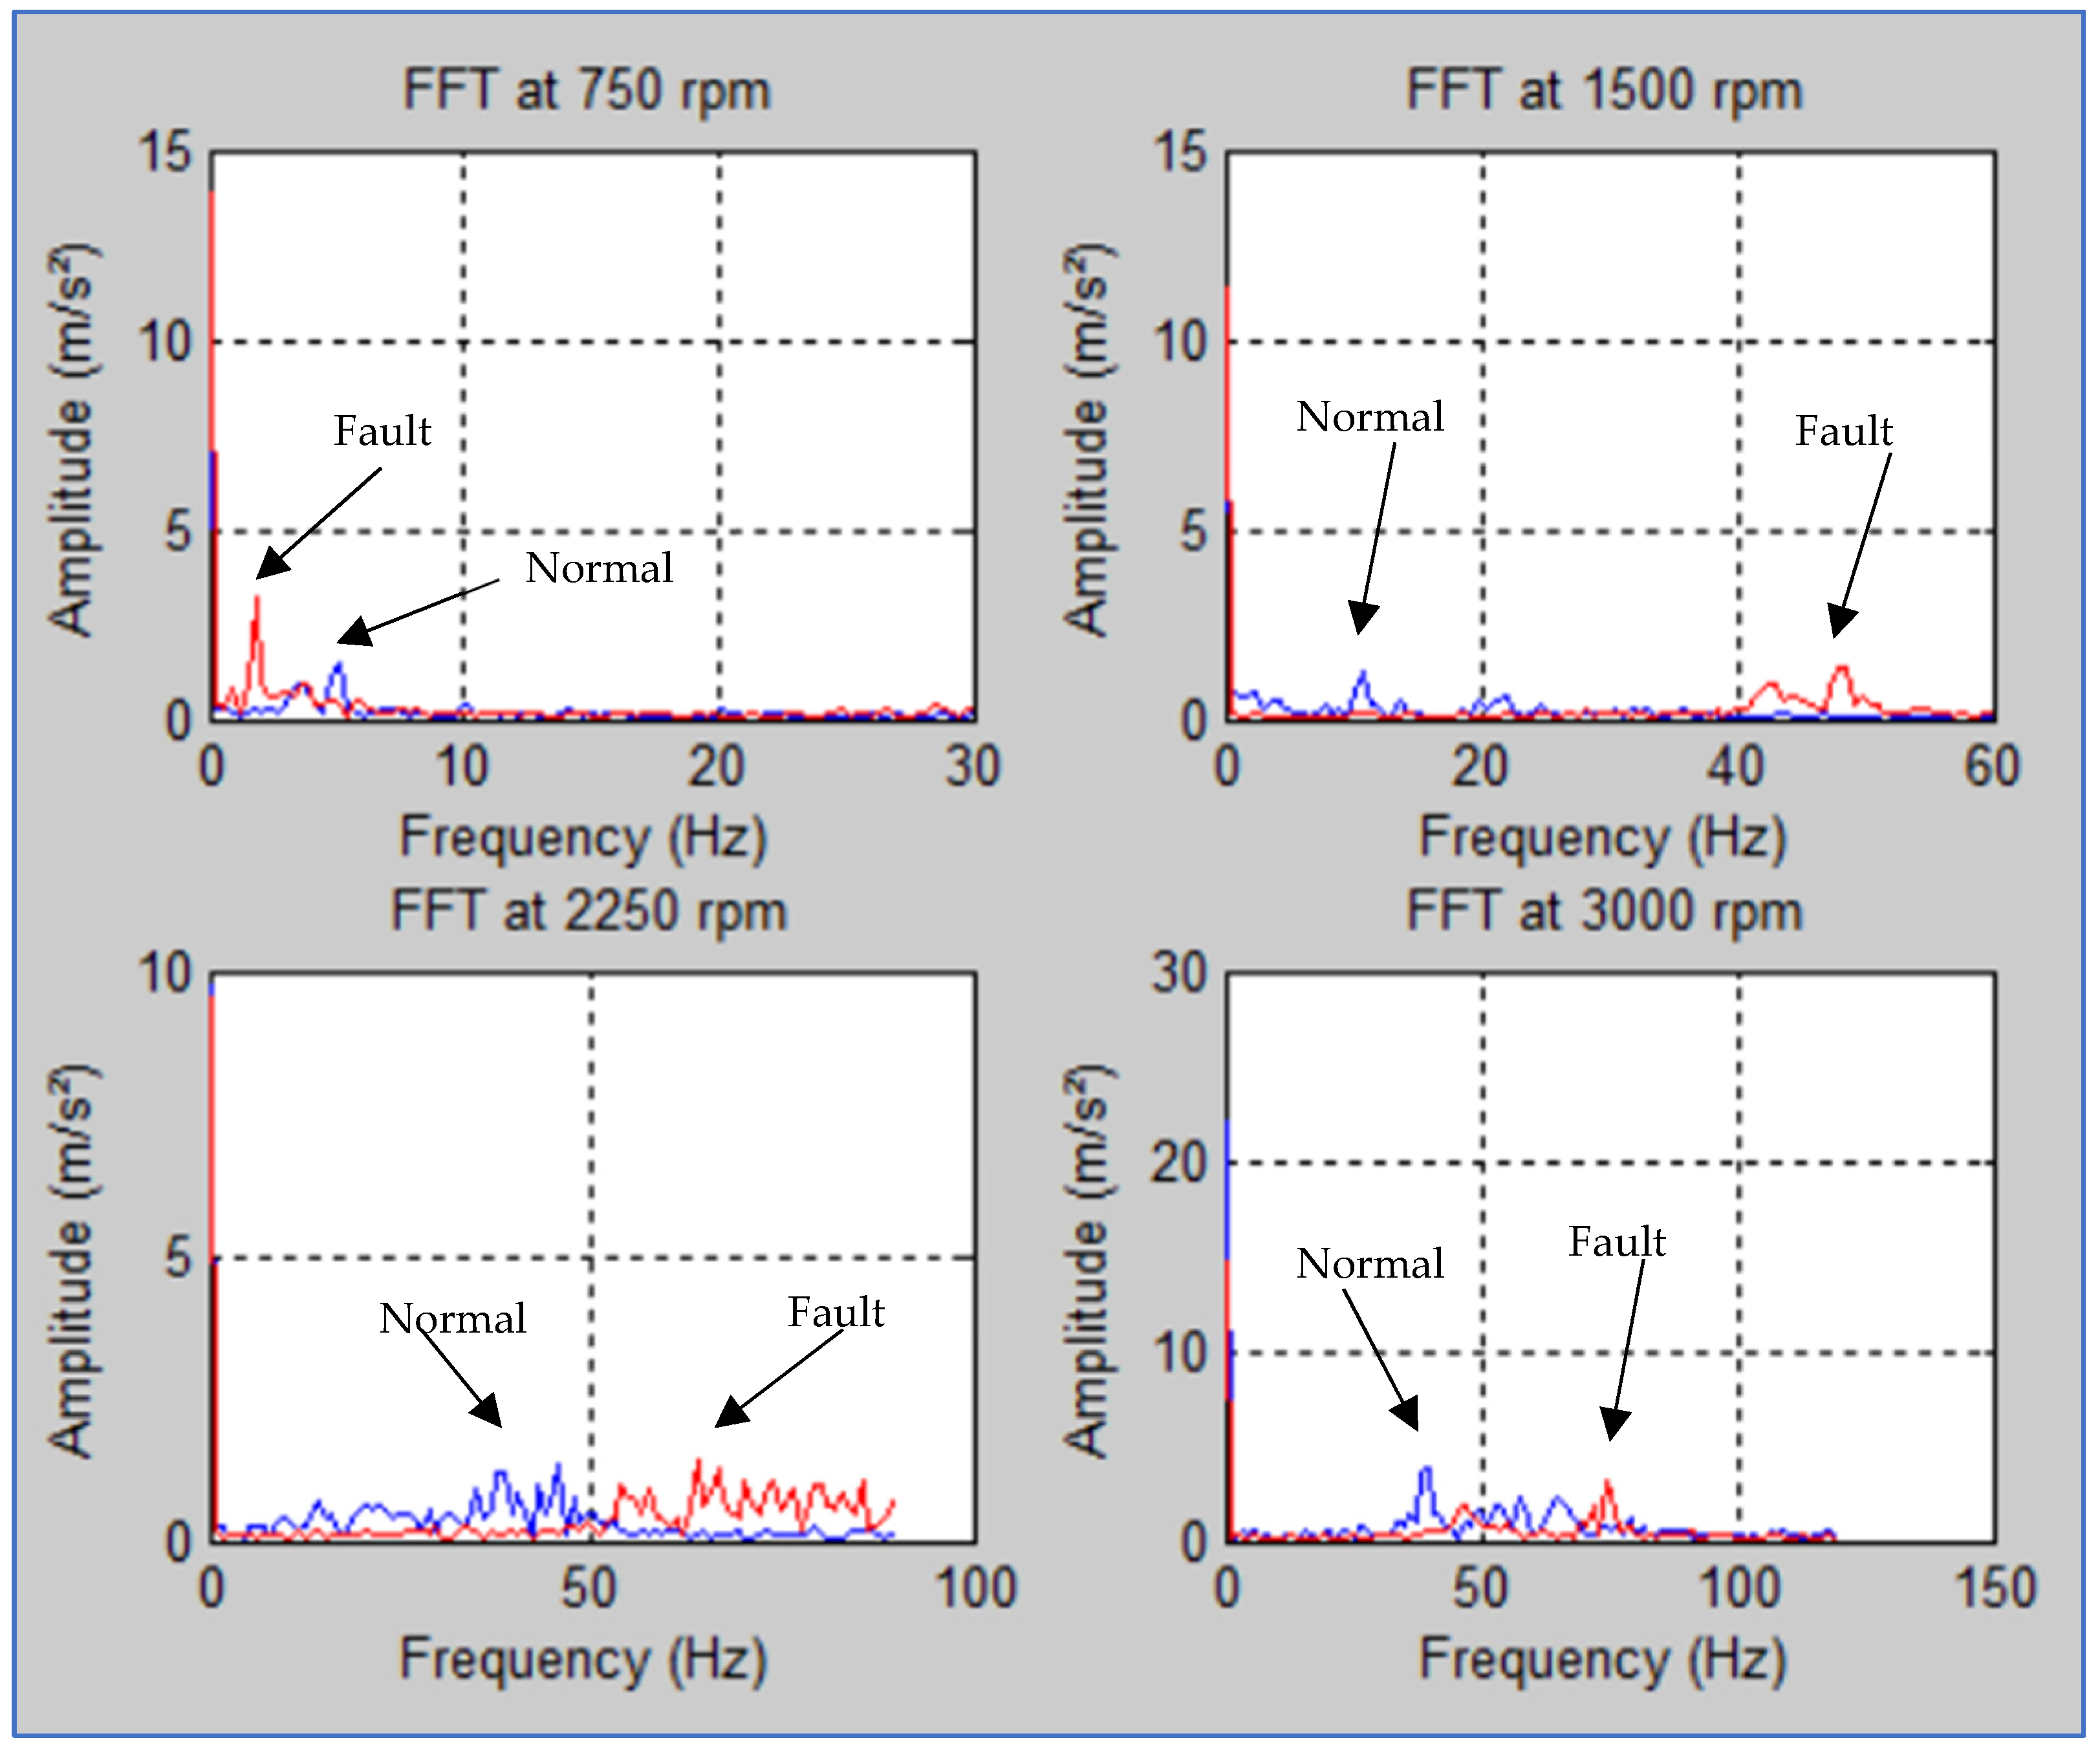
Figure 14 presents comparison of the spectral analysis of vibration signals at four engine speeds (750, 1500, 2250, and 3000 rpm). Comparison reveals conclusive contrasts between good and poor MAF sensor conditions. A healthy condition is characterized by comparatively small amplitudes close to low frequencies, characteristic of steady-state and smooth engine operation. Failure condition is characterized by large amplitudes and large energy spread along frequencies, particularly at high speed, characteristic of augmented mechanical or combustion-related disturbances induced by the faulty sensor.
Spectrum analysis of the four vibration signals at 750, 1500, 2250, and 3000 rpm engine speeds discloses distinctive differences between the healthy and faulty MAF (mass air flow) sensor conditions. The differences depict the variation of the engine’s combustion process and mechanics with higher engine speed.
At 750 rpm: In most cases, the vibration spectrum will exhibit two major peaks at approximately 3.125 Hz and 5 Hz, respectively, which are mainly related to the crankshaft revolution frequency and other low-order components like the timing chain and camshaft. These are harmonically balanced and structured engine running frequencies. But in a faulty MAF sensor situation, the spectrum is marked by a single peak at approximately 3.25 Hz with a double its amplitude (3.25 ms−2) compared to the normal situation. The singularity in a band of frequency points towards loss of mechanical balance, probably owing to one-sided pressure oscillations in the combustion chamber already destabilizing the engine performance at low RPMs.
At 1500 rpm: There are a couple of low-amplitude peaks in the vibration signal under normal running, the largest at approximately 10 Hz (1.5 ms−2). They are caused by normal combustion cycles, piston, valve, and injector movement. In contrast, the same two high peaks in the range of 43 to 50 Hz are formed in the case of the MAF fault but with the same amplitudes as in normal operating conditions. They are oscillations and combustion anomalies because the engine is fighting against the oxygen requirement and thereby results in incomplete burning of fuel. The vibration energy is less bound and more random and reflects disturbances due to the asymmetrical valve and piston motion.
At 2250 rpm: Spectrum in the normal condition has many peaks of frequencies having maximum amplitudes in a range of 37.5 Hz to 50 Hz. They are related to harmonic components of injectors, camshaft, timing chain, and combustion cycles. Components that are well-separated reflect a well-synchronized engine operation. If the MAF sensor has a fault, the signature is quite distinct from the one described above: there is a group of spectral peaks between 55 and 75 Hz and the peak amplitudes of around 1.5 ms−2. These are typical of misfires or delayed combustion phases resulting in abrupt and unpredictable pressure spiking. These transients have the potential to excite higher-frequency valvetrain and distribution system components, i.e., camshaft and timing chain. The vibratory signature worsens in order, reflecting the presence of a mechanical contact or synchronization fault.
At 3000 rpm: In the normal state, the spectrum shows an overall high-amplitude peak at (3.7 ms−2) flanked by low-amplitude harmonics. This indicates synchronized crankshaft, piston, injector, and valve motion, a sign of good combustion and best performance at high speed. Under faulty conditions, however, spectral content widens considerably. The large peak is at 75 Hz, and harmonic content increases as well. Twice the complexity of spectral content is an immediate result of imbalanced combustion because of the faulty MAF sensor. Unbalanced air–fuel ratio generates skewed pressure waves that enhance base combustion frequencies and excite higher-order harmonics. These harmonics couple with mechanical resonances of rotary elements like crankshaft and camshaft to maximize instability.

4. Discussion

Time-domain and frequency-domain (spectral) vibration analysis are the basic means of diesel engine diagnosis and identification of running abnormalities, including those produced by faulty sensors, like a faulty mass air flow (MAF) sensor. This study focuses on the reaction of these two analytical perspectives when the engine is operating under varying engine conditions and speeds.
  • Time-Domain Analysis
Time-domain analysis offers a direct way of estimating the dynamic properties of diesel engine vibrations and delivering significant information regarding how the mechanical and combustion processes evolve in time. In normal operating conditions, the acceleration signals are likely to have steady low-amplitude waveforms indicating a stable and synchronizing engine cycle. They confirm symmetrical combustion events and satisfactory air–fuel mixture regulating system operation.
However, when the mass air flow (MAF) sensor goes bad, a very severe excursion on time-domain signatures occurs. Especially, spiky features, increased amplitudes, and random waveform patterns begin to appear, especially with transient engine operating conditions such as acceleration or changes in loading. Such oscillations are due to the deterioration of the air–fuel mixture, resulting in combustion instabilities and mechanical imbalances. At low engine speeds (e.g., 750 rpm), nonstationary oscillations and irregular bursts are observed by pressure disturbance signs in the combustion chamber. At high engine speeds (2250 to 3000 rpm), these oscillations increase and produce chaotic signal patterns through collision of defective combustion dynamics and mechanical resonances.
Quantitative metrics in the time-domain, such as root mean square (RMS), peak, kurtosis, and standard deviation are found to work most effectively in showing such variations. A few of the current publications confirm that these quantities grow significantly under MAF sensor or valve clearance fault situations and may be relied upon as precursors to fault identification. As an instance, research [26] demonstrated that RMS and peak readings signal sensor-induced abnormality during the initial phases of diesel engines. Similarly, another work [55] had reported elevated time-domain responses under varying sensor and load conditions, justifying the engine fault sensitivity of such indicators.
Additionally, advanced time-domain diagnostic methods, VMD-MFCC [66], and VMD-KFCM algorithm [67], have proven to be effective in valve clearance and air flow fault detection. These methods evidently show that statistical fluctuation in RMS and kurtosis can effectively monitor the onset of mechanical and combustion faults. Another [68,69] utilized extreme gradient boosting with high-resolution time-frequency representation to find patterns of vibration that map to misfire events, again supporting time-domain measurements for diagnosis.
In summary, these findings highlight the significance of time-domain analysis in fault detection processes. Through permanent monitoring of statistical parameters of vibration signals, engine abnormalities, such as those induced by MAF sensor faults, can be identified at the initial stages before they escalate, facilitating proactive maintenance and minimizing operational risks.
  • Frequency (spectral) domain analysis
Frequency analysis is a key tool of vibration-based diagnostic techniques in diesel engines and carries the benefit of unearthing fault-induced spectral features that are otherwise buried within time-domain analysis. With the use of the fast Fourier transform (FFT), raw vibration data are resolved into underlying frequencies, and mechanical and combustion faults can subsequently be detected with accuracy.
During routine operating conditions, vibration energy is concentrated primarily in low frequency ranges (in the frequency range of 3–10 Hz), corresponding to rotational parts such as crankshaft and camshaft. At these frequencies, sharp, well-defined spectral lines are observed, which indicate well-tuned engines and combustion cycles. But if the mass air flow (MAF) sensor fails, this spectral pattern is drastically changed.
To provide better interpretability and facilitate diagnostic reuse, Table 4 summarizes the dominant frequency peaks observed across the four engine speeds (750, 1500, 2250, 3000 rpm), both under healthy and MAF sensor fault conditions.
These results highlight that faulty conditions of the MAF sensor produce broader and less deterministic frequency signatures. High RPM situations show greater harmonic content and frequency spreading beyond 75 Hz, indicative of combustion-driven instability that is also coupled with mechanical resonance (e.g., valvetrain dynamics and crankshaft harmonics). These mappings enhance the usefulness of spectral analysis across similar engine systems and allow for simpler fault-induced feature determination by researchers and practitioners.
At 750 rpm, the power spectrum has a single peak at around 3.25 Hz followed by an abrupt amplitude jump. Concentration indicates unstable combustion pressures and cancellation of harmonics that are otherwise included in normal combustion cycles. Intermediate speeds (e.g., 1500 rpm) generate additional peaks at around 43–50 Hz, which indicate chaotic air–fuel mixing and incipient combustion events. At increased engine speeds (e.g., 3000 rpm), the profile is more characterized by high-frequency content (>75 Hz), which is an indicator of resonance effects and combustion harmonic amplification.
These widening spectral mechanisms are due to mechanical-combustion coupling instability, which is triggered by faulty MAF sensor readings that disrupt the air–fuel mixture, leading to asynchronous in-cylinder pressure fluctuations. Such faults excite structural resonances of fundamental engine parts, primarily the valvetrain, timing gear, crankshaft, and exhaust subsystems. The consequent harmonic content in terms of 2× or 3× base frequency is further enhanced by mechanical amplification mechanisms within the engine structure.
These results are also confirmed by recent studies. Recent work by Mafla-Yépez et al. showed that MAF sensor faults redistributed spectral energy across harmonic bands, especially second and third harmonics, confirming the sensitivity of frequency-domain features to sensor-induced combustion anomalies [1]. Other researchers [70,71] have also confirmed that erroneous air and fuel sensors lead to secondary vibrations, which happen specifically in the spectral domain. These spectral features are not only signals of faults but also signals of the degree of faults.
Furthermore, Refs. [72,73] underscored the use of FFT-based diagnostics to detect misfire patterns and valve timing faults. Their work demonstrates how spectral parameters, like the appearance of sidebands, peak shift, and buildup of harmonics, can be monitored in a sequential fashion to differentiate faults and forecast their evolution. At elevated engine speeds and operation near structural resonant frequency regimes, even small variations in air flow measurement will provoke grossly disproportionate vibratory responses.
Critically, such frequency-domain distortions are not necessarily noise artifacts; they represent a coherent response to mechanical asymmetry and combustion distortion. Through integration into condition-based maintenance systems, spectral analysis enhances diagnostic reliability and accuracy. Finally, with the integration of spectral insight into conventional diagnostic practice, faults become detectable earlier, unscheduled downtime is decreased, and engine operating life is increased.

5. Conclusions

The present work offers a comprehensive description of vibration characteristics of a diesel engine under faulty state of the mass air flow (MAF) sensor using time-domain and frequency-domain vibration analysis. The approach introduced here is a fault-sensitive, non-intrusive diagnosis methodology better than conventional on-board diagnostics (OBD) methods for nascent or transient fault detection.
Time-domain analysis successfully detected transient anomalies based on statistical parameters such as root mean square (RMS), kurtosis, peak value, shape factor, clearance factor, and standard deviation. The parameters mentioned above were successful in establishing abnormal combustion-induced vibration characteristics at low engine speeds (e.g., 750 rpm) that could not be detected through conventional diagnostic methods.
Complementary frequency-domain (spectral) analysis identified in which ways sensor faults influence the independent mechanical and combustion-related frequency components. Fault sensor states widened and randomized spectra, especially under higher engine speeds, with increased capture of mechanical resonance and air–fuel imbalance. Such findings indicate the promise of vibration-based measures as robust and timely indicators of engine health degradation.
Experimental confirmation confirmed that MAF sensor faults significantly degrade combustion efficiency and mechanical stability, particularly during full engine loading. From the synergy of time and frequency analyses, this paper recommends a robust diagnosis system that not only identifies actual faults but also offers predictive outputs for future failures. The primary contributions of this paper are:
  • Demonstrating diagnostic practicability of MAF sensor fault vibration signatures.
  • Associating the frequency range with faulty conditions of engine components.
  • Depicting vibration analysis as an economic, scalable, real-time diesel engine condition monitoring technique.
In this context, integrating vibration diagnosis into scheduled maintenance has the potential to reduce pollutant emissions by a remarkable percentage, fuel consumption by a considerable amount, and increase the life of the engine.
Future research will focus on integrating machine learning algorithms for fault auto-classification and real-time adaptive observers for fault compensation in real-time. Additionally, multi-sensor fusion techniques and cloud-based diagnosis systems, Industry 4.0-compliant platforms, are the most likely avenues to further enhance diagnostic accuracy, robustness, and operational dependability. These advancements will not only enhance engine performance monitoring but also provide broader environmental compliance for use in automotive and industrial applications.

Author Contributions

Conceptualization, A.H.; methodology, A.H., I.B., J.A. and A.Z.; software, A.H., I.B., J.A. and A.Z.; validation, A.H., I.B. and J.A.; formal analysis, A.H., I.B. and J.A.; investigation, A.H.; resources, A.H.; data curation, A.H., J.A. and A.Z.; writing—original draft preparation, I.B. and J.A.; writing—review and editing, A.H.; visualization, I.B.; supervision, A.H. and I.B.; project administration, A.H. All authors have read and agreed to the published version of the manuscript.

Funding

This research received no external funding.

Institutional Review Board Statement

Not applicable.

Informed Consent Statement

Not applicable.

Data Availability Statement

Data presented in this study are available upon request to the author.

Conflicts of Interest

The authors declare no conflicts of interest.

References

  1. Mafla-Yépez, C.; Castejon, C.; Rubio, H.; Morales, C. A Vibration Analysis for the Evaluation of Fuel Rail Pressure and Mass Air Flow Sensors on a Diesel Engine: Strategies for Predictive Maintenance. Sensors 2024, 24, 1551. [Google Scholar] [CrossRef] [PubMed]
  2. Ward, T.; Jenab, K.; Ortega-Moody, J.; Staub, S. A Comprehensive Review of Machine Learning Techniques for Condition-Based Maintenance. Int. J. Progn. Health Manag. 2024, 15. [Google Scholar] [CrossRef]
  3. Gangsar, P.; Bajpei, A.R.; Porwal, R. A Review on Deep Learning Based Condition Monitoring and Fault Diagnosis of Rotating Machinery. Noise Vib. Worldw. 2022, 53, 550–578. [Google Scholar] [CrossRef]
  4. Li, Y.; Peng, S.; Li, Y.; Jiang, W. A Review of Condition-Based Maintenance: Its Prognostic and Operational Aspects. Front. Eng. Manag. 2020, 7, 323–334. [Google Scholar] [CrossRef]
  5. Karabacak, Y.E. Condition Monitoring of Internal Combustion Engines with Vibration Signals and Fault Detection by Using Machine Learning Techniques. Int. J. Automot. Eng. Technol. 2024, 13, 191–200. [Google Scholar] [CrossRef]
  6. Chen, Y.; Liu, C. Sequential Multi-Objective Multi-Agent Reinforcement Learning Approach for System Predictive Maintenance of Turbofan Engine. Adv. Eng. Inform. 2025, 67, 103553. [Google Scholar] [CrossRef]
  7. ElAraby, W.S.; Madian, A.H.; Saad, M.H. Fault Diagnosis for Rotating Machinery Based on Deep Learning. Noise Vib. Worldw. 2025, 56, 400–421. [Google Scholar] [CrossRef]
  8. Zonta, T.; Da Costa, C.A.; Righi, R.d.R.; de Lima, M.J.; Da Trindade, E.S.; Li, G.P. Predictive Maintenance in the Industry 4.0: A Systematic Literature Review. Computers 2020, 150, 106889. [Google Scholar] [CrossRef]
  9. Zhao, H.; Zhang, J.; Jiang, Z.; Wei, D.; Zhang, X.; Mao, Z. A New Fault Diagnosis Method for a Diesel Engine Based on an Optimized Vibration Mel Frequency Under Multiple Operation Conditions. Sensors 2019, 19, 2590. [Google Scholar] [CrossRef]
  10. Kim, B.; Yang, Y.; Park, J.S.; Jang, H.-J. Machine Learning Based Representative Spatio-Temporal Event Documents Classification. Appl. Sci. 2023, 13, 4230. [Google Scholar] [CrossRef]
  11. Abdullah, N.R.; Shahruddin, N.S.; Mamat, R.; Mamat, A.M.I.; Zulkifli, A. Effects of Air Intake Pressure on the Engine Performance, Fuel Economy and Exhaust Emissions of a Small Gasoline Engine. J. Mech. Eng. Sci. 2014, 6, 949–958. [Google Scholar] [CrossRef]
  12. Mukhopadhyay, A.; Sen, S. Fundamentals of Combustion Engineering; CRC Press: Boca Raton, FL, USA, 2019. [Google Scholar] [CrossRef]
  13. Smail, B.; AKM, M. Combustion Chamber Design Effect on the Rotary Engine Performance—A Review. Int. J. Automot. Eng. 2020, 11, 200–212. [Google Scholar] [CrossRef]
  14. Sujesh, G.; Ramesh, S. Modeling and Control of Diesel Engines: A Systematic Review. Alex. Eng. J. 2018, 57, 4033–4048. [Google Scholar] [CrossRef]
  15. Komorska, I.; Wołczyński, Z.; Borczuch, A. Fault Diagnostics in Air Intake System of Combustion Engine Using Virtual Sensors. Diagnostyka 2018, 19, 5–10. [Google Scholar] [CrossRef]
  16. Zhang, Z.; Liu, H.; Yue, Z.; Li, Y.; Liang, H. Effects of Intake High-Pressure Compressed Air on Thermal-Work Conversion in a Stationary Diesel Engine. Int. J. Green Energy 2023, 20, 338–351. [Google Scholar] [CrossRef]
  17. Herpel, T.; Koerber, H.; Rasshofer, R.H.; Spies, M. Multi-Sensor Data Fusion in Automotive Applications. In Proceedings of the 3rd International Conference on Sensing Technology (ICST 2008), Tainan, Taiwan, 30 November–3 December 2008; pp. 100–105. [Google Scholar]
  18. Taghizadeh-Alisaraei, A.; Mahdavian, A. Fault Detection of Injectors in Diesel Engines Using Vibration Time-Frequency Analysis. Appl. Acoust. 2019, 143, 48–58. [Google Scholar] [CrossRef]
  19. Qian, J.; Zhang, Y.; Liu, X.; Chen, H.; Wang, T. Improved Sensor System Detecting via Joint Transfer Learning and Array Optimization Design Based on Multiple Phase Feature Extraction. IEEE Trans. Instrum. Meas. 2024, 74, 1–11. [Google Scholar] [CrossRef]
  20. Jin, C.; Sun, J.; Sun, H.; Li, B. A Vibration-Based Approach for Diesel Engine Fault Diagnosis. In Proceedings of the 2014 International Conference on Prognostics and Health Management (ICPHM), Chengdu, China, 12–14 June 2014; pp. 1–6. [Google Scholar]
  21. Khalifa, R.M.; Yacout, S.; Bassetto, S.; Shaban, Y. Experimental vibration data collected for a belt drive system under different operating conditions. Data Brief 2023, 48, 109175. [Google Scholar] [CrossRef]
  22. Mohd Ghazali, M.H.; Rahiman, W. Vibration Analysis for Machine Monitoring and Diagnosis: A Systematic Review. Shock Vib. 2021, 2021, 9469318. [Google Scholar] [CrossRef]
  23. Renwick, J.T.; Babson, P.E. Vibration Analysis—A Proven Technique as a Predictive Maintenance Tool. IEEE Trans. Ind. Appl. 1985, IA-21, 324–332. [Google Scholar] [CrossRef]
  24. Tran, B.; Nguyen, D. Acoustic Emission Monitoring for Early Detection of Faults in Automotive Engines. Appl. Acoust. 2023, 210, 119876. [Google Scholar]
  25. Ramteke, S.M.; Chelladurai, H.; Amarnath, M. Diagnosis of Liner Scuffing Fault of a Diesel Engine via Vibration and Acoustic Emission Analysis. J. Vib. Eng. Technol. 2020, 8, 815–833. [Google Scholar] [CrossRef]
  26. Allam, S.; Abdo, M.; Rabie, M. Diesel Engine Fault Detection Using Vibration and Acoustic Emission Signals. IJASRE 2018, 4, 86–93. [Google Scholar] [CrossRef]
  27. Ma, X.; Li, Y.; Wang, Z.; Zhang, L. Combined Frequency Domain Analysis and Fuzzy Logic for Engine Misfire Diagnosis. SAE Tech. Pap. 2015-01-0207 2015. [Google Scholar] [CrossRef]
  28. Helali, A.; Belkacem, I.; Abdellaoui, J.; Zegnani, A. Vibration Diagnosis of Diesel Engines with Air Flow Sensor Failure. In Proceedings of the International Conference on Advances in Mechanical Engineering and Mechanics, Sousse, Tunisia, 28–30 June 2024; pp. 90–98. [Google Scholar]
  29. Taghizadeh-Alisaraei, A.; Mahdavian, A.; Tavakoli, H.R.; Farid, M. Characterization of Engine’s Combustion-Vibration Using Diesel and Biodiesel Fuel Blends by Time-Frequency Methods: A Case Study. Renew. Energy 2016, 95, 422–432. [Google Scholar] [CrossRef]
  30. Galiullin, L.A.; Valiev, R.A. Developing Technical Diagnostic Systems for Internal Combustion Engines. In Advances in Automation, Proceedings of the International Russian Automation Conference, RusAutoCon 2019, Sochi, Russia, 8–14 September 2019; Springer: Cham, Switzerland, 2020; pp. 123–130. [Google Scholar]
  31. Ramteke, S.M.; Chelladurai, H.; Amarnath, M. Diagnosis and Classification of Diesel Engine Components Faults Using Time–Frequency and Machine Learning Approach. J. Vib. Eng. Technol. 2022, 10, 175–192. [Google Scholar] [CrossRef]
  32. Yao, Z.T.; Pan, H.X. The Engine Fault Diagnosis Based on Time Domain and Frequency Domain. Adv. Mater. Res. 2014, 936, 2243–2246. [Google Scholar] [CrossRef]
  33. Elamin, F. Fault Detection and Diagnosis in Heavy Duty Diesel Engines Using Acoustic Emission. Ph.D. Thesis, University of Huddersfield, Huddersfield, UK, 2013. [Google Scholar]
  34. Tsallis, C.; Papadopoulos, S.; Georgiadis, M.; Iliadis, L. Application-Wise Review of Machine Learning-Based Predictive Maintenance: Trends, Challenges, and Future Directions. Appl. Sci. 2025, 15, 4898. [Google Scholar] [CrossRef]
  35. Kanevski, H.; Lyubomirov, S.; Asenov, S. Simulation of Engine Malfunctions and Their Impact on Emissions with an Emphasis on Engineering Education. In Proceedings of the 15th International Conference of Education, Research and Innovation (ICERI 2022), Seville, Spain, 7–9 November 2022. [Google Scholar]
  36. Zhang, C.; Zhou, J.; Wang, Y.; Li, H.; Zhang, W. Vibration Feature Extraction Using Signal Processing Techniques for Structural Health Monitoring: A Review. Mech. Syst. Signal Process. 2022, 177, 109175. [Google Scholar] [CrossRef]
  37. Nithin, S.K.; Hemanth, K.; Shamanth, V. A Review on Combustion and Vibration Condition Monitoring of IC Engine. Mater. Today Proc. 2021, 45, 65–70. [Google Scholar] [CrossRef]
  38. Pacella, M.; Papadia, G. Fault Diagnosis by Multisensor Data: A Data-Driven Approach Based on Spectral Clustering and Pairwise Constraints. Sensors 2020, 20, 7065. [Google Scholar] [CrossRef]
  39. Mohammadpour, J.; Franchek, M.; Grigoriadis, K. A Survey on Diagnostic Methods for Automotive Engines. Int. J. Engine Res. 2012, 13, 41–64. [Google Scholar] [CrossRef]
  40. Miller, T.; Nowak, P.; Kowalski, M.; Zieliński, A. Artificial Intelligence in Maritime Cybersecurity: A Systematic Review of AI-Driven Threat Detection and Risk Mitigation Strategies. Electronics 2025, 14, 1844. [Google Scholar] [CrossRef]
  41. Zhang, Y.; Li, H. A Review on Predictive Maintenance Strategies for Modern Vehicles. J. Intell. Transp. Syst. 2023, 28, 123–136. [Google Scholar]
  42. O’Connor, P.; Evans, D. Integration of Real-Time Monitoring with Predictive Analytics for Automotive Diagnostics. IEEE Trans. Ind. Inform. 2024, 20, 567–579. [Google Scholar]
  43. Injection BOSCh HDI Moteur DV4TD. Centre International de Formation Commerce Edition Janvier 2003. Available online: https://fr.scribd.com/doc/45751402/Injection-BOSCh-HDI-Moteur-DV4TD (accessed on 1 April 2025).
  44. Shaobo, J.; Cheng, Y.; Wanyou, H.; Minli, H. Comparison of the Vibration Sensors Used in the Estimation of the Combustion Process in a Diesel Engine. Proc. Inst. Mech. Eng. Part D J. Automob. Eng. 2014, 228, 1210–1219. [Google Scholar] [CrossRef]
  45. Wang, Y.; Cheng, Y. Vibration Signal Analysis of Cylinder Head During Engine Combustion Process. J. Vib. Shock 2021, 40, 210–215. [Google Scholar]
  46. Goyal, D.; Pabla, B.S. The Vibration Monitoring Methods and Signal Processing Techniques for Structural Health Monitoring: A Review. Arch Comput. Methods Eng. 2016, 23, 585–594. [Google Scholar] [CrossRef]
  47. Arnone, L.; Boni, M.; Manelli, S.; Morselli, M. Diesel Engine Combustion Monitoring Through Block Vibration Signal Analysis. SAE Tech. Pap. 2009-01-0765 2009. [Google Scholar] [CrossRef]
  48. Narayan, S.; Milojevic, S.; Gupta, V. Combustion Monitoring in Engines Using Accelerometer Signals. J. Vibroeng. 2019, 21, 1552–1563. [Google Scholar] [CrossRef]
  49. Randall, R.B. Vibration-Based Condition Monitoring: Industrial, Aerospace and Automotive Applications; Wiley: Chichester, UK, 2011. [Google Scholar] [CrossRef]
  50. Zabihi-Hesari, A.; Ansari-Rad, S.; Shirazi, F.A.; Ayati, M. Fault detection and diagnosis of a 12-cylinder trainset diesel engine based on vibration signature analysis and neural network. Proc. Inst. Mech. Eng. Part C J. Mech. Eng. Sci. 2018, 233, 1910–1923. [Google Scholar] [CrossRef]
  51. Heywood, J.B. Combustion engine fundamentals. 1a Edição. Estados Unidos 1988, 25, 1117–1128. [Google Scholar]
  52. Zeng, R.; Zhang, L.; Xiao, Y.; Mei, J.; Zhou, B.; Zhao, H.; Jia, J. An approach on fault detection in diesel engine by using symmetrical polar coordinates and image recognition. Adv. Mech. Eng. 2014, 6, 273929. [Google Scholar] [CrossRef]
  53. Grega, R.; Czech, P. Non-invasive vibroacoustic diagnostics of car internal combustion engines. Zesz. Naukowe. Transp. Politech. Śląska 2024, 125, 69–87. [Google Scholar] [CrossRef]
  54. Li, S.; Liu, Z.; Yan, Y.; Wang, R.; Dong, E.; Cheng, Z. Research on Diesel Engine Fault Status Identification Method Based on Synchro Squeezing S-Transform and Vision Transformer. Sensors 2023, 23, 6447. [Google Scholar] [CrossRef]
  55. Freire Moraes, G.H.; Ribeiro Junior, R.F.; Gomes, G.F. Fault Classification in Diesel Engines Based on Time-Domain Responses Through Signal Processing and Convolutional Neural Network. Vibration 2024, 7, 863–893. [Google Scholar] [CrossRef]
  56. Gupta, H.N. Fundamentals of Internal Combustion Engines; PHI Learning Pvt. Ltd.: New Delhi, India, 2012. [Google Scholar]
  57. Ramachandran, T.; Padmanaban, K.P. Review on Internal Combustion Engine Vibrations and Mountings. Int. J. Eng. Sci. Emerg. Technol. 2012, 3, 63–73. [Google Scholar]
  58. Stone, R. Introduction to Internal Combustion Engines, 3rd ed.; Palgrave Macmillan: London, UK, 1999. [Google Scholar]
  59. Tandon, N.; Choudhury, A. A Review of Vibration and Acoustic Measurement Methods for the Detection of Defects in Rolling Element Bearings. Tribol. Int. 1999, 32, 469–470. [Google Scholar] [CrossRef]
  60. Tao, J.; Wang, S.; Zhang, Y.; Li, H.; Zhou, W. Intelligent fault diagnosis of diesel engines via extreme gradient boosting and high-accuracy time–frequency information of vibration signals. Sensors 2019, 19, 3280. [Google Scholar] [CrossRef]
  61. Alharbi, F.; Luo, S.; Zhang, H.; Shaukat, K.; Yang, G.; Wheeler, C.A.; Chen, Z. A Brief Review of Acoustic and Vibration Signal-Based Fault Detection for Belt Conveyor Idlers Using Machine Learning Models. Sensors 2023, 23, 1902. [Google Scholar] [CrossRef] [PubMed]
  62. Liu, X.; Pang, Y.; Lodewijks, G.; He, D. Experimental research on condition monitoring of belt conveyor idlers. Measurement 2018, 127, 277–282. [Google Scholar] [CrossRef]
  63. Ewert, P.; Kowalski, C.T.; Jaworski, M. Comparison of the Effectiveness of Selected Vibration Signal Analysis Methods in the Rotor Unbalance Detection of PMSM Drive System. Electronics 2022, 11, 1748. [Google Scholar] [CrossRef]
  64. Bagri, I.; Tahiry, K.; Hraiba, A.; Touil, A.; Mousrij, A. Vibration Signal Analysis for Intelligent Rotating Machinery Diagnosis and Prognosis: A Comprehensive Systematic Literature Review. Vibration 2024, 7, 1013–1062. [Google Scholar] [CrossRef]
  65. Gougam, F.; Rahmoune, C.; Benazzouz, D.; Afia, A.; Zair, M. Bearing Faults Classification Under Various Operation Modes Using Time Domain Features, Singular Value Decomposition, and Fuzzy Logic System. Adv. Mech. Eng. 2014, 12, 1687814020967874. [Google Scholar] [CrossRef]
  66. Yan, H.; Bai, H.; Zhan, X.; Wu, Z.; Wen, L.; Jia, X. Combination of VMD Mapping MFCC and LSTM: A New Acoustic Fault Diagnosis Method of Diesel Engine. Sensors 2022, 22, 8325. [Google Scholar] [CrossRef]
  67. Bi, X.; Li, Y.; Wang, Z.; Chen, J. VMD-KFCM algorithm for the fault diagnosis of diesel engine vibration signals. Energies 2020, 13, 228. [Google Scholar] [CrossRef]
  68. Ahmadian, H.; Shafiei, M.; Mirzaei, M.; Ebrahimzadeh, E. Evaluation of the combustion-induced noise and vibration using coherence and wavelet coherence estimates in a diesel engine. Int. J. Engine Res. 2021, 22, 827–846. [Google Scholar] [CrossRef]
  69. Abdeltwab, M.M.; Ghazaly, N.M. A review on engine fault diagnosis through vibration analysis. Int. J. Recent Technol. Mech. Electr. Eng. 2022, 9, 1–6. [Google Scholar] [CrossRef]
  70. Yang, Q.; Liu, Y.; Chen, H.; Wang, X.; Li, J. Gear backlash detection and evaluation based on current characteristic extraction and selection. IEEE Access 2020, 8, 107161–107176. [Google Scholar] [CrossRef]
  71. Hunicz, J.; Szkoda, M.; Jakubik, M.; Moskal, D.; Stępniowski, M. An analytical approach to converting vibration signal to combustion characteristics of homogeneous charge compression ignition engines. Energy Convers. Manag. 2023, 294, 117564. [Google Scholar] [CrossRef]
  72. Zhang, Z.; Liu, Y.; Wang, H.; Chen, J.; Li, X. Harmonic Measurement Method and System Design Based on Self-Compensating FFT. IEEE Sens. J. 2025, 25, 24588–24597. [Google Scholar] [CrossRef]
  73. Jayasooriya, P.V.; Siriwardana, G.C.; Bandara, T.R. Vibration Analysis to Detect and Locate Engine Misfires. In Proceedings of the 2021 International Research Conference on Smart Computing and Systems Engineering (SCSE), Colombo, Sri Lanka, 29 September 2021; Volume 4. [Google Scholar]
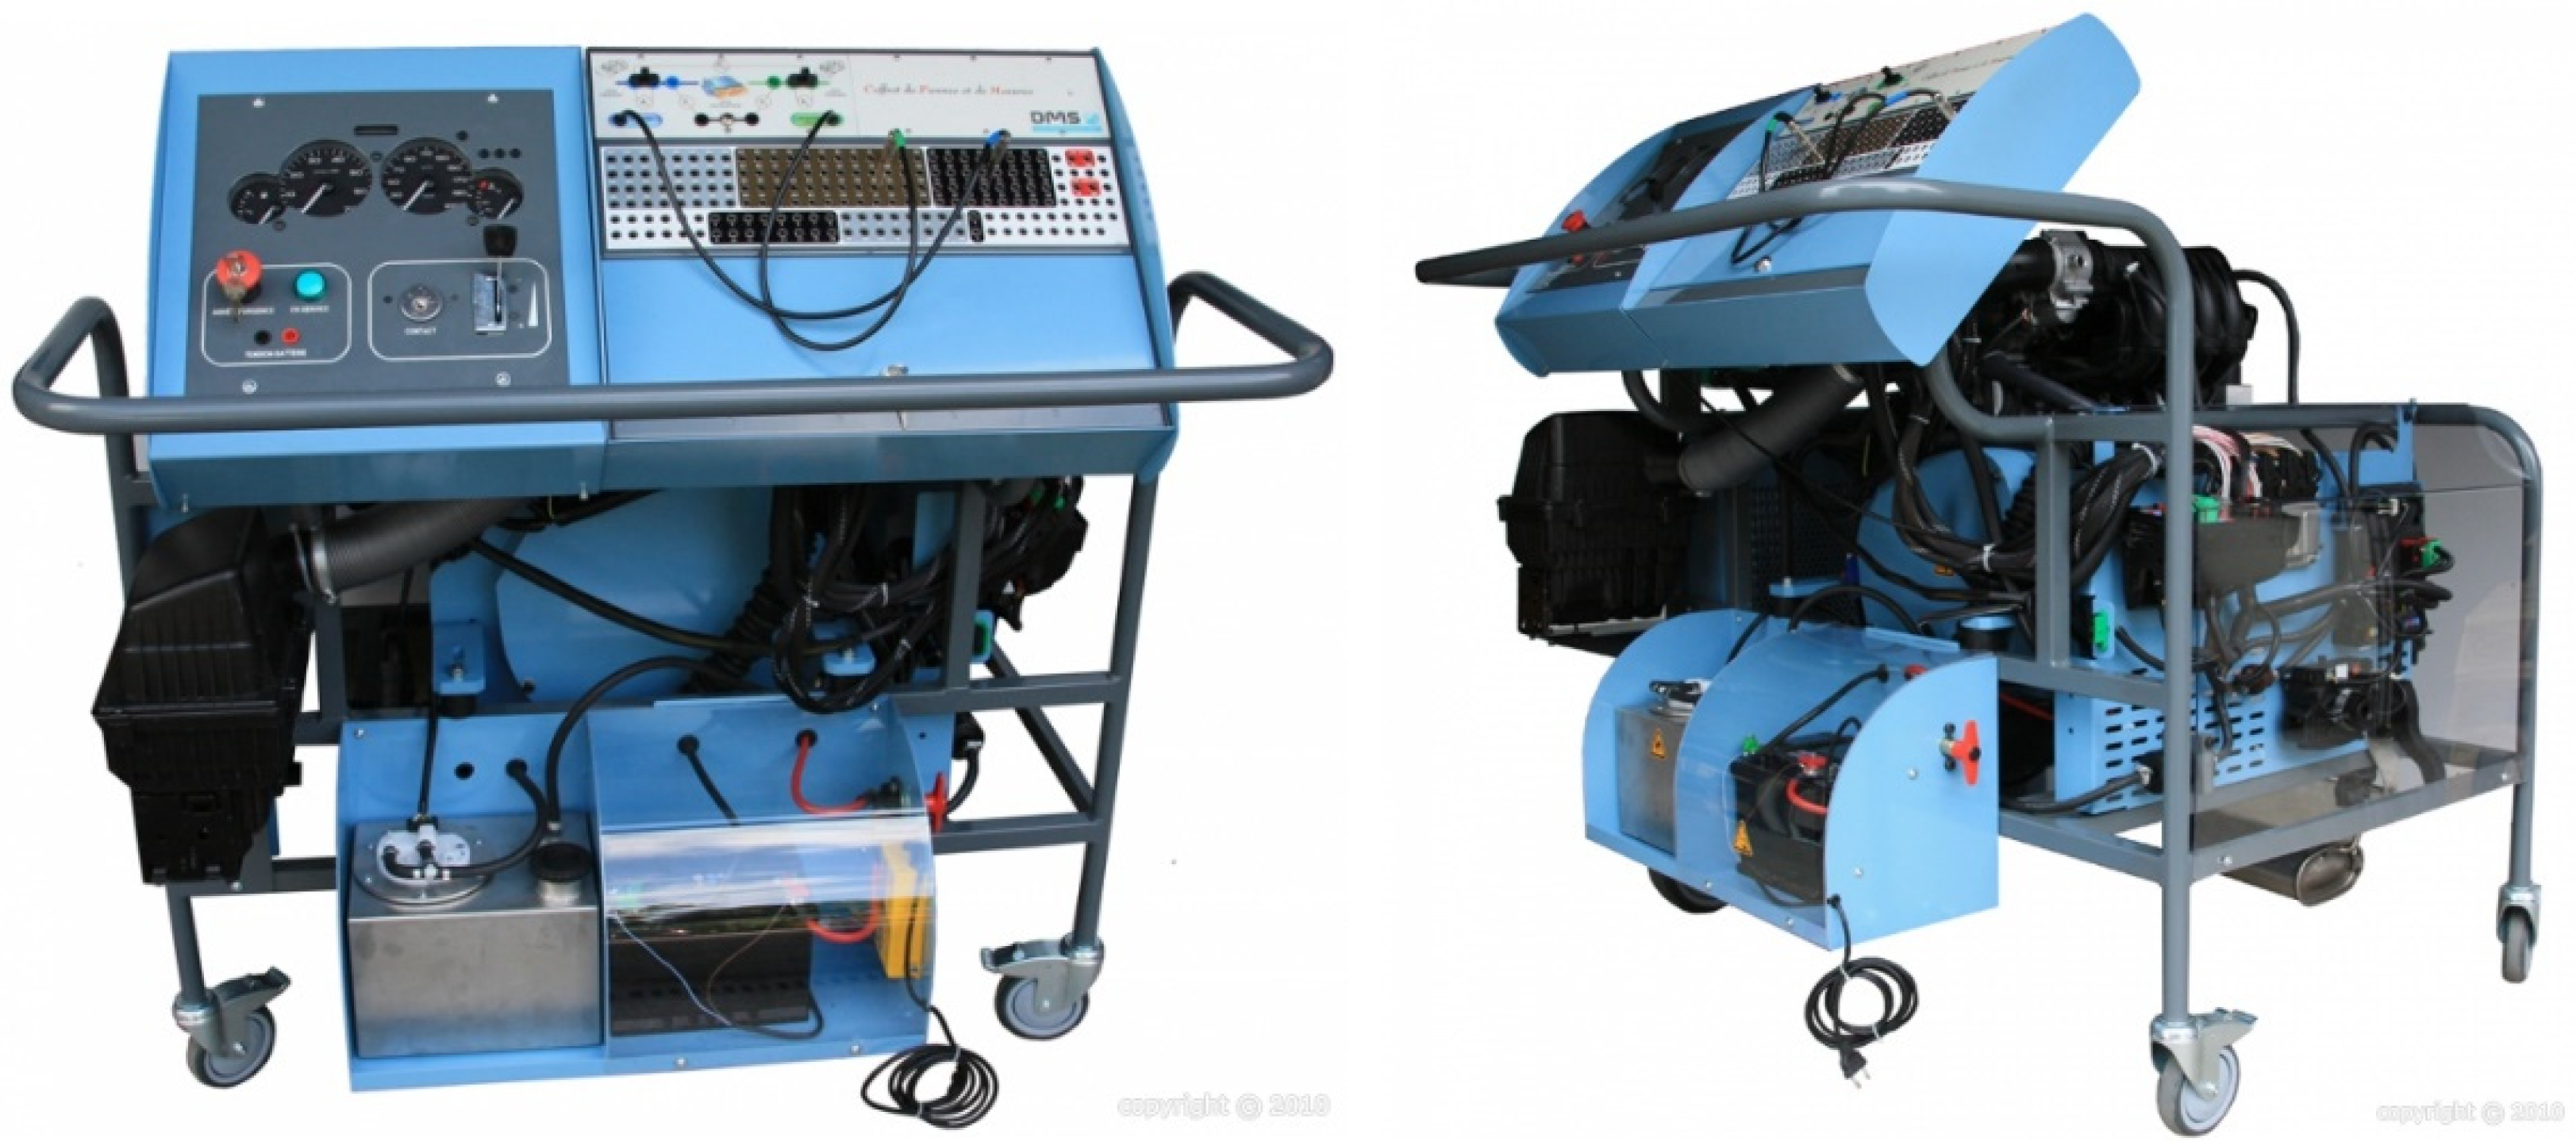
Figure 1. Diesel engine test bench PSA DV4TD.
Technologies 13 00380 g001
Figure 2. Diesel engine air supply [43].
Technologies 13 00380 g002
Figure 3. Components of air flow meter (MAF) [43].
Technologies 13 00380 g003
Figure 4. Instrumentation and wiring with operating conditions for vibration testing [28].
Technologies 13 00380 g004
Figure 5. Flowchart of diagnostic procedures using vibration analysis of thermal engine defects.
Technologies 13 00380 g005
Figure 6. Acceleration vibration in normal conditions at various engine speeds.
Technologies 13 00380 g006
Figure 7. Acceleration vibration with MAF fault at different engine speeds.
Technologies 13 00380 g007
Figure 8. Average of vibration vs. engine speed in normal and MAF fault conditions.
Technologies 13 00380 g008
Figure 9. Standard deviation of vibration vs. engine speed in normal and MAF fault conditions.
Technologies 13 00380 g009
Figure 10. RMS of vibration vs. engine speed in normal and MAF fault conditions.
Technologies 13 00380 g010
Figure 11. Kurtosis of vibration vs. engine speed in normal and MAF fault conditions.
Technologies 13 00380 g011
Figure 12. Clearance factor of vibration vs. engine speed in normal and MAF fault conditions.
Technologies 13 00380 g012
Figure 13. Shape factor of vibration vs. engine speed in Normal and MAF fault conditions.
Technologies 13 00380 g013
Figure 14. Spectral analysis of diesel engine vibrations in normal and MAF fault conditions.
Technologies 13 00380 g014
Table 1. Comparison between vibration-based diagnosis method and conventional methods [5,26,50,52,53,54].
CriteriaVibration-Based DiagnosisConventional Diagnostic Methods
Detection AccuracyHigh sensitivity to early-stage faults and subtle anomalies in engine behaviorOften miss minor or intermittent electronic faults that do not exceed diagnostic thresholds or trigger ECU alerts
Sensor RequirementsRequires accelerometers only (non-intrusive)Relies on multiple engine sensors (MAF, O2, EGR)
Cost EfficiencyCost-effective (uses fewer and more affordable sensors)Expensive (multiple sensors and diagnostic tools required)
Response TimeRapid fault detection through real-time vibration analysisTypically slower; depends on ECU fault code generation
Ability to Detect MAF Sensor FaultCapable of identifying indirect signs of air flow sensor failure through vibration signaturesMay not detect degraded or partially faulty MAF sensors
Data Interpretation ComplexityRequires signal processing and spectral analysis (FFT, STFT, etc.)Often plug-and-play with straightforward code readings
Adaptability to Other FaultsApplicable to a wide range of mechanical and combustion faultsLimited to predefined sensor-based errors
Non-intrusive MonitoringNo engine disassembly or alteration neededOften requires physical inspection or sensor replacement
Training and ExpertiseRequires expertise in vibration analysis More accessible by using diagnostic scanners
Table 2. Signature of diesel engine vibrations with air flow meter in NC and FC.
750 RPM (12.5 Hz)1500 RPM (25 Hz)2250 RPM (37.5 Hz)3000 RPM (50 Hz)
NCFCRE %NCFCRE %NCFCRE %NCFCRE %
Peak14.9524.7765.6416.7915.865.5219.4614.2726.6544.1021.4051.47
K4.856.227.774.014.8621.245.503.7631.626.334.0835.43
RMS5.677.2027.014.876.2828.976.574.7827.1714.807.8846.72
Av8.6710.9025.7210.177.6424.819.707.9817.6921.3512.9839.20
SF0.650.661.030.610.633.120.670.5910.910.690.6012.36
CF2.502.8714.592.603.0517.342.892.5412.072.832.5410.34
SD4.596.0431.563.826.0457.965.772.1662.5514.154.1970.38
Table 3. Frequency mapping of engine components across different RPMs.
Engine RPM750150022503000Explanation
Crankshaft6.25 Hz12.5 Hz25 Hz50 HzDirect rotational frequency
Pistons and Connecting Rods6.25 Hz12.5 Hz12.5 Hz25 Hz/cylinderCombustion, 1 cycle every 2 rotations
Camshaft3.125 Hz6.25 Hz12.5 Hz25 Hz1 rotation for every 2 engine rotations
Valves3.125 Hz6.25 Hz12.5 Hz25 Hz/cylinderDriven by the camshaft
Injectors3.125 Hz6.25 Hz12.5 Hz25 Hz/cylinder 1 injection per engine cycle
Timing Chain6.25 Hz12.5 Hz25 Hz50 HzLinked to the crankshaft
Crankshaft Bearings6.25 Hz12.5 Hz25 Hz50 Hz + harmonicsDependent on design; high-frequency harmonics
Camshaft Bearings3.125 Hz6.25 Hz12.5 Hz25 Hz + harmonicsAs they rotate at 25 Hz
Parasitic Noises/Imbalances3.125 Hz6.25 Hz12.5 Hz2 × 25 Hz or 2 × 50 HzMechanical vibrations and defects
Table 4. Experimental summary of main frequency peaks and corresponding engine components.
Speed (RPM)Peak Frequencies (Hz)Amplitude CharacteristicsLikely Source (s)Condition
7503.125–5.0Low, structuredCrankshaft, camshaft, timing gearHealthy
3.25High, isolatedIrregular combustionFaulty
150010.0MediumCombustion cycle, injectors, pistonsHealthy
43–50Broader, erraticCombustion anomalies, valve misalign.Faulty
225037.5–50High, harmonicInjectors, valvetrain, timing chainHealthy
55–75Spread, high amplitudeMisfire, delayed combustion, resonanceFaulty
300075.0Sharp, dominantCrankshaft harmonics, combustion syncHealthy
>75Dense harmonics, unstableResonance, air–fuel imbalanceFaulty
Disclaimer/Publisher’s Note: The statements, opinions and data contained in all publications are solely those of the individual author(s) and contributor(s) and not of MDPI and/or the editor(s). MDPI and/or the editor(s) disclaim responsibility for any injury to people or property resulting from any ideas, methods, instructions or products referred to in the content.