Abstract
Free-space optical (FSO) communication is a promising high-capacity solution for future wireless networks, particularly for backhaul and fronthaul links in 5G and emerging 6G systems. However, it remains highly vulnerable to environmental impairment, especially in arid regions prone to dust storms. While prior studies have addressed atmospheric effects such as fog and turbulence, the specific impact of dust on signal performance remains insufficiently explored. This work presents a probabilistic modeling framework for evaluating the performance of an intensity modulation/direct detection (IM/DD) FSO system under dust storm conditions. Using a controlled laboratory environment, we conducted measurements of the optical signal under dust-induced channel conditions using real-world dust samples collected from an actual dust storm. We identified the Beta distribution as the most accurate model for the measured signal fluctuations. Closed-form expressions were derived for average bit error rate (BER), outage probability, and channel capacity. The close agreement between the analytical, approximate, and simulated results validates the proposed model as a reliable tool for evaluating FSO system performance. The results show that the forward error correction (FEC) BER threshold of is achieved at approximately 10.5 dB, and the outage probability drops below at 10 dB average SNR.
1. Introduction
Free-space optical (FSO) communication systems have emerged as a pivotal technology in modern wireless communication, offering high data rates, enhanced security, and immunity to electromagnetic interference. The inherent advantages of FSO, such as ease of deployment and high bandwidth capabilities, make it an attractive solution for applications ranging from last-mile connectivity to inter-satellite communications. Recent field trials have demonstrated the potential of FSO communication to achieve terabit-per-second data rates over multi-kilometer distances, highlighting its viability for next-generation communication networks [1]. FSO links are increasingly considered for 5G and 6G networks due to their high capacity, low latency, and rapid deployability, offering a flexible alternative to fiber in dense urban and remote areas. They also support emerging 6G applications such as holographic communication, extended reality, and smart city connectivity [2,3,4,5].
Despite the numerous advantages of FSO systems, their performance is significantly influenced by atmospheric conditions, particularly in arid and semi-arid regions prone to dust storms [6]. Dust particles suspended in the atmosphere can cause scattering and absorption of the optical signal, leading to attenuation and potential link outages. Studies have shown that visibility reduction can severely degrade signal quality during dust storm events, resulting in increased bit error rates and reduced system reliability. This vulnerability requires a comprehensive understanding of dust-induced impairment to ensure the robustness of FSO links in such challenging environments.
The growing interest in FSO communications requires the accurate modeling of signal behavior under dust storm conditions, which remains scarce. Only a few studies have attempted to characterize signal attenuation using probabilistic approaches. In [7], the authors proposed a hybrid FSO/RF system incorporating a random dust attenuation model based on real-time visibility data collected from a meteorological station. However, their work did not include direct measurements of signal attenuation or intensity under dusty conditions, limiting the empirical validation of their model. In another study, Cao et al. [8] employed the radiation propagation method and small angle approximation to analytically model signal attenuation in dusty environments. Their results indicated that the signal attenuation follows a negative exponential distribution. However, both studies fall short of providing a probabilistic model for the irradiance fluctuation of the received signal under dust storm conditions grounded in controlled experimental measurements. This underscores a clear gap in the literature and motivates the need for new models that reflect the statistical nature of dust-induced signal degradation using real-world data.
Using controlled environments for investigating and modeling FSO systems under dust storm conditions was investigated in [9,10,11]. In ref. [9], an indoor experimental setup was constructed to evaluate the effects of varying sandstorm intensities on system parameters such as the quality factor (Q-factor) and bit error rate (BER), revealing significant performance degradation as particle density increases. A similar approach was taken in ref. [10], where a customized indoor chamber was proposed to generate and sustain controlled sandstorm environments over longer durations, offering an enhanced platform for evaluating FSO performance under repeatable conditions. Complementing these laboratory studies, ref. [11] presented a high-speed outdoor FSO experiment conducted under light dust-storm-controlled environment conditions. This study achieved a 1.08 Tbps data rate using a multicarrier full-optical system and investigated practical impairment such as receiver misalignment and solar heating. Collectively, these investigations underscore the important role of controlled laboratory environments in systematically analyzing the performance of FSO communication systems under sandstorm conditions, enabling consistent and repeatable assessment necessary for deployment in dust-prone regions.
In this work, we introduce a novel contribution to the field of FSO communications by developing a probabilistic model for the irradiance fluctuation of the received signal under conditions of dust storms. To our knowledge, this is the first study in the literature to provide a statistically grounded model of signal irradiance fluctuation caused by dust particles. Our approach is based on controlled experimental measurements that capture the variability of the optical signal received during simulated dust storm events. Using the developed model, we derive closed-form expressions for several key performance metrics of FSO communication systems. These include closed-form expressions for the average BER, average channel capacity, and outage probability. Using these expressions, we can assess the reliability and operational feasibility of the FSO system in dust-prone environments.
The remainder of the paper is organized as follows. Section 2 presents the experimental setup and the proposed model. Section 3 discusses the system model and the analysis of the performance metrics. In Section 4, we discuss the performance results. Finally, in Section 5, we conclude the article by summarizing the main findings and describing the directions for future research.
2. Dusty Channel Model
2.1. Experimental Setup
To simulate atmospheric dust conditions under controlled circumstances, a chamber was constructed with dimensions of cm3, as shown in Figure 1a, with complementary front and side views provided in Figure 1b.
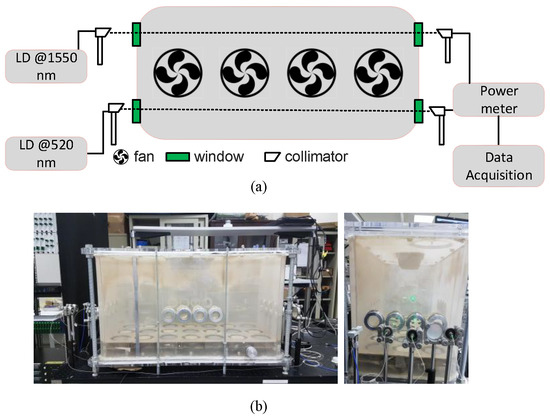
Figure 1.
(a) Experimental setup for measuring the FSO signal fluctuations, (b) chamber side view (left) and front view (right).
This size was selected to provide sufficient propagation length for the optical beam, enable uniform dust dispersion using internal fans, and maintain manageable particle concentrations under safe laboratory conditions. Moreover, this controlled laboratory setup eliminates the need for sporadic and unpredictable natural dust events, enabling continuous data collection for studies of the FSO system. The chosen dimensions are consistent with previously reported FSO experimental setups in the literature, which typically employ chambers with lengths close to 100 cm [9,10,12,13].
For optical signal irradiance fluctuation modeling, a Keysight N7714A laser diode (LD) operating at 1550 nm with an output power of 4 mW was employed. Transparent glass panels were placed at both ends of the chamber to minimize transmission losses. Dust particles were dispersed into the chamber volume via fans mounted at the base of the chamber. The dust sample used in the experiment was collected from a real dust storm and has a 17.3-m average diameter.
Beam propagation in the free space was realized through a pair of identical fiber-coupled collimators with aspheric lenses placed at the chamber input and output windows. Each collimator produced a 3.6 mm diameter beam with a full-angle divergence of 558 rad. The received optical signal was captured and quantified using a Thorlabs PM320E dual-channel power meter.
The received signal was sampled and recorded through a synchronized data acquisition platform. A dataset comprising 160,000 samples was created. For further details regarding the chamber configuration and measurement reliability, please refer to our earlier publication [14].
Although such a chamber does not replicate the full physical scale of outdoor dust storms, it enables precise control of particle density and flow, which is critical for extracting meaningful statistical and physical insights into dust-induced attenuation. Furthermore, in our previous work using this chamber [14], we proposed a deterministic attenuation model for dust-laden FSO channels. This model was later validated through an outdoor FSO experiment conducted under actual dust storm conditions, where the measured attenuation matched closely with the chamber-predicted value (1.0 dB measured vs. 1.6 dB predicted over a 100 m link) [6]. This consistency supports the use of the chamber as a valid platform for simulating the optical effects of large-scale dust storms within a laboratory setting.
2.2. Dusty Channel Model
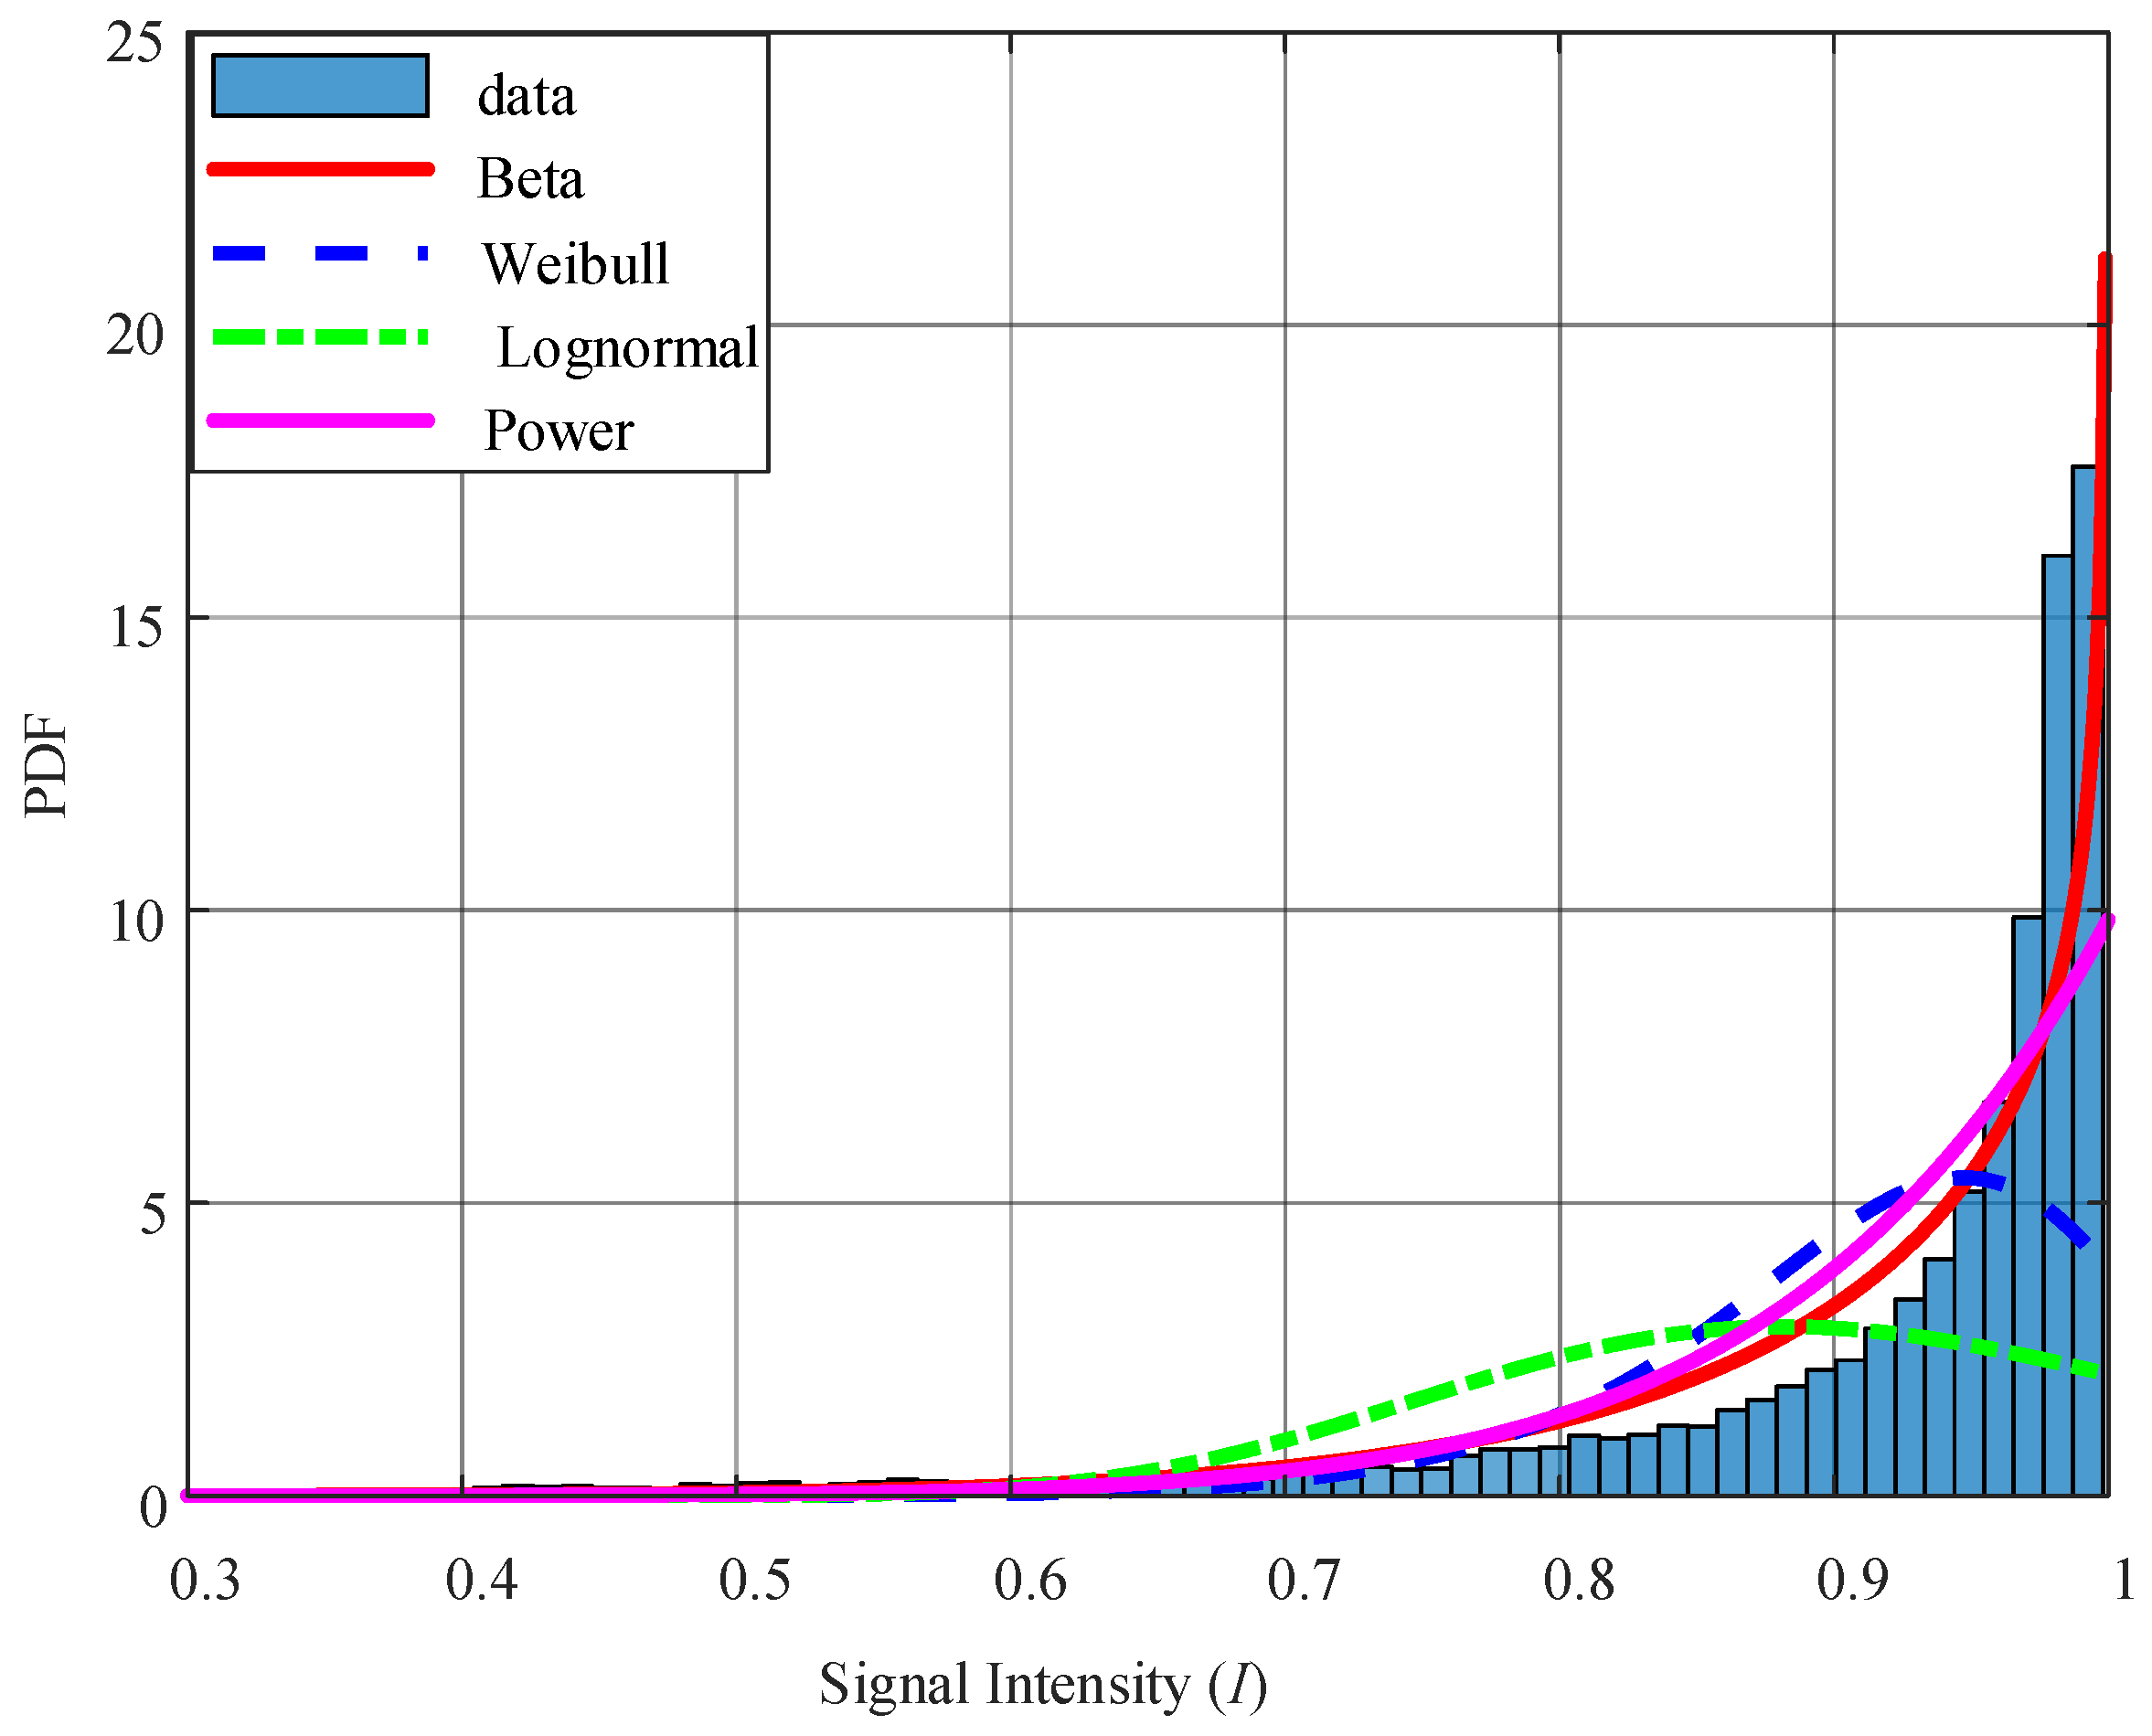
Using the collected data, we analyzed the statistical behavior of the irradiance fluctuation of the received signal under dust storm conditions. To develop a tractable and realistic statistical model, the signal irradiance fluctuations, I, due to the dust-induced fading were normalized by the optical power transmitted during the measurement phase, resulting in a fading variable suitable for probabilistic analysis. Figure 2 presents a comparative analysis between the empirical histogram of normalized signal intensity measurements and the fitted probability density functions (PDFs) of four theoretical models: Beta, Weibull, Lognormal, and Power distributions. The selected distributions reflect key features of the observed histogram, including strong right skewness and bounded support. This approach enables the evaluation of models with diverse shapes and tail behaviors best to capture the underlying statistical characteristics of the data.

Figure 2.
Comparison between the empirical histogram of the measured signal intensity data and the fitted probability density functions (PDFs) of different theoretical distributions.
Among all candidates, the Beta distribution exhibits the best overall fit, closely following the empirical histogram across the full range of data, particularly capturing the steep increase in density near the upper bound (). This alignment confirms the Beta model’s flexibility in modeling bounded and right-skewed data. The Power distribution, while simpler, provides a reasonably good approximation and maintains the general shape of the tail behavior, though it slightly underestimates the peak density near the boundary. In contrast, the Weibull and Lognormal models fail to accurately represent the concentration of data at high-intensity levels, with both displaying broader shapes and heavier central masses that do not reflect the observed distribution.
These discrepancies are further confirmed by two goodness-of-fit metrics: the coefficient of determination () and the root mean square error (RMSE). The coefficient of determination is defined as follows:
where are the measured values, are the predicted values, is the mean of the measured values, and n is the number of observations. The RMSE is given as follows:
A good fit is typically indicated by a high close to 1 and a low RMSE, which reflects minimal deviation between the model and the empirical data. As shown in Table 1, the Beta distribution outperforms the other candidates, achieving the highest value of 0.85 and the lowest RMSE of 1.30, confirming its superior alignment with the observed histogram. The estimated parameters for each distribution are listed in Table 1.

Table 1.
Goodness-of-fit metrics and estimated parameters for fitted distributions.
Using the Beta PDF, the signal irradiance fluctuation under dusty conditions is modeled as follows:
where and are the shape parameters, and is the Beta function, defined as follows:
where is the Gamma function, defined as follows:
The results in Figure 2 show that the fitted Beta distribution has minor deviations from the empirical irradiance histogram, particularly in the high-irradiance region, which includes a sharp peak near the upper bound. This mismatch is not primarily attributable to measurement noise or unaccounted physical effects but rather to the intrinsic shape of the observed data, which is characterized by a pronounced asymmetry with a long left-sided tail and a sharp rise near . Such a distribution is inherently difficult to capture using a single-lobe distribution. Although composite or mixture distributions could improve fitting in this region, our objective in this study was to identify a single, analytically tractable distribution that balances statistical fidelity with mathematical simplicity, allowing closed-form performance analysis.
It is worth mentioning that the statistical distribution of the received irradiance can be influenced by the physical characteristics of the dust particles, such as size distribution, chemical composition, and geometric shape as these factors govern the scattering and absorption behavior of the optical signal. In this study, the dust sample was collected from a real dust storm event and used without modification, resulting in an average particle size of approximately 17.3 µm. The particle properties were kept constant throughout the measurements; however, due to hardware limitations, detailed characterization of the dust composition and morphology could not be performed. Variations in these properties such as smaller particle sizes, different mineral contents, or irregular geometries could lead to different irradiance distributions.
3. System Model and Performance Analysis
We consider an FSO communication system employing intensity modulation with direct detection (IM/DD) and On-Off Keying (OOK) modulation. The received electrical signal is modeled as follows:
where y denotes the output current of the photodetector (in amperes), R is the photodetector responsivity (A/W), and represents the transmitted symbols under OOK modulation conditions with average optical power . The term I denotes the normalized irradiance, representing the atmospheric fading effect due to dust, and n is additive white Gaussian noise (AWGN) modeled as a zero-mean Gaussian random variable with variance . Unlike prior studies that model composite effects such as fog, turbulence, and pointing errors, this work focuses on isolating and rigorously investigating the impact of dust-induced fading under probabilistic modeling conditions. This choice is motivated by the lack of dedicated studies in this domain and the need to understand dust’s standalone influence before considering compound impairment. The model thus serves as a foundational step toward a broader multi-impairment analysis.
The instantaneous electrical signal-to-noise ratio (SNR) at the receiver, conditioned on a realization of the channel gain h, is given by [15]
where the system-dependent SNR scaling factor is defined as
3.1. Average BER Analysis
The conditional BER for OOK modulation in the presence of AWGN is expressed as
where denotes the Gaussian Q-function. The average BER is obtained by averaging over the fading distribution of I:
Using the Chiani approximation for the Q-function [16],
the average BER becomes the following:
The integral of the exponential function multiplied by the Beta PDF is known in closed form as follows [17]:
where is the confluent hypergeometric function of the first kind, defined by the series [18]:
with denoting the Pochhammer symbol, i.e., the rising factorial. Substituting Equation (13) into Equation (12) yields the following:
3.2. Outage Probability Analysis
The probability of outage is a key performance metric in wireless and optical communication systems. It is defined as the probability that the instantaneous SNR falls below a predefined threshold . Mathematically, the outage probability is expressed as follows:
Substituting the definition of the instantaneous SNR, , where is the SNR scaling factor, we get the following:
Equation (17) represents the cumulative distribution function (CDF) of the Beta distribution, which is given as follows:
This integral can be expressed in closed form using the Gaussian hypergeometric function as follows [17]:
where is the standard Gauss hypergeometric function that is defined as follows:
3.3. Average Channel Capacity Analysis
A key performance metric is the average capacity of a wireless channel under fading conditions. For the real-valued channel coefficient I, the channel capacity in bits per second per Hz is given as follows:
The integral in (21) does not generally yield a closed-form expression. However, using Jensen’s inequality [19], an accurate approximation can be obtained by evaluating the function at the mean of :
The second moment of a Beta() distribution is given as follows:
Note that while the Beta distribution provided the best overall fit among the candidate models, its minor deviation from the empirical data in the high-irradiance region may lead to slight differences between the analytically derived expressions presented in this section and practical performance metrics.
4. Results and Discussion
4.1. BER Simulation Results
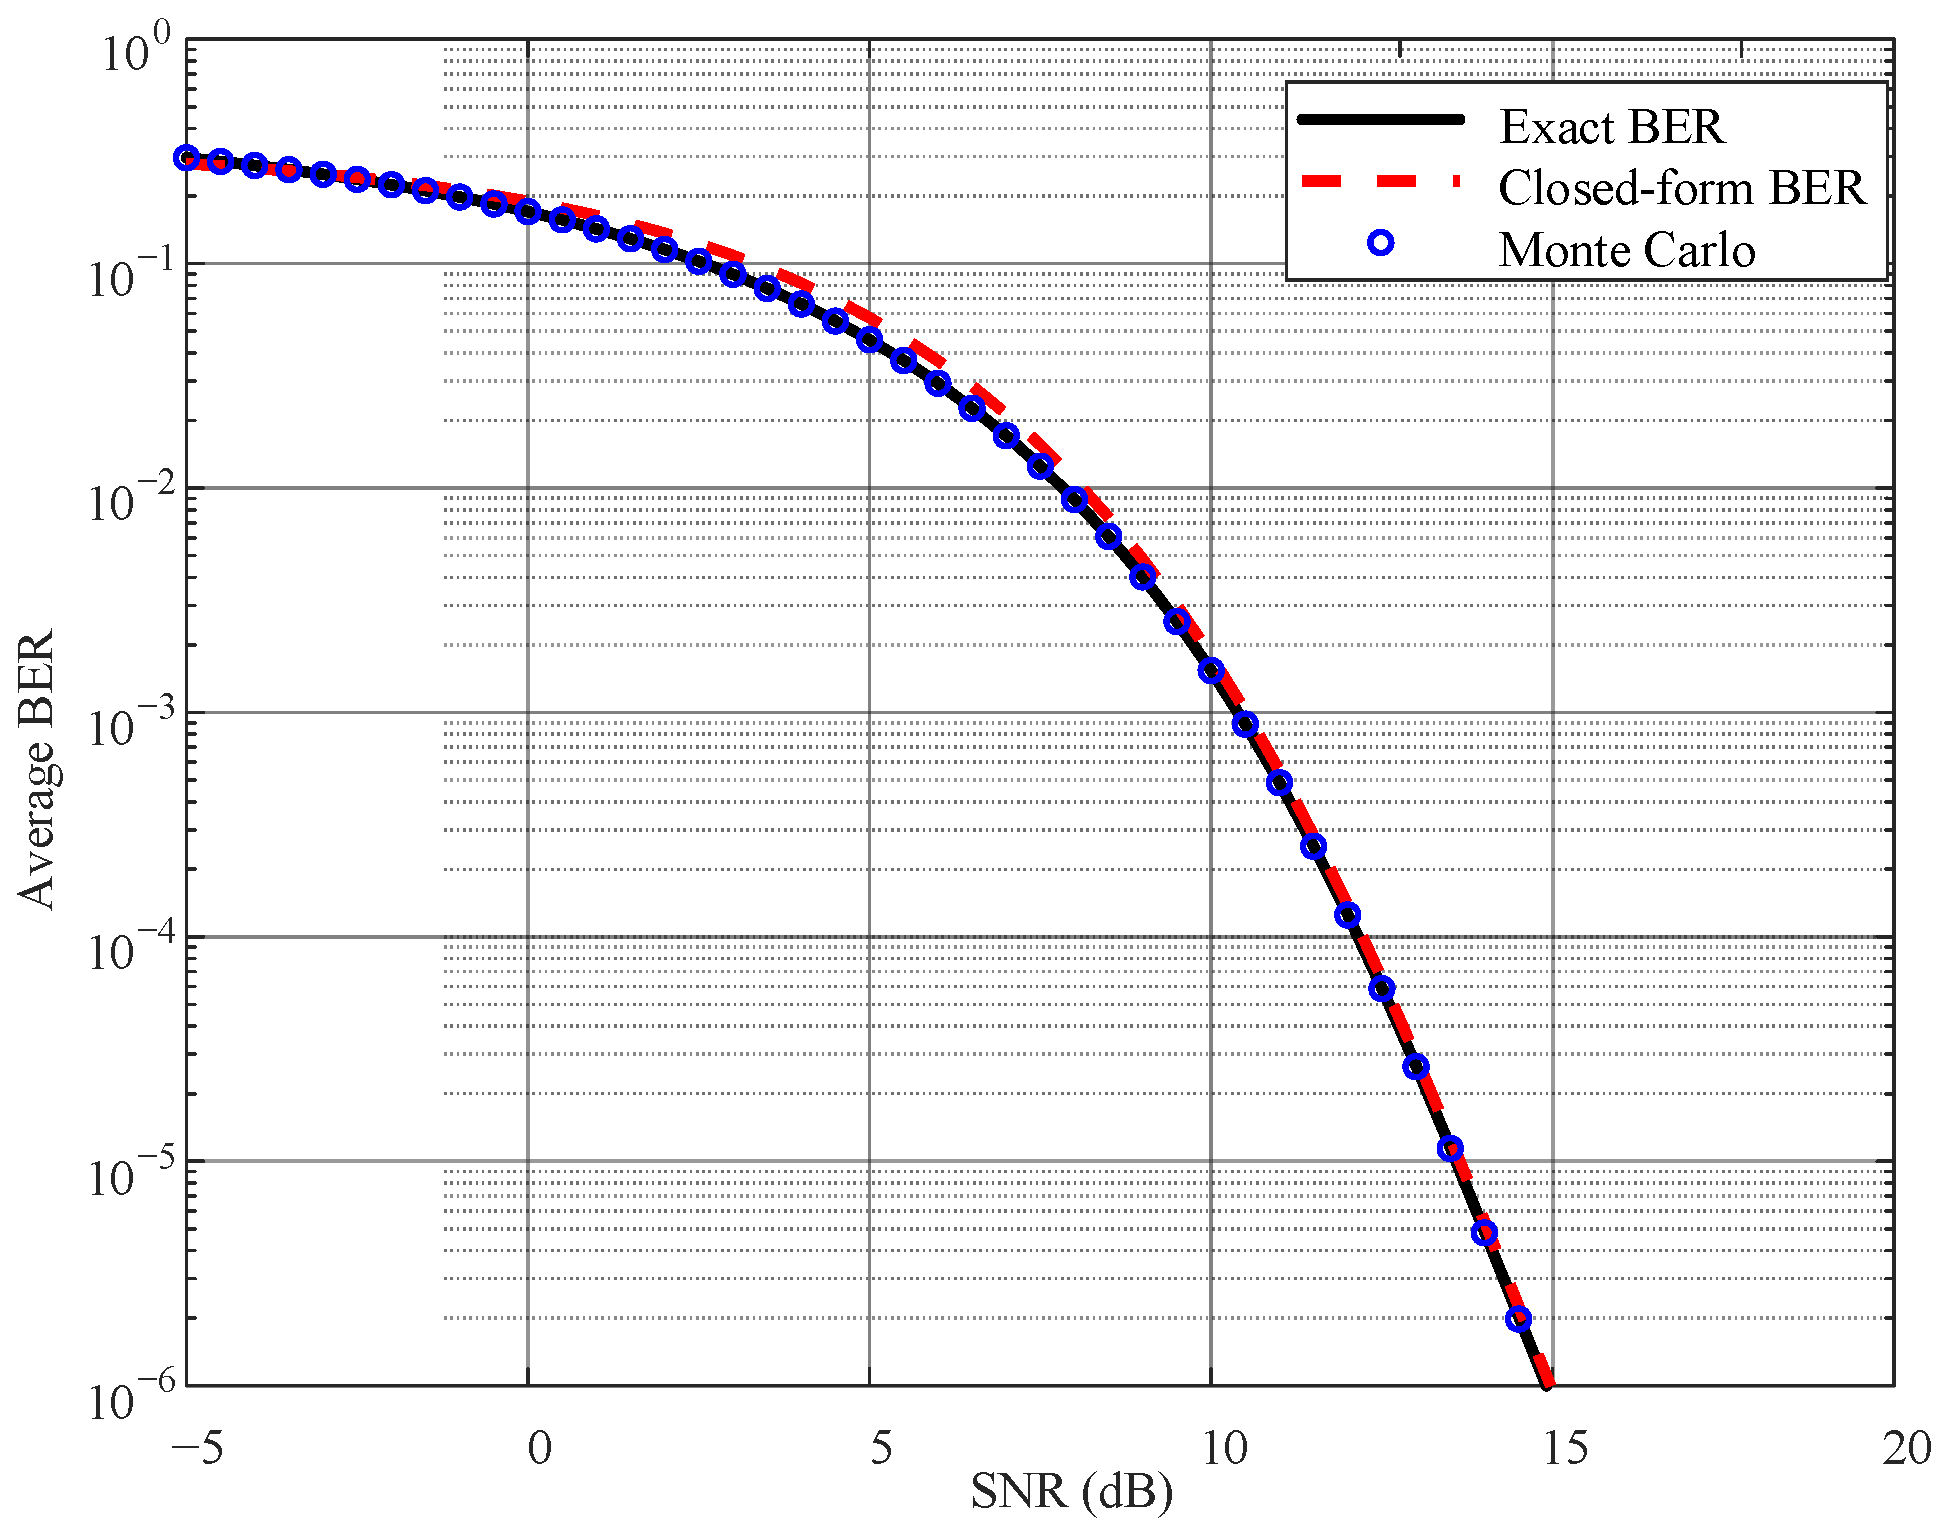
Figure 3 presents the average BER performance as a function of the SNR parameter. The figure includes the closed-form approximate expression in addition to the exact form. Moreover, the Monte Carlo simulation is a benchmark for validating the exact and approximate models. As observed, the approximate BER expression in the closed form closely aligns with the exact results across the entire SNR range, confirming the reliability of the derived expression.
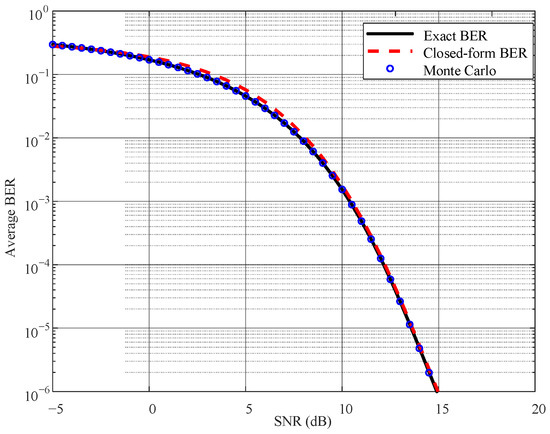
Figure 3.
Average BER performance versus the system SNR.
An important performance threshold in modern communication systems is the forward error correction (FEC) limit, typically set at a BER of . The FEC limit represents the maximum tolerable BER beyond which FEC decoders can no longer reliably correct errors. As observed in Figure 3, the FEC limit is achieved at approximately . This implies that the system should operate with an SNR no lower than 10.5 dB to ensure error rates are acceptable for FEC-assisted decoding.
The approximate BER closed form expression’s robustness across varying SNR conditions and its alignment with both exact and simulated results reinforce its applicability in system optimization, link budget analysis, and adaptive transmission schemes tailored for dynamic dusty environments.
4.2. Outage Probability Simulation Results
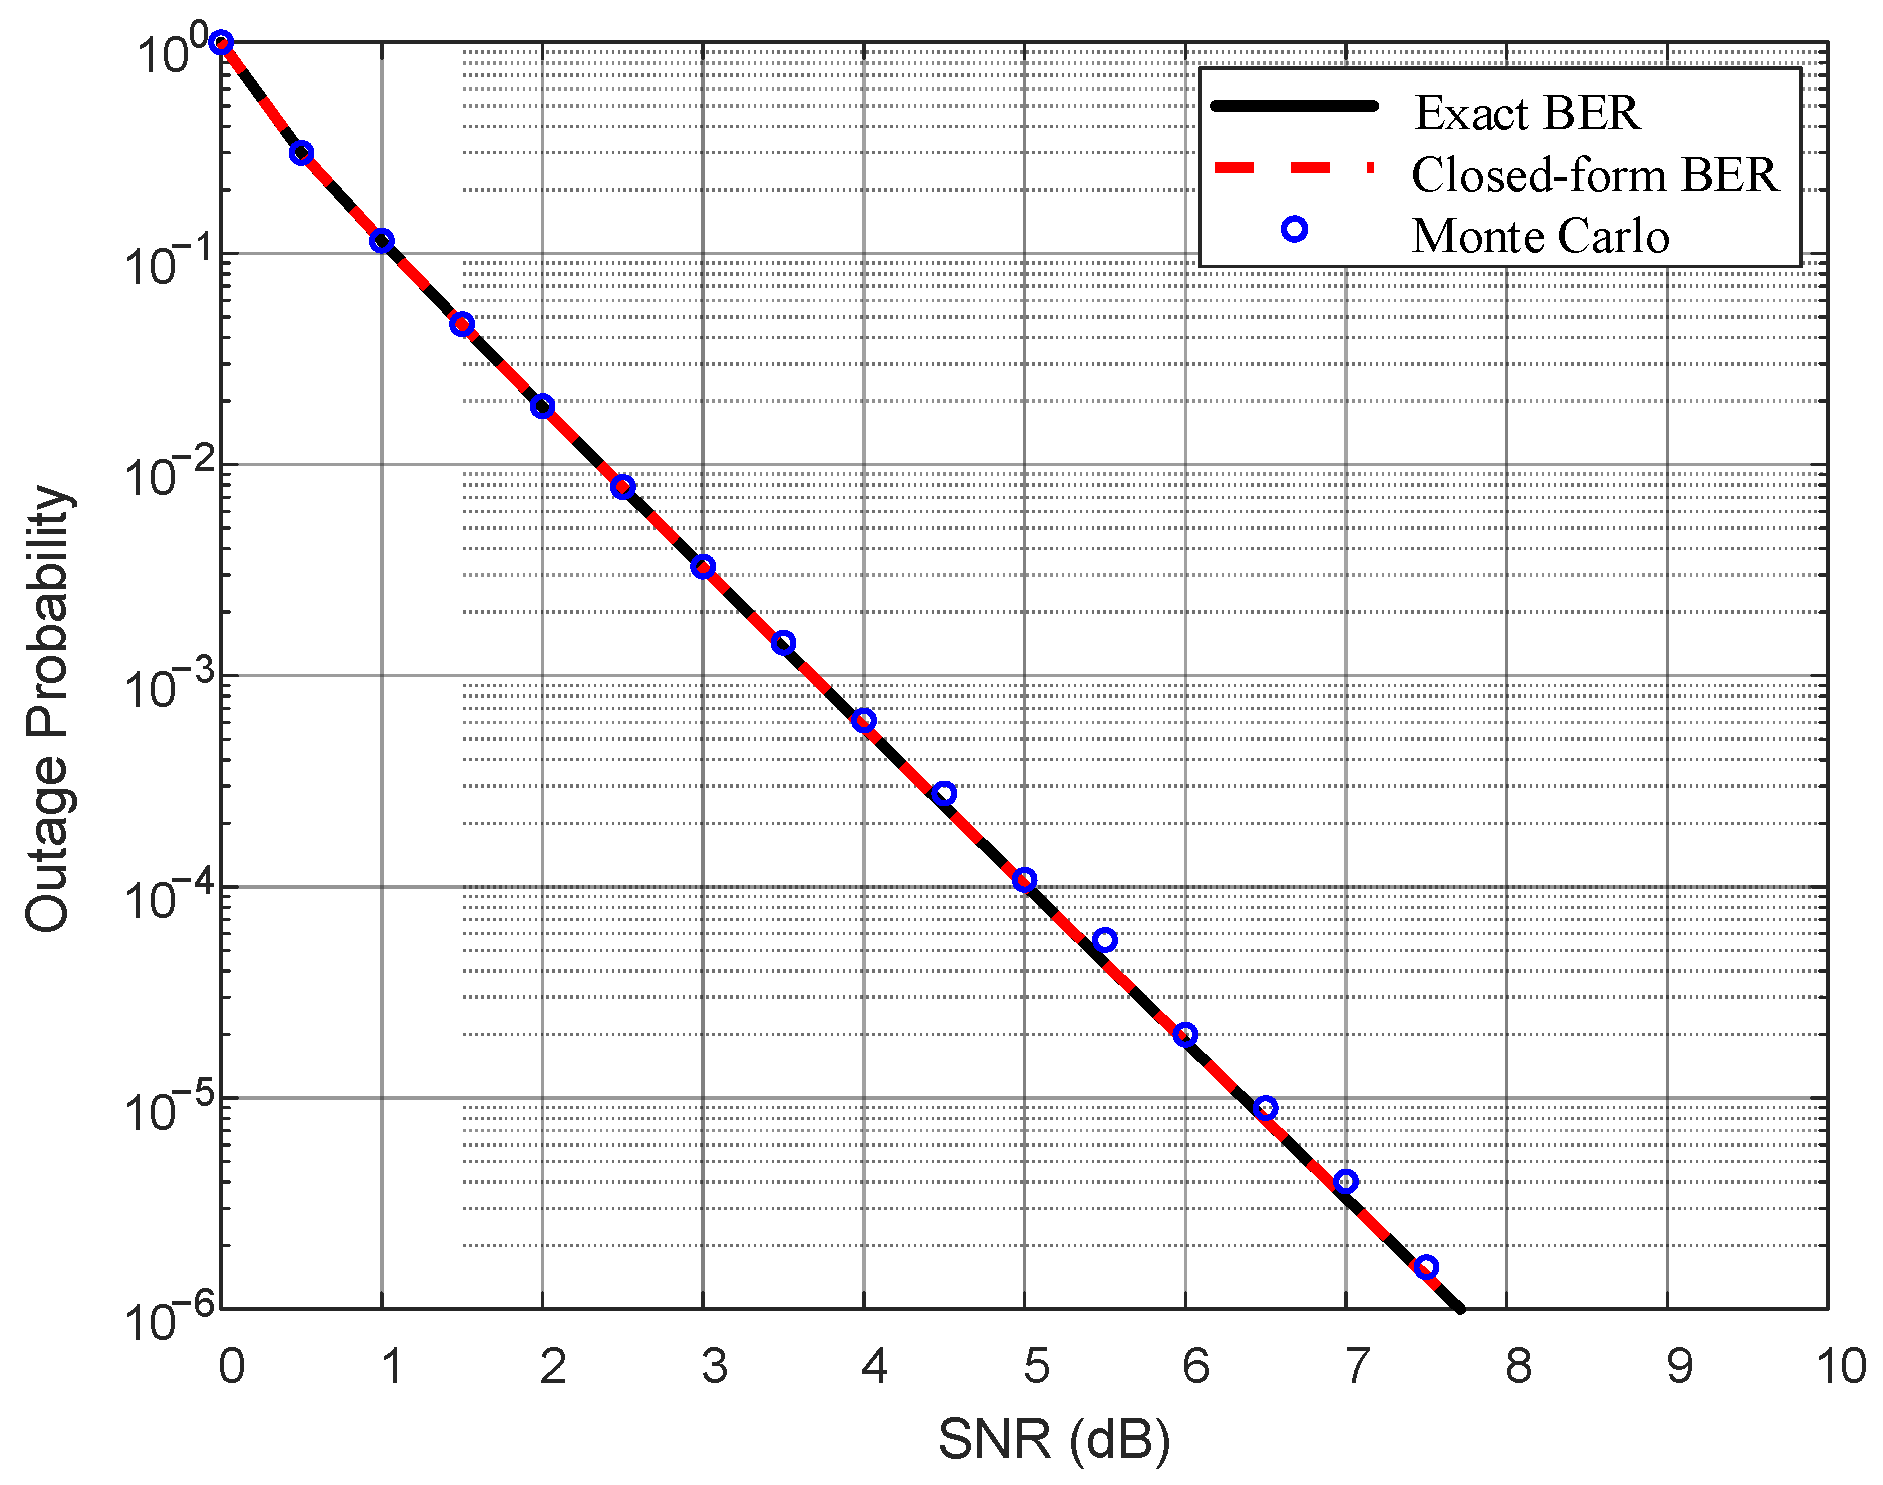
Figure 4 illustrates the outage probability as a function of the average SNR, where the threshold SNR is set to dB. The results show a consistent exponential decay in outage probability with the increase in the SNR, confirming the system’s improved robustness at higher power levels. Notably, the exact analytical expression, the closed-form approximation, and the Monte Carlo simulations exhibit excellent agreement across the entire SNR range. This perfect match justifies the accuracy and the tightness of the derived approximated expression for the outage probability.
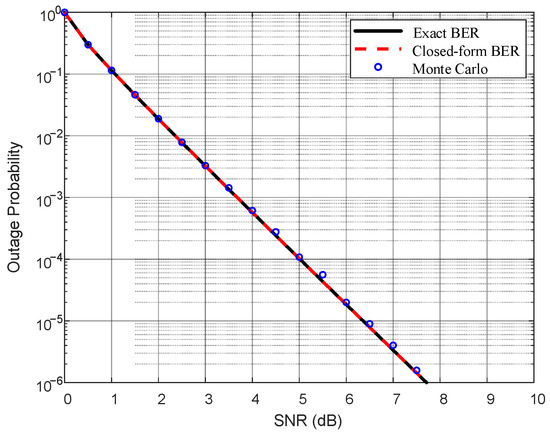
Figure 4.
Outage probability versus the system SNR for a threshold value of dB.
The observed exponential decay in outage probability with the increase in the SNR implies a high sensitivity of outage probability to SNR improvements, meaning minor enhancements in the SNR can significantly reduce the likelihood of communication failure.
Like the BER threshold defined by FEC limits, outage probability follows practical design constraints. A typical target in reliable communication systems is an outage probability below , ensuring that the link remains available for at least 99.9% of the time under average channel conditions. For instance, with an SNR threshold of 1 dB, achieving an average SNR of just 10 dB results in a outage probability—effectively indicating 99.9% link availability. This finding is particularly valuable for planning FSO links and other delay-sensitive applications where even short outages may be detrimental.
4.3. Average Channel Capacity Simulation Results
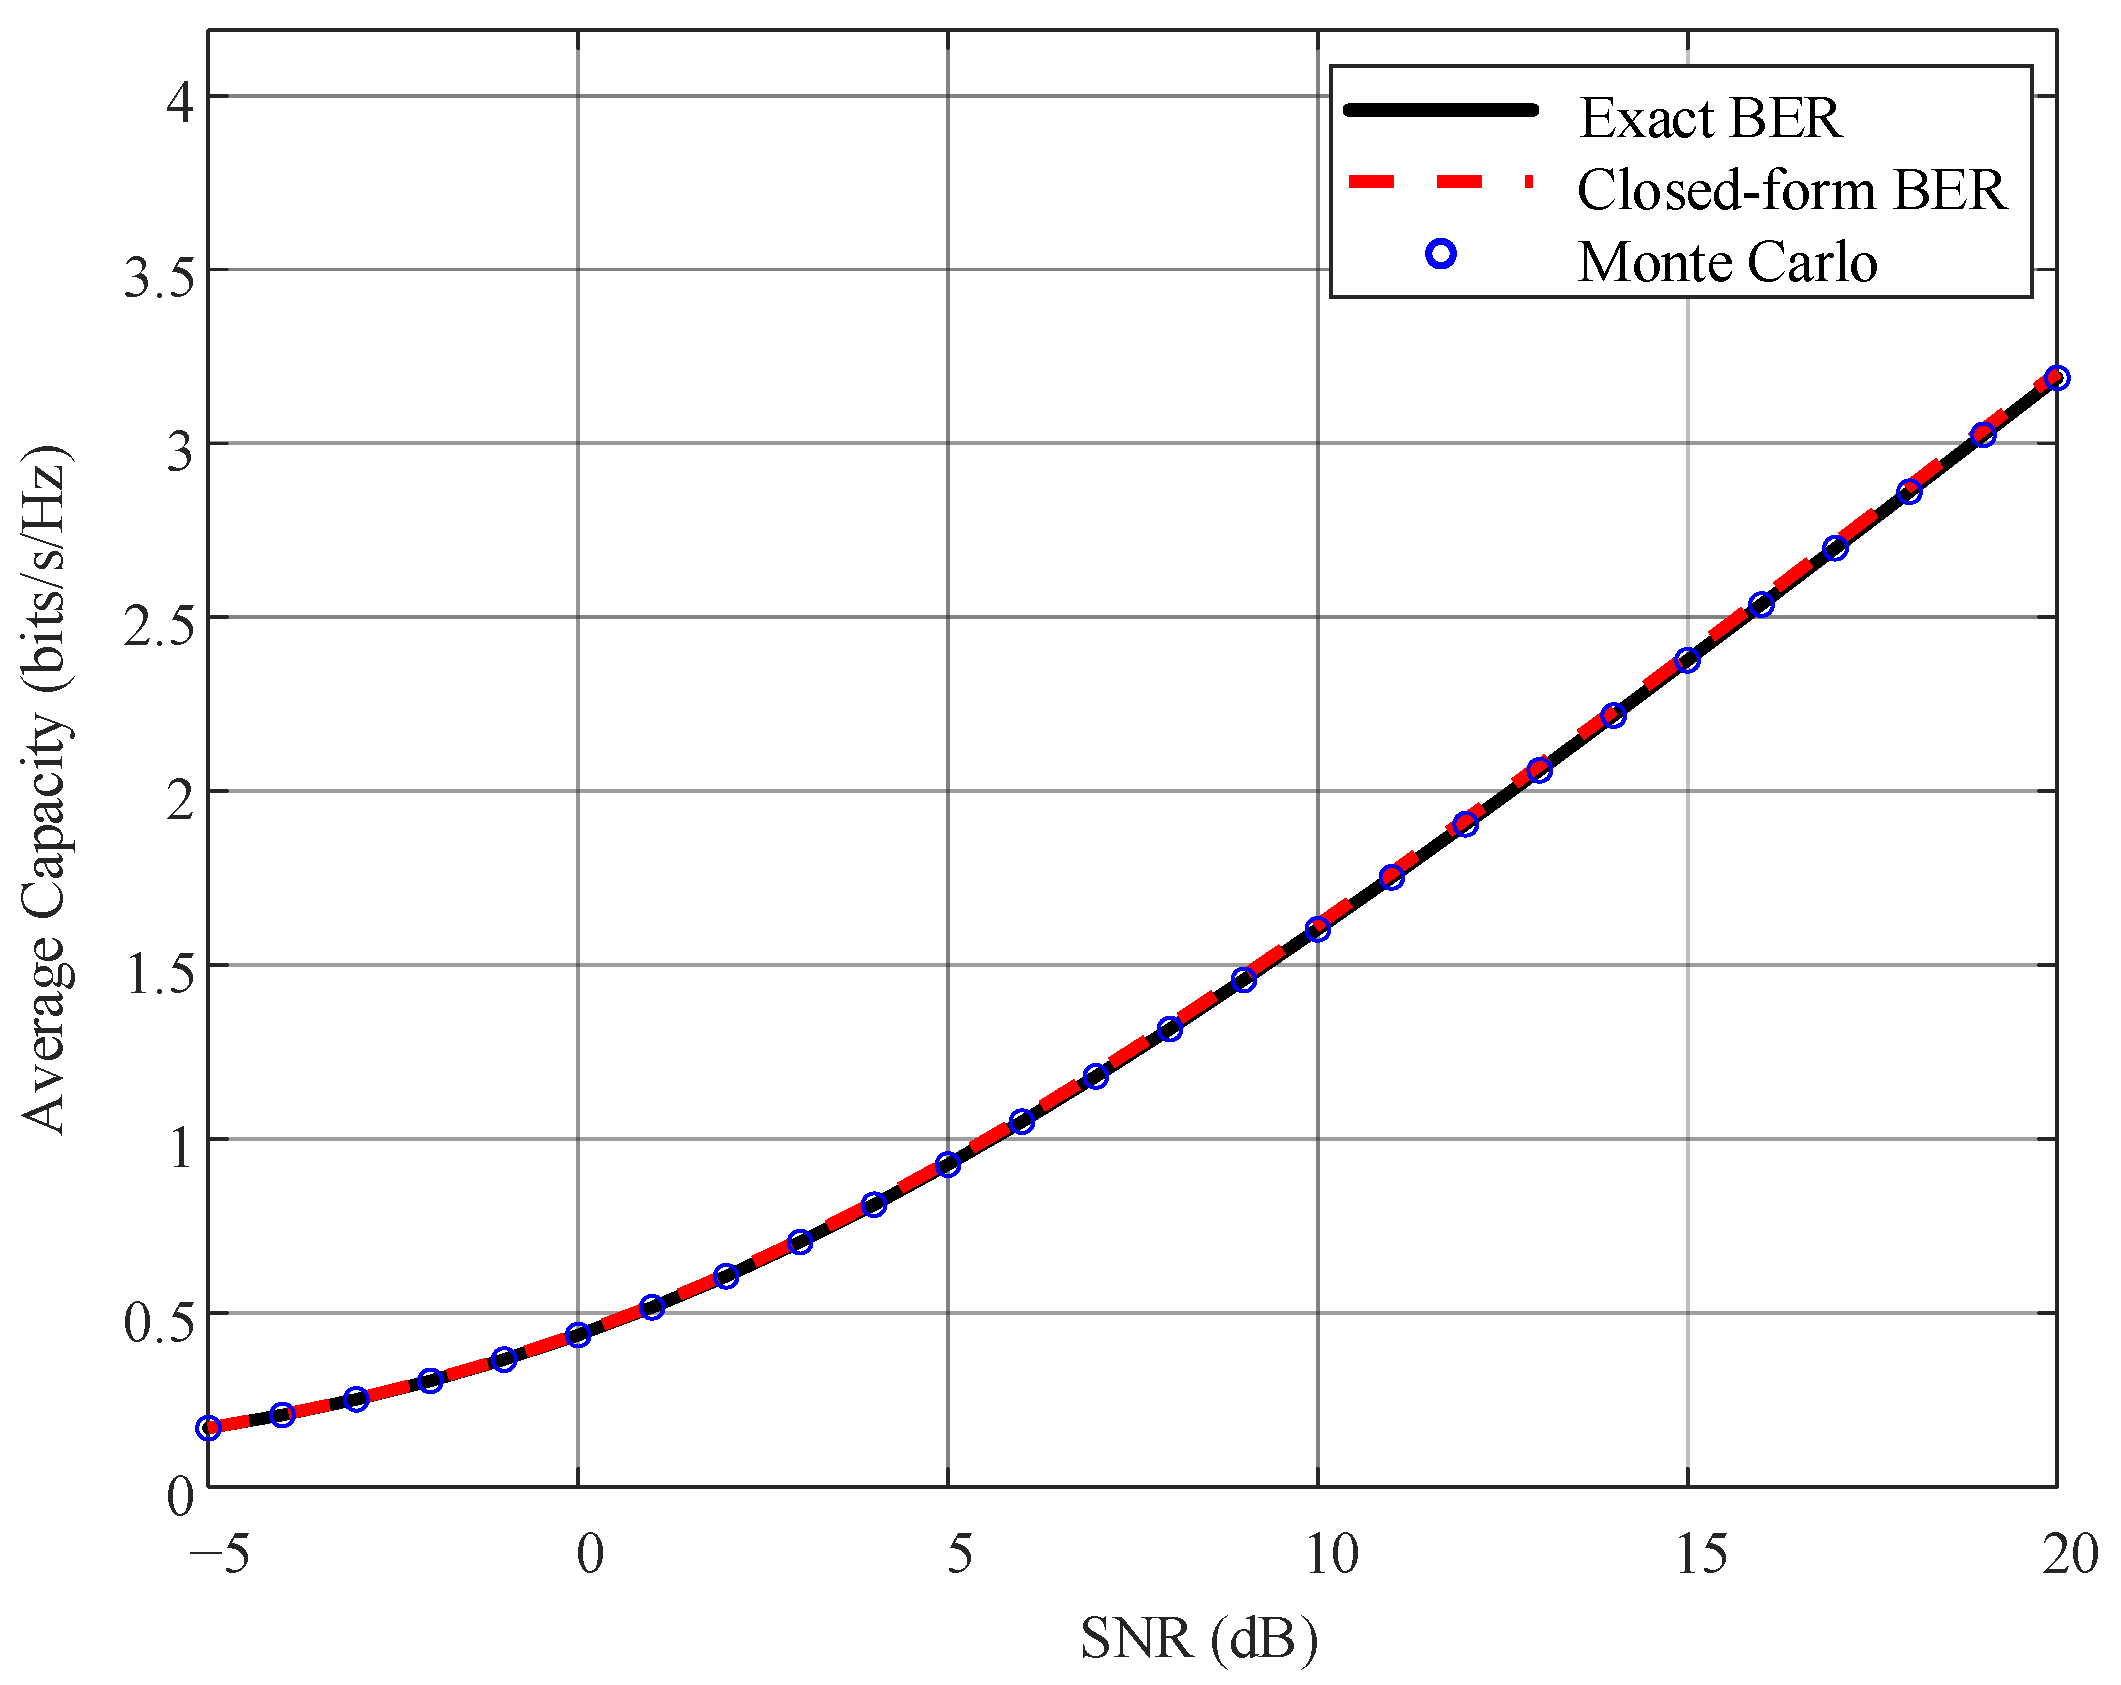
Figure 5 presents the average channel capacity as a function of the SNR in dB. The figure demonstrates that exact expression, closed-form expression, and Monte Carlo simulation are in close agreement throughout the SNR range, confirming the validity and precision of the closed-form expression derived for the average capacity. This makes it particularly useful for system-level analysis where rapid capacity evaluations are required, such as in adaptive modulation or real-time link adaptation strategies.
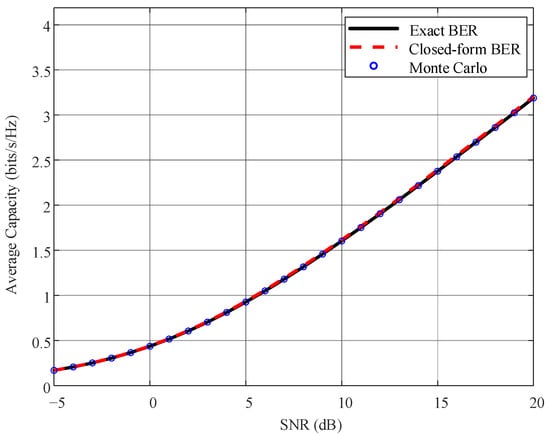
Figure 5.
Average channel capacity versus the system SNR.
The results in Figure 5 indicate that the capacity increases logarithmically with SNR, consistent with Shannon’s capacity formula, indicating higher data rates achievable under improved channel conditions. At low SNR values (below 0 dB), the capacity increases gradually, showing the noise-limited behavior of the channel where improvements in SNR yield only modest gains. Conversely, in the high-SNR region, the logarithmic nature of the curve leads to more substantial gains, demonstrating the benefit of operating in power-rich environments. From a design standpoint, understanding capacity trends across SNR values helps optimize power allocation and guide adaptive coding to meet target data rates.
5. Conclusions
This study presented a probabilistic framework for evaluating the performance of an IM/DD FSO communication system under dust-induced fading conditions. Real dust samples collected from an actual storm were used in a controlled laboratory setup to emulate realistic channel conditions. The measured signal data was statistically analyzed, with the Beta distribution identified as the most suitable model for characterizing dust-induced signal fluctuations. Based on this distribution, closed-form expressions were derived for key performance metrics, including BER, outage probability, and average channel capacity. The analytical results demonstrated close agreement with Monte Carlo simulations across a wide SNR range, validating the accuracy and consistency of the proposed model. Notably, the BER reached the FEC threshold of at approximately 10.5 dB, and the outage probability fell below at an average SNR of 10 dB. Future work will extend this framework to incorporate additional channel impairment such as turbulence and pointing errors, enabling a more comprehensive evaluation of FSO performance under composite environmental conditions. This will support the development of more robust and adaptive FSO systems suitable for deployment in diverse and challenging outdoor scenarios. Moreover, exploring the impact of particle characteristics under controlled dust classifications represents a valuable direction for future research, particularly to generalize the proposed model across different atmospheric dust conditions.
Funding
This article is derived from a research grant funded by the Research, Development, and Innovation Authority (RDIA), Saudi Arabia, under grant number (13292-psu-2023-PSNU-R-3-1-EF). The authors were also supported by the Prince Sultan University, Riyadh, Saudi Arabia.
Institutional Review Board Statement
Not applicable.
Informed Consent Statement
Not applicable.
Data Availability Statement
The raw data supporting the conclusions of this article will be made available by the authors on request.
Acknowledgments
The authors would like to acknowledge the support of Prince Sultan University for paying the Article Processing Charges (APCs) for this publication. Also, the authors would like to thank the RFTONICS center in KSU for accessing their facilities.
Conflicts of Interest
The author declares no conflicts of interest.
References
- Van Vliet, V.; Koelemeij, J.; Elschot, M.; van Groesen, H.; Koonen, T. 5.7 Tb/s Transmission Over a 4.6 km Field-Deployed Free-Space Optical Link in Urban Environment. arXiv 2025, arXiv:2503.21058. [Google Scholar] [CrossRef]
- Othman, W.M.; Ateya, A.A.; Nasr, M.E.; Muthanna, A.; ElAffendi, M.; Koucheryavy, A.; Hamdi, A.A. Key Enabling Technologies for 6G: The Role of UAVs, Terahertz Communication, and Intelligent Reconfigurable Surfaces in Shaping the Future of Wireless Networks. J. Sens. Actuator Netw. 2025, 14, 30. [Google Scholar] [CrossRef]
- Chowdhury, M.Z.; Shahjalal, M.; Hasan, M.K.; Jang, Y.M. The Role of Optical Wireless Communication Technologies in 5G/6G and IoT Solutions: Prospects, Directions, and Challenges. Appl. Sci. 2019, 9, 4367. [Google Scholar] [CrossRef]
- El-Mottaleb, S.A.A.; Singh, M.; Alshathri, S.; El-Shafai, W.; Aly, M.H. Enhancing Security and Capacity in FSO Transmission for Next-Generation Networks Using OFDM/OCDMA-Based ICSM Codes. Front. Phys. 2023, 11, 1231025. [Google Scholar] [CrossRef]
- El-Meadawy, S.A.; Moneim, M.S.A.E.; Badawy, M.S.; El-Mahdy, M.A.; Shabayek, M.S.I. Performance Analysis of 3D Video Transmission Over Deep-Learning-Based Multi-Coded N-ary Orbital Angular Momentum FSO System. IEEE Access 2021, 9, 110116–110136. [Google Scholar] [CrossRef]
- Esmail, M.A.; Ragheb, A.; Fathallah, H.; Alouini, M.S. Investigation and Demonstration of High Speed Full-Optical Hybrid FSO/Fiber Communication System Under Light Sand Storm Condition. IEEE Photonics J. 2017, 9, 7900612. [Google Scholar] [CrossRef]
- Mohamed, P.H.; El-Shimy, M.A.; Shalaby, H.M.; Kheirallah, H.N. Hybrid FSO/RF system over proposed random dust attenuation model based on real-time data combined with G–G atmospheric turbulence. Opt. Commun. 2023, 549, 129891. [Google Scholar] [CrossRef]
- Cao, M.; Zhang, W.; Liu, C.; Fang, D. Performance Evaluation of FSO Communications under Sand-Dust Conditions. Int. J. Antennas Propag. 2019, 2019, 2046896. [Google Scholar] [CrossRef]
- De, S.; Raj, A.A.B. Experimental Study of Sand-Storm Effect on Digital FSO Communication Link. In Proceedings of the 2020 International Conference on Recent Trends on Electronics, Information, Communication and Technology (RTEICT), Bangalore, India, 12–13 November 2020; pp. 35–40. [Google Scholar] [CrossRef]
- Ghassemlooy, Z.; Perez, J.; Leitgeb, E. On the performance of FSO communications links under sandstorm conditions. In Proceedings of the 12th International Conference on Telecommunications, Zagreb, Croatia, 26–28 June 2013; pp. 53–58. [Google Scholar]
- Esmail, M.A.; Ragheb, A.M.; Fathallah, H.A.; Altamimi, M.; Alshebeili, S.A. 5G-28 GHz Signal Transmission Over Hybrid All-Optical FSO/RF Link in Dusty Weather Conditions. IEEE Access 2019, 7, 24404–24410. [Google Scholar] [CrossRef]
- Khan, A.N.; Saeed, S.; Naeem, Y.; Zubair, M.; Massoud, Y.; Younis, U. Atmospheric Turbulence and Fog Attenuation Effects in Controlled Environment FSO Communication Links. IEEE Photonics Technol. Lett. 2022, 34, 1341–1344. [Google Scholar] [CrossRef]
- Zedini, E.; Oubei, H.M.; Kammoun, A.; Hamdi, M.; Ooi, B.S.; Alouini, M.S. A New Simple Model for Underwater Wireless Optical Channels in the Presence of Air Bubbles. In Proceedings of the GLOBECOM 2017—2017 IEEE Global Communications Conference, Singapore, 4–8 December 2017; pp. 1–6. [Google Scholar] [CrossRef]
- Esmail, M.A.; Fathallah, H.; Alouini, M.S. An experimental study of FSO link performance in desert environment. IEEE Commun. Lett. 2016, 20, 1888–1891. [Google Scholar] [CrossRef]
- Farid, A.A.; Hranilovic, S. Outage Capacity Optimization for Free-Space Optical Links With Pointing Errors. J. Light. Technol. 2007, 25, 1702–1710. [Google Scholar] [CrossRef]
- Chiani, M.; Dardari, D.; Simon, M.K. New Exponential Bounds and Approximations for the Computation of Error Probability in Fading Channels. IEEE Trans. Wirel. Commun. 2003, 2, 840–845. [Google Scholar] [CrossRef]
- Abramowitz, M.; Stegun, I.A. Chapter 13: Confluent Hypergeometric Functions. In Handbook of Mathematical Functions with Formulas, Graphs, and Mathematical Tables; Applied Mathematics Series; National Bureau of Standards: Washington, DC, USA, 1964; Volume 55. [Google Scholar]
- Olver, F.W.J.; Lozier, D.W.; Boisvert, R.F.; Clark, C.W. Chapter 13: Confluent Hypergeometric Functions. In NIST Handbook of Mathematical Functions; Cambridge University Press: New York, NY, USA, 2010. [Google Scholar]
- Wei, L.; Yuan, S.S.A.; Huang, C.; Zhang, J.; Bader, F.; Zhang, Z.; Muhaidat, S.; Debbah, M.; Yuen, C. Electromagnetic Channel Modeling and Capacity Analysis for HMIMO Communications. IEEE Trans. Wirel. Commun. 2025, 24, 4500–4514. [Google Scholar] [CrossRef]

Disclaimer/Publisher’s Note: The statements, opinions and data contained in all publications are solely those of the individual author(s) and contributor(s) and not of MDPI and/or the editor(s). MDPI and/or the editor(s) disclaim responsibility for any injury to people or property resulting from any ideas, methods, instructions or products referred to in the content. |
© 2025 by the author. Licensee MDPI, Basel, Switzerland. This article is an open access article distributed under the terms and conditions of the Creative Commons Attribution (CC BY) license (https://creativecommons.org/licenses/by/4.0/).