Abstract
During the last decades, the ever-growing evolution of the construction industry has led to a significant increase in demand for increasingly high-performing construction materials both in terms of mechanical characteristics and sustainability. Focusing on concrete, several researchers have designed different mixes to improve mechanical properties such as compressive strength, workability and durability, and in many of the proposed mixes, the use of industrial waste stands out both for their ability to improve the mechanical properties of concrete and for the importance of their reuse from a sustainability point of view. In this paper, the use of two waste materials, perlite and rhyolite, in concrete mix design was studied in detail, considering their influence on the compressive strength at 7 and 28 days of curing. The waste materials were introduced in the mix design as substitutes for cement in percentages of 15% and 30% in weight. In addition, perlite was micronized to two different particle sizes, 20 μm and 63 μm, respectively, according to what is already used in concrete within perlite in the mix design. The behavior of the structural concrete containing perlite and rhyolite was compared in terms of compressive strength, Young modulus and produced equivalent CO2 with that of a standard C25/30 reference concrete, and with that of a mix design created using other waste materials, namely fly ash, metakaolin and silica fume, considering cement replacements that are always at 15% and 30% by weight. Moreover, ultrasonic testing and rebound hammer tests were run to evaluate a possible relationship between the physical-mechanical properties of the design mixes and their volumetric and surface characteristics.
1. Introduction
During the last few years, the constant evolution of the construction industry and the increasing attention to sustainability has led the building industry sector to study new construction materials, which would respect not only the performance in terms of structural and durability requirements but also the minimum environmental criteria established by the different countries and their regulations. For this reason, the use of industrial waste in the production of construction materials, such as concrete, has been characterized by an outstanding development. Concrete is the most widely used building material, although its production process is one of the most energy-consuming, causing high CO2 emissions in the atmosphere. For this reason, the study of waste materials for use in concrete mix design is ongoing, in order to reduce the exploitation of raw materials and the impact on the atmosphere.
Several researchers have investigated the possibility of using industrial waste in concrete mix design, evaluating the advantages and disadvantages in terms of both mechanical properties and sustainability, the latter especially in terms of CO2 reduction [1,2,3,4,5,6,7]. One of the most important industrial wastes used in concrete mix design is fly ash [8,9]. Nuaklong et al. [10] investigated the strength and post-fire performance of fiber-reinforced alkali-activated fly ash concrete containing granite industry waste. Ho and Huynh [11] analyzed the mechanical properties and the durability of high-strength concrete (HSC) containing fly ash sourced in Vietnam. Magalhães et al. [12] evaluated the influence of Brazilian fly ash on the concrete compressive strength and modulus of elasticity.
Another industrial waste used in concrete mix design is silica fume, used both as cement replacement and as an additive [13,14,15]. Vijayan et al. [16] presented a detailed review of the application of silica fume in concrete mix design, highlighting the advantages of its use in several application fields. In Tak et al. [17], the effects of using silica fume as partial replacement of cement in concrete are investigated, determining that the ideal percentage of silica fume for concrete is approximately 11%. Chishi and Gautam [18] studied the possibility of using silica fume in green cement concrete production, focusing the attention on the sustainability aspect.
In the last years, the use of metakaolin as partial replacement of cement in concrete mix design has undergone an important development as shown by the recent literature [19,20,21]. Kumar et al. [22] analyzed the effects of metakaolin on the mechanical properties and durability of mortar and concrete, showing that metakaolin is a highly reactive pozzolanic material that reacts with calcium hydroxide and produces additional cementitious compounds enhancing the compression strength. Asghari et al. [23] studied the influence of metakaolin on the mechanical properties of self-consolidating concrete, highlighting that metakaolin could be a valuable partial substitute of cement in concrete mix design. In Sankar and Ramadoss [24], the influence of metakaolin on the concrete compressive strength at 28 days is evaluated using statistical techniques such as linear regression, multi-logistic regression, nonlinear regression and response surface methodology.
Fly ash, silica fume and metakaolin are the industrial wastes usually considered in the literature as substitutes for cement in mix designs of structural concrete, and they also find wide application in practice, being admitted by several national and international regulations. Two other possible waste materials to consider are perlite and rhyolite, which however, have been less studied so far compared with the above-mentioned industrial wastes.
Perlite is a natural, amorphous siliceous volcanic rock widely accessible in the world, extensively used in expanded form as aggregate material in concrete or mortar since the 20th century because of its light weight, thermal insulation skill and fire resistance [25,26,27,28]. More recently, some authors have investigated the pozzolanic effect of perlite powder added to concrete and evaluated the pros and cons of its use [29,30]. Stratoura et al. [31] examined the effect of perlite on concrete durability, demonstrating that the mix design provides adequate strength and durability for structural applications. Ramezanianpour et al. [32] investigated the effect of calcined perlite powder, used as a partial replacement of ordinary Portland cement, on the compressive strength and concrete resistance to chloride ions. El Mir and Nehme [33] investigated the use of waste perlite powder, provided by production of the expanded perlite process, at a high content as filler material in self-compacting concrete. Bakhshi et al. [34] analyzed the potential optimization of lightweight-reinforced concrete containing expanded perlite under impact loading. Stefanidou et al. [35] investigated the use of waste perlite products in lime-based mortars and grouts.
Rhyolite is an extrusive igneous rock with a very high silica content. Its use as a concrete component is not as common as perlite. Elsheikh et al. [36] tested the feasibility of using coarse aggregate composed of andesite and rhyolite to produce a green high-strength self-compacting concrete. Karahüseyin and Erdoğdu [37] performed an experimental study where mortar mixtures were produced by substituting cement with rhyolite and metakaolin at different ratios by weight of cement in view of preventing delayed ettringite formation in the long term. Abdelfattah et al. [38] investigated the applicability of perlite and rhyolite tuff as additives materials in lightweight aggregates (LWAs) production, explaining how the high amorphous content can improve the bloating properties of expandable clays and the properties of the LWAs produced. In Baki et al. [39], the pozzolanic activities of ground trachyte and rhyolite in mortars were investigated comparatively by several methods, concluding that the ground trachyte may be utilized as a pozzolanas in the cement industry, while the ground rhyolite does not meet some limits prescribed by the related standard.
It is important to highlight that perlite and rhyolite are not generally used in the structural concrete mix design as partial replacement of cement because they do not have the same physical-mechanical characteristics as other industrial waste materials such as metakaolin, fly ash and silica fume, already widely studied and adopted by the product standards.
Furthermore, as reported in [40], the use of rhyolite with reactive silica in the concrete mix design may cause an alkali-silica reaction. For this reason, in some cases, calcium nitrate is added [41].
The results achieved up to now demonstrate that the use of perlite secondary products and rhyolite in building materials such as mortar and concrete is feasible. However, the possibility of their use as a partial replacement of cement in structural concrete mix design still remain an open issue. Despite the growing interest in using perlite and rhyolite in concrete, there is a limited amount of research specifically addressing their effectiveness as partial cement replacements in structural concrete, particularly with respect to their impact on both mechanical and environmental performance. This study aims to fill this gap by providing a detailed evaluation of their properties in concrete mix design.
In this frame, this paper presents the results of an extensive campaign of laboratory tests aimed at evaluating the influence of the use of perlite and rhyolite as partial replacement of cement in structural concrete mix design. Effects on the compressive strength and modulus of elasticity are discussed and compared with the results obtained using (i) fly ash, (ii) metakaolin and (iii) silica fume as other cement replacement materials [42,43,44]. The results are also compared with a reference mix (M0) of standard C25/30 concrete. In particular, two different cement substitution percentages, 15% and 30%, are considered when evaluating the compressive strength after 7 and 28 days, and two different particle sizes, 20 μm and 63 μm, are considered when using perlite. Moreover, two non-destructive tests, ultrasonic testing [45,46] and the rebound hammer test [47], have been carried out on the specimens to evaluate whether possible inner or superficial properties could affect the mechanical and physical properties of the concrete. The results show that the compressive strength, and to a lesser extent the modulus of elasticity, are influenced by the type of industrial waste used, by the percentage of substitution and by the degree of micronization. In particular, while the mix designs with perlite, especially in low percentages of substitution, allow us to achieve physical-mechanical performances comparable with those of the other mixes analyzed and adequate for structural concrete, the mix designs containing rhyolite offer low performances, making the use of rhyolite as a substitute for cement still questionable. In addition, an analysis of the equivalent CO2 produced by the mix designs considered was carried out, highlighting that the use of industrial waste generally leads to a reduction, often significant, of harmful emissions, and that perlite offers a good compromise between mechanical performance and reduction of the impact on the atmosphere.
After this brief introduction, Section 2 presents the experimental program, followed by the results in Section 3. The analysis and discussion are covered in Section 4, with the environmental impact evaluation in Section 5. Finally, some conclusive remarks are drawn in Section 6.
The main goal of this research work is to evaluate the possible use of perlite secondary products and rhyolite in the mix designs of structural concrete as partial replacement of cement to improve the sustainability level of the construction.
2. Experimental Program
2.1. Materials
The experimental program provides the casting of class C25/30 concrete, using several waste materials as a binder to partially replace cement [48]. A Portland-limestone cement type CEM II/B-LL 42.5 R has been used [49], along with a coarse aggregate having a maximum size equal to 25 mm. The water absorption and specific gravity of aggregate are 0.81% and 2.7, respectively. The characteristics of fine aggregate (sand) are as follows: maximum size 1.5 mm, water absorption 1.42%, specific gravity 2.67 and fineness modulus 2.8.
The selected waste/by-product materials are:
- (i)
- Perlite (PE): It is a natural, lightweight, inert and fireproof volcanic rock used for a wide variety of end uses, from cosmetics to construction. In expanded form, perlite offers thermal insulation, fire resistance and other desirable properties when used in Portland cement-based plaster [25]. Perlite is a non-crystalline glass with a typical composition including 70–75% silicon dioxide (SiO2), 12–15% aluminum oxide (Al2O3), 3–5% potassium oxide (K2O), 3–4% sodium oxide (Na2O) and traces of iron oxide, magnesium oxide and calcium oxide. In this study, the perlite has been used in its natural form, micronized into two different particle sizes: 20 μm (μ20) and 63 μm (μ63), according to previous research works.
- (ii)
- Rhyolite (RIO): It is a highly silicic, fine-grained, light-colored volcanic or extrusive igneous rock. It is a felsic rock with mainly quartz, alkali feldspar, plagioclase and minor ferromagnesian minerals content. During the mining of raw perlite, there is a possibility of encountering rhyolite, which is similar to perlite but has higher silica content and lower water content. Its use in construction is not as common as perlite, so this aspect will be further explored in this work.
- (iii)
- Fly ash (FA): It is a waste product derived from the coal combustion process, generally used for electricity production. Its composition can vary depending on the source and composition of the coal being burned, and it includes silicon dioxide (SiO2), aluminum oxide (Al2O3) and calcium oxide (CaO). Nowadays, it is widely used in concrete production as a component of cement clinker.
- (iv)
- Silica fume (SF): It is a by-product of the production of elemental silicon or ferrosilicon alloys in electric arc furnaces, and because of its extreme fineness and high silica content, silica fume is a very effective pozzolanic material commonly used as binder in the concrete mix design.
- (v)
- Metakaolin (CA): it is a cementitious material representing one of the other kinds of supplementary cementitious and most effective pozzolanic materials used for reducing the cement content from concrete and mortar. Its production requires less energy for the de-carbonation of limestone, and it releases a smaller amount of CO2 compared with cement production [50].
Two different substitution percentages, 15% and 30%, with respect to the cement weight, have been used to assess the impact of the waste materials in the mix design on the concrete compressive strength, measured after 7 and 28 days of curing.
Table 1 summarizes the different mix designs (referred to 1 m3 of fresh concrete) investigated in this research work, where w/c is the water/cement ratio.

Table 1.
Mix designs.
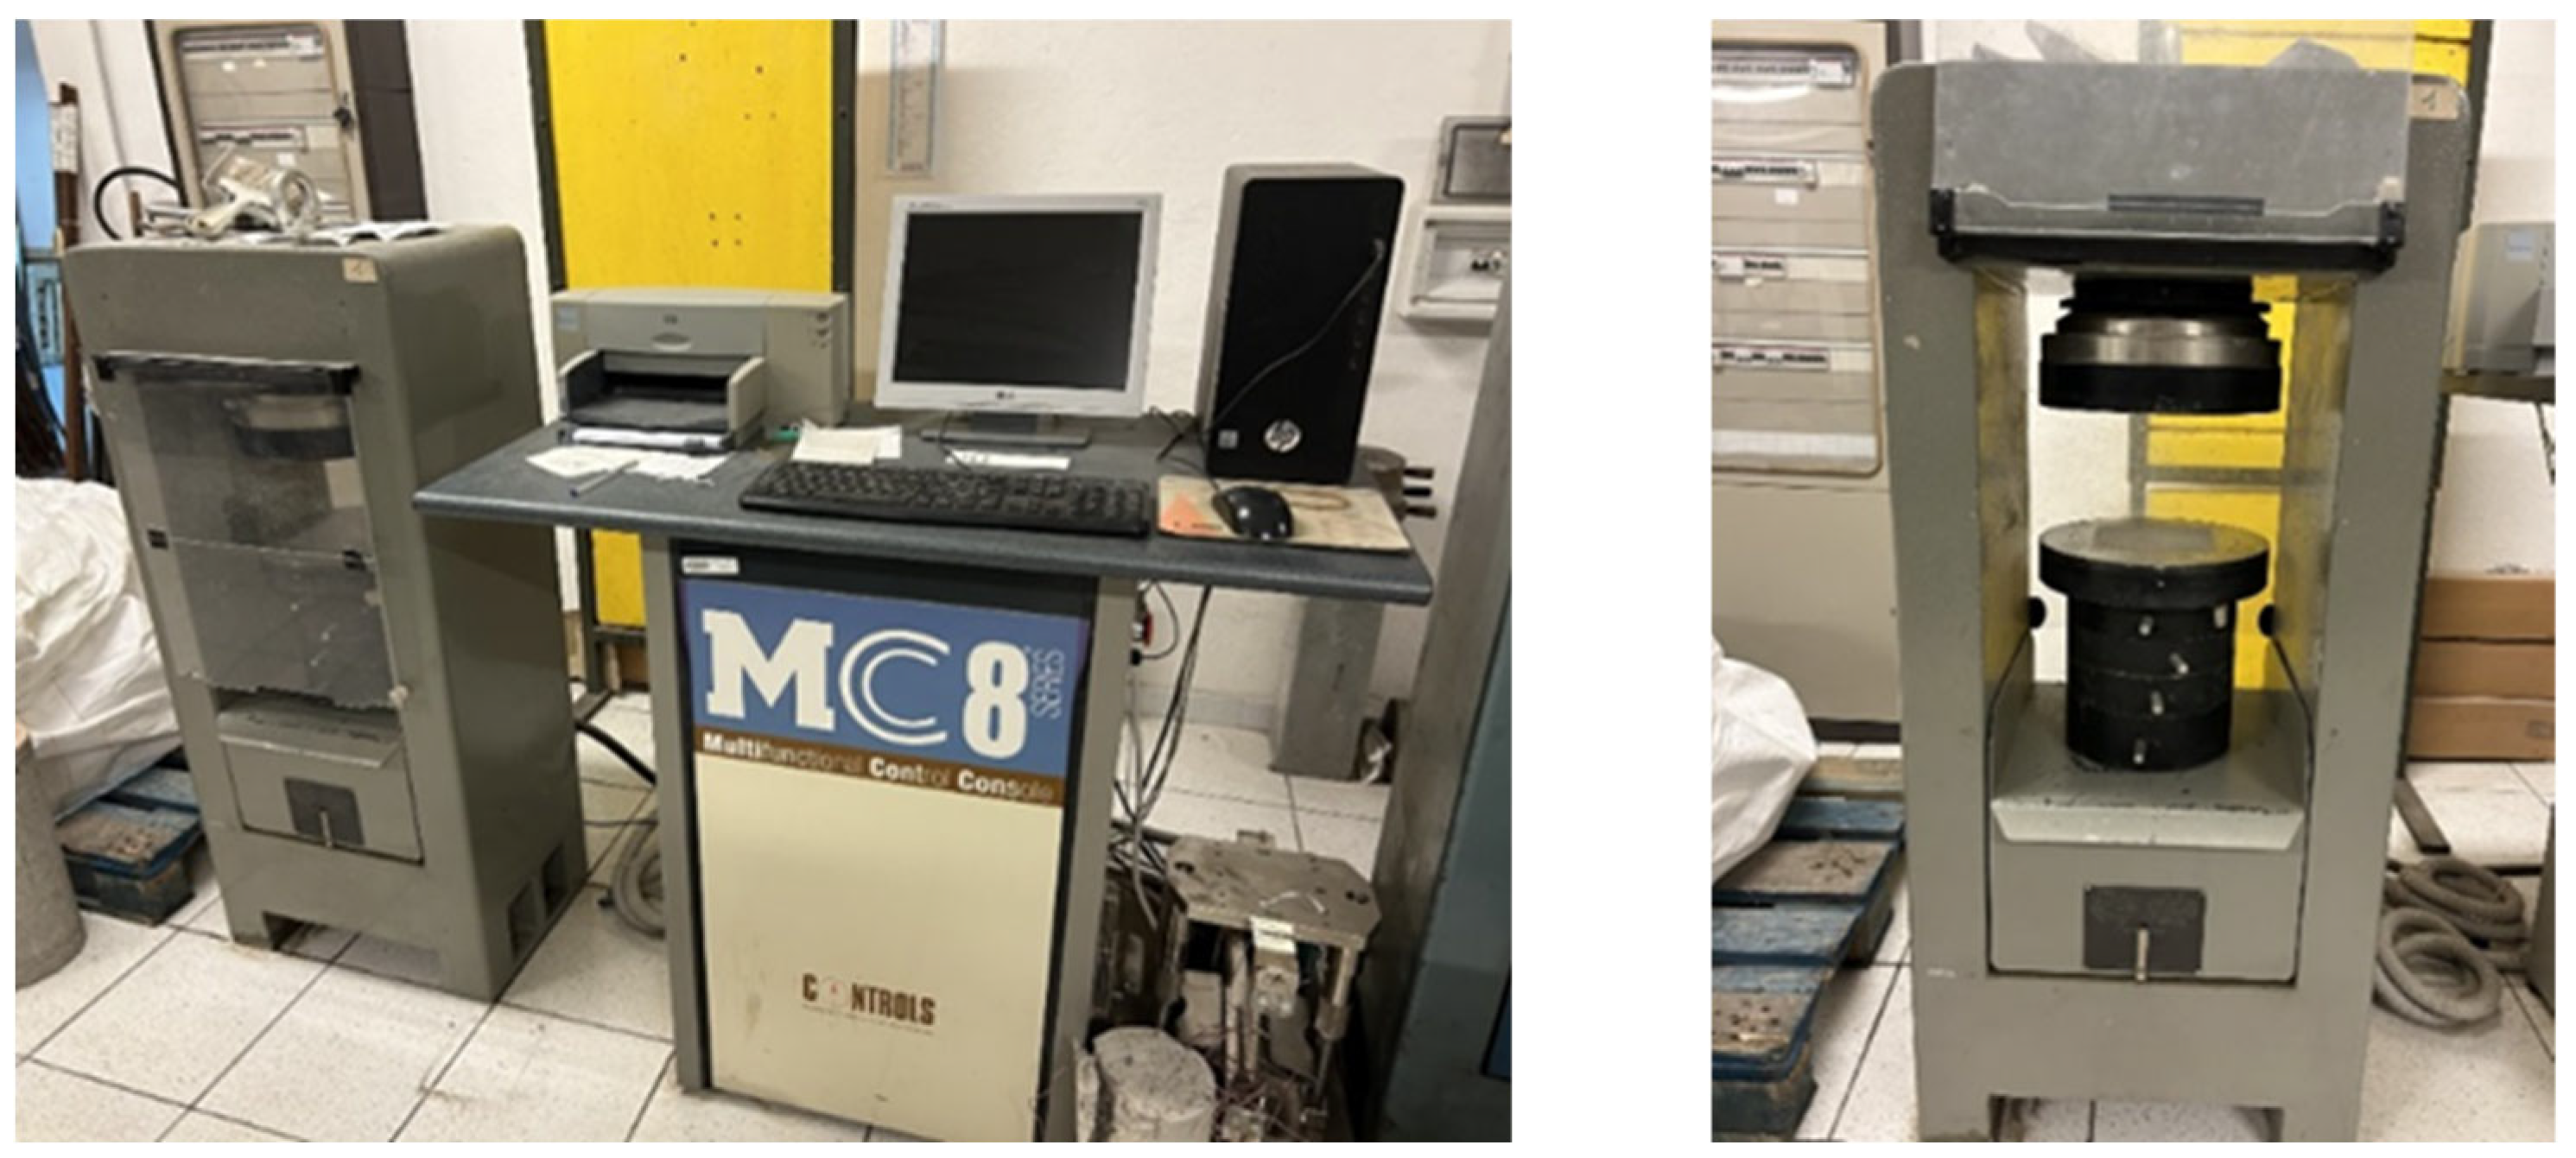
A total of 78 concrete specimens (six for each mix design, three for each ageing), having dimensions 150 × 150 × 150 mm3 according to [48], have been manufactured in the Material Testing Laboratory of the University of Cagliari—Italy. After the cast, the specimens have been stored in a humidity- and temperature-controlled room until the compression tests, which have been performed according to [44] by means of an MC8 Series multifunctional control console (Figure 1) having a maximum load capacity of 3000 kN.

Figure 1.
MC8 series multifunctional control console.
Before the compression tests, aiming to understand if the mix designs could somehow affect physical/mechanical characteristics of concrete, two non-destructive tests (NDTs) were performed after 7 and 28 days of curing. Specifically, ultrasonic testing (UT) and the rebound hammer test (RHT) were carried out on each specimen according to the reference standards [45,47], respectively. Data processing and calculations were performed by means of Microsoft 365 Excel 2025 software.
2.2. Ultrasonic Testing
UT has been performed by means of the direct method (Figure 2) according to [46]. Pulses of longitudinal stress waves, generated by an electro-acoustical transducer (emitter), that is held in contact with one side of the concrete specimen, are received and converted into electrical energy by a second transducer (receiver), located on the opposite side of the specimen. The transit time T that the waves need to run from the emitter to the receiver is measured.
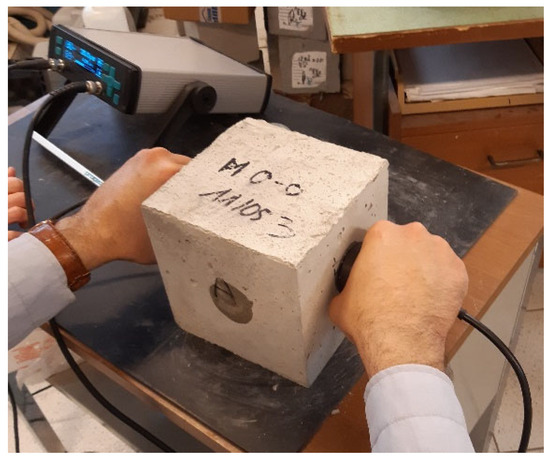
Figure 2.
Ultrasonic test.
The ultrasonic pulse velocity V (m/s) is calculated from the ratio:
where L (m) is the wave path length, assumed as the distance between the emitter and the receiver (in this case, the side length of the cube, L = 0.015 m), and T (s) is the transit time measured by the instrumental set.
The pulse velocity V of longitudinal stress waves in a concrete mass is related to its elastic properties and density according to the following relationship [46]:
where: Edyn is the dynamic modulus of elasticity, μ is the dynamic Poisson’s ratio and ρ is the density.
UT is applicable to assess the uniformity and relative quality of concrete, to indicate the presence of voids and cracks and to evaluate the effectiveness of crack repairs. Moreover, by applying Equation (2), it is possible to evaluate Edyn when ρ and μ are known parameters.
The pulse velocity is independent of the dimensions of the test object provided reflected waves from boundaries do not complicate the determination of the arrival time of the direct one. To avoid this problem, the measurements of the transit time were taken on two opposite surfaces of the cube and the transducers were positioned along a straight line passing through the center of the surfaces. Additionally, to avoid measurements errors due to a bad coupling of the transducers to the concrete surfaces, a specific ultrasonic gel was applied. The device used was a PunditLab by Proceq equipped with two 54 kHz transducers for emitting and receiving the ultrasonic waves.
2.3. Rebound Hammer Test
The RHT provides an easy and speedy assessment of the uniformity of concrete on-site and, with suitable correlation, it can give an estimate of on-site compressive strength. The test can be used for comparative testing, referenced against concrete with known strength or against a concrete, where it has been shown that it has come from a defined volume of concrete with a population verified as conforming to a particular strength class [48]. The principle of the test is based on a mass propelled by a spring that strikes a plunger in contact with the surface of the structural element or specimen to be tested. When the plunger is pressed against the concrete surface, a spring-controlled mass strikes the surface, and the rebound distance is measured, providing an estimate of surface hardness. The measured value, the rebound number (RN) or rebound index (RI), is obtained from a graduated scale on the device. Concrete with lower strength and stiffness tends to absorb more energy, resulting in a lower rebound value. Tests were carried out according to [47] on two opposite sides of each specimen that were smooth and without rough texture or high porosity (Figure 3). The RN has been calculated as the median of a minimum of nine valid measurements of each side of the specimen. A type N concrete hammer having an impact energy of 2207 Nm has been used.
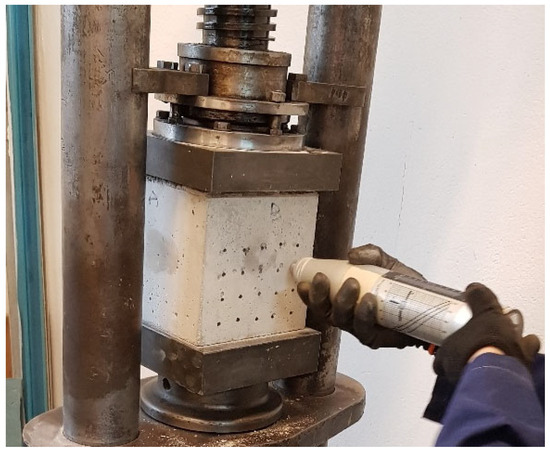
Figure 3.
Rebound hammer test.
3. Results
3.1. Compression Tests
Before testing, the 78 specimens were measured and weighed. Table 2 reports the samples weight at 7 and 28 days, while Table 3 and Table 4 summarize the density at 7 and 28 days of curing, respectively. The labeling used in these tables follows that of Table 1, and SD is the standard deviation and COV is the coefficient of variation.
Table 2.
Sample weights.
Table 3.
Density at 7 days.
Table 4.
Density at 28 days.
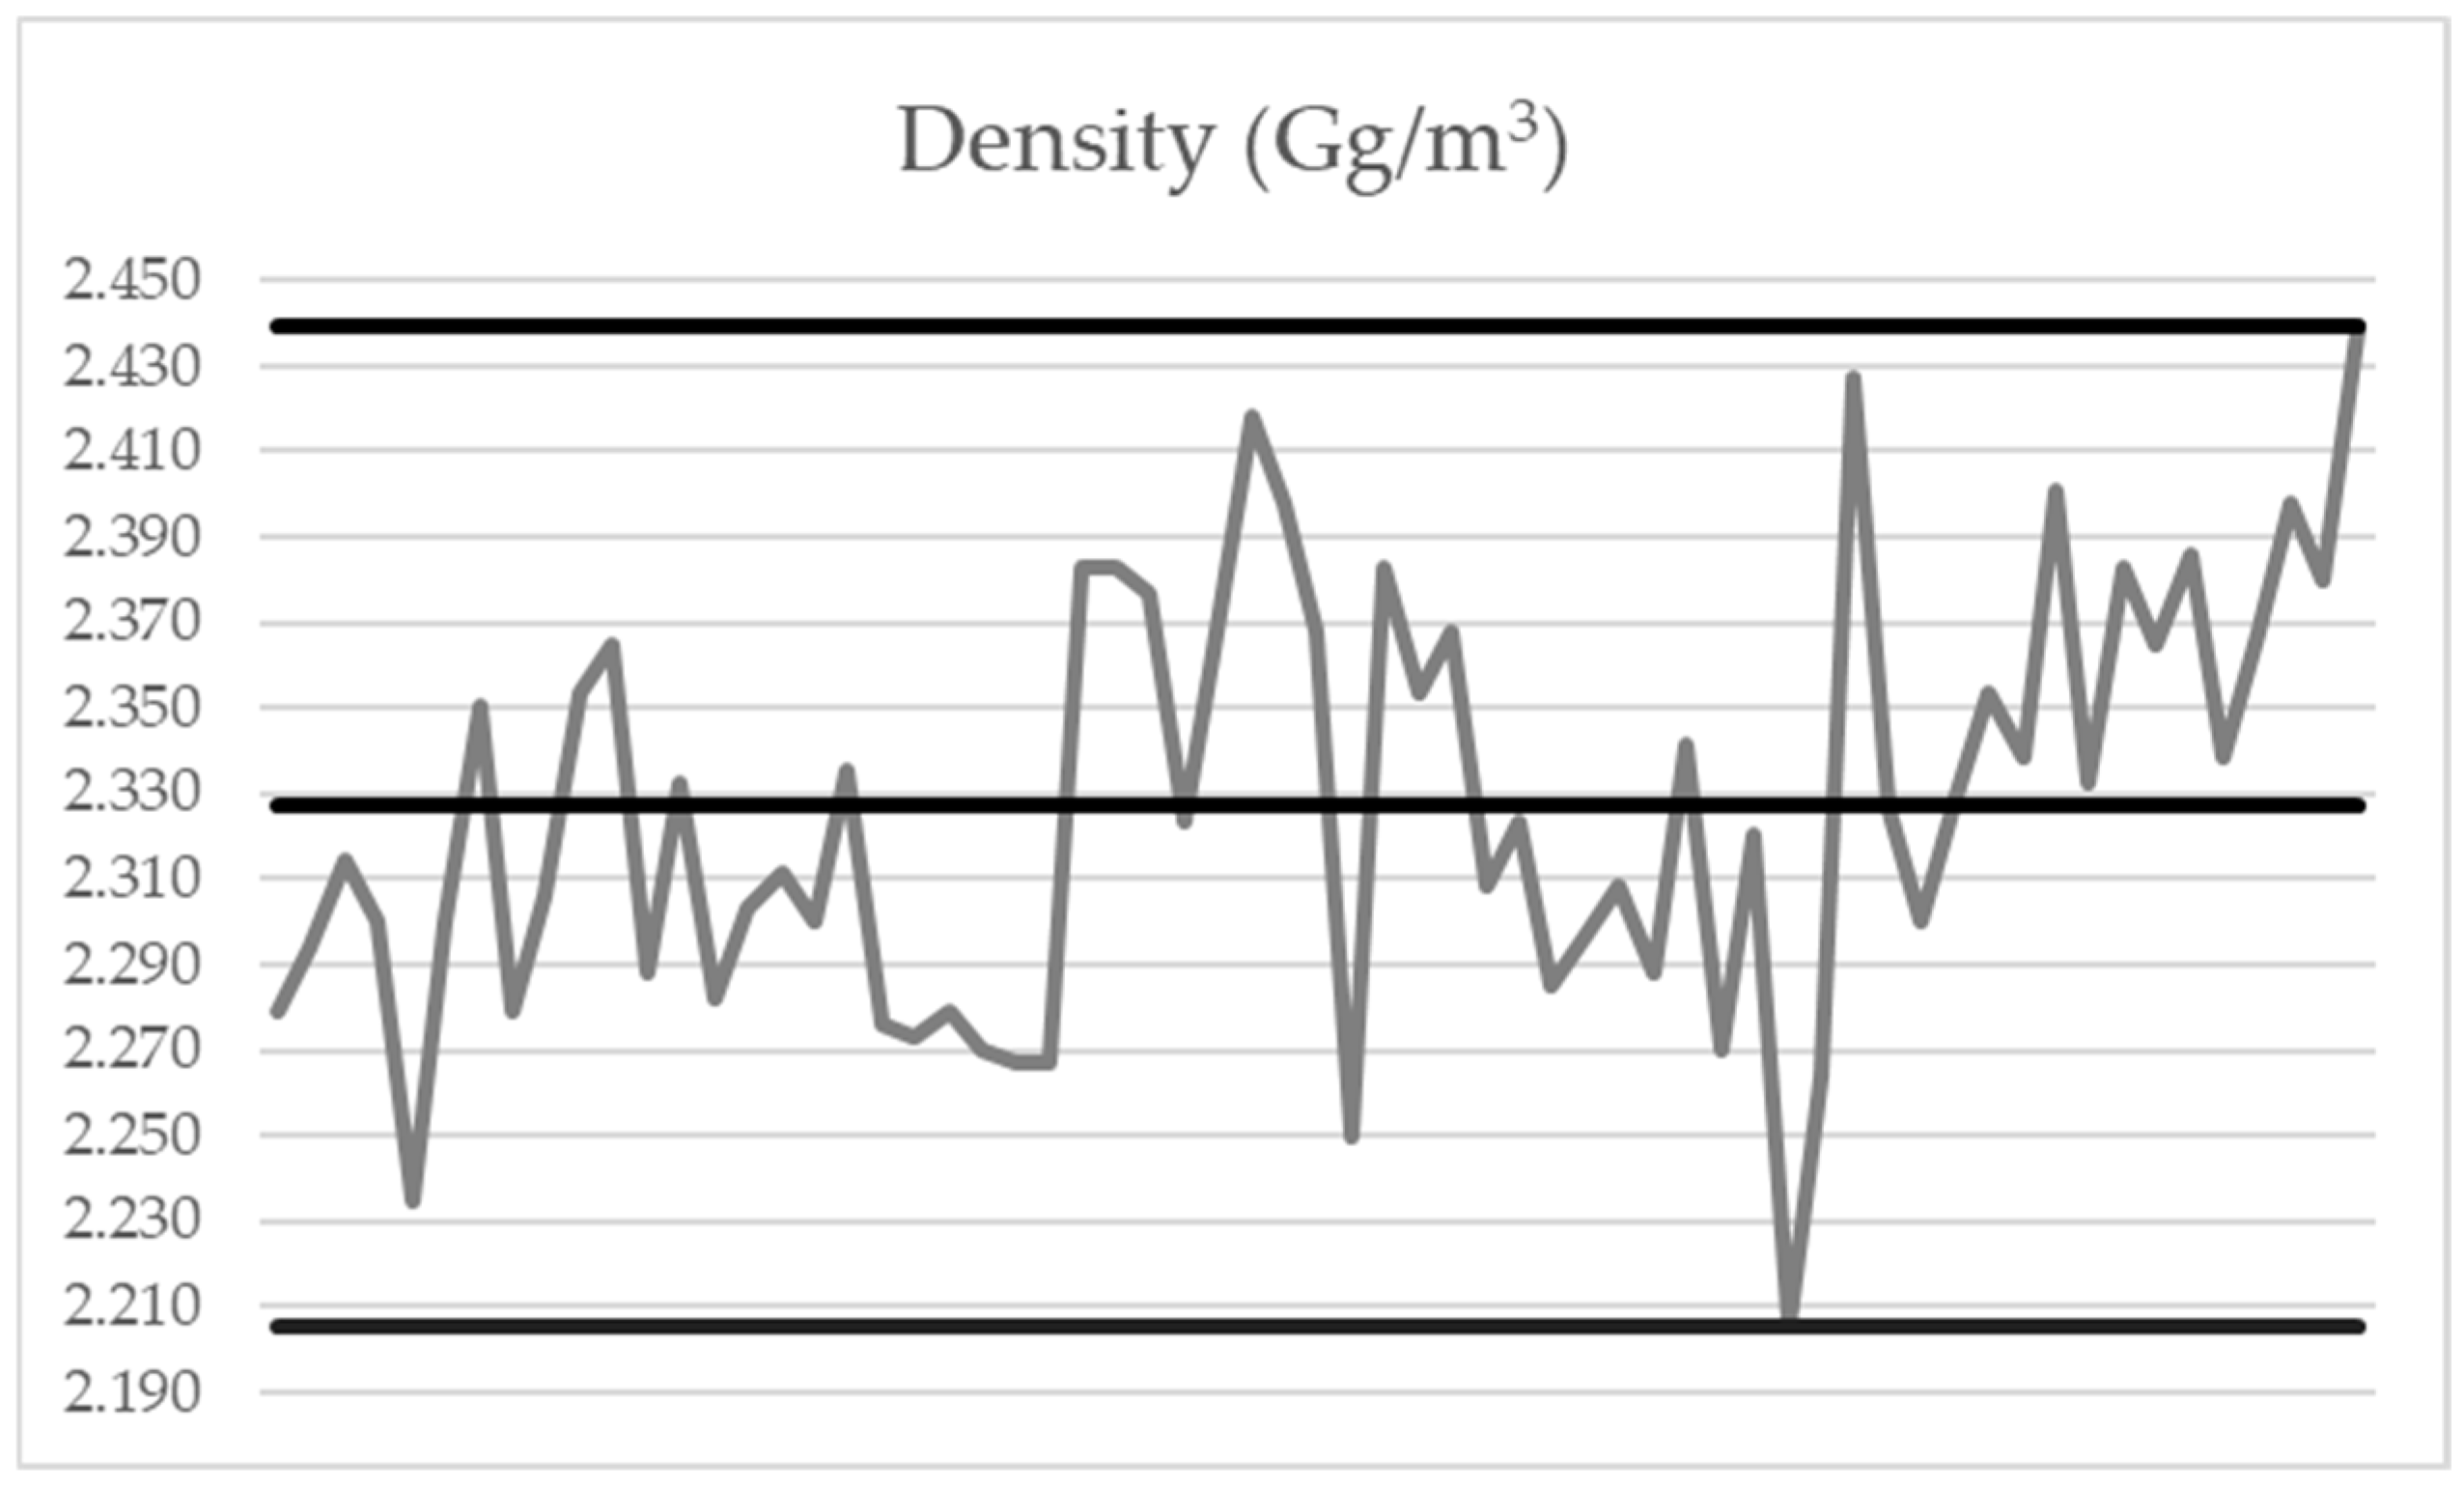
The density of the specimens assumes little dispersed values (Figure 4), included in a range of 234 kg/m3, with the mean equal to 2327 kg/m3. The low dispersion of the values indicates that the influence on the density of the type of waste aggregate, the percentage of substitution and the micronization is overall very limited.

Figure 4.
Overview of density dispersion. Mean = 2327 kg/m3; max = 2439 kg/m3; min = 2205 kg/m3; SD = 0.053.
Compression tests have been carried out for each mix design after 7 and 28 days of curing. Table 5 and Table 6 summarize the obtained results.
Table 5.
Compressive strength at 7 days.
Table 6.
Compressive strength at 28 days.
The data show that as the percentage of cement replacement increases, the compressive strength generally decreases, except for the mixes CA15, CA30 and SF15, whose compressive strength increases. Focusing on PE and RIO, comparing the mean compressive strength of the control mix M0 at 7 days and 28 days of curing with that of mixes containing perlite and rhyolite, a noticeable reduction in strength both at 7 and 28 days is observed. Specifically, the reduction in compressive strength for PE30μ63 and PE30μ20 is 41.8% and 33.2% at 7 days and 21.5% and 16.0% at 28 days, respectively, while the one for RIO30 is 41.1% and 30.4%.
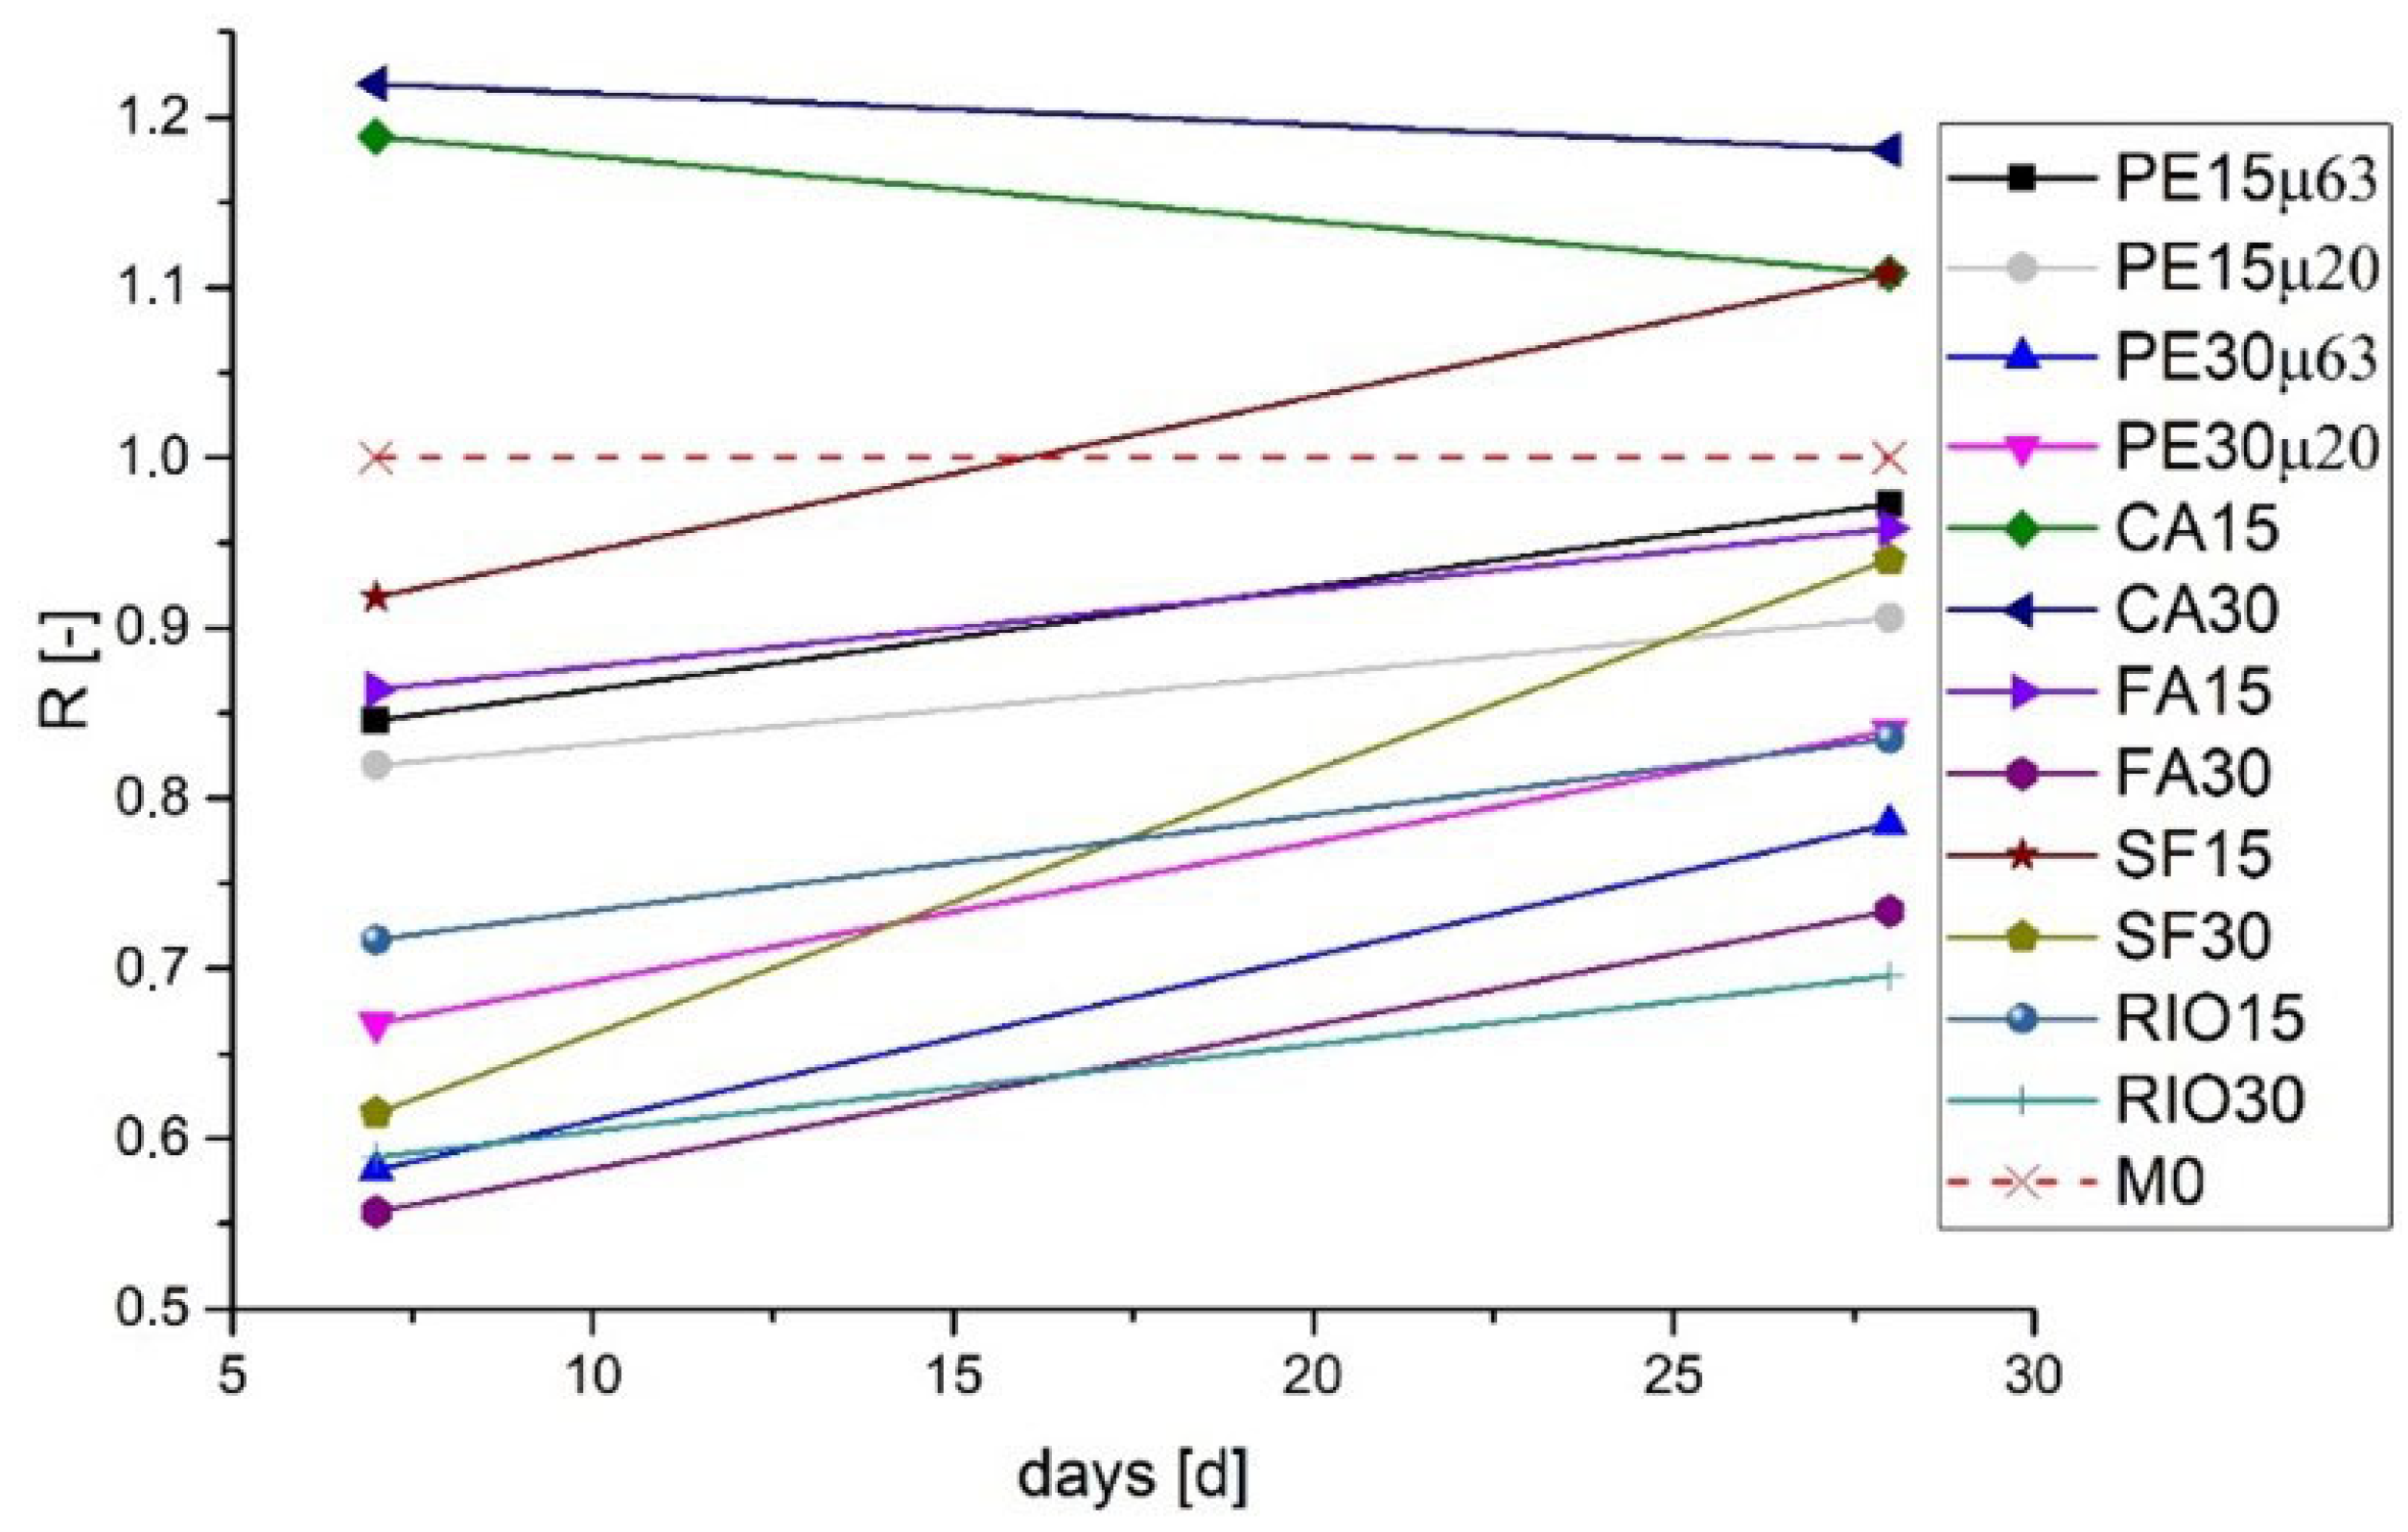
Figure 5 illustrates the trends of the mean compressive strength for the different mixes compared with the values at 7 and 28 days obtained for the reference mix M0, where R is the ratio between the mean compressive strength of the considered mix design and that of M0.
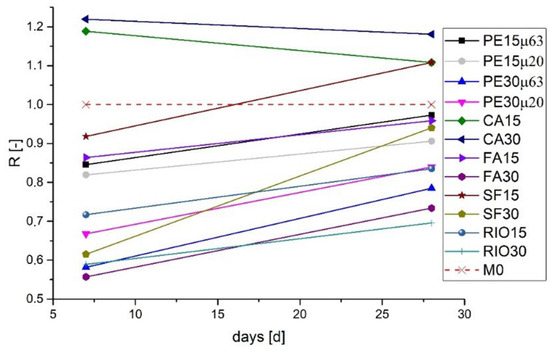
Figure 5.
Trends of the mean compressive strength variation at 7 and 28 days for the several mixes with respect to the reference mix M0.
The mix design with rhyolite shows a mean compressive strength at 28 days close to 35 MPa for RIO15 and close to 30 MPa for RIO30. Anyhow, the mean compressive strength characterizing RIO30 at 28 days is the lowest value in comparison with the results of all the other mixes. The FA30 mix shows the lowest mean compressive strength at 7 days. On the contrary, the FA15 mix shows a mean compressive strength at 7 days, which is very close to the reference mix M0 strength (R = 0.96). The best performance in terms of compressive strength is reached, both at early and standard ageing, by the mixes PE15μ63, SF15, FA15, CA15 and CA30, showing R > 0.8.
This fact highlights how cement replacement percentages higher than 15% lead to a significant reduction in the compressive strength of the concrete.
3.2. Non-Destructive Tests
As described in the previous Section 3.1, before compression tests, each sample was tested by UT and RHT at each age of casting.
Measures of T have been acquired, and then, according to the Equations (1) and (2), mean V and Edyn have been calculated, the latter by assuming μ = 0.2 [46]. The results are reported in Table 7 and Table 8, respectively.
Table 7.
Ultrasonic pulse velocity (V).
Table 8.
Dynamic modulus of elasticity.
Figure 6 shows the trend of V considering the ratio Rv between the considered mix design and the reference mix M0 at the same age.
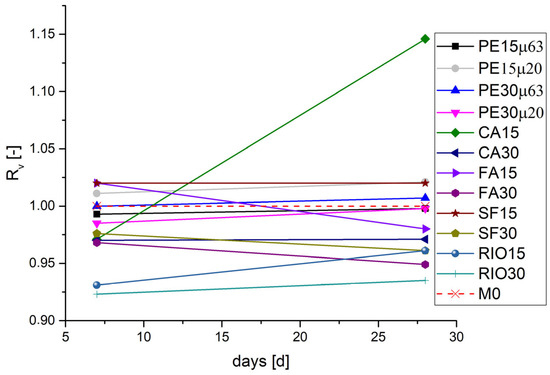
Figure 6.
Trends of the mean pulse velocity variation at 7 and 28 days for the several mixes with respect to the reference mix M0.
It can be noticed that the variation of Rv calculated at 7 and 28 days is characterized by quite low values, which means low differences in V between the tested mixes both at early and standard ageing. Variation of mean V with respect to the reference mix is rather low too, with a maximum reduction of 7.7% (RIO30) and 9.0% (FA15) at 7 and 28 days, respectively, and with a maximum amplification of 2.0% (FA15) and 12.7% (CA15) at 7 and 28 days, respectively. Therefore, only the CA15 and FA15 mixes highlight quite significant differences, as shown by the slopes of the lines, which describe the trend of the normalized indices over velocity. The CA15 mix design reaches a value of Rv = 1.15 at 28 days, starting from Rv = 0.97 at 7 days.
As can be seen from Figure 7, there is a strong correlation between V and Edyn, with a correlation coefficient close to 0.9. This is because Edyn is derived from V through Equation (2), in which the influence of density is limited since, as seen in Figure 6, density is highly homogeneous within the various mix designs. Therefore, the behavior of Edyn with respect to the reference mix M0 is not very different from that of V. Variation of mean Edyn with respect to M0 is limited, with a maximum reduction of 11.1% (RIO30) and 12.3% (FA15) at 7 and 28 days, respectively, and with a maximum amplification of 5.7% (SF15) and 7.1% (SF15) at 7 and 28 days, respectively. The RIO30 and FA15 mixes offer the lowest performance in terms of both Edyn and V.
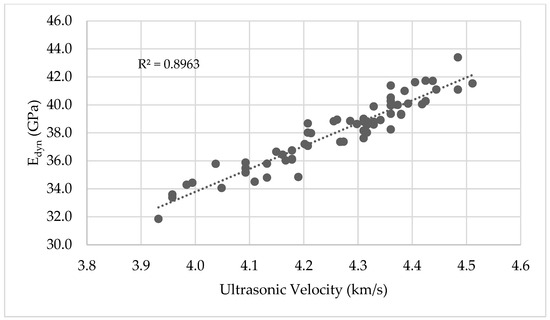
Figure 7.
Correlation between ultrasonic velocity and dynamic modulus of elasticity.
The RN was evaluated as the median of the readings on two sets of 15 measuring points chosen on two opposite sides of each specimen according to [47], and the results are resumed in Table 9. Furthermore, Figure 8 shows the trends of the RN at 7 and 28 days, considering the ratio of RRN between the actual mix design and the reference mix M0 at the same age.
Table 9.
Rebound number (RN).

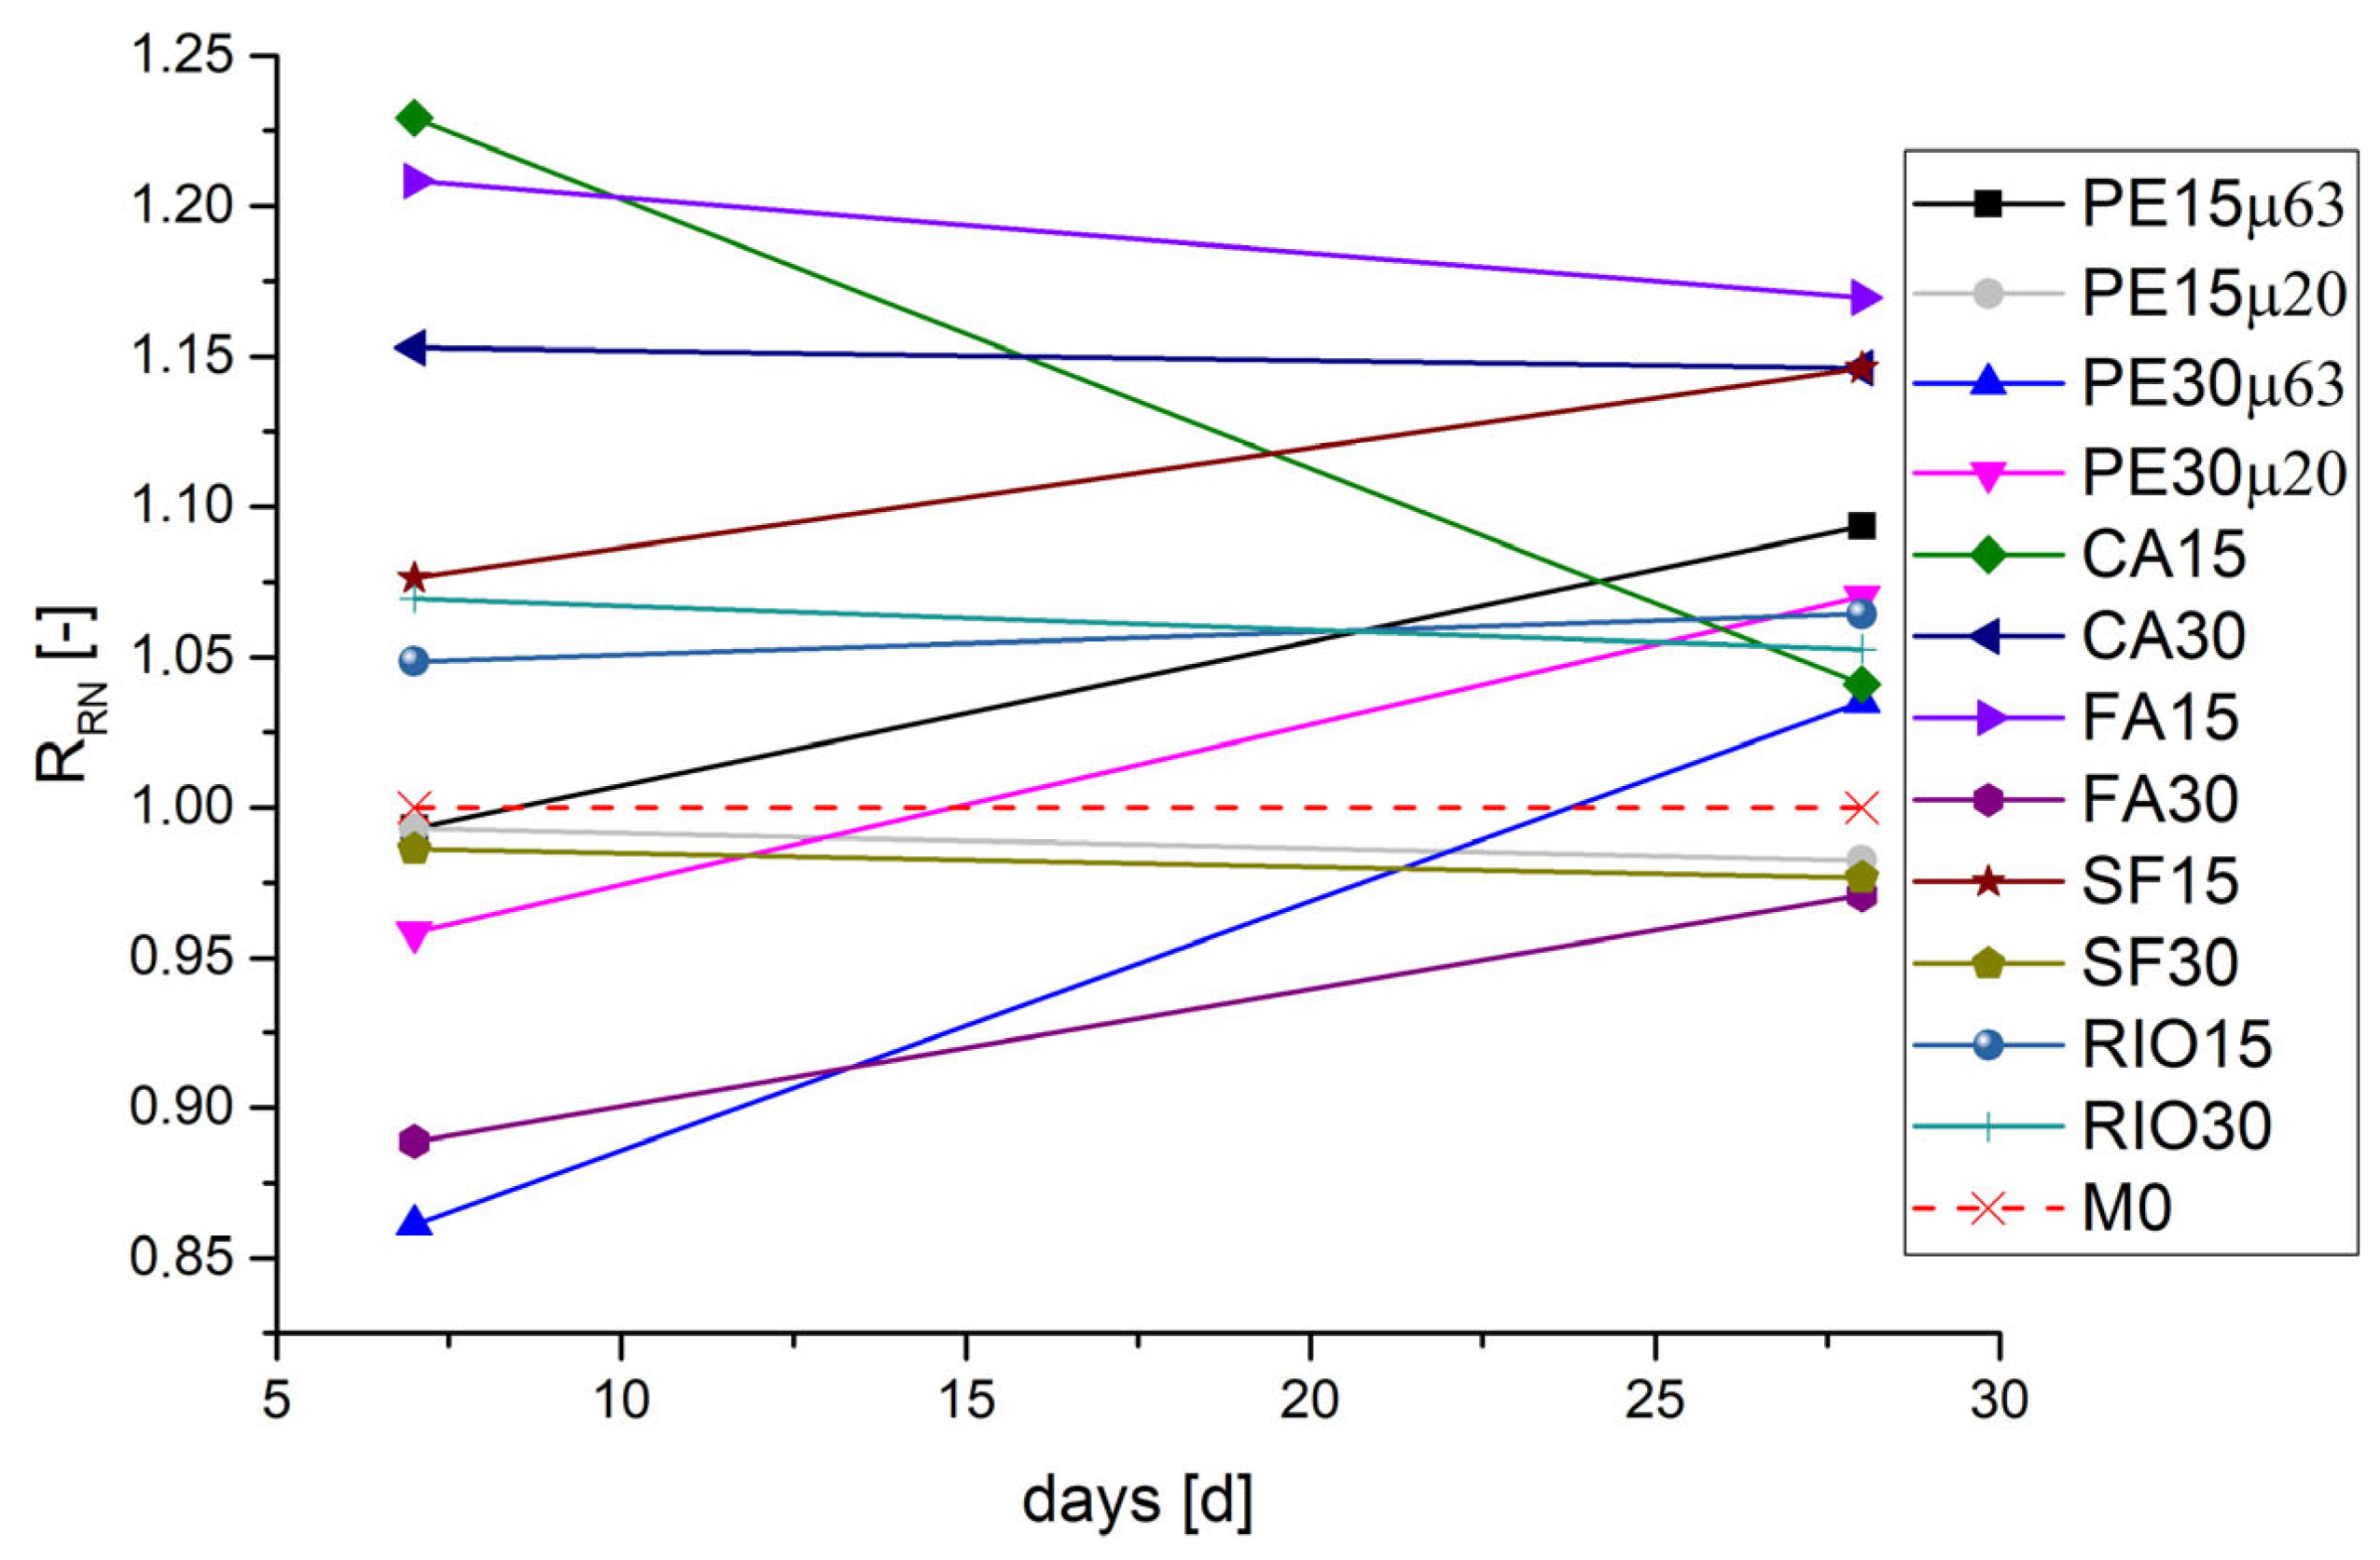
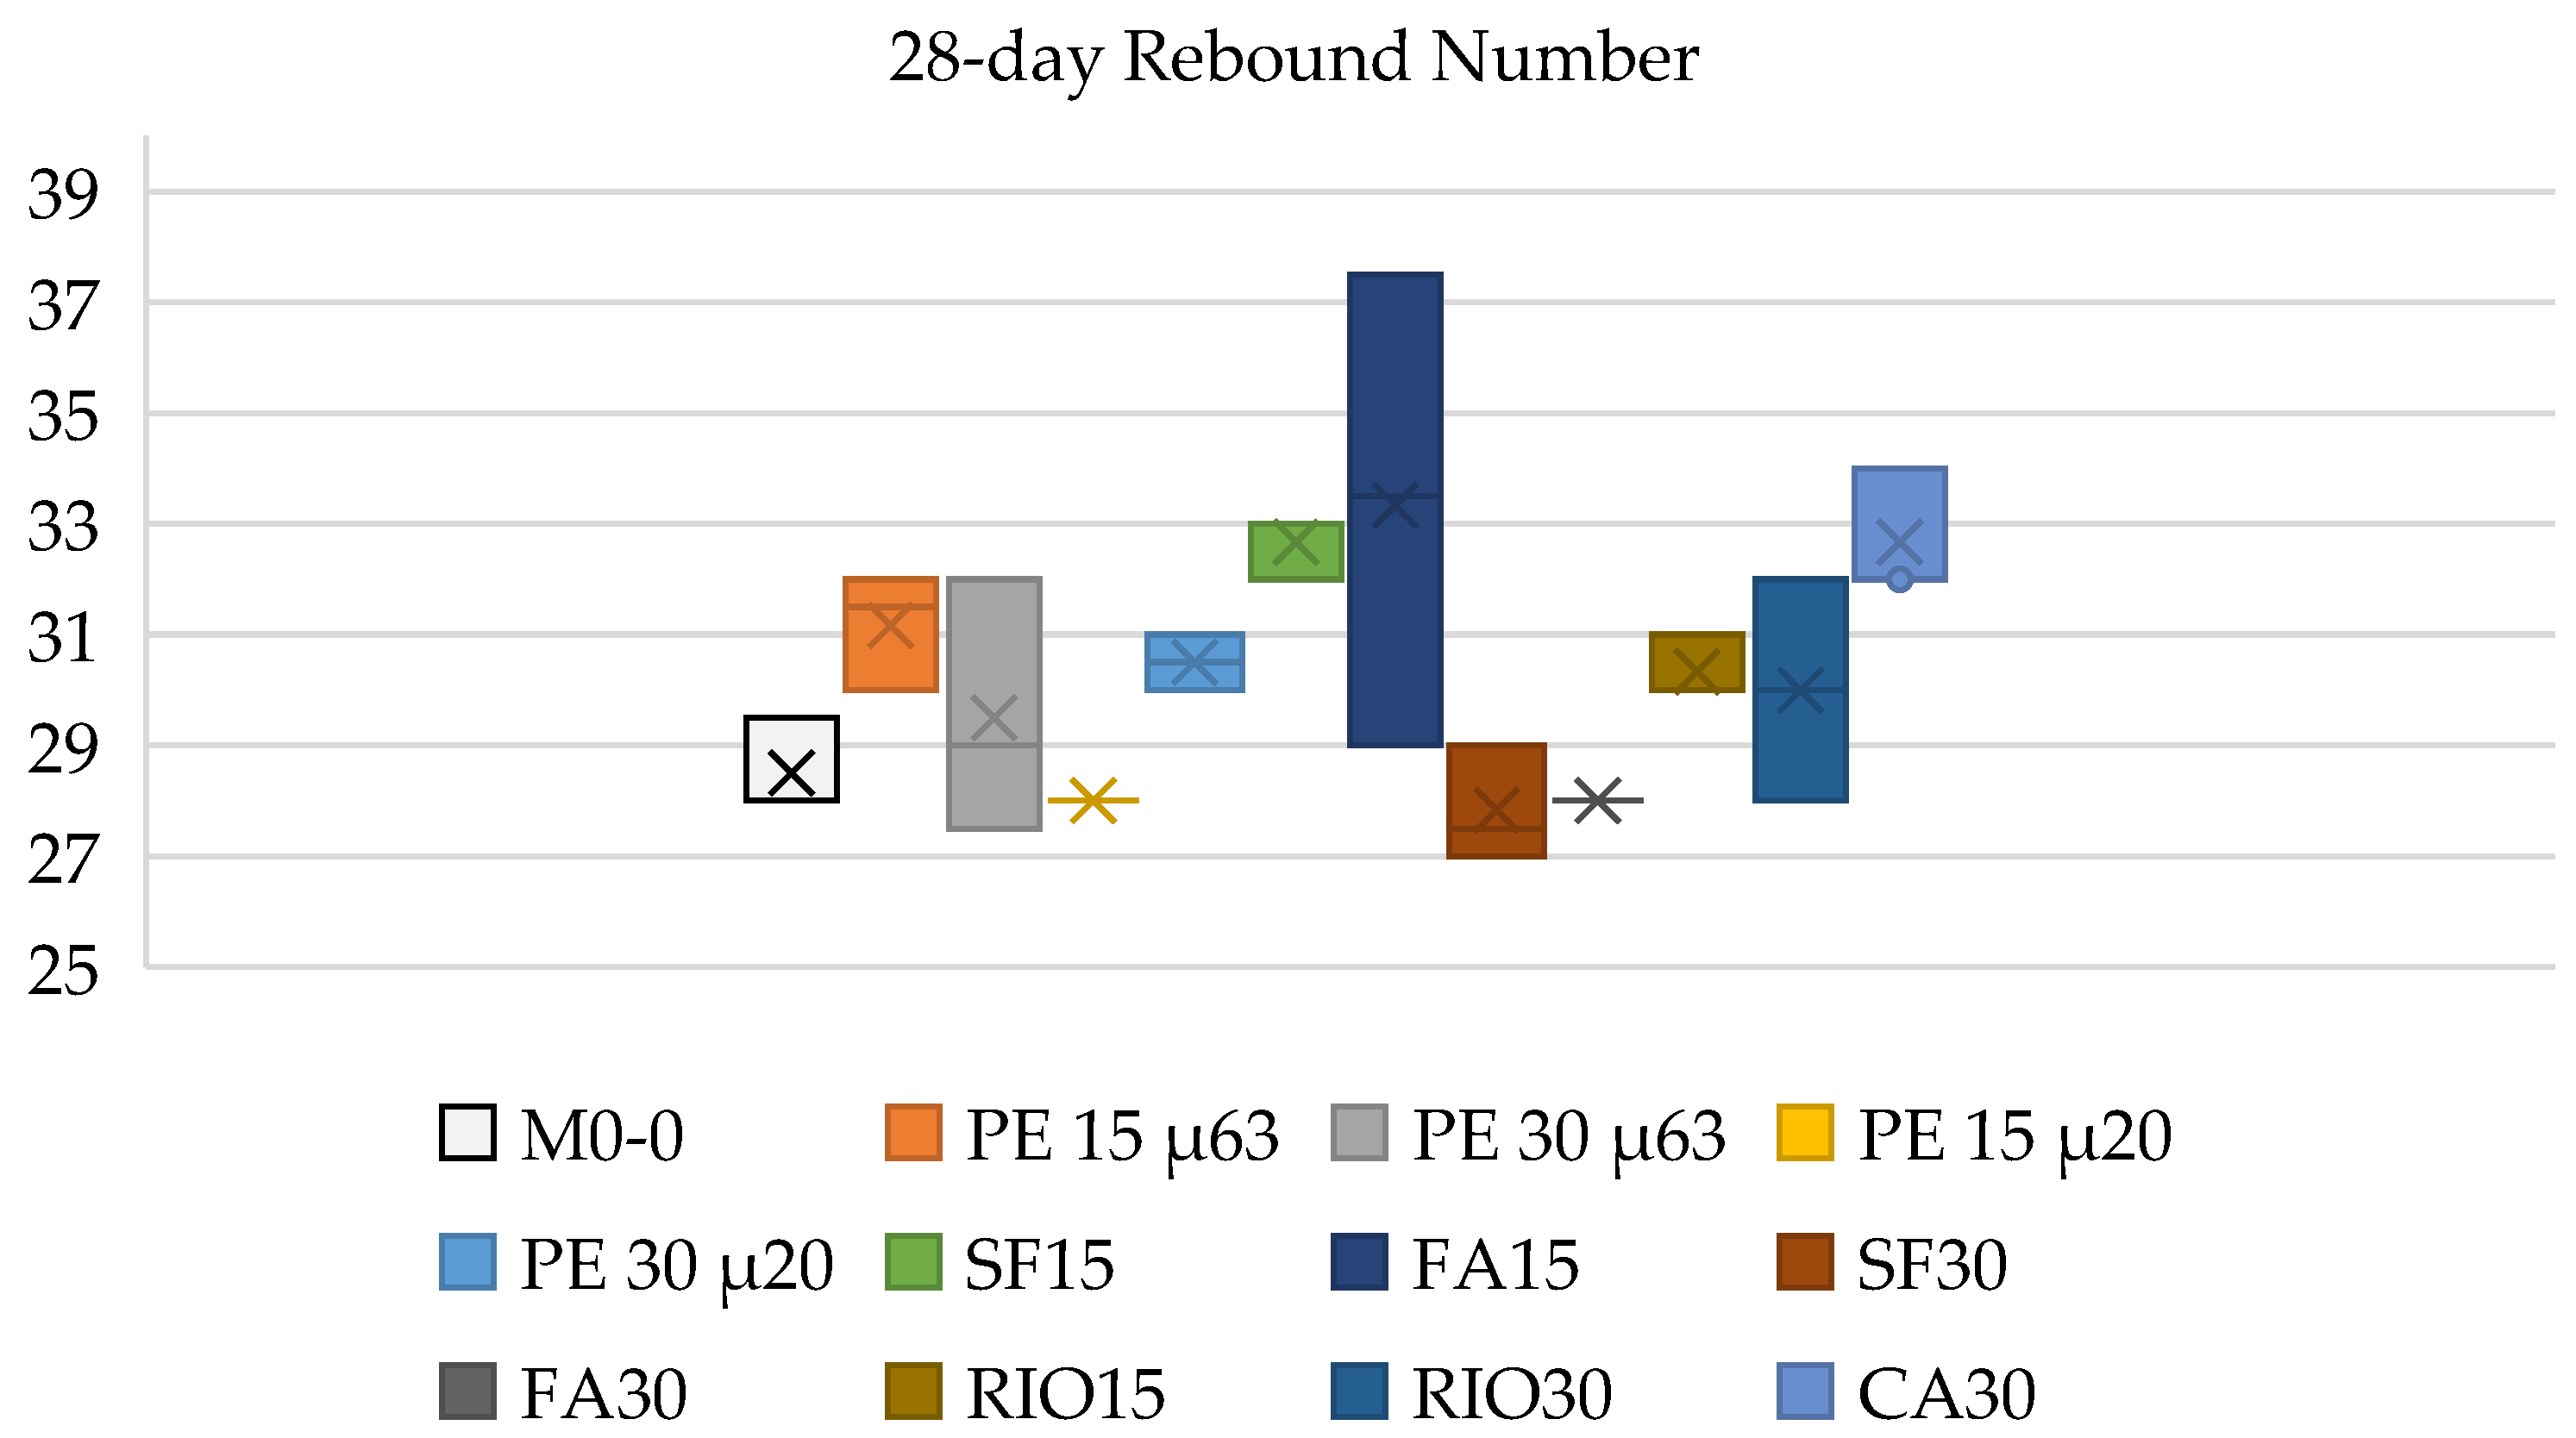
Figure 8.
Trends of RN variation at 7 and 28 days of the several mix designs with respect to the reference mix M0.
It can be observed that the variation of RRN at 7 and 28 days is particularly significant for the mixes CA15 and PE30μ63. For CA15, the RRN index starts from the highest value, 1.23, at 7 days and decreases to 1.04 at 28 days, whereas for PE30μ63, RRN starts from the lowest value, 0.86, at 7 days and increases up to 1.04 at 28 days. The FA15 mix design shows the highest RRN value, 1.17, at 28 days compared with the other mixes design. The different behavior showed by the mixes could be ascribed to the different surface hardness of the related specimens. Some of them (i.e., PE30µ63, FA30, PE30µ20, SF30) show, at early curing, a lower superficial hardness with respect to the specimen of the reference mix; other ones instead (i.e., RIO15, RIO30, SF15, CA30, FA15, CA15) at the same age show higher hardness than the reference mix specimen, so at 28 days, when they more or less reach the same strength or higher than the M0 mix, the RRN values increase or decrease depending on both the final value of the strength and the surface hardness with respect to the reference value. This aspect could also be understood from Table 9, where the RN always increases from 7 to 28 days of ageing for each mix, as expected, while RRN exhibits lower or higher values than one depending on the mix design; nevertheless, the lower reduction of RRN at 28 days of curing never exceeds 2.3%, while the higher increase is nearly 17%. Furthermore, a weak, direct relationship is observed between the RN and the compression strength, as shown in Figure 9.
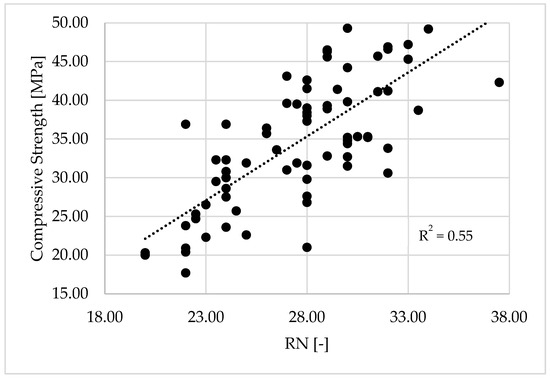
Figure 9.
Correlation between compressive strength and rebound number.
4. Discussion
A synthesis of the results presented in the previous section is shown in Figure 10, Figure 11, Figure 12 and Figure 13, where the average value is denoted by a cross while the standard deviation is reported as a bar for each mix and for each property. It is possible to highlight the following aspects.

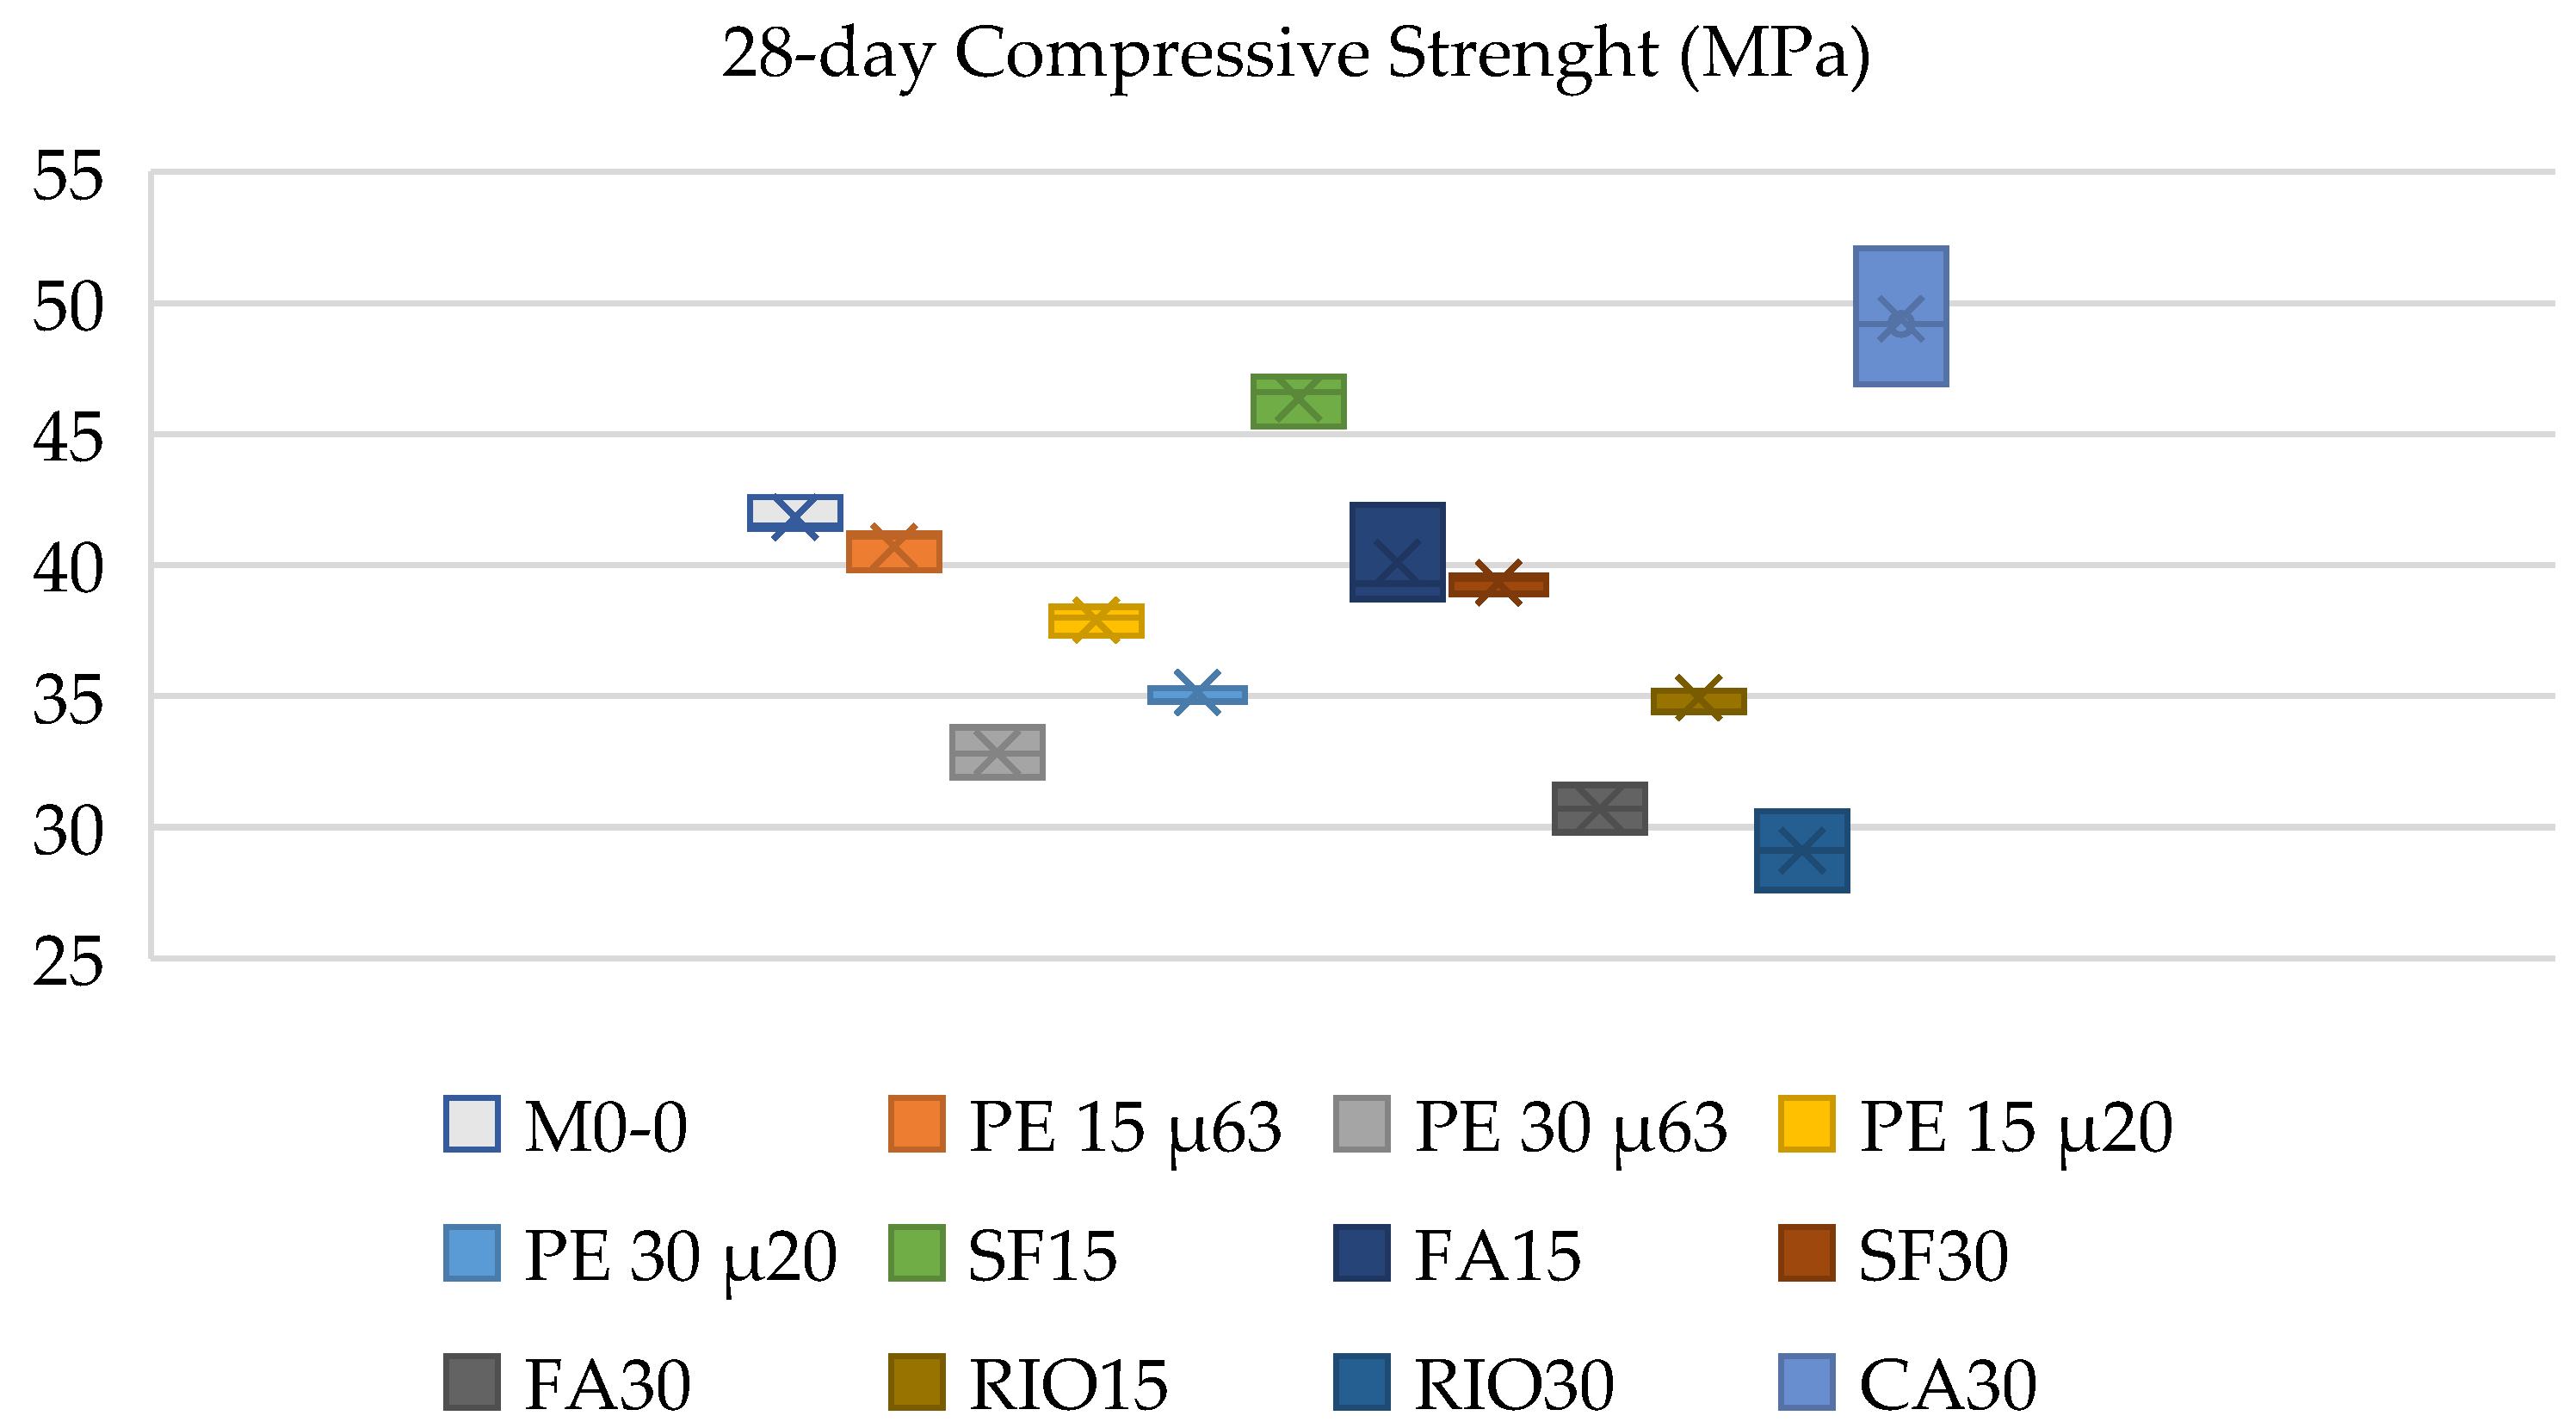
Figure 10.
Compressive strength.
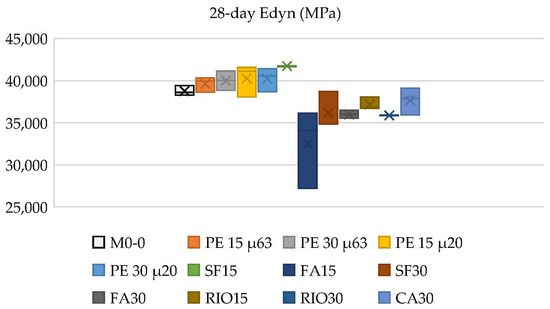
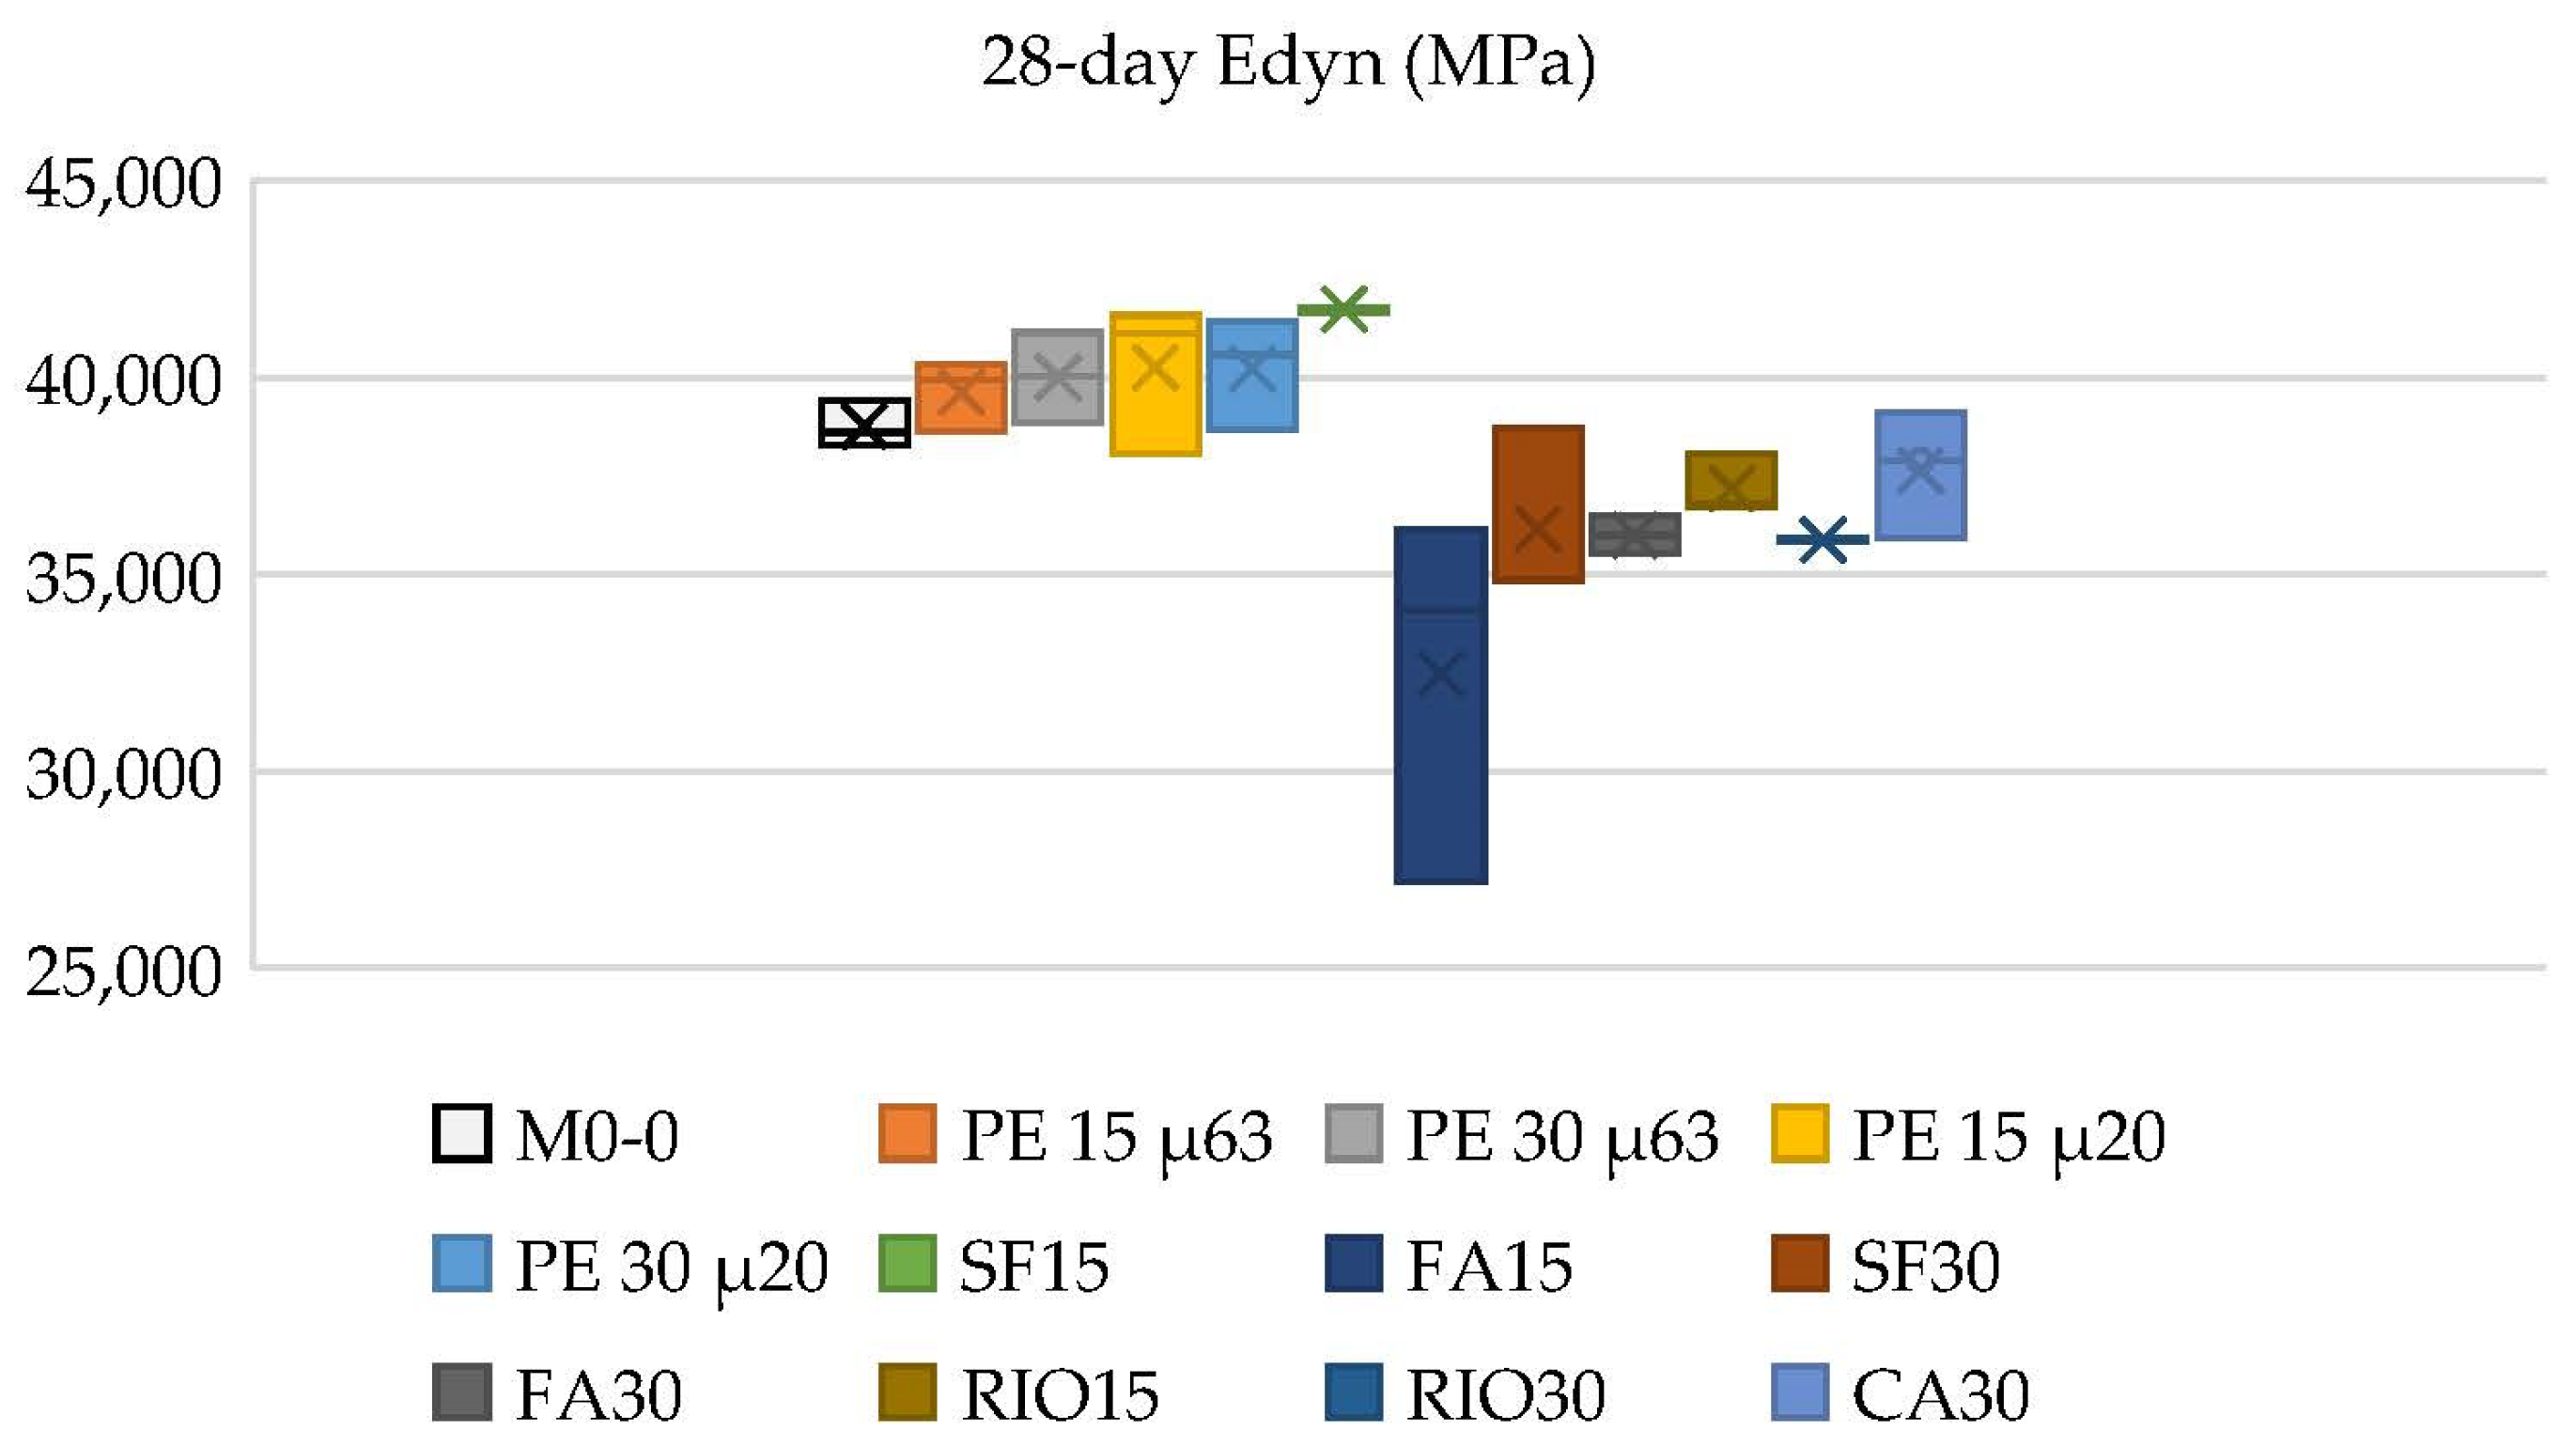
Figure 11.
Dynamic Modulus of elasticity.
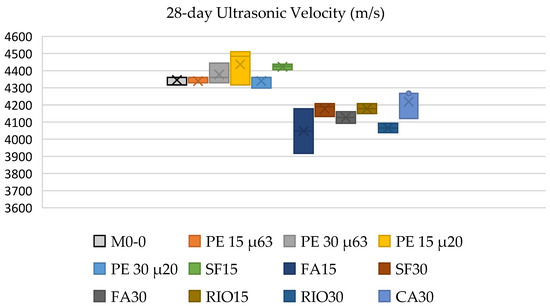
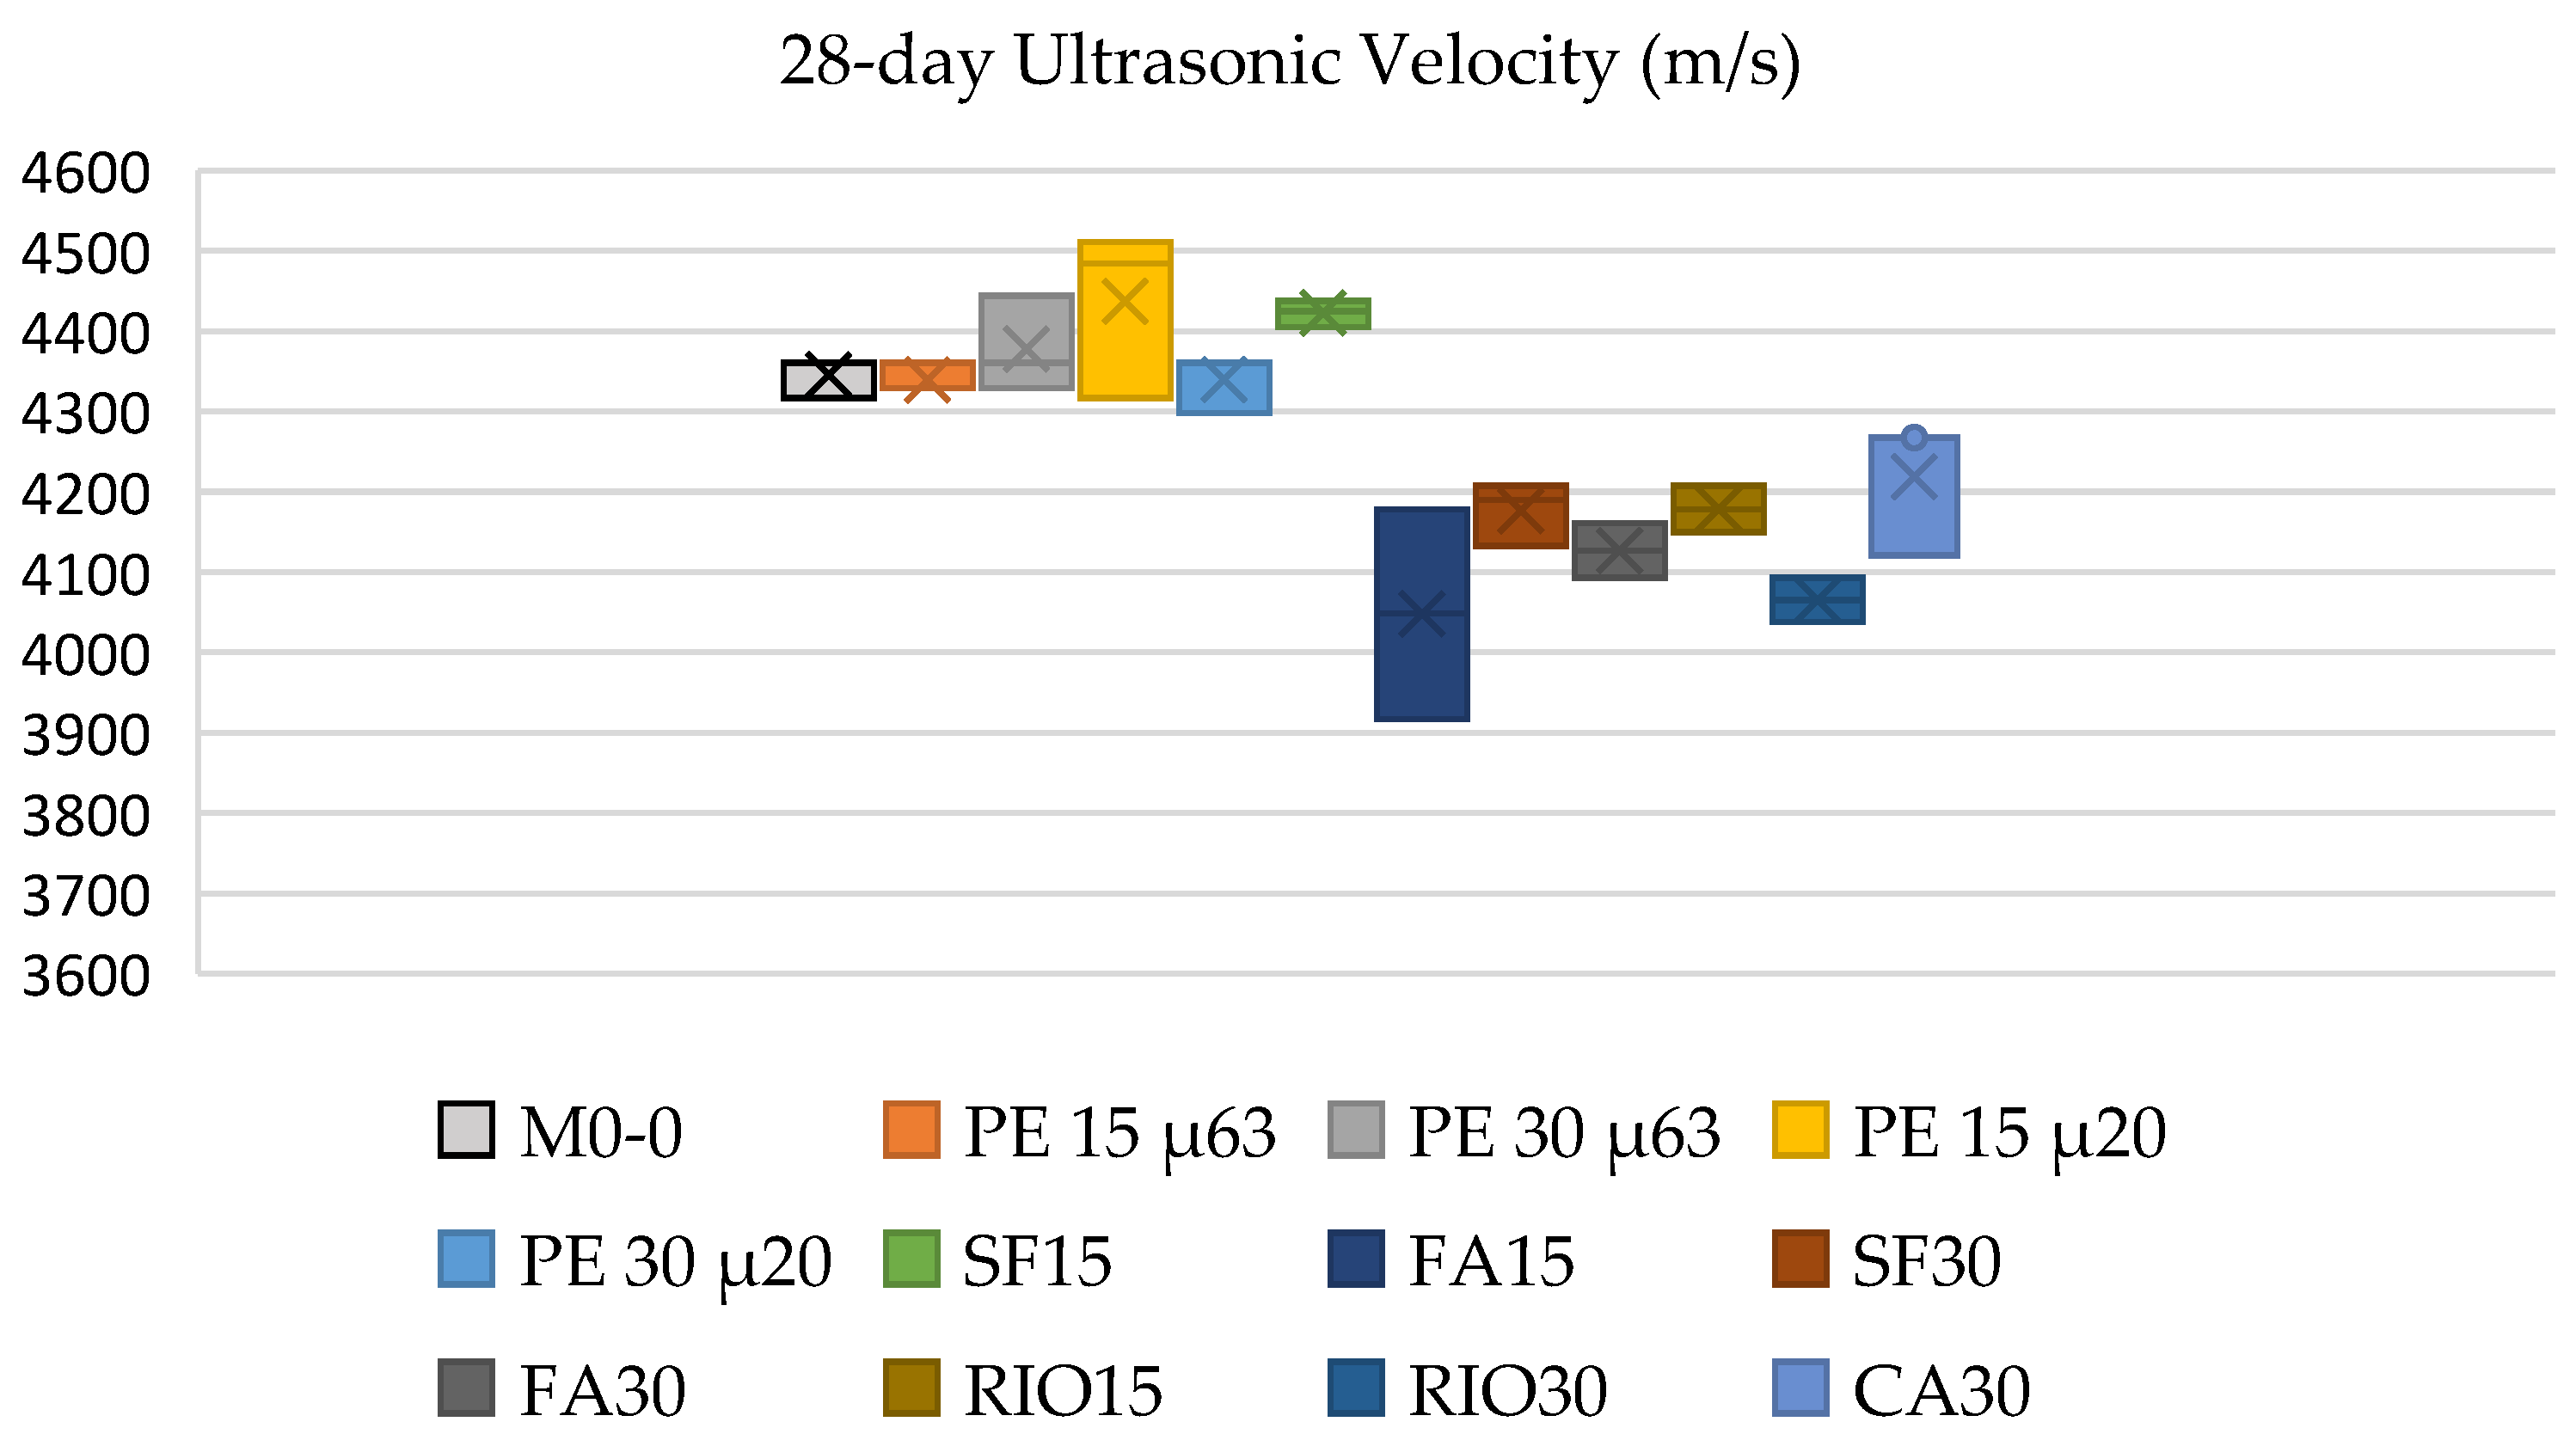
Figure 12.
Ultrasonic velocity.
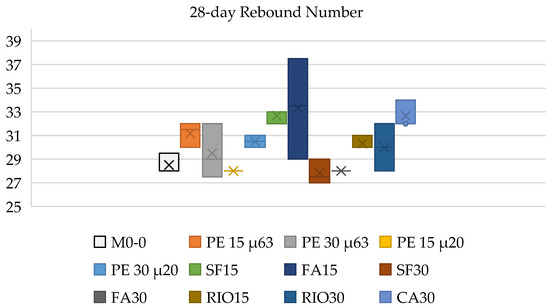
Figure 13.
Rebound number.
Regarding the compressive strength, see Figure 10; when the percentage of cement replacement using industrial waste materials increases, a decrease in concrete compressive strength occurs for all mix designs, except for the mixes CA15, CA30 and SF15. Focusing on PE, the mix designs PE15μ63, PE15μ20, PE30μ63 and PE30μ20 are characterized by a compressive strength lower than that obtained for the reference mix M0 both at 7 and 28 days. The loss of mean strength at 28 days is limited for mixes with a lower replacement percentage (PE15μ63, PE15μ20), for which it does not exceed 10%, while it becomes significant for mixes with a 30% replacement (PE30μ63, PE30μ20), for which it goes beyond 20%. Overall, the behavior of PE15 mixes is intermediate between that of mixes with CA and SF, which offer high strength, even higher than M0, and that of mixes with FA. However, in all cases, the mean strength of PE mixes remains above 30 MPa, an acceptable value for use in structural concrete. Focusing on RIO, the RIO15 and RIO30 mixes show the lowest strength at 28 days compared with all the other mix designs. The loss of mean strength compared with M0 is over 16% for the RIO15 mix and over 30% for the RIO30 mix, whose final mean strength does not reach 30 MPa, making its use in structural concrete questionable.
Regarding the dynamic modulus of elasticity, see Figure 11; due to the rather limited variability of the values, it is not possible to identify with certainty an increase or decrease trend either with the percentage of cement replacement variation nor with respect to reference mix design M0. However, it is interesting to note that, using the empirical relationship (3) proposed by the British testing standard BS8110 Part 2 [49] for the evaluation of the static modulus of elasticity Et at 28 days as a function of Edyn, the mean Et of the mixes M0, PE15μ63, PE15μ20, PE30μ63, PE30μ20, RIO15 and RIO30 takes the values 29 GPa, 31 GPa, 31 GPa, 31 GPa, 31 GPa, 27 GPa and 26 GPa, respectively, highlighting the similarity between M0 and PE and the worse performance of the RIO mix designs, which once again makes their use in structural concrete questionable.
Regarding the ultrasonic velocity, see Figure 12; the values determined for the various mixes are quite similar to each other and to the reference mix and show minimal variability also in relation to the percentage of cement replacement. This may indicate that the specimens in general have a similar degree of volumetric homogeneity, not influenced by the presence of waste materials in the mix design. This consideration is supported by the poor dispersion of the density values of the tested specimens. The high degree of correlation between velocity and dynamic modulus of elasticity makes the qualitative estimation of the stiffness through non-invasive measurement of velocity acceptable from an engineering perspective.
Regarding the rebound number see Figure 13; in general, the values at 28 days are included in the range of 27–33 and therefore present a fairly limited variability. It is possible to highlight that the observed variability can be attributed to the variation of surface conditions of the specimens in terms of roughness and hardness.
5. Considerations About CO2 Production
Together with studies of mechanical properties of concrete created using industrial waste, another important aspect that led to the ever-increasing use of industrial waste materials in concrete production is represented by the reduction in the quantities of carbon dioxide released into the atmosphere, according to the values of equivalent CO2 production reported in the main international database [50,51,52]. Table 10 reports the equivalent CO2 produced unit value (kg/ton) that characterizes the materials considered, and Table 11 summarizes the equivalent CO2 produced considering the mix designs reported in Table 1. Δ indicates the reduction of equivalent CO2 produced to realize the considered mix design with respect to M0.
Table 10.
Carbon dioxide emitted by the materials considered in this research.
Table 11.
Carbon dioxide emitted by the mix designs considered in this research.
It could be observed that the use of industrial waste materials as a partial replacement of cement in concrete mix design leads to a significant reduction in equivalent CO2 production with respect to the reference mix design, representing an important aspect from the sustainability point of view. The maximum reduction of equivalent CO2 produced was obtained for the SF30 mix design, which showed a compressive strength decrease at 28 days of about 6% (Table 6). The minimum abatement of equivalent CO2 produced was obtained for the CA15 mix design, which instead increased the compressive strength at 28 days by about 10% (Table 6). The FA mixes offered a good balance both in terms of compressive strength (with an increase of about 4% and 26,6% for FA15 and FA30, respectively) and in terms of equivalent CO2 production reduction (10.9% and 21.8%). Focusing on PE15 mixes, it can be noted that they showed a reduction in equivalent CO2 produced of 11.8%, limiting at the same time the compressive strength reduction to less than 10% after 28 days (Table 6). PE30 mix designs showed a higher reduction of equivalent CO2 produced, which reached 23.4%, and a 28-day compressive strength reduction, which went beyond 20% (Table 6). Regarding RIO mixes, they entailed a great equivalent CO2 produced reduction at 12% for RIO15 and 24% for RIO30, respectively, but showed the highest compressive strength reduction at 28 days, which went beyond 16% and 30%, respectively, as discussed in Section 4. For these reasons, the feasibility of using rhyolite as a partial substitution of cement in concrete mix design is currently questionable and needs further research.
6. Conclusions
This paper illustrated an experimental campaign aimed at analyzing the physical-mechanical performances of structural concrete specimens that incorporate various waste materials as partial replacements for cement. This study also evaluated the environmental impact in terms of equivalent CO2 produced. The focus was on the effect of perlite and rhyolite, two waste materials still little studied for this specific use, on the mix design of structural concrete. The performances of the specimens containing perlite and rhyolite were compared with those of specimens produced with a standard C25/30 reference (M0) concrete, as well as the performances of specimens containing other commonly used industrial wastes, such as fly ash, silica fume and metakaolin. The waste materials were introduced in the mix design in two percentages of replacement for cement, 15% and 30%; moreover, perlite was introduced in two different particle sizes, 20 μm and 63 μm. The impact of these materials on both the internal and surface conditions of the specimens was analyzed by using ultrasonic and rebound hammer tests.
From the obtained results, the following main observations can be drawn.
- The 28-day compressive strength of specimens with waste materials is generally lower than that of reference specimens, except for those containing CA and SF15. Specimens with PE achieve an average strength well above 30 MPa, an acceptable value for use in structural concrete, as do specimens with RIO15. Specimens with RIO30 instead offer an average strength significantly lower than 30 MPa, making its use in structural concrete questionable. In general, it is observed that the use of PE and RIO in cement replacement percentages higher than 15% is not convenient from the point of view of compressive strength. The use of RIO mixes also determines lower performances in terms of modulus of elasticity.
- The rebound hammer test generally produces results weakly correlated to the compressive strength and largely influenced, as expected, by the conditions of hardness and surface roughness of the specimens. The ultrasonic test provides globally poorly dispersed velocity values, indicating the low influence of the mix design on the internal characteristics of the specimens and highly correlated with the modulus of elasticity; this makes the qualitative estimation of the stiffness through non-invasive measurement of velocity acceptable from an engineering perspective.
- The use of industrial waste generally leads to a reduction, with respect to the reference mix design, of the equivalent CO2 produced; the greatest reduction is guaranteed by SF30, RIO30 and PE30 mixes, while the least reduction is guaranteed by CA15. In terms of physical-mechanical performance, the best balance between mechanical performance and reduction of the polluting impact is offered by the SF30 mix design, which marks a final mean compressive strength of about 39 MPa and a reduction in the equivalent CO2 produced of about 24%; moreover, if a compressive strength of around 33–35 MPa is acceptable, an excellent compromise is achieved by the PE15 mix design, which marks a reduction in the equivalent CO2 produced of around 23%.
In summary, the use of perlite as a partial substitute for cement in structural concrete offers a good compromise between maintaining mechanical properties and reducing the equivalent CO2 compared with the reference mix design, in line with other waste materials already used for the same purpose. Rhyolite, on the other hand, despite an appreciable reduction in equivalent CO2, causes an excessive drop in mechanical properties compared with the reference mix; therefore, its use as a partial substitute for cement in structural concrete appears, at the moment, questionable.
Therefore, further research is essential to expand the sample size and gain deeper insights into the long-term performance and suitability of both perlite and rhyolite in concrete applications, particularly with respect to their mechanical behavior and environmental impact.
An important further development of the research work is the evaluation of the durability of structural concrete created using perlite and rhyolite within the mix design to consider their possible use in the realization of structural elements exposed to aggressive environmental conditions.
Author Contributions
Conceptualization, G.C., M.Z., F.S., M.V. and F.M.; methodology, M.V., F.S. and G.C.; validation, M.Z. and F.S.; investigation, M.Z., G.C. and M.V.; resources, G.C.; data curation, F.S. and F.M.; writing—original draft preparation, M.Z., G.C. and M.V.; writing—review and editing, F.S. and F.M.; funding acquisition, G.C. All authors have read and agreed to the published version of the manuscript.
Funding
The APC was funded by the ISEC (Ingegneria Strutturale ed Economia Circolare).
Institutional Review Board Statement
Not applicable.
Informed Consent Statement
Not applicable.
Data Availability Statement
The data presented in this study are available upon request to the author.
Conflicts of Interest
The author declares no conflicts of interest. The funders had no role in the design of the study; in the collection, analyses, or interpretation of data; in the writing of the manuscript; or in the decision to publish the results.
References
- Adesina, A.; Awoyera, P. Overview of trends in the application of waste materials in self-compacting concrete production. SN Appl. Sci. 2019, 1, 962. [Google Scholar] [CrossRef]
- Jani, Y.; Hogland, W. Waste glass in the production of cement and concrete—A review. J. Environ. Chem. Eng. 2014, 2, 1767–1775. [Google Scholar] [CrossRef]
- Kishore, K.; Gupta, N. Application of domestic & industrial waste materials in concrete: A review. Mater. Today Proc. 2020, 26, 2926–2931. [Google Scholar]
- Yang, S.; Wang, X.; Hu, Z.; Li, J.; Yao, X.; Zhang, C.; Wu, C.; Zhang, J.; Wang, W. Recent advances in sustainable lightweight foamed concrete incorporating recycled waste and byproducts: A review. Constr. Build. Mater. 2023, 403, 133083. [Google Scholar] [CrossRef]
- Jahami, A.; Issa, C.A. Exploring the use of mixed waste materials (MWM) in concrete for sustainable Construction: A review. Constr. Build. Mater. 2023, 398, 132476. [Google Scholar] [CrossRef]
- Tanash, A.O.; Muthusamy, K.; Yahaya, F.M.; Ismail, M.A. Potential of recycled powder from clay Brick, sanitary Ware, and concrete waste as a cement substitute for Concrete: An overview. Constr. Build. Mater. 2023, 401, 132760. [Google Scholar] [CrossRef]
- Bai, Y.; Guo, W.; Zhao, Q.; Qiu, Y.; Wang, S. Triaxial compression failure criterion and constitutive relation of concrete containing multiple solid wastes. Constr. Build. Mater. 2023, 386, 131573. [Google Scholar] [CrossRef]
- Longarini, N.; Crespi, P.; Zucca, M.; Giordano, N.; Silvestro, G. The advantages of fly ash use in concrete structures. Inz. Miner. 2014, 15, 141–145. [Google Scholar]
- Khankhaje, E.; Kim, T.; Jang, H.; Kim, C.S.; Kim, A.J.; Rafieizonooz, M. Properties of pervious concrete incorporating fly ash as partial replacement of cement: A review. Dev. Built Environ. 2023, 14, 100130. [Google Scholar] [CrossRef]
- Nuaklong, P.; Hamcumpai, K.; Keawsawasvong, S.; Pethrung, S.; Jongvivatsakul, P.; Tangaramvong, S.; Pothisiri, T.; Likitlersuang, S. Strength and post-fire performance of fiber-reinforced alkali-activated fly ash concrete containing granite industry waste. Constr. Build. Mater. 2023, 392, 131984. [Google Scholar] [CrossRef]
- Ho, L.S.; Huynh, T.P. Long-term mechanical properties and durability of high-strength concrete containing high-volume local fly ash as a partial cement substitution. Results Eng. 2023, 18, 101113. [Google Scholar] [CrossRef]
- Magalhães, M.S.; Cezar, B.F.; Lustosa, P.R. Influence of Brazilian fly ash fineness on the cementing efficiency factor, compressive strength and Young’s modulus of concrete. Dev. Built Environ. 2023, 14, 100147. [Google Scholar] [CrossRef]
- Shelote, S.M.; Bala, A.; Gupta, S. An overview of mechanical, permeability, and thermal properties of silica fume concrete using bibliographic survey and building information modelling. Constr. Build. Mater. 2023, 385, 131489. [Google Scholar] [CrossRef]
- Ramezanianpour, A.A.; Malhotra, V.M. Effect of curing on the compressive strength, resistance to chloride-ion penetration and porosity of concretes incorporating slag, fly ash or silica fume. Cem. Concr. Compos. 1995, 17, 125–133. [Google Scholar] [CrossRef]
- Khan, M.I.; Siddique, R. Utilization of silica fume in concrete: Review of durability properties. Resour. Conserv. Recycl. 2011, 57, 30–35. [Google Scholar] [CrossRef]
- Vijayan, D.S.; Devarajan, P.; Sivasuriyan, A. A review on eminent application and performance of nano based silica and silica fume in the cement concrete. Sustain. Energy Technol. Assess. 2023, 56, 103105. [Google Scholar] [CrossRef]
- Tak, S.; Gupta, P.; Kumar, A.; Sofi, A.; Yun, C.M. Effect of using silica fume as a partial replacement of cement in concrete. Mater. Today Proc. 2023; in press. [Google Scholar]
- Chishi, A.K.; Gautam, L. Sustainable use of silica fume in green cement concrete production: A review. Innov. Infrastruct. Solut. 2023, 8, 195. [Google Scholar] [CrossRef]
- Thwin, N.S.L.M.; Thwe, E.M. Investigation on the strength behaviors of ordinary and Kaolin-modified concretes severely attacked by sulfuric acid. Mater. Today Proc. 2023; in press. [Google Scholar]
- Jesus, C.F.; Arruda Junior, E.S.; Braga, N.T.S.; Silva Junior, J.A.; Barata, M.S. Coloured concrete produced from low-carbon cements: Mechanical properties, chromatic stability and sustainability. J. Build. Eng. 2023, 67, 106018. [Google Scholar] [CrossRef]
- Schneider, M.; Romer, M.; Tschudin, M.; Bolio, H. Sustainable cement production-present and future. Cem. Concr. Res. 2011, 41, 642–650. [Google Scholar] [CrossRef]
- Kumar, R.; Singh, R.; Patel, M. Effect of metakaolin on mechanical characteristics of the mortar and concrete: A critical review. Mater. Today Proc. 2023, 93, 315–319. [Google Scholar] [CrossRef]
- Asghari, Y.; Mohammadyan-Yasouj, S.E.; Koloor, S.S.R. Utilization of metakaolin on the properties of self-consolidating concrete: A review. Constr. Build. Mater. 2023, 389, 131605. [Google Scholar] [CrossRef]
- Sankar, B.; Ramadoss, P. Modelling the compressive strength of high-performance concrete containing metakaolin using distinctive statistical techniques. Results Control Optim. 2023, 12, 100241. [Google Scholar] [CrossRef]
- Singh, M.; Garg, M. Perlite-based building materials—A review of current applications. Constr. Build. Mater. 1991, 5, 75–81. [Google Scholar] [CrossRef]
- İlker Bekir Topçu, Burak Işıkdağ, Effect of expanded perlite aggregate on the properties of lightweight concrete. J. Mater. Process. Technol. 2008, 204, 34–38. [CrossRef]
- Lanzón, M.; García-Ruiz, P.A. Lightweight cement mortars: Advantages and inconveniences of expanded perlite and its influence on fresh and hardened state and durability. Constr. Build. Mater. 2008, 22, 1798–1806. [Google Scholar] [CrossRef]
- Sengul, O.; Azizi, S.; Karaosmanoglu, F.; Tasdemir, M.A. Effect of expanded perlite on the mechanical properties and thermal conductivity of lightweight concrete. Energy Build. 2011, 42, 671–676. [Google Scholar] [CrossRef]
- Yu, H.L.; Ou, H.; Lee, L.L. Investigation on pozzolanic effect of perlite powder in concrete. Cem. Concr. Res. 2003, 33, 73–76. [Google Scholar] [CrossRef]
- Rashad, A.M. A synopsis about perlite as building material—A best practice guide for Civil Engineer. Constr. Build. Mater. 2016, 121, 338–353. [Google Scholar] [CrossRef]
- Stratoura, M.C.; Lazari, G.E.D.; Badogiannis, E.G.; Papadakis, V.G. perlite and rice husk ash re-use as fine aggregates in lightweight aggregate structural concrete—Durability assessment. Sustainability 2023, 15, 4217. [Google Scholar] [CrossRef]
- Ramezanianpour, A.A.; Karein, S.M.M.; Vosoughi, P.; Pilvar, A.; Isapour, S.; Moodi, F. Effects of calcined perlite powder as a SCM on the strength and permeability of concrete. Constr. Build. Mater. 2014, 66, 222–228. [Google Scholar] [CrossRef]
- El Mir, A.; Nehme, S.G. Utilization of industrial waste perlite powder in self-compacting concrete. J. Clean. Prod. 2017, 156, 507–517. [Google Scholar] [CrossRef]
- Bakhshi, M.; Soheili, A.; Dalalbashi, A. Optimization of a structural lightweight fiber-reinforced concrete for best performance under impact loading. Cem. Concr. Compos. 2023, 136, 104875. [Google Scholar] [CrossRef]
- Stefanidou, M.; Pachta, V.; Konstantinidis, G. Exploitation of waste perlite products in lime-based mortars and grouts. Sustain. Chem. Pharm. 2023, 32, 101024. [Google Scholar] [CrossRef]
- Elsheikh, M.Y.; Elshami, A.A.; Mohsen, I.A. Green Concrete Utilizing Andesite and Rhyolite Aggregate. Int. J. Civ. Eng. Technol. (IJCIET) 2020, 11, 1–15. [Google Scholar] [CrossRef]
- Karahüseyin, S.; Erdoğdu, Ş. Evaluation of Ground Rhyolite and Metakaolin in View of Preventing Delayed Ettringite Formation in the Long Term. Int. J. Civ. Eng. 2023, 21, 251–264. [Google Scholar] [CrossRef]
- Abdelfattah, M.M.; Géber, R.; Kocserha, I. Enhancing the properties of lightweight aggregates using volcanic rock additive materials. J. Build. Eng. 2023, 63, 105426. [Google Scholar] [CrossRef]
- Baki, V.A.; Nayır, S.; Erdoğdu, Ş.; Ustabaş, İ. Determination of the Pozzolanic Activities of Trachyte and Rhyolite and Comparison of the Test Methods Implemented. Int. J. Civ. Eng. 2020, 18, 1053–1066. [Google Scholar] [CrossRef]
- Menéndez Méndez, E.; Santos Silva, A. Total Alkalis in Concrete—Contribution to Alkali-silica Reaction; State-of-the-Art Report of the RILEM Technical Committee 258-AAA WP3; Springer: Cham, Switzerland, 2025; Volume 40. [Google Scholar]
- Xiao, R.; Prentice, D.; Collin, M.; Balonis, M.; La Plante, E.; Torabzadegan, M.; Gadt, T.; Sant, G. Calcium nitrate effectively mitigates alkali–silica reaction by surface passivation of reactive aggregates. J. Am. Ceram. Soc. 2024, 107, 7513–7527. [Google Scholar] [CrossRef]
- EN 197-1:2011; Cement—Part 1: Composition, Specifications and Conformity Criteria for Common Cements. CEN (European Committee for Standardization), Management Centre: Brussels, Belgium, 2011.
- EN 12390-1:2021; Testing Hardened Concrete Shape, Dimensions and Other Requirements for Specimens and Moulds. CEN (European Committee for Standardization), Management Centre: Brussels, Belgium, 2021.
- EN 12390-3:2019; Testing Hardened Concrete—Part 3: Compressive Strength of Test Specimens. CEN (European Committee for Standardization), Management Centre: Brussels, Belgium, 2019.
- EN 12504-4:2021; Testing concrete in structures—Part 4: Determination of ultrasonic pulse velocity. CEN (European Committee for Standardization), Management Centre: Brussels, Belgium, 2021.
- ASTM C 597-02; Standard Test Method for Pulse Velocity Through Concrete. ASTM International: West Conshohocken, PA, USA, 2010.
- EN 12504-2:2021; Testing Concrete in Structures—Part 2: Non-Destructive Testing—Determination of Rebound Number. CEN (European Committee for Standardization), Management Centre: Brussels, Belgium, 2021.
- D.M. 17.01.2018; Technical Standards for Constructions (Norme Tecniche per le Costruzioni). Italian Ministry of Infrastructures and Transportation: Rome, Italy, 2018.
- BRITISH STANDARD BS 8110-2: 1985; Structural Use of Concrete—Part 2: Code of Practice for Special Circumstances ICS 91.080.40. BSI: London, UK, 1985.
- Stochino, F.; Alibeigibeni, A.; Milia, A.; Zucca, M.; Pani, L.; Simoncelli, M. Environmental and economic analysis of using recycled concrete aggregates in composite steel-concrete slabs. In Computational Science and Its Applications—ICCSA 2023 Workshops, Proceedings of the 23rd International Conference on Computational Science and its Applications, ICCSA 2023, Athens, Greece, 3–6 July 2023; Lecture Note in Computer Science; Springer: Cham, Switzerland, 2023; Volume 14110, pp. 277–288. [Google Scholar]
- Park, K.B.; Lin, R.S.; Han, Y.; Wang, X.Y. Model-based methods to produce greener metakaolin composite concrete. Appl. Sci. 2021, 11, 10704. [Google Scholar] [CrossRef]
- EPA United States Environmental Protection Agency in conjunction; U.S. Department of Transportation; U.S. Department of Energy. Study on Increasing the Usage of Recovered Mineral Components in Federally Funded Projects Involving Procurement of Cement or Concrete to Address Safe, Accountable, Flexible, Efficient Transportation Equity Act: A Legacy for Users; Report to Congress, EPA530-R-08-007; EPA: Washington, DC, USA, 2008. [Google Scholar]


Disclaimer/Publisher’s Note: The statements, opinions and data contained in all publications are solely those of the individual author(s) and contributor(s) and not of MDPI and/or the editor(s). MDPI and/or the editor(s) disclaim responsibility for any injury to people or property resulting from any ideas, methods, instructions or products referred to in the content. |
© 2025 by the authors. Licensee MDPI, Basel, Switzerland. This article is an open access article distributed under the terms and conditions of the Creative Commons Attribution (CC BY) license (https://creativecommons.org/licenses/by/4.0/).