Article

Preprocessing-Free Convolutional Neural Network Model for Arrhythmia Classification Using ECG Images

1
Division of Engineering, Muroran Institute of Technology, 27-1 Mizumoto-cho, Muroran 050-8585, Japan
2
Division of Information and Electronic Engineering, Muroran Institute of Technology, 27-1 Mizumoto-cho, Muroran 050-8585, Japan
3
College of Information and Systems, Muroran Institute of Technology, 27-1 Mizumoto-cho, Muroran 050-8585, Japan
*
Author to whom correspondence should be addressed.
Technologies 2025, 13(4), 128; https://doi.org/10.3390/technologies13040128
Submission received: 3 February 2025 / Revised: 17 March 2025 / Accepted: 24 March 2025 / Published: 26 March 2025

Abstract

:
Arrhythmia, which is characterized by irregular heart rhythms, can lead to life-threatening conditions by disrupting the circulatory system. Thus, early arrhythmia detection is crucial for timely and appropriate patient treatment. Machine learning models have been developed to classify arrhythmia using electrocardiogram (ECG) data, which effectively capture the patterns associated with different abnormalities and achieve high classification performance. However, these models face challenges in terms of input coverage and robustness against data imbalance issues. Typically, existing methods employ a single cardiac cycle as the input, possibly overlooking the intervals between cycles, potentially resulting in the loss of critical temporal information. In addition, limited samples for rare arrhythmia types restrict the involved model’s ability to effectively learn, frequently resulting in low classification accuracy. Furthermore, the classification performance of existing methods on unseen data is not satisfactory owing to insufficient generalizability. To address these limitations, this research proposes a convolutional neural network (CNN) model for arrhythmia classification that incorporates two specialized modules. First, the proposed model utilizes images of three consecutive cardiac cycles as the input to expand the learning scope. Second, we implement a focal loss (FL) function during model training to prioritize minority classes. The experimental results demonstrate that the proposed model outperforms existing methods without requiring data preprocessing. The integration of multicycle ECG images and the FL function substantially enhances the model’s ability to capture ECG patterns, particularly for minority classes. In addition, our model exhibits satisfactory classification performance on unseen data from new patients. These findings suggest that the proposed model is a promising tool for practical application in arrhythmia classification tasks.

1. Introduction

Arrhythmia is a disorder characterized by irregular heart rhythms [1]. Under normal conditions, the heart’s rhythm is regulated by electrical impulses generated by specialized cells within the heart [2], and abnormalities in these electrical impulses can lead to irregular heart rates and rhythms. Many arrhythmias are benign and do not cause notable health issues; however, some can disrupt the blood flow, which can result in serious and potentially life-threatening conditions, e.g., stroke, myocardial infarction, heart failure, or sudden cardiac death [2].
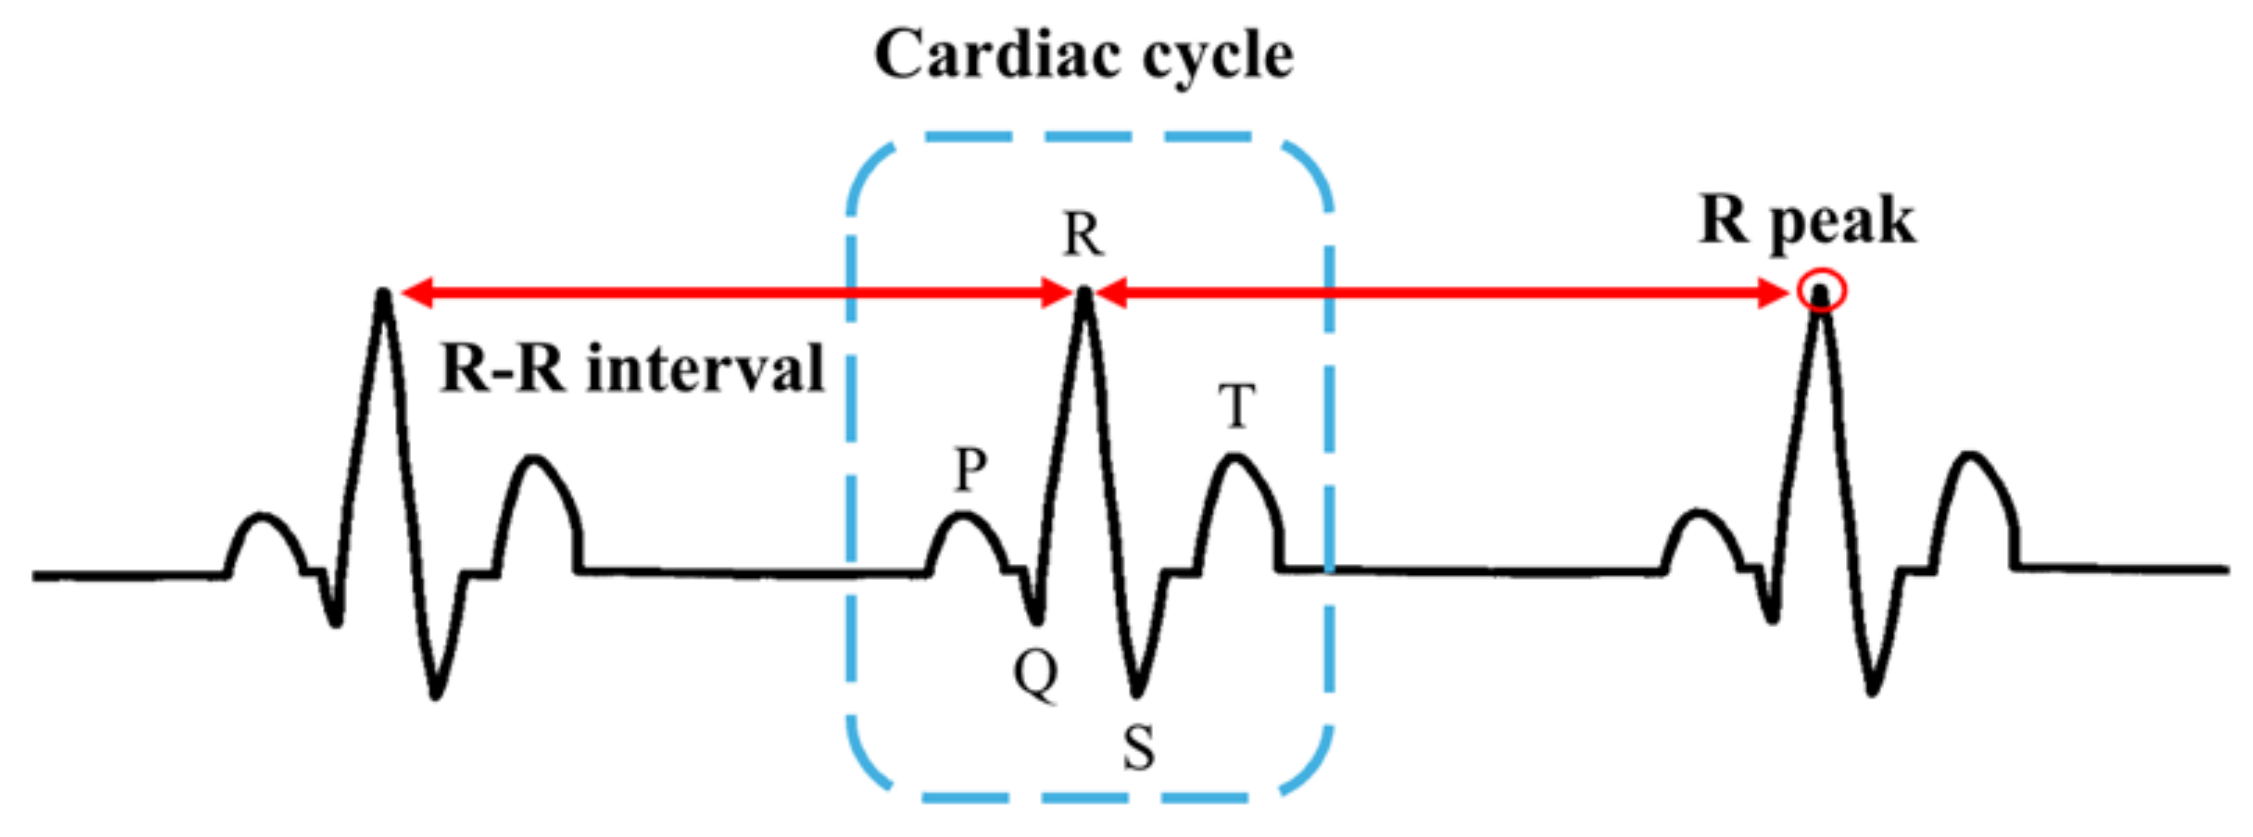
The primary tool employed to detect and diagnose arrhythmia is an electrocardiogram (ECG), which records the electrical activity of the heart [3], and clinicians can identify various cardiovascular disorders by analyzing the electrical activity of the cardiac cycles captured in ECG data. Despite their utility, interpreting ECGs can be time consuming and complex owing to the notable variability in normal and pathological patterns [4].
To address these challenges, machine learning models have been developed and employed for classifying various cardiovascular disorders, including arrhythmia. Numerous studies have demonstrated that machine learning models, particularly deep learning approaches, achieve high arrhythmia classification accuracy [5,
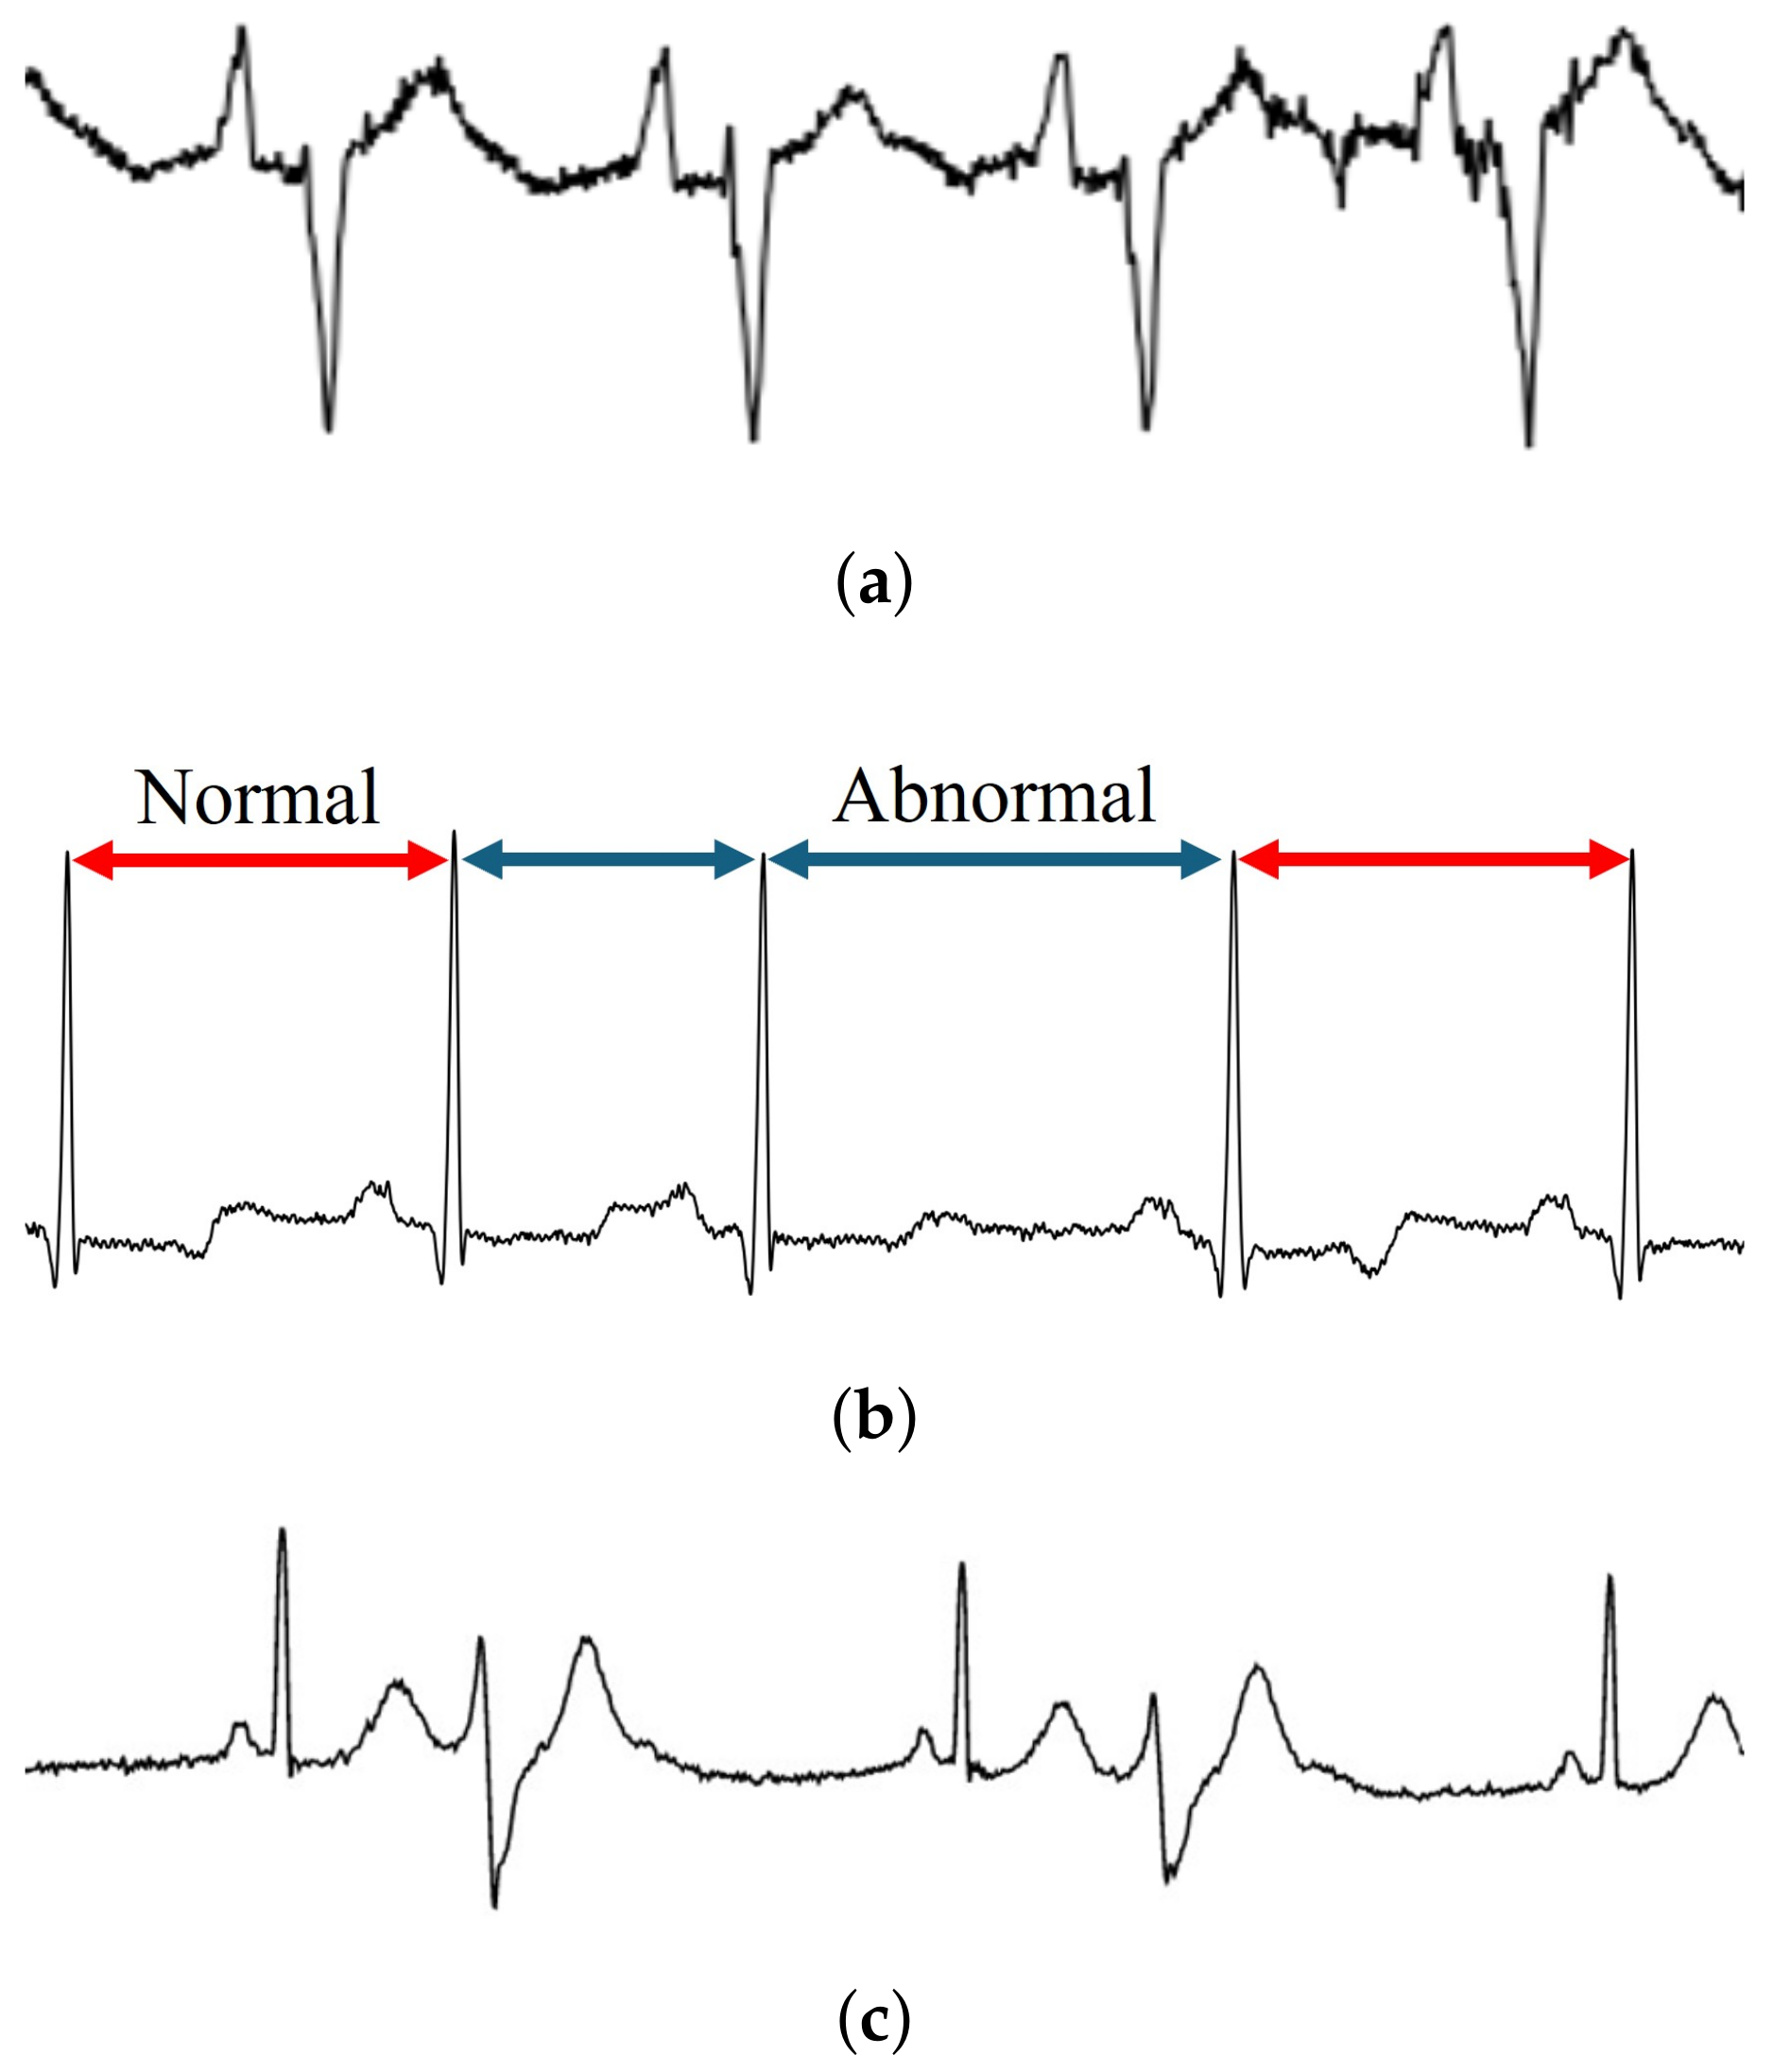
6]. Typically, ECG data are segmented into individual waveforms representing each cardiac cycle, which are used as the input for training models. However, abnormal activity may also occur in the intervals between cardiac cycles; thus, using only an individual cardiac cycle as an input feature may not capture all relevant features that appear between the cardiac cycles [7].
Additionally, data characteristics are another factor that can affect the learning ability of the involved model. Data imbalance due to the rarity of certain types of disorder can negatively impact classification performance [4]. Moreover, the ECG pattern of each patient is influenced by their demographic background [8]. In cases of insufficient generalizability, the model’s classification performance is typically poor when evaluating unseen data from patients because each patient exhibits unique patterns.
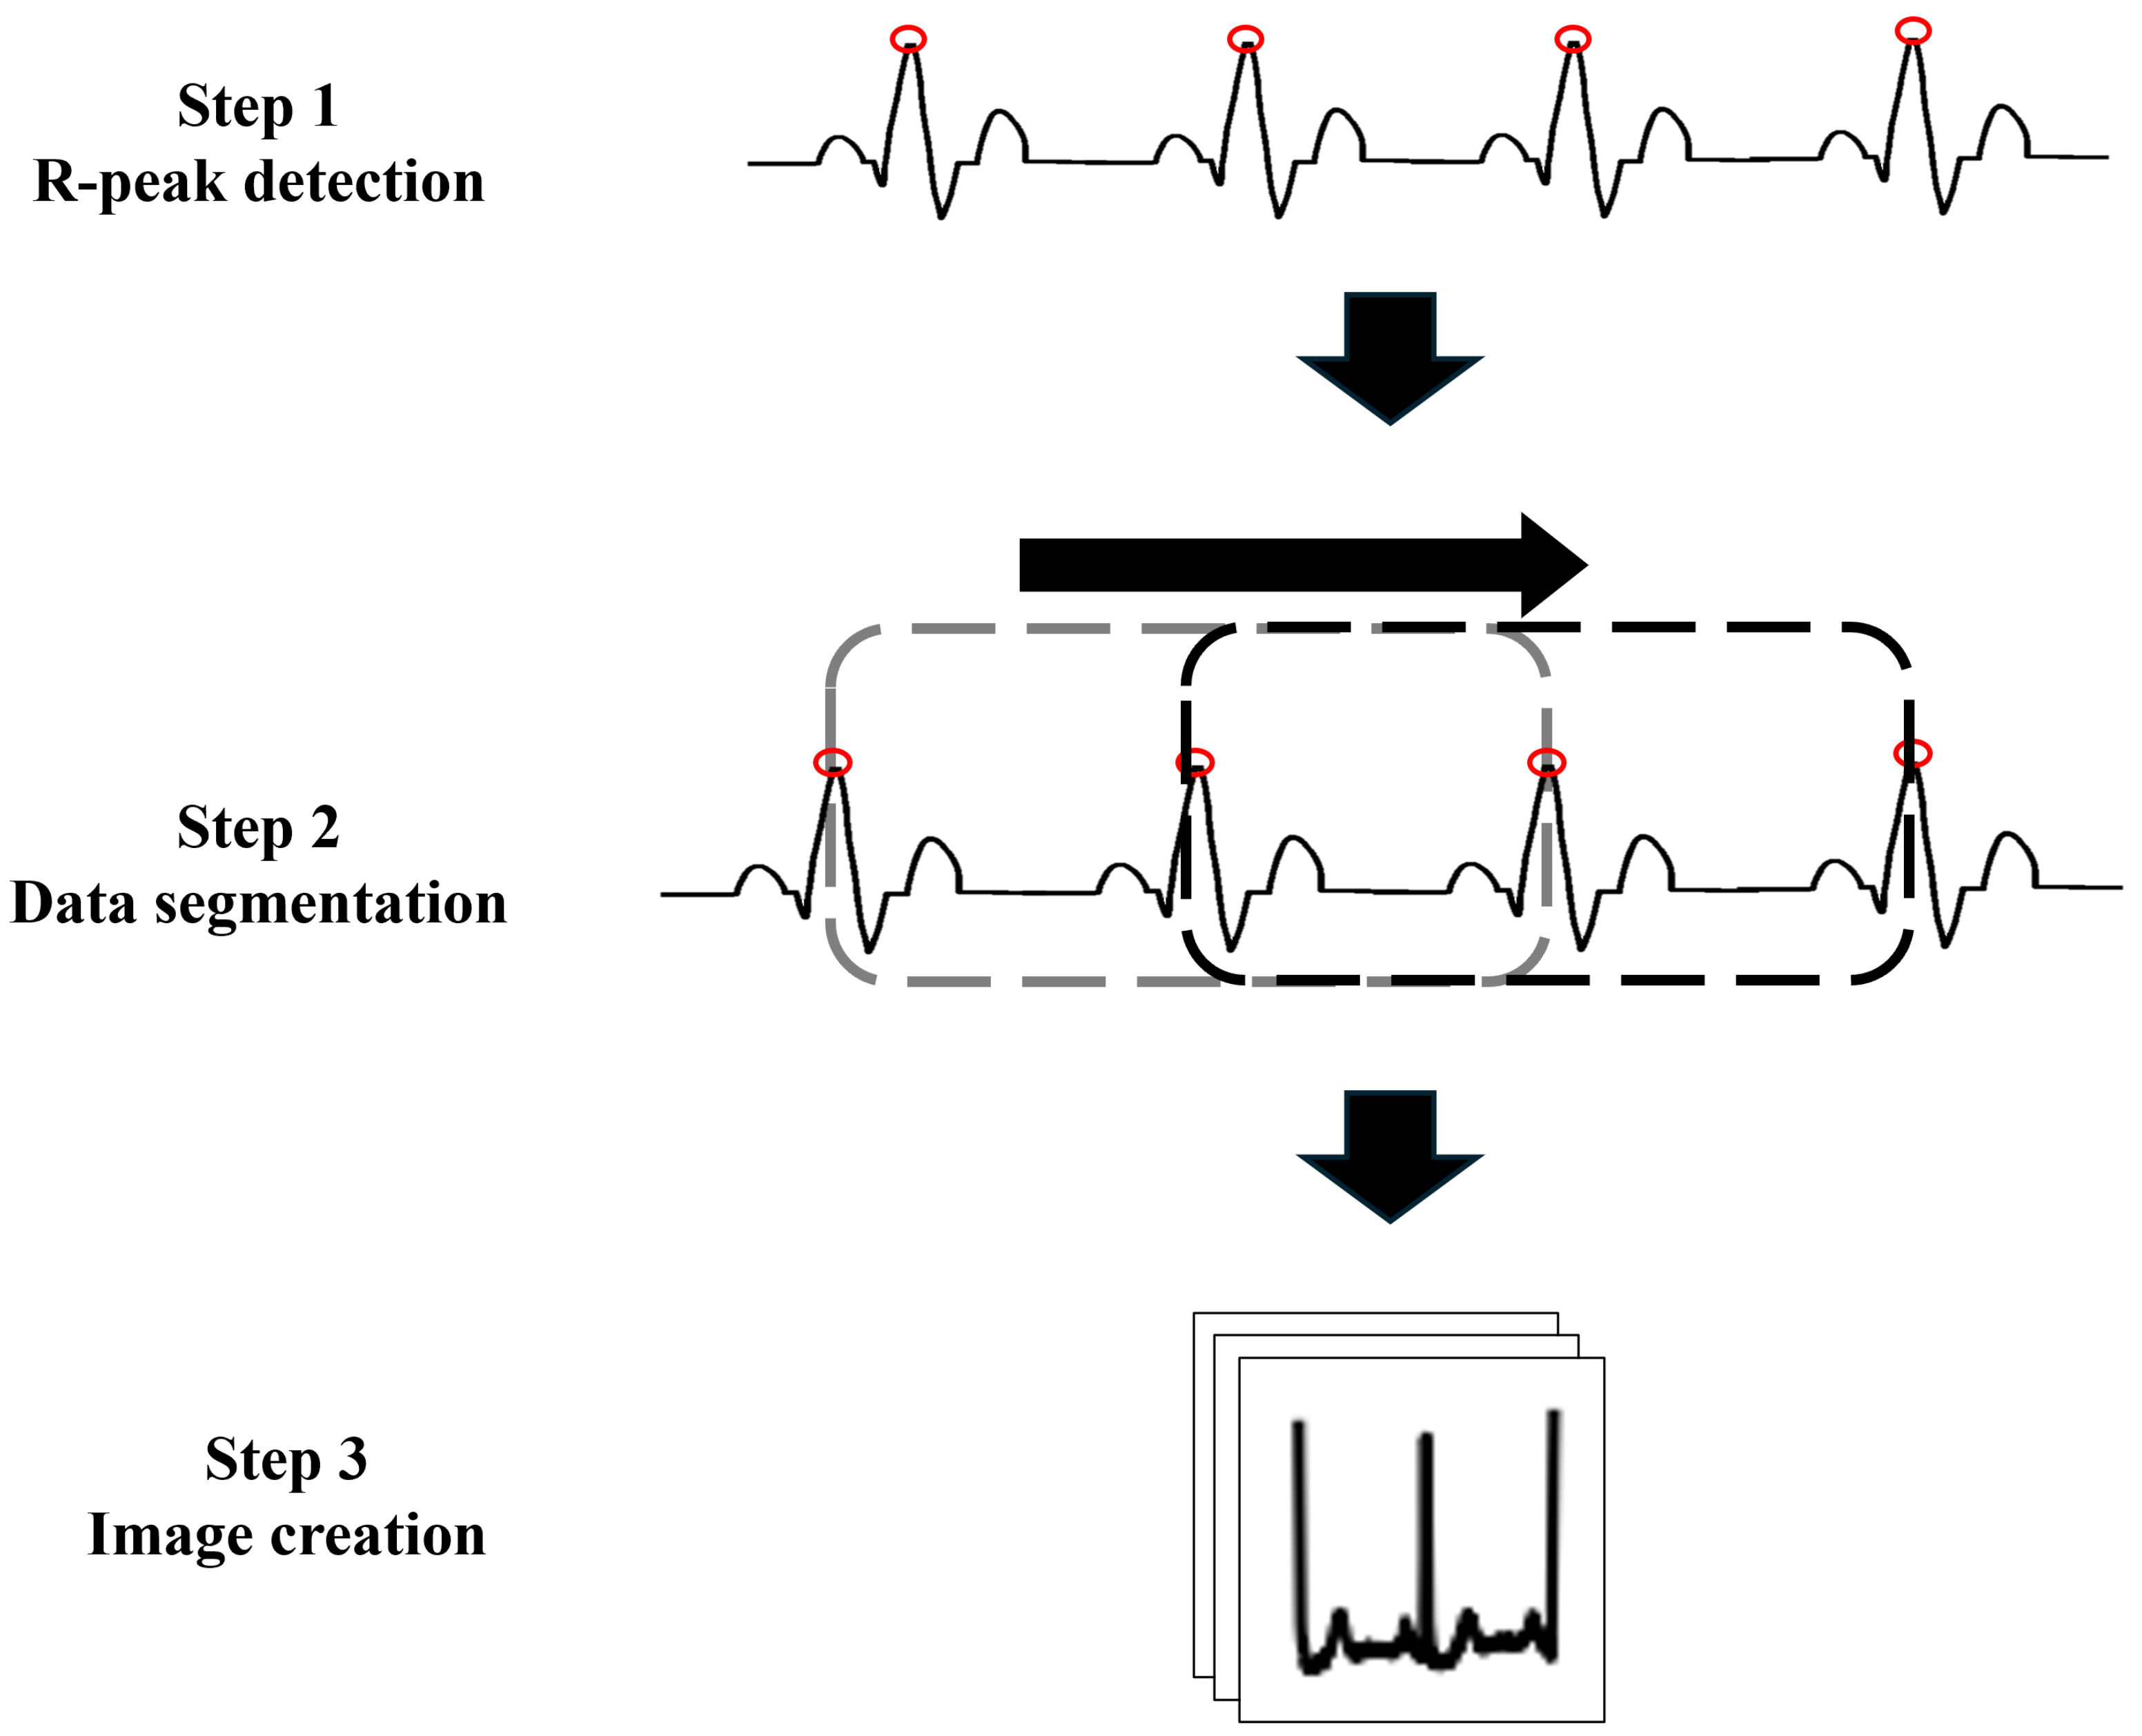
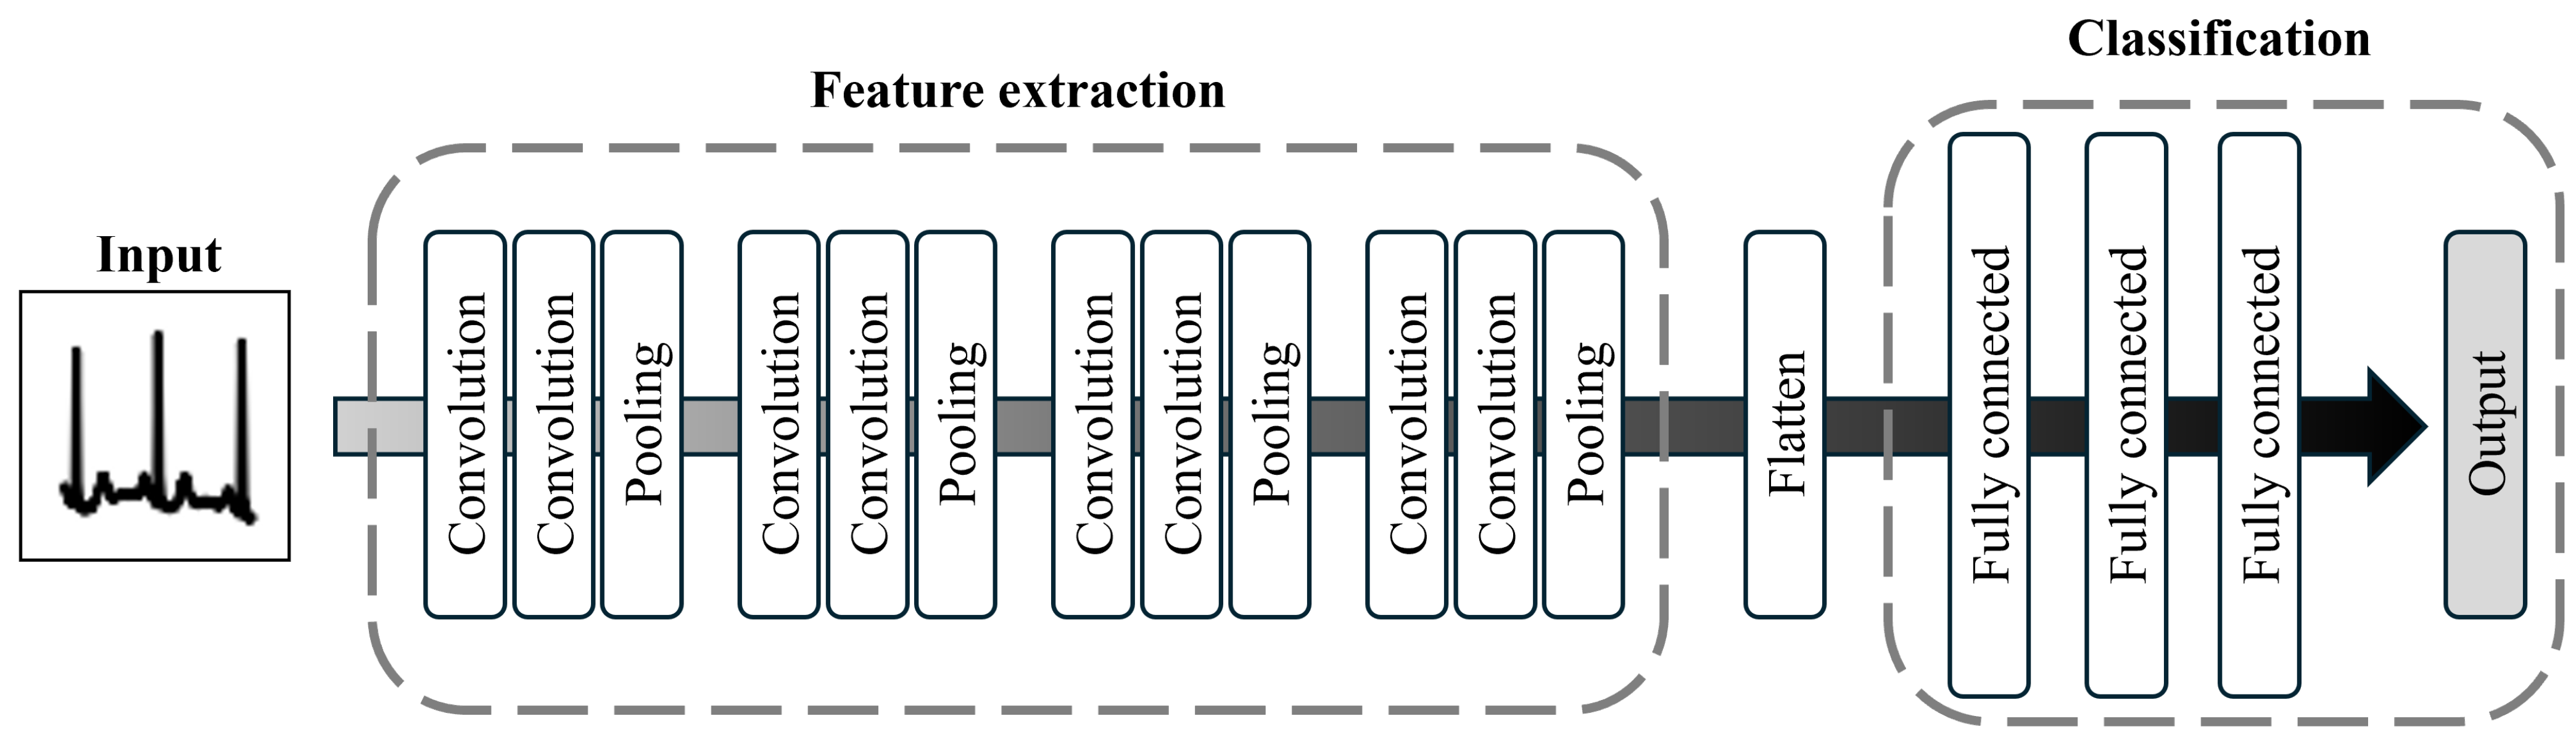
To address these limitations and enhance the performance of classification models, we develop a machine learning approach that addresses the challenges of input representation and data imbalance. Herein, we propose a convolutional neural network (CNN)-based arrhythmia classification model that incorporates two specialized modules to address these issues. The first module focuses on data preparation. Here, rather than using individual cardiac cycles, images of three consecutive cardiac cycles are utilized as the input to expand the learning frame. The second module addresses model training by introducing a focal loss (FL) function to assign notable importance to the minority class [9]. These two innovations allow the model to capture abnormal patterns both within and between cardiac cycles, thereby improving the classification performance for the minority class.
To evaluate the proposed model, we assess its classification performance across eight arrhythmia classes using three metrics—accuracy, specificity, and sensitivity. In addition, we compare the performance of the proposed model with that of another CNN-based model that employs a different loss function, i.e., the categorical cross-entropy error (CCE).
The primary contributions of this study are summarized as follows. First, extending the learning frame with images that include multiple cardiac cycles enables the model to extract more features from the ECG data, which improves classification performance. Second, as discussed in a previous study [5], utilizing images as input helps mitigate noise and trend effects in the ECG data. Transforming numerical time-series data into images reduces the model’s dependence on complex and time-consuming data preprocessing steps, which is advantageous in terms of realizing real-time classification. Third, the implementation of the FL function improves classification efficiency by up-weighting the minority class, enhancing the overall performance of the model in imbalanced-data scenarios.
The remainder of this paper is structured as follows. Section 2 provides background information on relevant topics. Section 3 describes the methodology of the proposed CNN model. The experimental results are presented in Section 4, and the results are analyzed and discussed in detail in Section 5, including a performance comparison with an existing method. Finally, the paper is concluded in Section 6.

2. Background

2.1. ECG

As mentioned previously, an ECG records the electrical activity of the heart [6], and this activity, including depolarization and repolarization, is represented as a signal. Figure 1 shows an example of ECG data, illustrating the involved morphology and providing a brief description. In ECG data, an individual cardiac cycle is electrically represented by P, Q, R, S, and T waves. The interval between two successive R waves is referred to as the R–R interval. Under normal conditions, each component exhibits a distinct morphology, and deviations from this typical morphology can indicate abnormal electrical activity, which may suggest cardiac dysfunction [10].
Abnormalities in the morphology are possible in any of the components. Herein, abnormal ECGs are categorized into three groups based on their characteristics (Figure 2). First, we consider shape abnormalities (Figure 2a), where the shape of components either changes or disappears from the cycle. Second, we consider R–R interval abnormalities. In these cases, as shown in Figure 2b, the length of R–R intervals becomes abnormal, either shorter or longer than usual [11]. The third group involves a mixture of shape and R–R interval abnormalities. As shown in Figure 2c, the abnormalities in the first two groups are visible. By analyzing these abnormalities, the location or cause of the abnormal electrical activity can be identified.
Owing to its low cost and high accessibility, ECG testing has become a primary diagnostic tool for cardiovascular diseases [12]; however, the interpretation of ECG data is challenging, even for experienced physicians [13]. Each ECG signal pattern is unique to the individual and influenced by various demographic factors, e.g., age, gender, and physical activity [14]. This complexity can lead to misdiagnoses [13]. In addition, ECG data may contain noise that resembles the actual signal, rendering complete noise elimination difficult [14]. To overcome the difficulties associated with effective interpretation, machine learning models have been developed to automatically classify various cardiovascular diseases, including arrhythmia.

2.2. Machine Learning-Based Arrhythmia Classification

As previously discussed, machine learning-based arrhythmia classification models have been employed to address the challenges of ECG interpretation. To perform classification, the models must be trained to identify patterns in ECG data through various features, e.g., the R–R interval, QRS duration, and S–T segment. In this regard, a study [15] compared the performance of three models, i.e., support vector machine (SVM), neural network, and probabilistic neural network models. These models were trained using features extracted by discrete wavelet transform, principal component analysis, linear discriminant analysis, and independent component analysis. Subsequently, a classification model was developed [16] based on the k-nearest neighbors algorithm using the R–R interval to classify premature ventricular contraction—a type of arrhythmia. Despite the high classification accuracy reported in these studies, the extraction and selection of appropriate features remain challenging because they frequently require manual intervention and specialized knowledge of cardiac disorders.
Deep learning models have been introduced to address the challenges associated with feature extraction and selection, and such models, with their automatic feature extraction capabilities, have been widely employed for ECG-based classification tasks. For example, a study [17] employed a hybrid model that combined a CNN and bidirectional long short-term memory to identify five arrhythmia classes. This model was designed to capture temporal and morphological information from ECG data. In addition, another study [18] developed a deep CNN with residual blocks to classify arrhythmia using numerical ECG data. A two-dimensional CNN approach for arrhythmia classification has also been proposed [5], where ECG data were converted to images to be used as input. The authors found that this image-based approach can reduce the noise and trend effects in time-series data. Furthermore, other deep leaning techniques, e.g., the use of a generative adversarial network (GAN) and long short-term memory (LSTM) networks, have been developed and trained for this task [19,20,21,22].
Previous machine learning models have demonstrated satisfactory performance in arrhythmia classification tasks, suggesting that machine learning is an effective tool for capturing patterns in ECG data. However, improvement in model construction remains crucial. Typically, ECG data are segmented into individual cardiac cycles prior to being input to the involved model. Nonetheless, abnormalities can occur outside these segments, which means that features spanning two or more cardiac cycles can be overlooked. Thus, the model may not fully learn and detect all abnormal characteristics, e.g., the irregular R–R intervals observed in arrhythmia. In addition, handling imbalanced data is a notable concern. For example, in real-world scenarios, some arrhythmia types are rare, resulting in limited data availability, and data scarcity can hinder the model’s ability to effectively capture patterns, frequently resulting in poor classification performance for minority classes [23].
Herein, a CNN is employed as the classification model owing to its outstanding performance [5,24,25,26,27,28]. To enhance the arrhythmia classification performance, we introduce two key modules for data preparation and model training in the construction of the CNN model. The data preparation module extends the model’s learning frame by incorporating multiple cardiac cycles, which allows for a more comprehensive capture of ECG abnormalities. The model training module addresses the imbalanced-data problem, with a focus on setting an appropriate loss function, which is a critical component in optimizing the weights of deep learning models [29], and careful selection of the loss function is essential. In the proposed CNN model, the FL function is implemented to prioritize minority classes that are difficult to identify by assigning greater weight to these instances [9]. By integrating these two modules, the proposed CNN model can achieve improved arrhythmia classification performance.

3. Methodology

3.1. Dataset

To train the arrhythmia classification model, ECG data in numerical format were obtained from the Massachusetts Institute of Technology and Beth Israel Hospital (MIT-BIH) Arrhythmia database [30,31]. The database comprises 48 ECG records, each of which is 30 min long. The data were collected from 47 subjects at Boston’s BIH from 1975 to 1979. Notably, annotations indicating the heart beat types are provided in the MIT-BIH Arrhythmia database. Table 1 shows the details of the arrhythmia beat types included in the dataset. In total, eight arrhythmia beat types are included.

3.2. Model Construction and Classification

Figure 3 presents an overview of the study methodology. The study was divided into the following three processes. Initially, the numerical ECG data were transformed into image data (hereinafter referred to as ECG images). Then, the ECG images were input to two CNN models with different loss functions. The models then learned the characteristics of the ECG images. Finally, the classification performance of each model was evaluated using two types of cross-validation (CV), i.e., randomized 10-fold CV and leave-one-person-out CV.

3.2.1. Data Preparation

To utilize ECG data as input to a classification model, the data can be treated as either a signal or an image. However, according to a previous study, by treating the ECG data as a signal, some characteristics in the QRS complex cannot be captured by the model [32]. That study also compared the performance of signal-based and image-based models, revealing that better pattern capturing and classification results were obtained using an image as the input. In addition, as reported by Jun et al., using images as the input can prevent noise and trend effects in the data [5]. In accordance with the findings of these previous studies, the ECG data used as the input in the current study were treated as images.
In previous studies, an individual-cardiac-cycle ECG image was commonly utilized. However, this approach may not adequately capture the abnormal morphology of intervals, e.g., R–R intervals, thereby resulting in information loss and reducing the model performance. To cover abnormal morphology as much as possible, herein an ECG image of multiple cycles was used as the input to the model.
Figure 4 illustrates the three steps involved in image creation. First, the R-peak of all cardiac cycles was detected using the WFDB toolbox [33] Python package version 4.1.2. Then, the data were segmented, beginning from the first R-peak. Here, the segmentation window covered two half-cycles and one complete cycle. Each segment of ECG data was then converted to a grayscale image (64 × 64 pixels), as shown in Figure 4.
Table 2 summarizes the number of ECG images generated using the image creation method. In total, 26,714 ECG images were generated for use herein.

3.2.2. CNN Model Construction

To classify the arrhythmia classes, a CNN, which exhibits an architecture of artificial neural networks [34], was selected as the classification model in this study. Owing to their excellent performance, CNNs are employed for numerous tasks, including image classification [35]. Typically, a CNN comprises three types of layer, i.e., convolution, pooling, and fully connected layers. Through the convolution and pooling layers, the CNN model can extract features from the input data, thereby eliminating the need for manual feature extraction.
In this study, a CNN was employed as an end-to-end model for both feature extraction and classification. The model architecture is shown in Figure 5, and the structural details of the model are given in Table 3.
Similar to other deep learning models, CNN models include a loss function as a hyperparameter. As previously mentioned, the loss function plays a crucial role in the performance of the model. In this study, two prominent loss functions, i.e., the CCE loss and FL functions, were employed, and two CNN models were developed, one for the CCE loss function (referred to as CNN-CCE) and the other for the FL function (referred to as CNN-FL). Notably, both models shared the same architecture detailed in Table 3. Each loss function is described in detail in the following.
  • CCE
    The CCE loss function is commonly used for multiclass classification tasks. This function measures the dissimilarity between the probability distribution of the true answer and the predicted output [9]. The CCE loss function is calculated as follows:
    CCE = 1 N i = 1 N j = 1 C t i , j · log y i , j .
    Here, N denotes the number of samples, C denotes the number of classes, ti,j denotes the true label of the i-th sample for the j-th class, yi,j denotes the predicted probability of the i-th sample for the j-th class, and log is the natural logarithm.
    The loss is calculated using the CCE loss for each sample and then averaged across all samples in the entire minibatch.
  • FL
    The FL function is a modification of the CCE loss function that addresses the class imbalance problem, which is handled by adjusting the weight of each class based on the difficulty of predicting a given class. Specifically, if a class is difficult to predict, its weight is increased; in contrast, if a class is easy to predict, its weight is reduced [29]. The FL function for the multiclass classification problem can be calculated as follows [36]:
    FL = i = 1 C α ( 1 ( y i , j ) ) γ · CCE .
    Here, C denotes the number of classes, yi,j denotes the predicted probability of the i-th sample for the j-th class, α is the weight control factor, γ is the focusing factor, and CCE represents the CCE error.
    In addition, the hyperparameters α and γ , which are used to control the importance of each class and the rate of down-weighting [37], respectively, were set to 2.5 and 1.0, respectively, in this study. Notably, the GridSearchCV approach was employed to tune these hyperparameters.

3.3. Evaluation

To evaluate and compare the performance of the classification models, two experimental CV settings were considered, and the results obtained for each setting were evaluated according to three performance metrics.

3.3.1. Experimental Settings

  • Setting 1: 10-fold CV
    The process of 10-fold CV is widely used to assess the generalizability of a model [38]. In this approach, the data were divided equally into ten folds; during each iteration of the CV process, a single fold was reserved as the testing set and the remaining folds were utilized as the training set.
    Notably, data from the same patients can be included in the same fold in this CV process.
  • Setting 2: Leave-one-person-out CV
    As mentioned previously, the ECG patterns of individual patients can vary considerably. The ECG patterns of new patients may not be present in the training dataset, which presents a challenge in terms of effectively capturing these diverse patterns. This can lead to false diagnosis if the model is not generalized sufficiently.
    In addition, we employed leave-one-person-out CV to simulate real-world scenarios. Here, the data were initially divided based on the individuals (patients and healthy subjects), with each fold containing data from only a single person. Thus, the number of folds was equal to the number of individuals. Similar to the 10-fold CV process, in each iteration, the ECG data from a single individual were reserved as the testing set and the ECG data from the remaining individuals were utilized as the training set [39].
    This process was repeated for each individual in the dataset. Notably, there were two classes, i.e., the VFW and VEB classes, which had only one patient, which is not sufficient to perform leave-one-person-out CV. Thus, these classes were excluded from this setting.

3.3.2. Performance Metrics

After performing the experiments, the results obtained for each setting were evaluated according to four performance metrics, i.e., accuracy (Acc), specificity (Spe), sensitivity (Sen) and F1-score (F1) [40].
  • Accuracy is a measurement of the classification correctness and is calculated as follows:
    A c c u r a c y = T P + T N T P + F P + T N + F N .
  • Specificity (Spe) is utilized to assess the model’s ability to classify actual negative data, frequently referred to as the true negative rate, and is defined as follows:
    S p e c i f i c i t y = T N T N + F P .
  • Sensitivity (Sen), which is also referred to as the true positive rate, is used to evaluate the model’s ability to classify actual positive data and is calculated as follows:
    S e n s i t i v i t y = T P T P + F N .
  • The F1-score is a metric employed to evaluate a model’s performance in handling imbalanced data and is defined as follows:
    F1-score = 2 × T P 2 × T P + F P + F N .
In Equations (3)–(6), TP, FP, TN, and FN represent true positive, false positive, true negative, and false negative, respectively.

4. Results

4.1. Classification Results for Setting 1 (10-Fold CV)

With setting 1, the CNN-CCE and CNN-FL models were evaluated using 10-fold CV. Here, the accuracy, specificity, and sensitivity metrics were averaged, and the results are shown in Table 4.
As shown in Table 4, the results demonstrate that both the CNN-CCE and CNN-FL models exhibit high performance in arrhythmia classification. For the CNN-CCE model, the accuracy, specificity, sensitivity, and F1-score values were 99.04%, 99.53%, 98.44%, and 97.37%, respectively. Meanwhile, the accuracy (99.16%), specificity (99.62%), and sensitivity (98.60%) values obtained by the proposed CNN-FL model were slightly higher.
To evaluate the classification performance of each class, a confusion matrix of accuracy was created for both the CNN-CCE and the CNN-FL models. As shown in Table 5 and Table 6, both models obtained satisfactory performance; however, the proposed CNN-FL model obtained better scores in most classes.

4.2. Classification Results for Setting 2 (Leave-One-Person-Out CV)

In setting 2, each model was evaluated using leave-one-person-out CV, and the average performance values of both models are shown in Table 7.
As can be seen, neither model reached 90% in all metrics. For the CNN-CCE model, the accuracy, specificity, sensitivity, and F1-score values were 81.79%, 85.23%, 77.48%, and 73.88%, respectively. Meanwhile, the proposed CNN-FL model outperformed the CNN-CCE model in terms of accuracy, sensitivity, and F1-score with scores of 83.98%, 85.97%, and 79.21%, respectively. However, the specificity score obtained by the proposed CNN-FL was slightly lower that of the CNN-CCE model.
Similar to setting 1, a confusion matrix of the accuracy was created for both models. As shown in Table 8 and Table 9, the scores of the proposed CNN-FL seem better than CNN-CCE in some classes.

5. Discussion

5.1. Performance Comparison Between the CNN-CCE and CNN-FL Models

Herein, the CCE and FL loss functions were implemented in the construction of two CNN models for the classification of multicycle ECG images. The results obtained for the two CV settings revealed that these models demonstrated considerably different performances.
The first setting corresponded to 10-fold CV, which allowed data from the same patient to be included in both the training and test sets. Here, both the CNN-CCE and CNN-FL models demonstrated high performance, with scores over 96% for all evaluation metrics; however, the proposed CNN-FL model exhibited slightly better performance. As shown in Table 4, the accuracy, specificity, and sensitivity values obtained by the proposed CNN-FL were 0.12%, 0.09%, and 0.16% higher than those of the CNN-CCE model, respectively. The confusion matrix showed similar results. The individual accuracy scores for most classes, especially for the extreme minority classes such as VFW and VEB, demonstrated that the proposed CNN-FL model outperformed the CNN-CCE model.
Then, leave-one-person-out CV was performed in the second experiment. Owing to the unique ECG patterns of each patient, it was difficult for the models to identify unseen data. Compared with setting 1 (10-fold CV), the classification performance of the models in this setting noticeably decreased. Nonetheless, the proposed CNN-FL model still outperformed the CNN-CCE model. According to the results, the specificity score of the proposed CNN-FL model was 2.83% less than that of the CNN-CCE model; however, the accuracy, sensitivity, and F1-score values obtained by the proposed CNN-FL model were 2.19%, 8.49%, and 5.33% higher than those of the CNN-CCE model, respectively. With the higher sensitivity values, the proposed CNN-FL model demonstrated better performance in terms of avoiding false negative predictions. Furthermore, the better F1-score indicated improved ability to handle imbalanced data. In addition, the proposed CNN-FL model identified the minority class, i.e., LBBB, more accurately than the CNN-CCE model (Table 9).
According to the evaluation results, both loss functions performed effectively in terms of identifying different types of arrhythmia; however, after carefully considering the handling of the imbalance problem, the results indicate that the proposed CNN-FL model demonstrated better performance. As mentioned previously, the FL function prioritizes classes based on the difficulty of classifying them. In other words, less difficult classes are assigned lower weight, and this property may have contributed to the more accurate classification of the minority classes.
In addition, the results obtained for setting 2 proved that the proposed CNN-FL model was useful in terms of recognizing and identifying the unseen data correctly. Thus, it can be concluded that using the FL loss function improved the correctness and robustness of the CNN model for the arrhythmia classification task.

5.2. Performance Comparison Between the Proposed CNN and Existing Methods

As discussed in the previous section, the proposed CNN-FL model outperformed the CNN-CCE model. Herein, the proposed CNN-FL model is compared with other existing methods.
For setting 1, Table 10 presents the 10-fold CV results from seven existing methods. As can be seen, the performance of the proposed CNN-FL model is comparable to that of the compared methods. In addition, when compared with existing methods that included the same number of classes, the sensitivity and specificity values obtained by the proposed CNN-FL model were the highest, and the proposed model performed better when classifying the minority class. As shown in Table 11, the accuracy value obtained for the APC class using the proposed model was higher than those obtained in previous research [5,41,42].
Table 12 compares the results of the approach involving leave-one-person-out CV with those of two existing studies that conducted similar experiments. As shown, the accuracy and specificity values obtained by the proposed CNN-FL model did not exceed those of the compared methods. However, the sensitivity score obtained by the proposed CNN-FL model was substantially higher than those of the compared methods. It can be concluded that the proposed CNN-FL model was more effective in terms of preventing false negatives than the existing methods. Nevertheless, at the same time, CNN-FL showed a higher rate of false positive predictions.
Even without data preprocessing, the proposed CNN-FL model was able to identify arrhythmia comparably to existing methods, which can be attributed to two main reasons.
The first reason pertains to data preparation. In the current study, three R-peak ECG images were utilized as the input to capture the shape of the waveform and the intervals between the R-peaks. Thus, the model could capture and learn more characteristics of each arrhythmia. More detail in the ECG image could lead to more accurate disease classification.
The second reason involves the handling of imbalanced data. Herein, two loss functions, i.e., CCE and FL, were compared to investigate which loss function handled this problem more effectively. As discussed previously, with the FL function, more weight is assigned to the minority class than the majority class. This allowed the proposed CNN-FL model to prioritize the class with fewer data, thereby enabling more accurate predictions.

5.3. Challenges and Future Study

Based on the evaluation and comparison results, the proposed CNN-FL model achieved accuracy comparable to or exceeding that of existing methods in the arrhythmia classification task, despite utilizing only ECG images without complex data preprocessing. However, as demonstrated by the results, the values of some metrics decreased, and after investigation of these issues, the causes were identified.
As mentioned previously, ECG images were employed as the model input herein. According to a previous study [
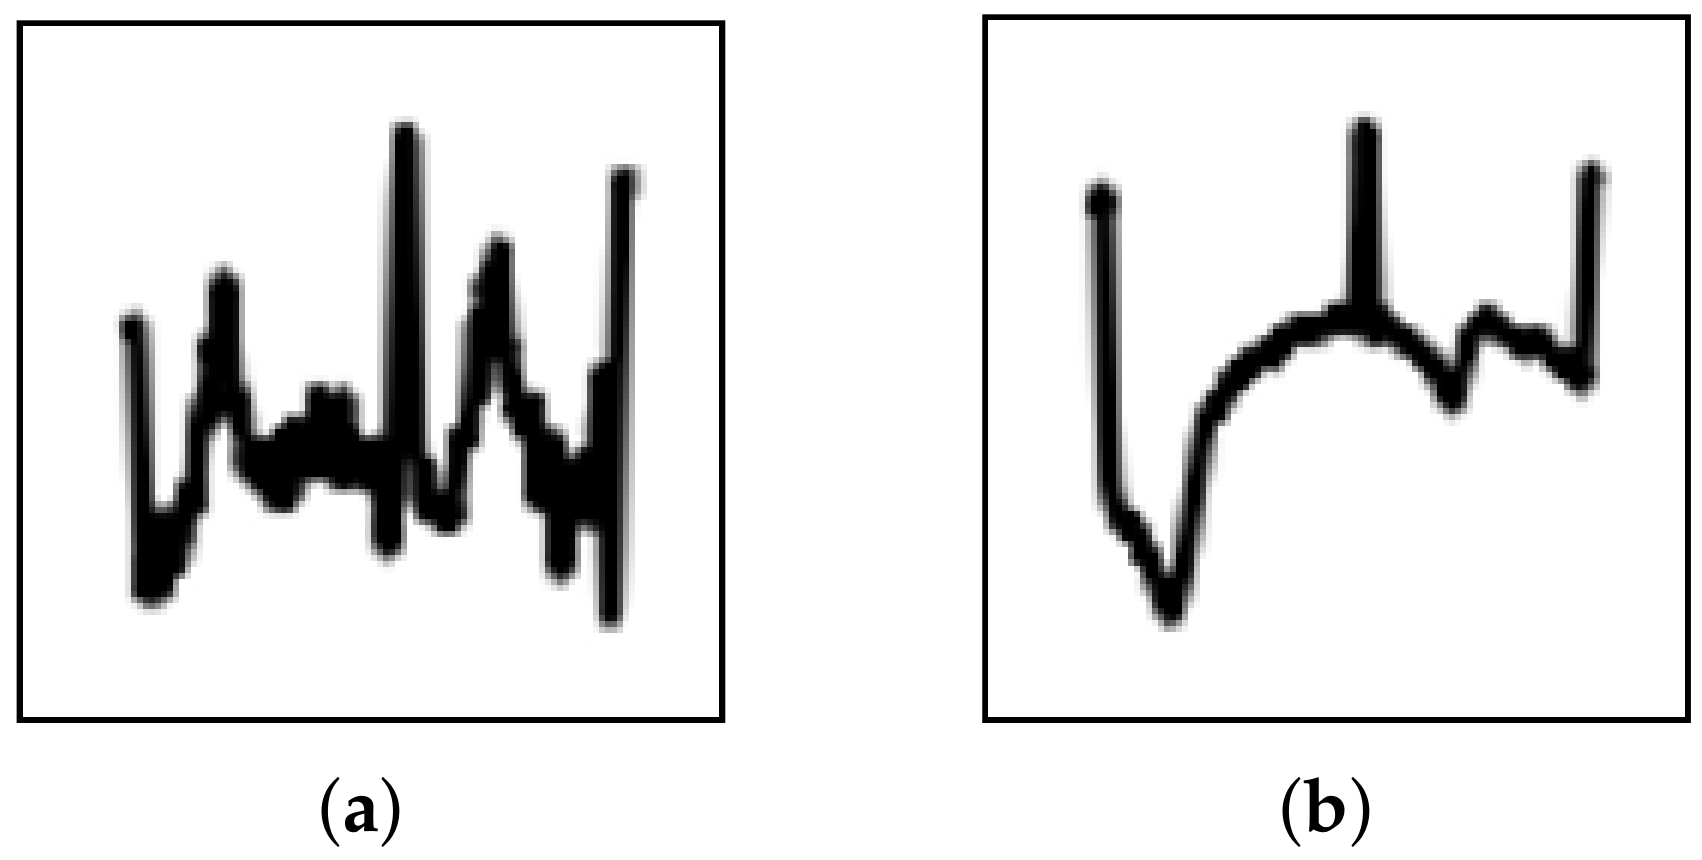
5], transforming signal data to images can reduce the effects of noise and trends; however, during the evaluation, several images were misidentified. Upon further investigation, these misidentified images could be categorized into two types, i.e., strong noise and strong trend (Figure 6). This suggests that image transformation may not eliminate these effects completely. Thus, the CNN must be improved to prevent the effects from noise and trends. As suggested in previous research [48], enhancing the denoising and detrending abilities of CNNs can be realized by incorporating residual blocks and attention mechanisms. To solve this problem, implementing these components should be considered in future study.
In addition, to implement the model for practical application, various factors must be considered. As previously mentioned, ECG patterns exhibit high variance: thus, the model should be generalized to handle unseen data from new patients. From the leave-one-person-out results, it can be seen that the proposed CNN-FL model outperformed the compared models; however, the scores were less than 90%. With a small dataset like the MIT-BIH Arrhythmia dataset, the model may not handle the variance in the patterns effectively, thereby leading to poor performance and generalization issues. To address this, future studies could incorporate larger and more diverse datasets, along with data augmentation techniques. These steps could enhance the model’s ability to generalize to new patients and reduce the impact of dataset limitations.
Another point to consider is resource consumption. Deep learning models receive considerable attention owing to their high performance; however, processing such models requires huge computational resources. In this study, a high-performance computer was used to develop and evaluate the proposed CNN-FL model. Thus, it may be challenging to implement the proposed CNN-FL model on small devices for real-time classification tasks. To address this limitation, the size and complexity of the model should be reduced using model compression techniques.
Regarding investigation and model performance evaluation, future work should address several points to improve the effectiveness of the classification model for arrhythmia. Herein, the proposed model was evaluated using a single dataset, MIT-BIH Arrhythmia; however, future work should consider testing the model on additional datasets to improve generalizability. Exploring the possibility of using ECG data in its native format as input could provide deeper insights and improve the model’s performance. Moreover, an ablation study is needed to confirm the contributions of image usage and the FL function as well as to evaluate how these factors influence the model’s performance. Additionally, using techniques such as Grad-CAM [49] could offer more interpretability in understanding the model’s decision-making process.
Finally, to improve model performance and reduce the computational burden, the use of transfer learning could be explored by leveraging pretrained models, particularly in scenarios with limited data. This approach may help improve the model’s accuracy while maintaining efficiency.

6. Conclusions

Herein, a CNN-based model was proposed to classify different types of arrhythmia. Based on the evaluation experiments, the primary conclusions are summarized as follows.
  • Using ECG images containing three R-peaks, the proposed CNN-FL model can capture the waveform shape and R-peak intervals, thereby effectively learning ECG abnormalities associated with arrhythmia.
  • The FL function enables effective learning of arrhythmia ECGs from minority classes.
  • Compared with those corresponding to existing methods, the sensitivity of the proposed CNN-FL model, i.e., the model’s arrhythmia detection capability, is substantially higher.
Thus, we expect that the proposed CNN-FL model will be an effective tool for discriminating different types of arrhythmia in practical application. In the future, the architecture of the model will be modified to enhance its ability to prevent noise and trend effects. In addition, effective model compression techniques should be considered to implement the proposed model for practical application in real-world situations.

Author Contributions

Conceptualization, C.P. and Y.O.; methodology, C.P. and Y.O.; validation, C.P. and Y.O.; formal analysis, C.P.; investigation, C.P.; resources, C.P.; data curation, C.P.; writing—original draft preparation, C.P. and Y.O.; writing—review and editing, C.P., Y.O., R.F., and Y.Y.; visualization, C.P., R.F., and Y.Y.; supervision, Y.O.; funding acquisition, Y.O. All authors have read and agreed to the published version of the manuscript.

Funding

This work was supported by JSPS KAKENHI Grant Number JP23K04300.

Institutional Review Board Statement

Not applicable.

Data Availability Statement

Data and source code in this study are available publicly on GitHub at https://github.com/Chotirose28/arrhythmia_classification.git (accessed on 10 February 2025). The instructions are also included in the repository.

Conflicts of Interest

The authors declare no conflicts of interest.

References

  1. Desai, D.S.; Hajouli, S. Arrhythmias; StatPearls Publishing: St. Petersburg, FL, USA, 2024. [Google Scholar]
  2. Humphreys, M.; Warlow, C.; McGowan, J. Arrhythmias and their Management. In Nursing the Cardiac Patient; John Wiley & Sons: Hoboken, NJ, USA, 2011; pp. 132–155. [Google Scholar]
  3. Habineza, T.; Ribeiro, A.H.; Gedon, D.; Behar, J.A.; Ribeiro, A.L.P.; Schön, T.B. End-to-end risk prediction of atrial fibrillation from the 12–Lead ECG by deep neural networks. J. Electrocardiol. 2023, 81, 193–200. [Google Scholar] [CrossRef] [PubMed]
  4. Rath, A.; Mishra, D.; Panda, G.; Satapathy, S.C. Heart disease detection using deep learning methods from imbalanced ECG samples. Biomed. Signal Process. Control 2021, 68, 102820. [Google Scholar]
  5. Jun, T.J.; Nguyen, H.M.; Kang, D.; Kim, D.; Kim, D.; Kim, Y.H. ECG arrhythmia classification using a 2-D convolutional neural network. arXiv 2018, arXiv:1804.06812. [Google Scholar]
  6. Ayano, Y.M.; Schwenker, F.; Dufera, B.D.; Debelee, T.G. Interpretable machine learning techniques in ECG–based heart disease classification: A systematic review. Diagnostics 2022, 13, 111. [Google Scholar] [CrossRef]
  7. Kusumoto, F. ECG Interpretation: From Pathophysiology to Clinical Application; Springer Nature: Berlin/Heidelberg, Germany, 2020. [Google Scholar]
  8. Mirahmadizadeh, A.; Farjam, M.; Sharafi, M.; Fatemian, H.; Kazemi, M.; Geraylow, K.R.; Dehghan, A.; Amiri, Z.; Afrashteh, S. The relationship between demographic features, anthropometric parameters, sleep duration, and physical activity with ECG parameters in Fasa Persian cohort study. BMC Cardiovasc. Disord. 2021, 21, 585. [Google Scholar]
  9. Terven, J.; Cordova-Esparza, D.M.; Ramirez-Pedraza, A.; Chavez-Urbiola, E.A.; Romero-Gonzalez, J.A. Loss functions and metrics in deep learning. arXiv 2024, arXiv:2307.02694. [Google Scholar]
  10. Khan, A.H.; Hussain, M.; Malik, M.K. Cardiac disorder classification by electrocardiogram sensing using deep neural network. Complexity 2021, 2021, 5512243. [Google Scholar]
  11. Morris, F.; Brady, W.J.; Camm, A.J. (Eds.) ABC of Clinical Electrocardiography; John Wiley & Sons: Hoboken, NJ, USA, 2009. [Google Scholar]
  12. Aziz, S.; Ahmed, S.; Alouini, M.S. ECG-based machine–learning algorithms for heartbeat classification. Sci. Rep. 2021, 11, 18738. [Google Scholar]
  13. Cook, D.A.; Oh, S.Y.; Pusic, M.V. Accuracy of physicians’ electrocardiogram interpretations: A systematic review and meta-analysis. JAMA Intern. Med. 2020, 180, 1461–1471. [Google Scholar]
  14. Sadad, T.; Safran, M.; Khan, I.; Alfarhood, S.; Khan, R.; Ashraf, I. Efficient classification of ECG images using a lightweight CNN with attention module and IoT. Sensors 2023, 23, 7697. [Google Scholar] [CrossRef]
  15. Martis, R.J.; Acharya, U.R.; Min, L.C. ECG beat classification using PCA, LDA, ICA and discrete wavelet transform. Biomed. Signal Process. Control 2013, 8, 437–448. [Google Scholar] [CrossRef]
  16. Faziludeen, S.; Sankaran, P. ECG beat classification using evidential K–nearest neighbours. Procedia Comput. Sci. 2016, 89, 499–505. [Google Scholar] [CrossRef]
  17. Chen, A.; Wang, F.; Liu, W.; Chang, S.; Wang, H.; He, J.; Huang, Q. Multi–information fusion neural networks for arrhythmia automatic detection. Comput. Methods Programs Biomed. 2020, 193, 105479. [Google Scholar] [CrossRef] [PubMed]
  18. Issa, M.F.; Yousry, A.; Tuboly, G.; Juhasz, Z.; AbuEl-Atta, A.H.; Selim, M.M. Heartbeat classification based on single lead–II ECG using deep learning. Heliyon. 2023, 9, e17974. [Google Scholar] [CrossRef]
  19. Zhou, Z.; Zhai, X.; Tin, C. Fully automatic electrocardiogram classification system based on generative adversarial network with auxiliary classifier. Expert Syst. Appl. 2021, 174, 114809. [Google Scholar] [CrossRef]
  20. Rexy, J.; Velmani, P.; Rajakumar, T. Heart beat classification in mit–bih arrhythmia ecg dataset using double layer BI–LSTM model. Int. J. Mech. Eng. Educ. 2021, 6, 337–344. [Google Scholar]
  21. Lan, T.; Hu, Q.; Liu, X.; He, K.; Yang, C. Arrhythmias classification using short-time Fourier transform and GAN based data augmentation. In Proceedings of the 2020 42nd Annual International Conference of the IEEE Engineering in Medicine & Biology Society (EMBC), Montreal, QC, Canada, 20–24 July 2020. [Google Scholar]
  22. Kuila, S.; Dhanda, N.; Joardar, S. ECG signal classification and arrhythmia detection using ELM-RNN. Multimed. Tools Appl. 2022, 81, 25233–25249. [Google Scholar] [CrossRef]
  23. Potes, C.; Parvaneh, S.; Rahman, A.; Conroy, B. Ensemble of feature-based and deep learning-based classifiers for detection of abnormal heart sounds. In Proceedings of the 2016 Computing in Cardiology Conference (CinC), Vancouver, BC, Canada, 11–14 September 2016. [Google Scholar]
  24. Wu, Y.; Yang, F.; Liu, Y.; Zha, X.; Yuan, S. A comparison of 1–D and 2–D deep convolutional neural networks in ECG classification. arXiv 2018, arXiv:1810.07088. [Google Scholar]
  25. Wang, H.; Shi, H.; Chen, X.; Zhao, L.; Huang, Y.; Liu, C. An improved convolutional neural network based approach for automated heartbeat classification. J. Med. Syst. 2020, 44, 35. [Google Scholar] [CrossRef]
  26. Degirmenci, M.; Ozdemir, M.A.; Izci, E.; Akan, A. Arrhythmic heartbeat classification using 2d convolutional neural networks. Irbm. 2022, 43, 422–433. [Google Scholar] [CrossRef]
  27. Avanzato, R.; Beritelli, F. Automatic ECG diagnosis using convolutional neural network. Electronics 2020, 9, 951. [Google Scholar] [CrossRef]
  28. Yoon, T.; Kang, D. Bimodal CNN for cardiovascular disease classification by co–training ECG grayscale images and scalograms. Sci. Rep. 2023, 13, 2937. [Google Scholar]
  29. Wang, Q.; Ma, Y.; Zhao, K.; Tian, Y. A comprehensive survey of loss functions in machine learning. Ann. Data Sci. 2020, 9, 187–212. [Google Scholar] [CrossRef]
  30. Moody, G.B.; Mark, R.G. The impact of the MIT–BIH arrhythmia database. IEEE Eng. Med. Biol. Mag. 2001, 20, 45–50. [Google Scholar]
  31. Goldberger, A.L.; Amaral, L.A.; Glass, L.; Hausdorff, J.M.; Ivanov, P.C.; Mark, R.G.; Mietus, J.E.; Moody, G.B.; Peng, C.K.; Stanley, H.E. PhysioBank, PhysioToolkit, and PhysioNet: Components of a new research resource for complex physiologic signals. Circulation 2000, 101, e215–e220. [Google Scholar] [PubMed]
  32. Naz, M.; Shah, J.H.; Khan, M.A.; Sharif, M.; Raza, M.; Damaševičius, R. From ECG signals to images: A transformation based approach for deep learning. PeerJ Comput. Sci. 2021, 7, e386. [Google Scholar]
  33. MIT Lab for Computational Physiology. wfdb “4.1.2” Documentation. 2018. Available online: https://wfdb.readthedocs.io/en/latest/ (accessed on 5 September 2024).
  34. Gu, J.; Wang, Z.; Kuen, J.; Ma, L.; Shahroudy, A.; Shuai, B.; Liu, T.; Wang, X.; Wang, G.; Cai, J.; et al. Recent advances in convolutional neural networks. Pattern Recognit. 2018, 77, 354–377. [Google Scholar] [CrossRef]
  35. Yamashita, R.; Nishio, M.; Do, R.K.G.; Togashi, K. Convolutional neural networks: An overview and application in radiology. Insights Imaging 2018, 9, 611–629. [Google Scholar]
  36. Lin, T.-Y.; Goyal, P.; Girshick, R.; He, K.; Dollár, P. Focal loss for dense object detection. IEEE Trans. Pattern Anal. Mach. Intell. 2017, 42, 2980–2988. [Google Scholar]
  37. Yeung, M.; Sala, E.; Schönlieb, C.B.; Rundo, L. Unified Focal loss: Generalising Dice and cross entropy–based losses to handle class imbalanced medical image segmentation. Comput. Med. Imaging Graph. 2022, 95, 102026. [Google Scholar] [CrossRef]
  38. Friedl, H.; Stampfer, E. Cross–validation. Encycl. Environmetrics 2002, 1, 452–460. [Google Scholar]
  39. Arlot, S.; Celisse, A. A survey of cross–validation procedures for model selection. Stat. Surv. 2010, 4, 40–79. [Google Scholar]
  40. Hossin, M.; Sulaiman, M.N. A review on evaluation metrics for data classification evaluations. Int. J. Data Min. Knowl. Manag. Process. 2015, 5, 1. [Google Scholar]
  41. Jha, C.K.; Kolekar, M.H. Cardiac arrhythmia classification using tunable Q–wavelet transform based features and support vector machine classifier. Biomed. Signal Process. Control 2020, 59, 101875. [Google Scholar] [CrossRef]
  42. Zheng, Z.; Chen, Z.; Hu, F.; Zhu, J.; Tang, Q.; Liang, Y. An automatic diagnosis of arrhythmias using a combination of CNN and LSTM technology. Electronics 2020, 9, 121. [Google Scholar] [CrossRef]
  43. Yildirim, Ö. A novel wavelet sequence based on deep bidirectional LSTM network model for ECG signal classification. Comput. Biol. Med. 2018, 96, 189–202. [Google Scholar]
  44. Huang, J.; Chen, B.; Yao, B.; He, W. ECG arrhythmia classification using STFT–based spectrogram and convolutional neural network. IEEE Access 2019, 7, 92871–92880. [Google Scholar]
  45. Rashed-Al-Mahfuz, M.; Moni, M.A.; Lio’, P.; Islam, S.M.S.; Berkovsky, S.; Khushi, M.; Quinn, J.M. Deep convolutional neural networks based ECG beats classification to diagnose cardiovascular conditions. Biomed. Eng. Lett. 2021, 11, 147–162. [Google Scholar] [CrossRef]
  46. Qin, Q.; Li, J.; Zhang, L.; Yue, Y.; Liu, C. Combining low–dimensional wavelet features and support vector machine for arrhythmia beat classification. Sci. Rep. 2017, 7, 6067. [Google Scholar]
  47. Li, Y.; Qian, R.; Li, K. Inter–patient arrhythmia classification with improved deep residual convolutional neural network. Comput. Methods Programs Biomed. 2022, 214, 106582. [Google Scholar] [CrossRef]
  48. Wang, F.; Jiang, M.; Qian, C.; Yang, S.; Li, C.; Zhang, H.; Wang, X.; Tang, X. Residual attention network for image classification. In Proceedings of the 2017 IEEE Conference on Computer Vision and Pattern Recognition (CVPR), Honolulu, HI, USA, 21–26 July 2017. [Google Scholar]
  49. Selvaraju, R.R.; Cogswell, M.; Das, A.; Vedantam, R.; Parikh, D.; Batra, D. Grad-cam: Visual explanations from deep networks via gradient-based localization. In Proceedings of the 2017 IEEE International Conference on Computer Vision (ICCV), Venice, Italy, 22–29 October 2017. [Google Scholar]
Figure 1. ECG data and the involved components.
Technologies 13 00128 g001
Figure 2. Examples of ECG abnormalities: (a) shape abnormalities, (b) R–R interval abnormalities, and (c) a combination of shape and R–R interval abnormalities.
Technologies 13 00128 g002
Figure 3. Overview of the study methodology.
Technologies 13 00128 g003
Figure 4. ECG image creation.
Technologies 13 00128 g004
Figure 5. Architecture of the proposed CNN model.
Technologies 13 00128 g005
Figure 6. False classification images: (a) strong-noise ECG image and (b) strong-trend ECG image.
Technologies 13 00128 g006
Table 1. Name, abbreviation, and record number of each class in the dataset.
Class (Abbreviation)RecordTotal
Normal beat (NOR)101, 106, 108, 112, 113, 115, 119, 121, 122, 203, 205, 219, 230, 23414
Premature ventricular contraction (PVC)105, 116, 200, 201, 202, 208, 210, 213, 215, 221, 228, 23312
Paced beat (PAB)107, 2172
Right bundle branch block (RBBB)118, 212, 2313
Left bundle branch block (LBBB)109, 111, 207, 2144
Atrial premature contraction (APC)209, 220, 222, 223, 2325
Ventricular flutter wave (VFW)2071
Ventricular escape beat (VEB)2071
Table 2. Number of ECG images in each class.
Class (Abbreviation)Total
Normal beat (NOR)14,706
Premature ventricular contraction (PVC)2178
Paced beat (PAB)1810
Right bundle branch block (RBBB)2623
Left bundle branch block (LBBB)4037
Atrial premature contraction (APC)1071
Ventricular flutter wave (VFW)236
Ventricular escape beat (VEB)53
Table 3. Structure of the proposed CNN model.
Layer *Input SizeNumber of KernelsKernel SizeStrideBatch NormalizationPaddingActivation Function
Conv 164 × 64 × 13231TrueTrueReLU
Conv 264 × 64 × 323231TrueTrueReLU
Pool 164 × 64 × 3222True
Conv 332 × 32 × 326431TrueTrueReLU
Conv 432 × 32 × 646431TrueTrueReLU
Pool 232 × 32 × 6422True
Conv 516 × 16 × 646431TrueTrueReLU
Conv 616 × 16 × 646431TrueTrueReLU
Pool 316 × 16 × 6422True
Conv 78 × 8 × 6412831TrueTrueReLU
Conv 88 × 8 × 12812831TrueTrueReLU
Pool 48 × 8 × 12822True
Flatten4 × 4 × 128
FC 12048TrueReLU
FC 22048TrueReLU
FC 3512Softmax
* Conv, Pool, and FC represent convolutional layer, pooling layer, and fully connected layer, respectively.
Table 4. Classification performance of the CNN-CCE and CNN-FL models for setting 1.
ModelIndex
Acc (%)Spe (%)Sen (%)F1 (%)
CNN-CCE99.0499.5398.4497.37
CNN-FL99.1699.6298.6096.97
Table 5. Confusion matrix of the CNN-CCE model for setting 1.
PredictedActualAcc (%)
NOR PVC PAB RBBB LBBB APC VFW VEB
NOR14,6281411530171099.53
PVC3721081111164096.78
PAB3118030300099.61
RBBB9212603251099.23
LBBB20610400613099.23
APC26222310351096.63
VFW1211011220093.22
VEB51001004686.79
Table 6. Confusion matrix of the CNN-FL model for setting 1.
PredictedActualAcc (%)
NOR PVC PAB RBBB LBBB APC VFW VEB
NOR14,641110514193399.62
PVC24212932695097.75
PAB2318030200099.61
RBBB7002616000099.73
LBBB291100399231198.88
APC29211010371096.82
VFW1130014215291.10
VEB22000014890.56
Table 7. Classification performance of the CNN-CCE and CNN-FL models for setting 2.
ModelIndex
Acc (%) Spe (%) Sen (%) F1 (%)
CNN-CCE81.7985.2377.4873.88
CNN-FL83.9882.4085.9779.21
Table 8. Confusion matrix of the CNN-CCE model for setting 2.
PredictedActualAcc (%)
NOR PVC PAB RBBB LBBB APC
NOR12,5266001456195540985.23
PVC96203451281493.38
PAB19916680112292.15
RBBB904425220396.14
LBBB630469131223924459.25
APC109254459645042.73
Table 9. Confusion matrix of the CNN-FL model for setting 2.
PredictedActualAcc (%)
NOR PVC PAB RBBB LBBB APC
NOR12,11059431379129628682.40
PVC77204822321794.03
PAB1623175919297.18
RBBB96321247612694.39
LBBB6095862333291282.46
APC99340470244842.54
Table 10. Performance comparison with existing methods for setting 1.
AuthorYearMethodNumber of ClassesPerformance (%)
Yildirim et al. [43]2018Bi-LSTM5Acc = 99.39
Jun et al. [5]2018CNN8Acc = 99.05 Spe = 99.57 Sen = 97.85
Huang et al. [44]2019CNN5Acc = 99.39
Jha et al. [41]2020SVM8Acc = 99.27 Spe = 99.58 Sen = 96.22
Zheng et al. [42]2020CNN + LSTM8Acc = 99.01 Spe = 99.57 Sen = 97.67
RA-Mahfuz et al. [45]2021CNN5Acc = 99.70 Spe = 99.98 Sen = 99.90
Degirmenci et al. [26]2022CNN5Acc = 99.70 Spe = 99.22 Sen = 99.70
This study2025CNN8Acc = 99.16 Spe = 99.62 Sen = 98.60
Table 11. Accuracy comparison of each class for setting 1.
AuthorYearMethodPVCPABRBBBLBBBAPCVFWVEB
Yildirim et al. [43]2018Bi-LSTM98.0399.6510098.93---
Jun et al. [5]2018CNN97.4399.4798.6298.5491.7990.2593.40
Huang et al. [44]2019CNN98.6998.8898.3299.07---
Jha et al. [41]2020SVM91.9799.1099.7393.8296.42--
Zheng et al. [42]2020CNN + LSTM99.5799.8597.9399.1982.5195.4590.52
RA-Mahfuz et al. [45]2021CNN99.50100100100---
Degirmenci et al. [26]2022CNN98.7799.5799.4499.43---
This study2025CNN97.7599.6199.7398.8896.8291.1090.56
Table 12. Performance comparison with existing methods for setting 2.
AuthorYearMethodNumber of ClassesPerformance (%)
Qin et al. [46]2017SVM6Acc = 81.47 Spe = 88.88 Sen = 44.40
Li et al. [47]2022Deep residual CNN5Acc = 88.99 Spe = 94.75 Sen = 52.10
This study2025CNN6Acc = 83.98 Spe = 82.40 Sen = 85.97
Disclaimer/Publisher’s Note: The statements, opinions and data contained in all publications are solely those of the individual author(s) and contributor(s) and not of MDPI and/or the editor(s). MDPI and/or the editor(s) disclaim responsibility for any injury to people or property resulting from any ideas, methods, instructions or products referred to in the content.

