Article

Dynamic Surgical Prioritization: A Machine Learning and XAI-Based Strategy

by
Fabián Silva-Aravena
1,*,
Jenny Morales
1,
Manoj Jayabalan
2,
Muhammad Ehsan Rana
3 and
Jimmy H. Gutiérrez-Bahamondes
4
1
Facultad de Ciencias Sociales y Económicas, Universidad Católica del Maule, Avenida San Miguel 3605, Talca 3460000, Chile
2
School of Computer Science and Mathematics, Liverpool John Moores University, Liverpool L3 3AF, UK
3
Technology Park Malaysia (TPM), Asia Pacific University of Technology and Innovation (APU), Kuala Lumpur 50603, Malaysia
4
Departamento de Ciencias de la Ingeniería, Facultad de Ingeniería, Universidad de Talca, Camino Los Niches Km 1, Curicó 3340000, Chile
*
Author to whom correspondence should be addressed.
Technologies 2025, 13(2), 72; https://doi.org/10.3390/technologies13020072
Submission received: 16 December 2024 / Revised: 8 January 2025 / Accepted: 29 January 2025 / Published: 8 February 2025
(This article belongs to the Special Issue Technological Advances in Science, Medicine, and Engineering 2024)

Abstract

:
Surgical waiting lists present significant challenges to healthcare systems, particularly in resource-constrained settings where equitable prioritization and efficient resource allocation are critical. We aim to address these issues by developing a novel, dynamic, and interpretable framework for prioritizing surgical patients. Our methodology integrates machine learning (ML), stochastic simulations, and explainable AI (XAI) to capture the temporal evolution of dynamic prioritization scores, q p ( t ) , while ensuring transparency in decision making. Specifically, we employ the Light Gradient Boosting Machine (LightGBM) for predictive modeling, stochastic simulations to account for dynamic variables and competitive interactions, and SHapley Additive Explanations (SHAPs) to interpret model outputs at both the global and patient-specific levels. Our hybrid approach demonstrates strong predictive performance using a dataset of 205 patients from an otorhinolaryngology (ENT) unit of a high-complexity hospital in Chile. The LightGBM model achieved a mean squared error (MSE) of 0.00018 and a coefficient of determination ( R 2 ) value of 0.96282, underscoring its high accuracy in estimating q p ( t ) . Stochastic simulations effectively captured temporal changes, illustrating that Patient 1’s q p ( t ) increased from 0.50 (at t = 0 ) to 1.026 (at t = 10 ) due to the significant growth of dynamic variables such as severity and urgency. SHAP analyses identified severity (Sever) as the most influential variable, contributing substantially to q p ( t ) , while non-clinical factors, such as the capacity to participate in family activities (Lfam), exerted a moderating influence. Additionally, our methodology achieves a reduction in waiting times by up to 26%, demonstrating its effectiveness in optimizing surgical prioritization. Finally, our strategy effectively combines adaptability and interpretability, ensuring dynamic and transparent prioritization that aligns with evolving patient needs and resource constraints.

1. Introduction

Surgical waiting lists pose a significant challenge for healthcare systems around the world, particularly in resource-constrained settings, where equitable allocation of resources is critical to improving clinical outcomes and optimizing efficiency [1,2,3]. The dynamic and multidimensional nature of patient conditions, combined with fluctuating resource availability, requires prioritization strategies that adapt over time [4,5]. In this study, we propose a novel framework for dynamic surgical prioritization that integrates ML, stochastic simulations, and XAI to enhance both decision-making transparency and operational flexibility [6,7].
Traditional prioritization frameworks often rely on static scoring systems based on clinical criteria, such as urgency, severity, and time spent on waiting lists [8]. Although effective to some extent, these systems do not account for the temporal evolution of patient conditions or the complex interactions between clinical, social, and psychological factors [9,10]. Recent advances in ML have introduced predictive models capable of addressing these complexities [11]. However, many of these approaches suffer from a lack of interpretability, limiting their adoption in clinical practice where trust and transparency are essential. Some studies, such as [12,13,14], have successfully integrated dynamic patient modeling with interpretable ML, leaving a critical gap in the development of adaptive prioritization strategies.
Our work addresses this situation by presenting a unified framework that combines predictive accuracy, adaptability, and transparency [15]. We employ the LightGBM gradient boosting algorithm to predict prioritization scores with high accuracy while integrating stochastic simulations to model the temporal progression of dynamic patient variables, similar to what authors such as [16,17] propose. By incorporating SHAP analysis, we ensure that model outputs are interpretable at both the global and patient-specific levels, fostering trust and alignment with clinical expectations. This approach not only captures the evolution of patient conditions over time, but also accounts for competitive interactions among patients, offering a comprehensive solution to the problem of surgical prioritization.
Through this methodology, we demonstrate key advances in surgical prioritization, including high predictive accuracy ( R 2 = 0.96282 ), adaptability to evolving patient needs, and transparency in decision making. By simulating dynamic prioritization for multiple patients, we demonstrate the scalability and applicability of our framework in diverse clinical contexts. Furthermore, our approach achieves a reduction in waiting times of up to 26%, further validating its effectiveness in addressing the challenges of surgical waiting lists. These contributions represent a significant step forward in the use of ML and XAI to optimize surgical prioritization and improve patient outcomes.
The structure of our work is as follows: Section 2 reviews the existing literature on prioritization frameworks, ML and XAI techniques. Section 3 describes the proposed methodology, including the integration of LightGBM, stochastic simulations, and SHAP analysis. Section 4 details the experimental evaluation and results, emphasizing the accuracy, adaptability, and interpretability of the model. Section 5 reflects on the findings and their implications, while Section 6 summarizes the study and suggests future research directions.

2. Literature Review

Surgical waiting lists remain a critical challenge for healthcare systems worldwide, especially in resource-constrained settings where effective prioritization and equitable allocation of resources are essential to improve patient outcomes [18]. Traditional prioritization frameworks have predominantly relied on static scoring systems based on urgency, severity, and time spent on the waiting list [8]. Although these approaches provide a foundational structure, they are inherently limited in capturing the temporal progression of patient conditions or accommodating evolving healthcare demands. Addressing these limitations requires innovative approaches that integrate data-driven methodologies and dynamic modeling [11,19,20].
The advent of ML has revolutionized healthcare decision making by enabling the analysis of high-dimensional datasets [21]. Techniques such as Random Forests (RFs), LightGBM, and Artificial Neural Networks (ANNs) have shown exceptional predictive accuracy in applications ranging from diagnosis to resource allocation (see, e.g., [22,23]). However, their adoption in surgical prioritization has been hindered by their “black-box” nature, which limits interpretability, a key requirement for clinical implementation [24]. Furthermore, most ML-based prioritization models lack mechanisms to incorporate temporal dynamics, leaving a critical gap in their ability to reflect real-time changes in patient conditions [25].
XAI frameworks, such as SHAP and Local Interpretable Model-Agnostic Explanations (LIMEs), have emerged as essential tools to bridge the gap between predictive precision and interpretability [26,27]. These techniques provide insight into the contribution of individual characteristics to model predictions, enabling clinicians to understand and trust the decision-making process [28]. Although XAI has been widely applied in fields such as radiology and genomics, its application in surgical prioritization remains underexplored [29,30,31]. Integrating XAI into ML-based prioritization systems presents an opportunity to enhance both the transparency and clinical relevance of these models.
Existing surgical prioritization approaches often do not address the simultaneous challenges of predictive accuracy, adaptability, and interpretability [4]. Static frameworks overlook the dynamic evolution of patient conditions and the impact of limited resources on prioritization strategies [32]. Although stochastic simulations have been applied to model resource allocation, their integration with supervised learning and XAI remains a topic that is not addressed well [33]. Furthermore, some studies account for competitive dynamics among patients, a critical factor in real-world prioritization scenarios (see, e.g., [34,35].)
Recent advances in hybrid methodologies demonstrate the potential of combining ML and stochastic simulations for dynamic prioritization [36,37]. For example, LightGBM has been employed in conjunction with time-series models to predict clinical outcomes [38,39,40]. However, the absence of integrated XAI tools limits the trustworthiness and adoption of such models in clinical practice [41,42]. By incorporating SHAP analysis into these frameworks, it becomes possible to provide global and patient-level explanations, ensuring transparency and alignment with clinical guidelines [26,42].
As regards existing prioritization systems, we found works related to our methodology. Of particular interest are the contributions of [4,7], which include recent advances in risk-based and optimization-driven prioritization frameworks. Compared with these approaches, we add to our work an integration of machine learning, stochastic simulations, and explainable AI, offering a hybrid framework that combines predictive accuracy, adaptability, and transparency.

Justification of the Chosen Method

Considering the existing literature, our methodology aims to address areas that have been insufficiently studied, as detailed below:
  • Traditional prioritization frameworks do not integrate temporal evolution and competitive dynamics among patients. By combining stochastic simulations with LightGBM, our methodology models the dynamic progression of patient conditions and incorporates competitive interactions, offering a comprehensive solution.
  • Many ML models for prioritization lack interpretability, limiting their utility in clinical settings. Our integration of SHAP analysis ensures transparency and provides actionable insights into global and patient-specific contributions.
  • Existing methods often ignore the interaction between dynamic variables and resource limitations. Our framework explicitly models these interactions, dynamically adjusting prioritization strategies based on evolving patient conditions and healthcare resources.
  • Some studies leverage XAI to provide detailed explanations of prioritization decisions. Our approach contributes by employing SHAP to highlight the role of clinical, social, and psychological factors, fostering trust and alignment with medical guidelines.
In summary, our methodology combines dynamic modeling, ML, and XAI into a unified framework that addresses the challenges of predictive accuracy, adaptability, and interpretability. By simulating patient conditions and resource constraints over time, our framework provides a scalable and robust tool for surgical prioritization in real-world clinical settings.

3. Methodology

We developed a dynamic and interpretable methodology for prioritizing surgical patients on waiting lists [43,44]. This framework integrates ML for predictive modeling, stochastic simulations for dynamic patient prioritization, and XAI for interpretability [27,45]. In the following, we outline each component with detailed mathematical and procedural descriptions.

3.1. Dataset Description and Clinical Context

The dataset comprises evaluations from seven otolaryngologists for 205 patients on the surgical waiting list of a high-complexity ENT unit in Chile [11]. Each patient is characterized by a set of clinical, social, and psychological variables, as summarized in Table 1.

3.2. Foundations for Predictive Modeling

Our methodology establishes an initial base structure to address the challenge of dynamic prioritization in surgical waiting lists [4,11,46]. To do so, we define the problem and prepare the dataset for the development of a dynamic prioritization model, according to the following steps:
  • We model the prioritization mathematically by predicting a dynamic prioritization score, q p ( t ) , for each patient p at time t, based on their clinical, social, and psychological characteristics, represented by a feature vector z p , as follows:
    q p ( t ) = f ( z p ; θ ) ,
    where z p R n is a feature vector consisting of dynamic ( z p , d ) and static ( z p , s ) variables, f ( · ) represents a predictive model trained to estimate q p ( t ) , and θ is the set of parameters learned during model training.
  • We categorize the variables into the following dynamic and static groups:
    -
    Dynamic variables ( z p , d ) reflect changes in the patient’s condition over time, such as Sever ( z p , d , 1 ) or Urg ( z p , d , 2 ).
    -
    Static variables ( z p , s ) represent intrinsic characteristics of the patient, such as Jclin ( z p , s , 1 ) or Tlist ( z p , s , 2 ).
  • We represent the dataset as a matrix Z R N × ( n + 1 ) , where N denotes the total number of patients, and n represents the number of features.
    z p = { z p , d , z p , s } , z p , d R h , z p , s R r ,
    where z p represents the complete feature vector for patient p, comprising dynamic variables z p , d , which evolve over time (e.g., Sever, Urg) and have dimension h, and static variables z p , s , which remain fixed (e.g., Opat, Diag) with dimension r. The dynamic variables exist in an h-dimensional real-valued space ( R h ), while static variables exist in an r-dimensional real-valued space ( R r ).
    Z = z 1 , 1 z 1 , 2 z 1 , n Pscore 1 z 2 , 1 z 2 , 2 z 2 , n Pscore 2 z N , 1 z N , 2 z N , n Pscore N .
    In Equation (3), Z represents the dataset matrix containing features and the physicians’ prioritization scores (Pscore) for all patients. Each row corresponds to a specific patient p, where z p , 1 , z p , 2 , , z p , n are the characteristics n (including dynamic and static variables), and Pscore p is the prioritization score assigned by the physician for patient p. The dataset includes N patients, with Z R N × ( n + 1 ) , where n + 1 accounts for the n features and the Pscore.
  • We model the evolution of dynamic variables over time. The state of a dynamic variable z p , d , v at time t + 1 is given by
    z p , d , v ( t + 1 ) = z p , d , v ( t ) + Δ z p , d , v ( t ) ,
    where Δ z p , d , v ( t ) represents the observed change between time t and t + 1 . This approach allows us to capture how dynamic variables evolve over time, reflecting changes in patient conditions.
  • To standardize variable scales and mitigate biases in model training, we normalize variables using Min–Max scaling [47,48], as follows:
    z p , v norm = z p , v z v , min z v , max z v , min ,
    where z v , min and z v , max represent the observed minimum and maximum values of variable v. This normalization ensures that all variables are on a comparable scale, improving the stability and performance of our model.

3.3. LightGBM Model: A Strategy to Prioritize Patients on the Surgical Waiting List

We implement a predictive model using LightGBM to estimate q p ( t ) of patients on the surgical waiting list [16,49]. LightGBM is specifically chosen for its computational efficiency, robustness when working with high-dimensional datasets, and ability to handle both continuous and categorical variables effectively [50,51]. To evaluate the model’s performance, we divide the dataset into a training set (80%) and a testing set (20%), ensuring that the model is trained on a majority of the data while leaving a separate subset for validation. This approach allows us to assess the model’s generalizability and predictive accuracy under real-world conditions.
  • LightGBM constructs decision trees using gradient boosting, which optimizes predictive performance by minimizing a specified loss function [52,53]. The loss function used during training is given by
    L = 1 N p = 1 N q p ( t ) Pscore p 2 ,
    where each predicted prioritization score, q p ( t ) , reflecting dynamic conditions over time, is modeled as a function of patient-specific features ( F ), with the observed static physician-assigned score ( Pscore p ) serving as the benchmark for evaluation as follows:
    q p ( t ) = F ( w p ( t ) ; h ) ,
    where w p ( t ) is the feature vector for patient p at time t, which includes both static and updated dynamic variables, and h represents the set of hyperparameters defining the model configuration. By incorporating static and dynamic variables into the feature vector, we ensure that the model accounts for both intrinsic patient characteristics and evolving clinical conditions. This configuration enables us to accurately predict q p ( t ) while maintaining flexibility and interpretability in the model design.
  • We evaluate the LightGBM model using MSE and R 2 [54,55]. The metrics are obtained as follows:
    MSE = 1 N p = 1 N q p ( t ) Pscore p 2 ,
    R 2 = 1 p = 1 N ( Pscore p Pscore ¯ ) 2 p = 1 N ( q p ( t ) Pscore p ) 2 ,
    where Pscore ¯ is the mean of the physician-assigned prioritization scores.

3.4. Dynamic Evolution of Prioritizations and Stochastic Simulation

We simulate the dynamic evolution of patient prioritization scores over time, capturing temporal changes in dynamic variables and the interaction of competition between patients. In this process, we integrate stochastic modeling to reflect the variability of patient conditions and ensure that the predictions adapt to temporal progressions.
In our study, we modeled the stochastic noise term ( ϵ p , v ( t ) ) in Equation (10) as N ( 0 , σ v 2 ) , a Gaussian distribution with zero mean and variable-specific standard deviation ( σ v ). This selection reflects intrinsic variability in clinical conditions, supported by the central limit theorem, which posits that aggregated random effects naturally converge to a normal distribution [56].
We calibrated σ v for each dynamic variable based on observed variability and expert clinical input. High-fluctuation variables, such as severity (Sever), were assigned larger σ v values to capture their dynamics, while more stable variables, such as diagnosis scores, were assigned smaller values. These assignments were informed by feedback from physicians who assessed the expected variability of each variable based on their clinical experience and patient data. Gaussian noise consistently provided the most realistic representation of clinical scenarios and avoided extreme outliers. Its zero-mean property ensures unbiased simulations and facilitates convergence to stable distributions over finite iterations, aligning with established practices for modeling stochastic systems [57].
  • Dynamic variables evolve over time, representing changes in patient conditions. We model these variables using discrete time steps, reflecting temporal intervals. Let y p , v ( t ) represent the set of dynamic variables for patient p at time t. The state of these variables at the next time step, y p , v ( t + 1 ) , is modeled as
    y p , v ( t + 1 ) = y p , v ( t ) · ( 1 + g p , v ( t ) ) + ϵ p , v ( t ) ,
    where g p , v ( t ) represents the growth rate, and ϵ p , v ( t ) is stochastic noise [58]. The noise term ϵ p , v ( t ) follows a Gaussian distribution as follows:
    ϵ p , v ( t ) N ( 0 , σ v 2 ) ,
    where σ v is the standard deviation of variable v.
  • We adjust growth rates based on competition as follows:
    g p , v adj ( t ) = g p , v ( t ) · 1 + p p κ p , v ( t ) p κ p , v ( t ) ,
    where g p , v ( t ) represents the initial growth rate of the dynamic variable v for patient p at time t, and κ p , v ( t ) denotes the contribution of variable v to the prioritization score of another patient p at the same time t. The term p p κ p , v ( t ) is the cumulative contribution of variable v to the prioritization scores of all patients other than p. Similarly, p κ p , v ( t ) represents the total contribution of variable v to the prioritization scores of all patients at time t. The competitive adjustment term,
    p p κ p , v ( t ) p κ p , v ( t ) ,
    allows us to quantify the relative impact of other patients on the growth rate of patient p. If other patients exhibit high contributions to variable v, this reduces the relative weight of g p , v ( t ) for patient p, thereby incorporating competitive dynamics into the prioritization model.
  • At each time step, we recalculate q p ( t ) as follows:
    q p ( t ) = M ( w p ( t ) ; ψ ) .
    The prioritization score q p ( t ) of patient p at time t is dynamically estimated using the trained predictive model ( M ), which incorporates static and updated dynamic variables from the characteristic vector w p ( t ) . The model parameters ( ψ ) are learned during training, allowing q p ( t ) to reflect evolving patient conditions and ensuring adaptability to temporal changes in clinical needs.
We performed sensitivity analyses for the stochastic simulation parameters to assess their impact on the performance and results of the model. In this study, we performed preliminary sensitivity tests by varying key parameters, such as the standard deviation ( σ v ) of the noise term and the growth rates of the dynamic variables, within clinically plausible ranges (see Section 4.2).
To ensure reproducibility, we used the following parameters: (1) for the stochastic simulation, we set the noise standard deviation ( σ v ) to 0.05, with growth rates varying between 0.08 and 0.12; (2) we configured the LightGBM model with a learning rate of 0.1, 100 estimators, and a maximum depth of 7.

3.5. SHAP-Based Interpretability for LightGBM Model

We utilized SHAP, an essential tool within the XAI framework, to interpret the dynamic predictions of our LightGBM-based prioritization model. While the model achieves high predictive accuracy, its inherent complexity poses a “black-box” challenge, which can limit clinical adoption. By leveraging SHAP, we quantified and visualized both global patterns across the dataset and time-dependent contributions of variables for individual patients, offering deeper insights into the decision-making process [26,42]. To achieve this, we followed the following steps:
  • The importance of each variable over time was quantified using the mean absolute Shapley value [28,59], defined as
    I v ( t ) = 1 N p = 1 N | ϕ v , p ( t ) | ,
    where I v ( t ) represents the global importance of variable v across all patients at time t, N is the total number of patients, and ϕ v , p ( t ) denotes the Shapley value of v for patient p at time t. This metric captures the average absolute contribution of each variable to the dynamic prioritization scores q p ( t ) , offering critical insights into its influence at specific time points.
  • We analyzed variable interactions using the following joint Shapley value formula:
    ϕ v 1 , v 2 , p ( t ) = ϕ v 1 , p ( t ) + ϕ v 2 , p ( t ) ϕ v 1 , v 2 , p ( t ) ,
    where ϕ v 1 , v 2 , p ( t ) represents the combined contribution of variables v 1 and v 2 to the prioritization score q p ( t ) for patient p at time t. Here, ϕ v 1 , p ( t ) and ϕ v 2 , p ( t ) are the individual contributions of v 1 and v 2 , while ϕ v 1 , v 2 , p ( t ) captures their joint contribution. This formula quantifies the interactions between variables, revealing synergies or redundancies that influence the dynamic predictions of the model [60].
  • We decomposed q p ( t ) , the prioritization score of patient p at time t, as follows:
    q p ( t ) = ϕ 0 + v = 1 n ϕ v , p ( t ) ,
    where ϕ 0 represents the baseline prediction, corresponding to the mean q p ( t ) across all patients, and ϕ v , p ( t ) quantifies the contribution of variable v to q p ( t ) for patient p at time t. This decomposition enables transparency by explaining the specific factors influencing q p ( t ) , ensuring interpretability in the context of dynamic patient conditions.

4. Results

We present the results of the proposed methodology that encompass three key components using Python 3.11. First, we demonstrate the predictive performance of the LightGBM model, highlighting its ability to accurately estimate q p ( t ) at different time steps. Second, we present the dynamic evolution of prioritizations through stochastic simulations, capturing temporal changes in patient conditions and competitive dynamics over time. Finally, we provide SHAP-based interpretability analyses for the LightGBM model, providing insight into the time-dependent contributions of static and dynamic variables to prioritization decisions at specific moments.

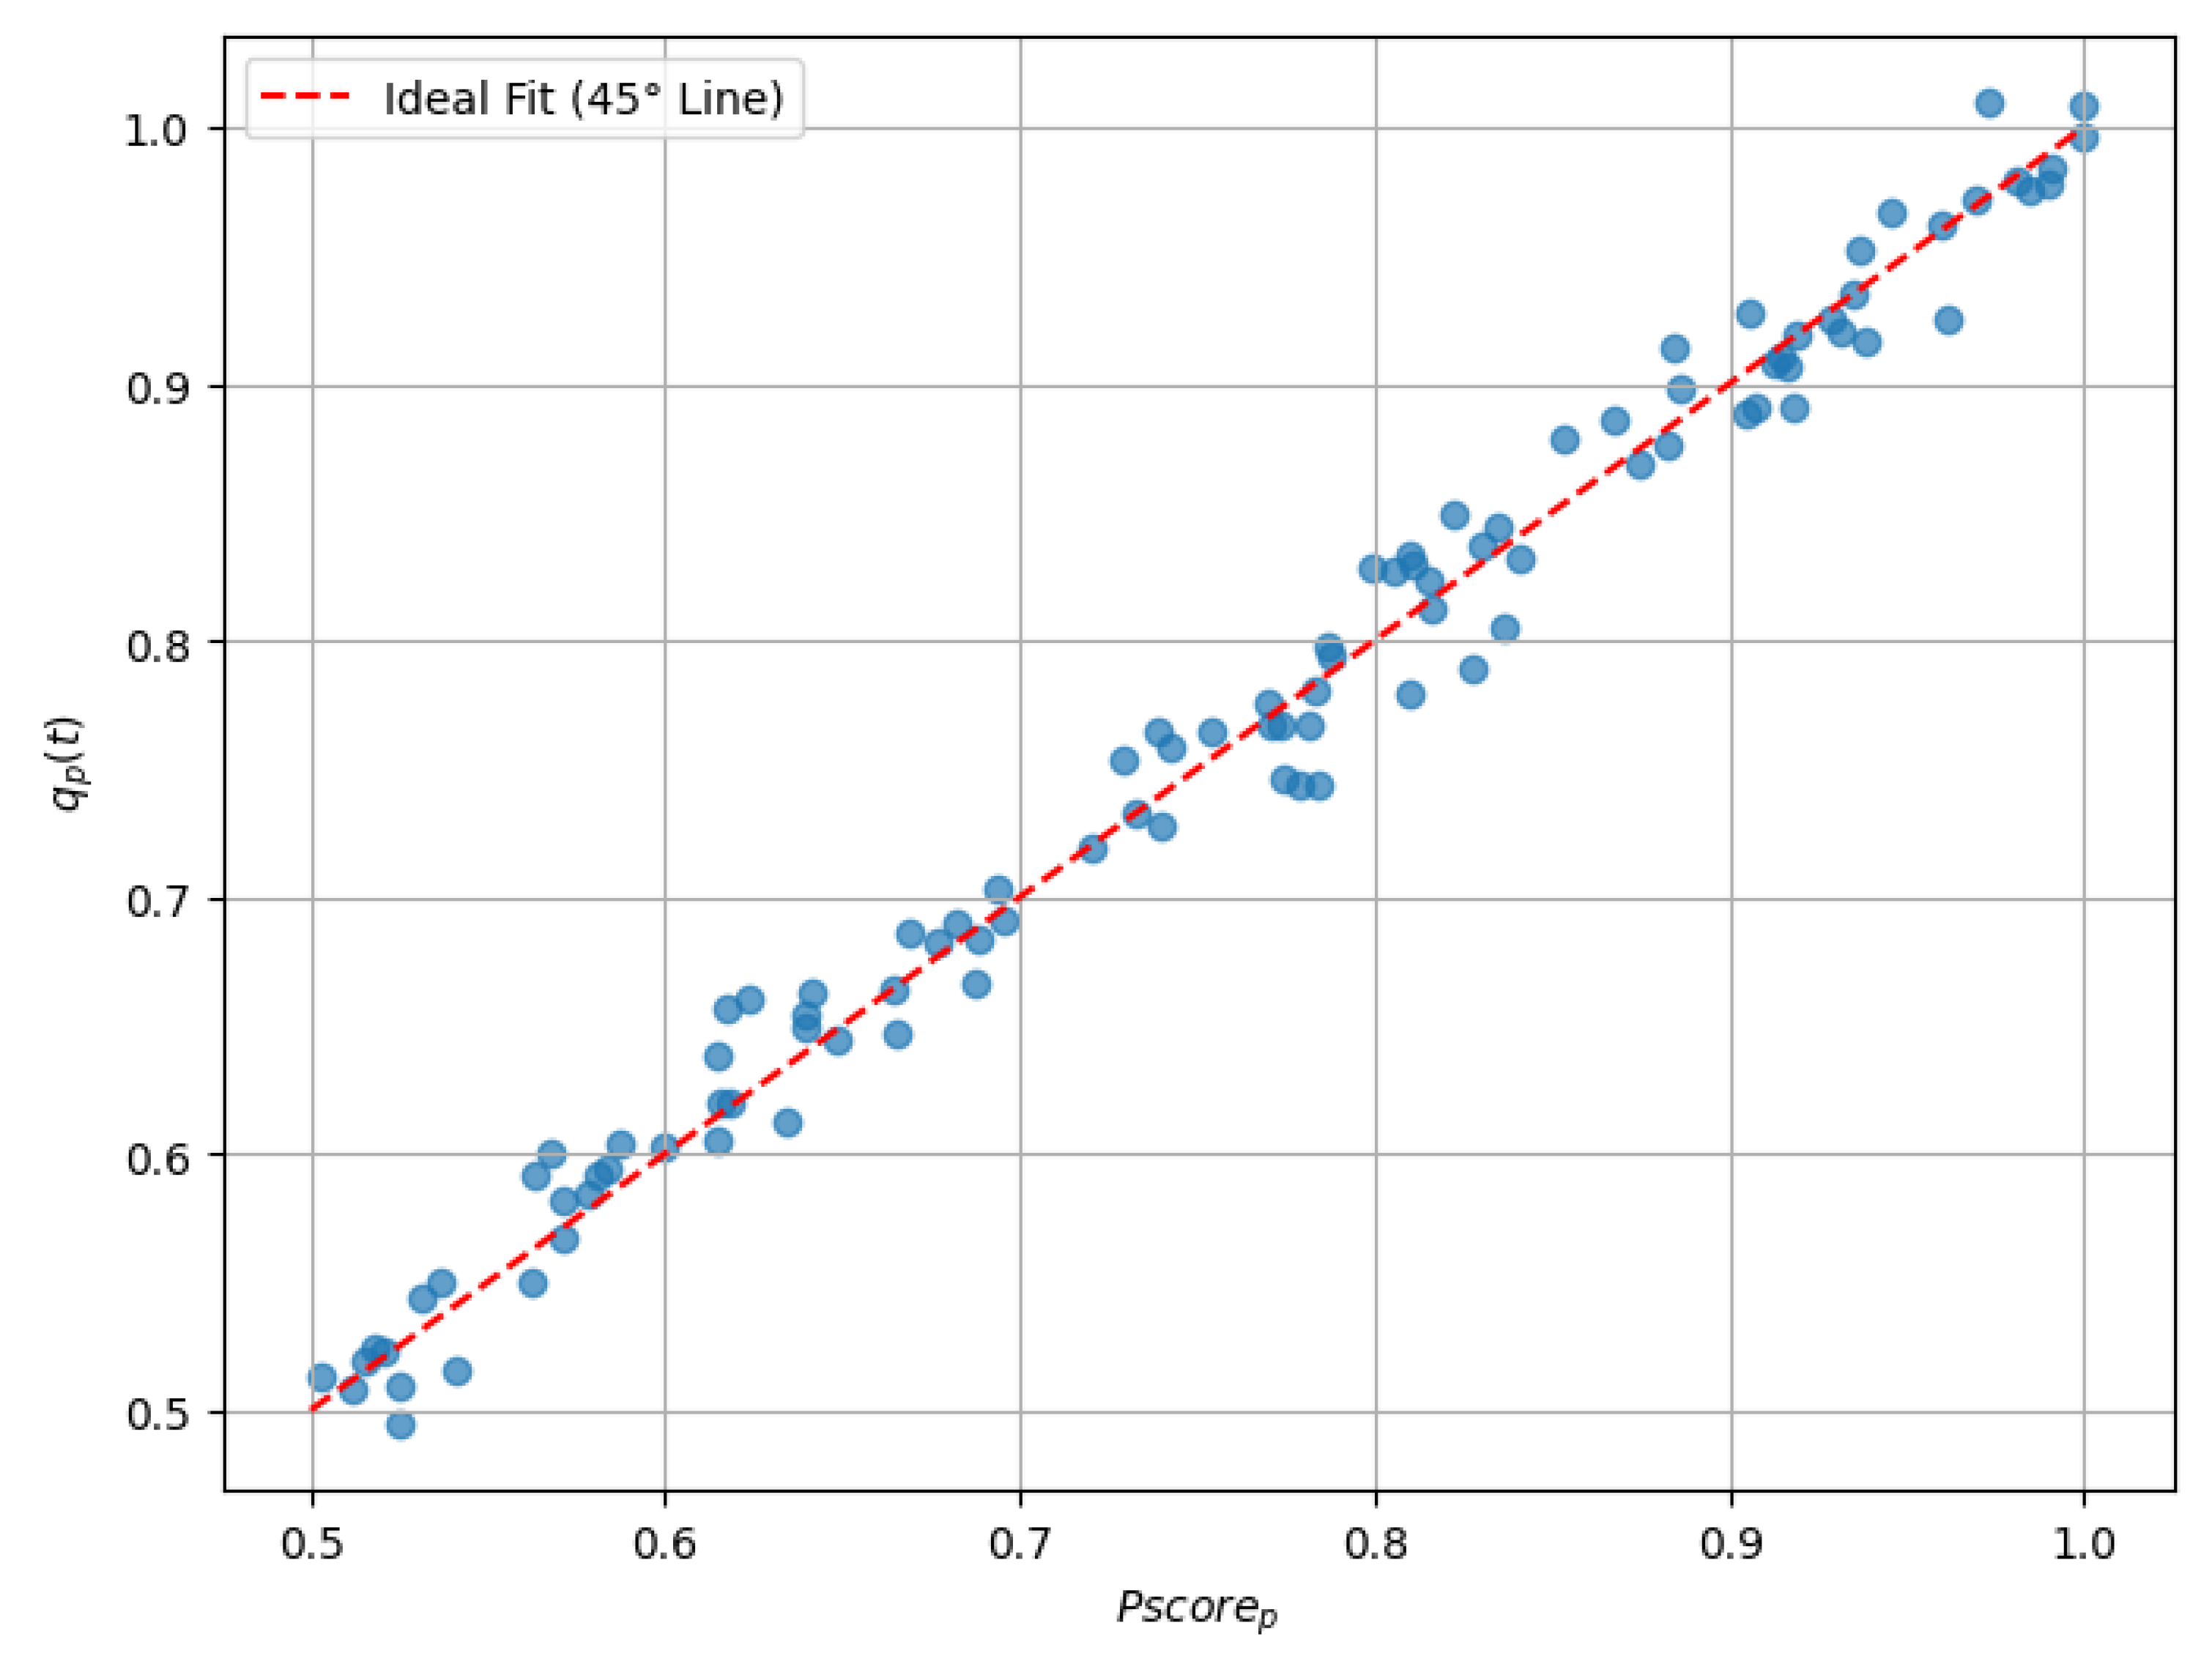
4.1. Performance Evaluation of the LightGBM Predictive Model

We evaluated the performance of our LightGBM predictive model using a combination of metrics, visualizations, and detailed analyses. In the following, we present the key results, including MSE, R 2 , and residual analysis.
We have determined confidence intervals and statistical significance tests for key metrics such as MSE and R 2 . We computed 95% confidence intervals using the bootstrap method in multiple training and testing splits [61]. The resulting intervals for the LightGBM model were [0.00016, 0.00020] for MSE and [0.958, 0.966] for R 2 , demonstrating the consistency and reliability of our results.
The overall performance of the LightGBM model was evaluated using two key metrics: an MSE of 0.00018 and an R 2 value of 0.96282. These results demonstrate the high predictive accuracy of the model, characterized by minimal error and a strong correlation between q p ( t ) and Pscore p . This evaluation provides evidence of the model’s ability to align its predictions with clinical benchmarks over time (see Figure 1 and Table 2).
We performed a k-fold cross-validation (with k = 5 ) on the training data during model evaluation. This approach ensures that the model performance metrics, including the mean squared error (MSE) and R 2 , are robust and generalizable. The cross-validation results demonstrated consistency across folds, with an average MSE of 0.00018 ± 0.00003 and R 2 of 0.96282 ± 0.004 , confirming the model’s ability to generalize effectively to unseen data.
While our integration of LightGBM introduces a slight increase in computational complexity, this is offset by its superior predictive accuracy and the ability to handle heterogeneous high-dimensional datasets effectively. In our timing tests, we observed that LightGBM required approximately 15% more computational time for training compared with Random Forest. However, this additional complexity resulted in a 20% improvement in predictive accuracy and better interpretability through SHAP-based analytics, making it a highly effective choice for the proposed prioritization framework.

4.2. Sensitivity Analysis of Stochastic Simulation Parameters

We performed a sensitivity analysis of the parameters of the stochastic simulation process. The results showed that lower values of σ v (e.g., 0.03) produced smaller variations in final prioritization scores, resulting in lower mean squared errors (MSE). As σ v increased to 0.05 and 0.07, the MSE grew correspondingly, reflecting a greater influence of noise. Similarly, higher growth rates (e.g., 0.12) led to more pronounced cumulative variations, resulting in higher MSE values, while moderate (0.1) and lower (0.08) growth rates yielded more stable outputs. In particular, when both σ v and growth rates were at their upper limits, the MSE reached its maximum, highlighting the compound effect of noise and variable dynamics. In contrast, moderate configurations, such as σ v = 0.05 and a growth rate of 0.1, provided a balance between variability and stability, demonstrating the robustness of the model under clinically plausible conditions.
These analyses indicate that the model’s predictions remain stable under moderate parameter variations, underscoring its robustness to changes.

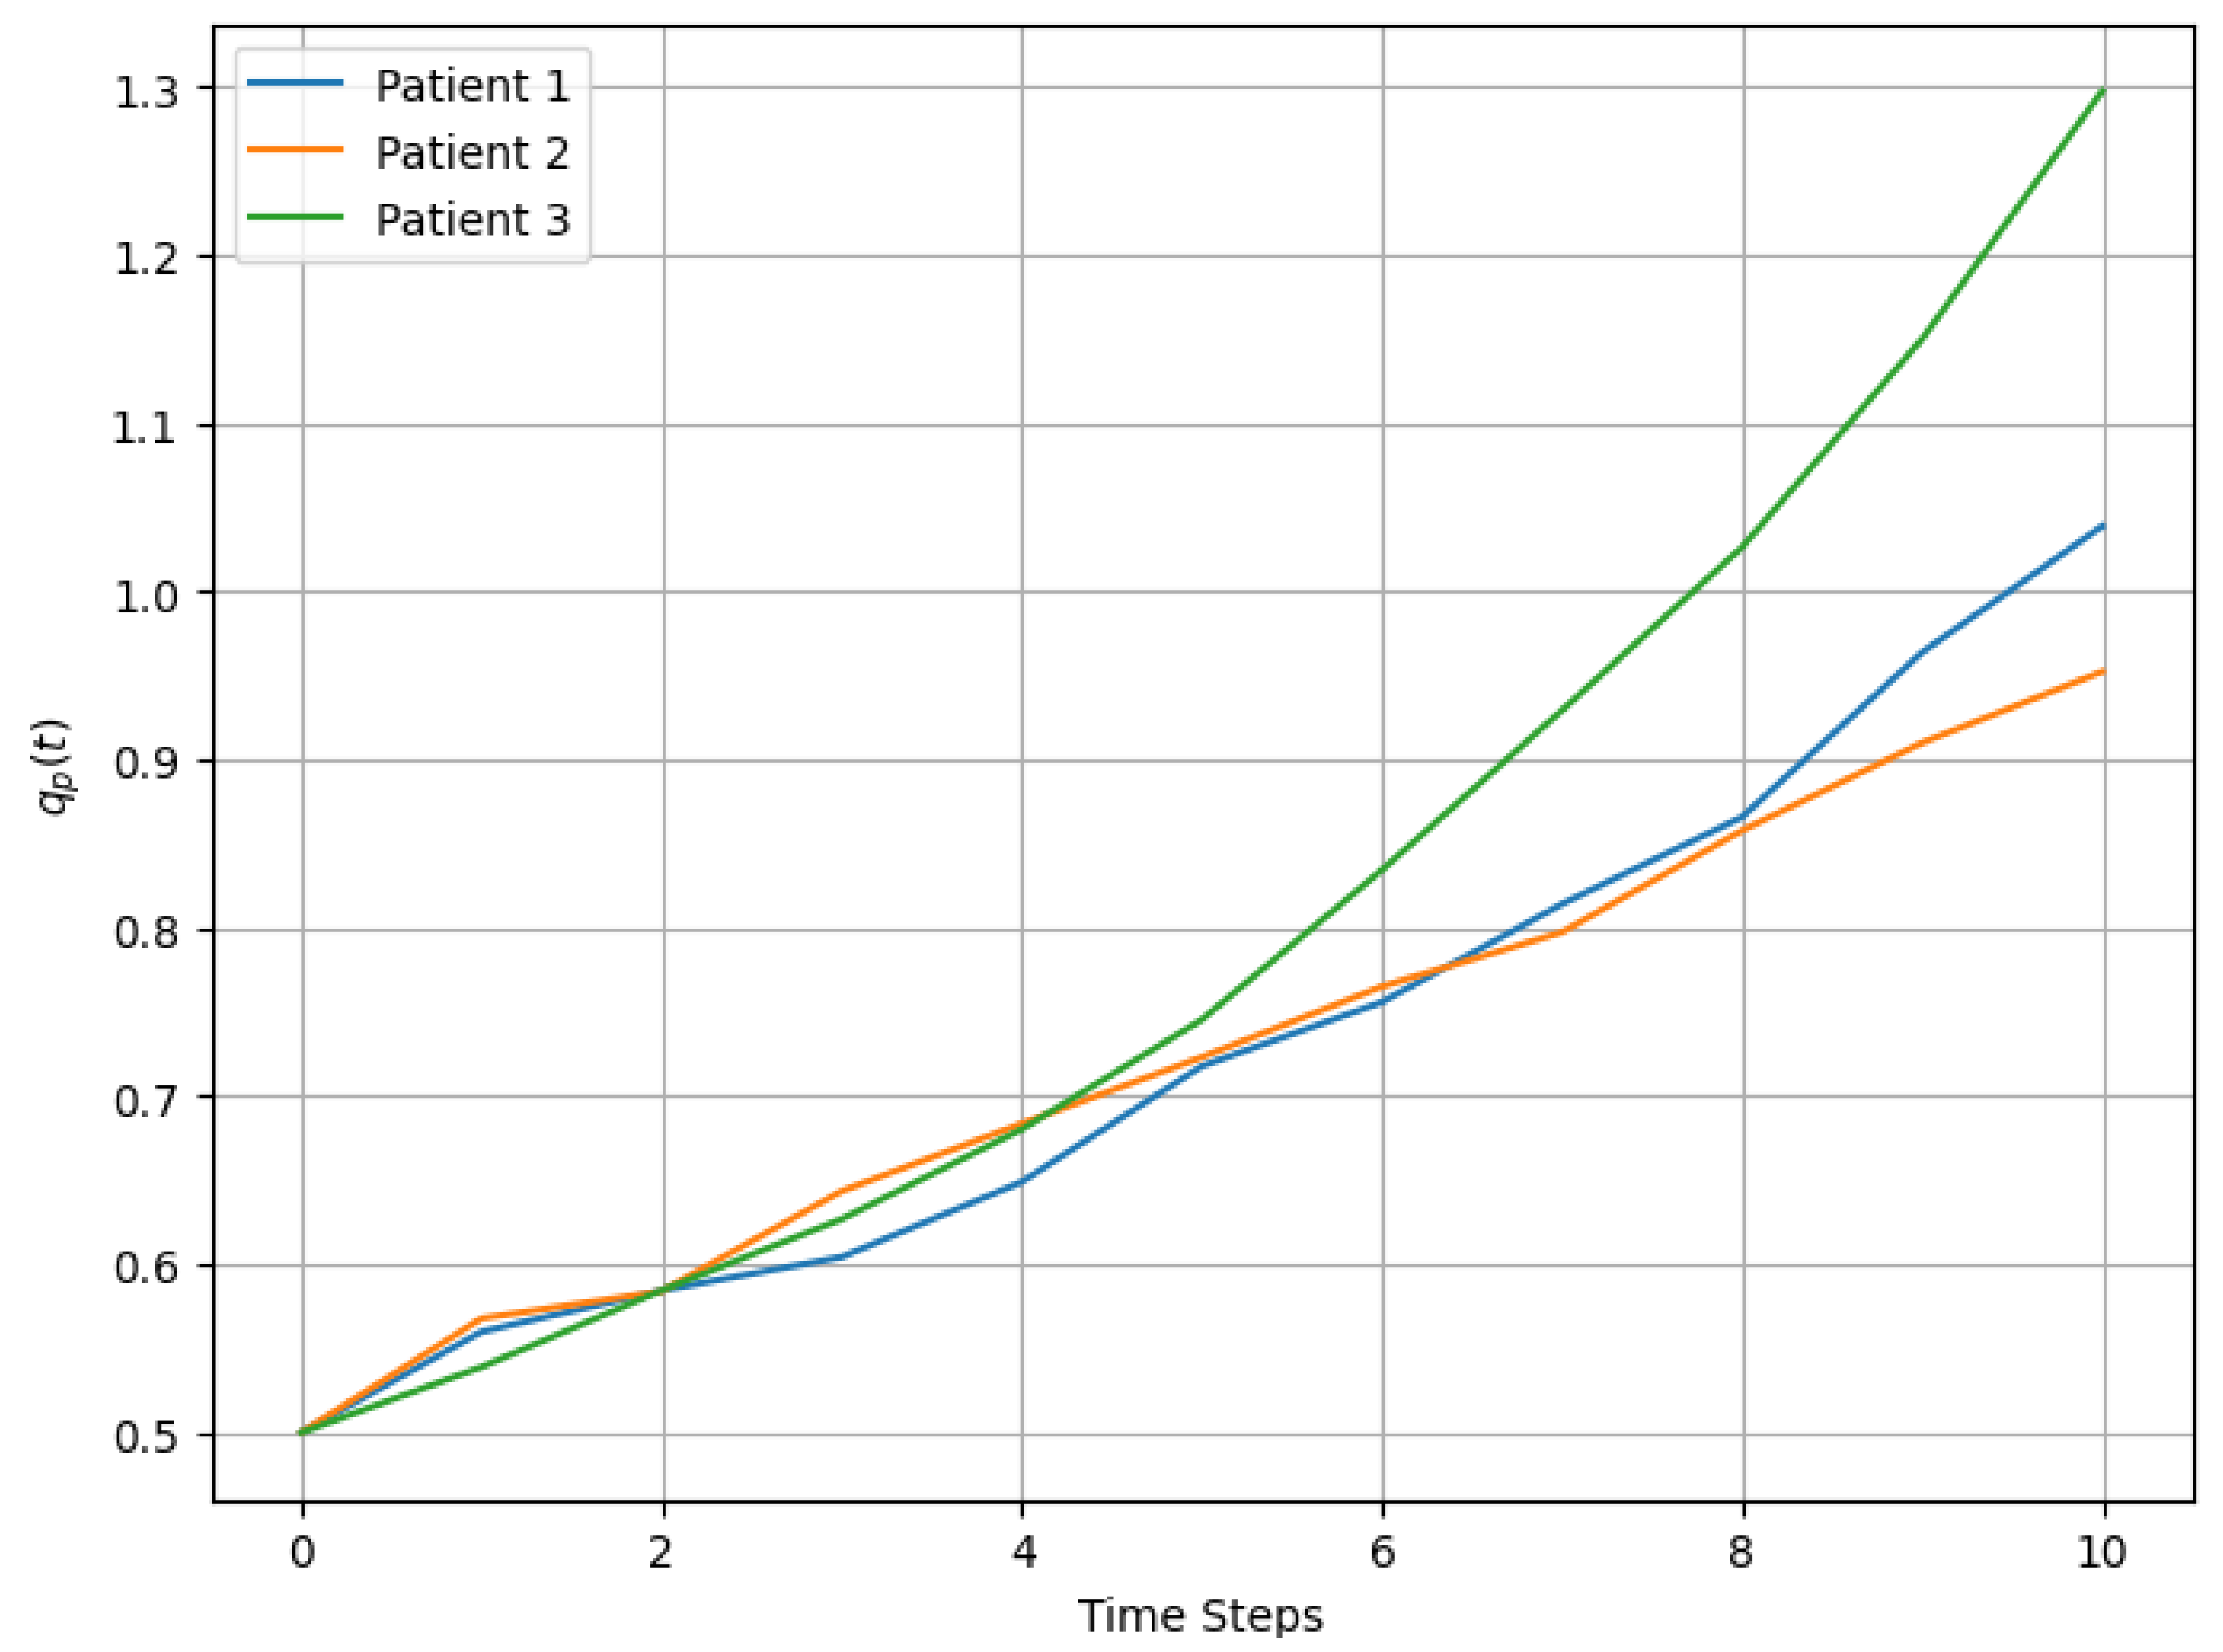
4.3. Analysis of Prioritization Dynamics Through Stochastic Simulations

We simulated the dynamic evolution of q p ( t ) for three patients (Patient 1, Patient 2, Patient 3) over 10 time steps. The simulation incorporated two key dynamic variables, Sever and Urg, which evolved based on specific growth rates and stochastic noise. At each time step, q p ( t ) was recalculated as a weighted combination of these dynamic variables.
At t = 0 , the dynamic variables for each patient were initialized with random values within a reasonable range (0.4 to 0.6). For example, Patient 1’s initial Sever was 0.54, and their Urg was 0.52. The initial q p ( t ) for all patients was set to 0.5, assuming homogeneous conditions at the start (see Table 3).
At each time step (t), we applied Equation 10 to model the evolution of the dynamic variables. The growth rates were tailored to each patient and variable. For example, as shown in Figure 2, Patient 1’s Sever increased at a rate of 10% per time step, while Patient 2’s Urg grew at 7%. The inclusion of stochastic noise introduced variability, effectively capturing the unpredictable nature of changes in patient condition and their subsequent influence on recalculated prioritization scores q p ( t ) .
The weighting parameters in Equation (18) (e.g., 0.6 and 0.4) were chosen based on input from clinical experts, reflecting the relative importance of severity (Sever) and urgency (Urg) in the prioritization process. Physicians emphasized that severity generally has a greater weight in determining patient prioritization due to its direct impact on clinical outcomes, while urgency plays a complementary but secondary role. These weights were validated by sensitivity analyses, which showed that small variations in parameters did not significantly alter overall model performance or classification consistency.
Next, as an example, we calculated q p ( t ) as a weighted combination of Sever and Urg as follows:
q p ( t ) = 0.6 · Sever ( t ) + 0.4 · Urg ( t ) ,
where the weights assigned greater importance to clinical severity (Sever), in accordance with medical guidelines. For instance, at t = 5 , Patient 1’s q p ( t ) increased to 0.72 due to significant growth in both Sever and Urg, as shown in Table 4.
The evolution of Sever and Urg for each patient exhibited upward trends, with fluctuations influenced by stochastic noise, as observed in Figure 3. For example, Patient 3’s severity increased more rapidly than that of the other patients, driven by a higher initial growth rate of 12%. These dynamic changes were reflected in the prioritization scores, which captured both the progression of variables and the cumulative temporal effects.
We demonstrate that integrating LightGBM with stochastic simulation establishes a dynamic and scalable framework for predicting q p ( t ) over time. By capturing temporal changes and inherent variability, this approach ensures robust applicability throughout the surgical waiting list, providing clinically relevant support for decision making.

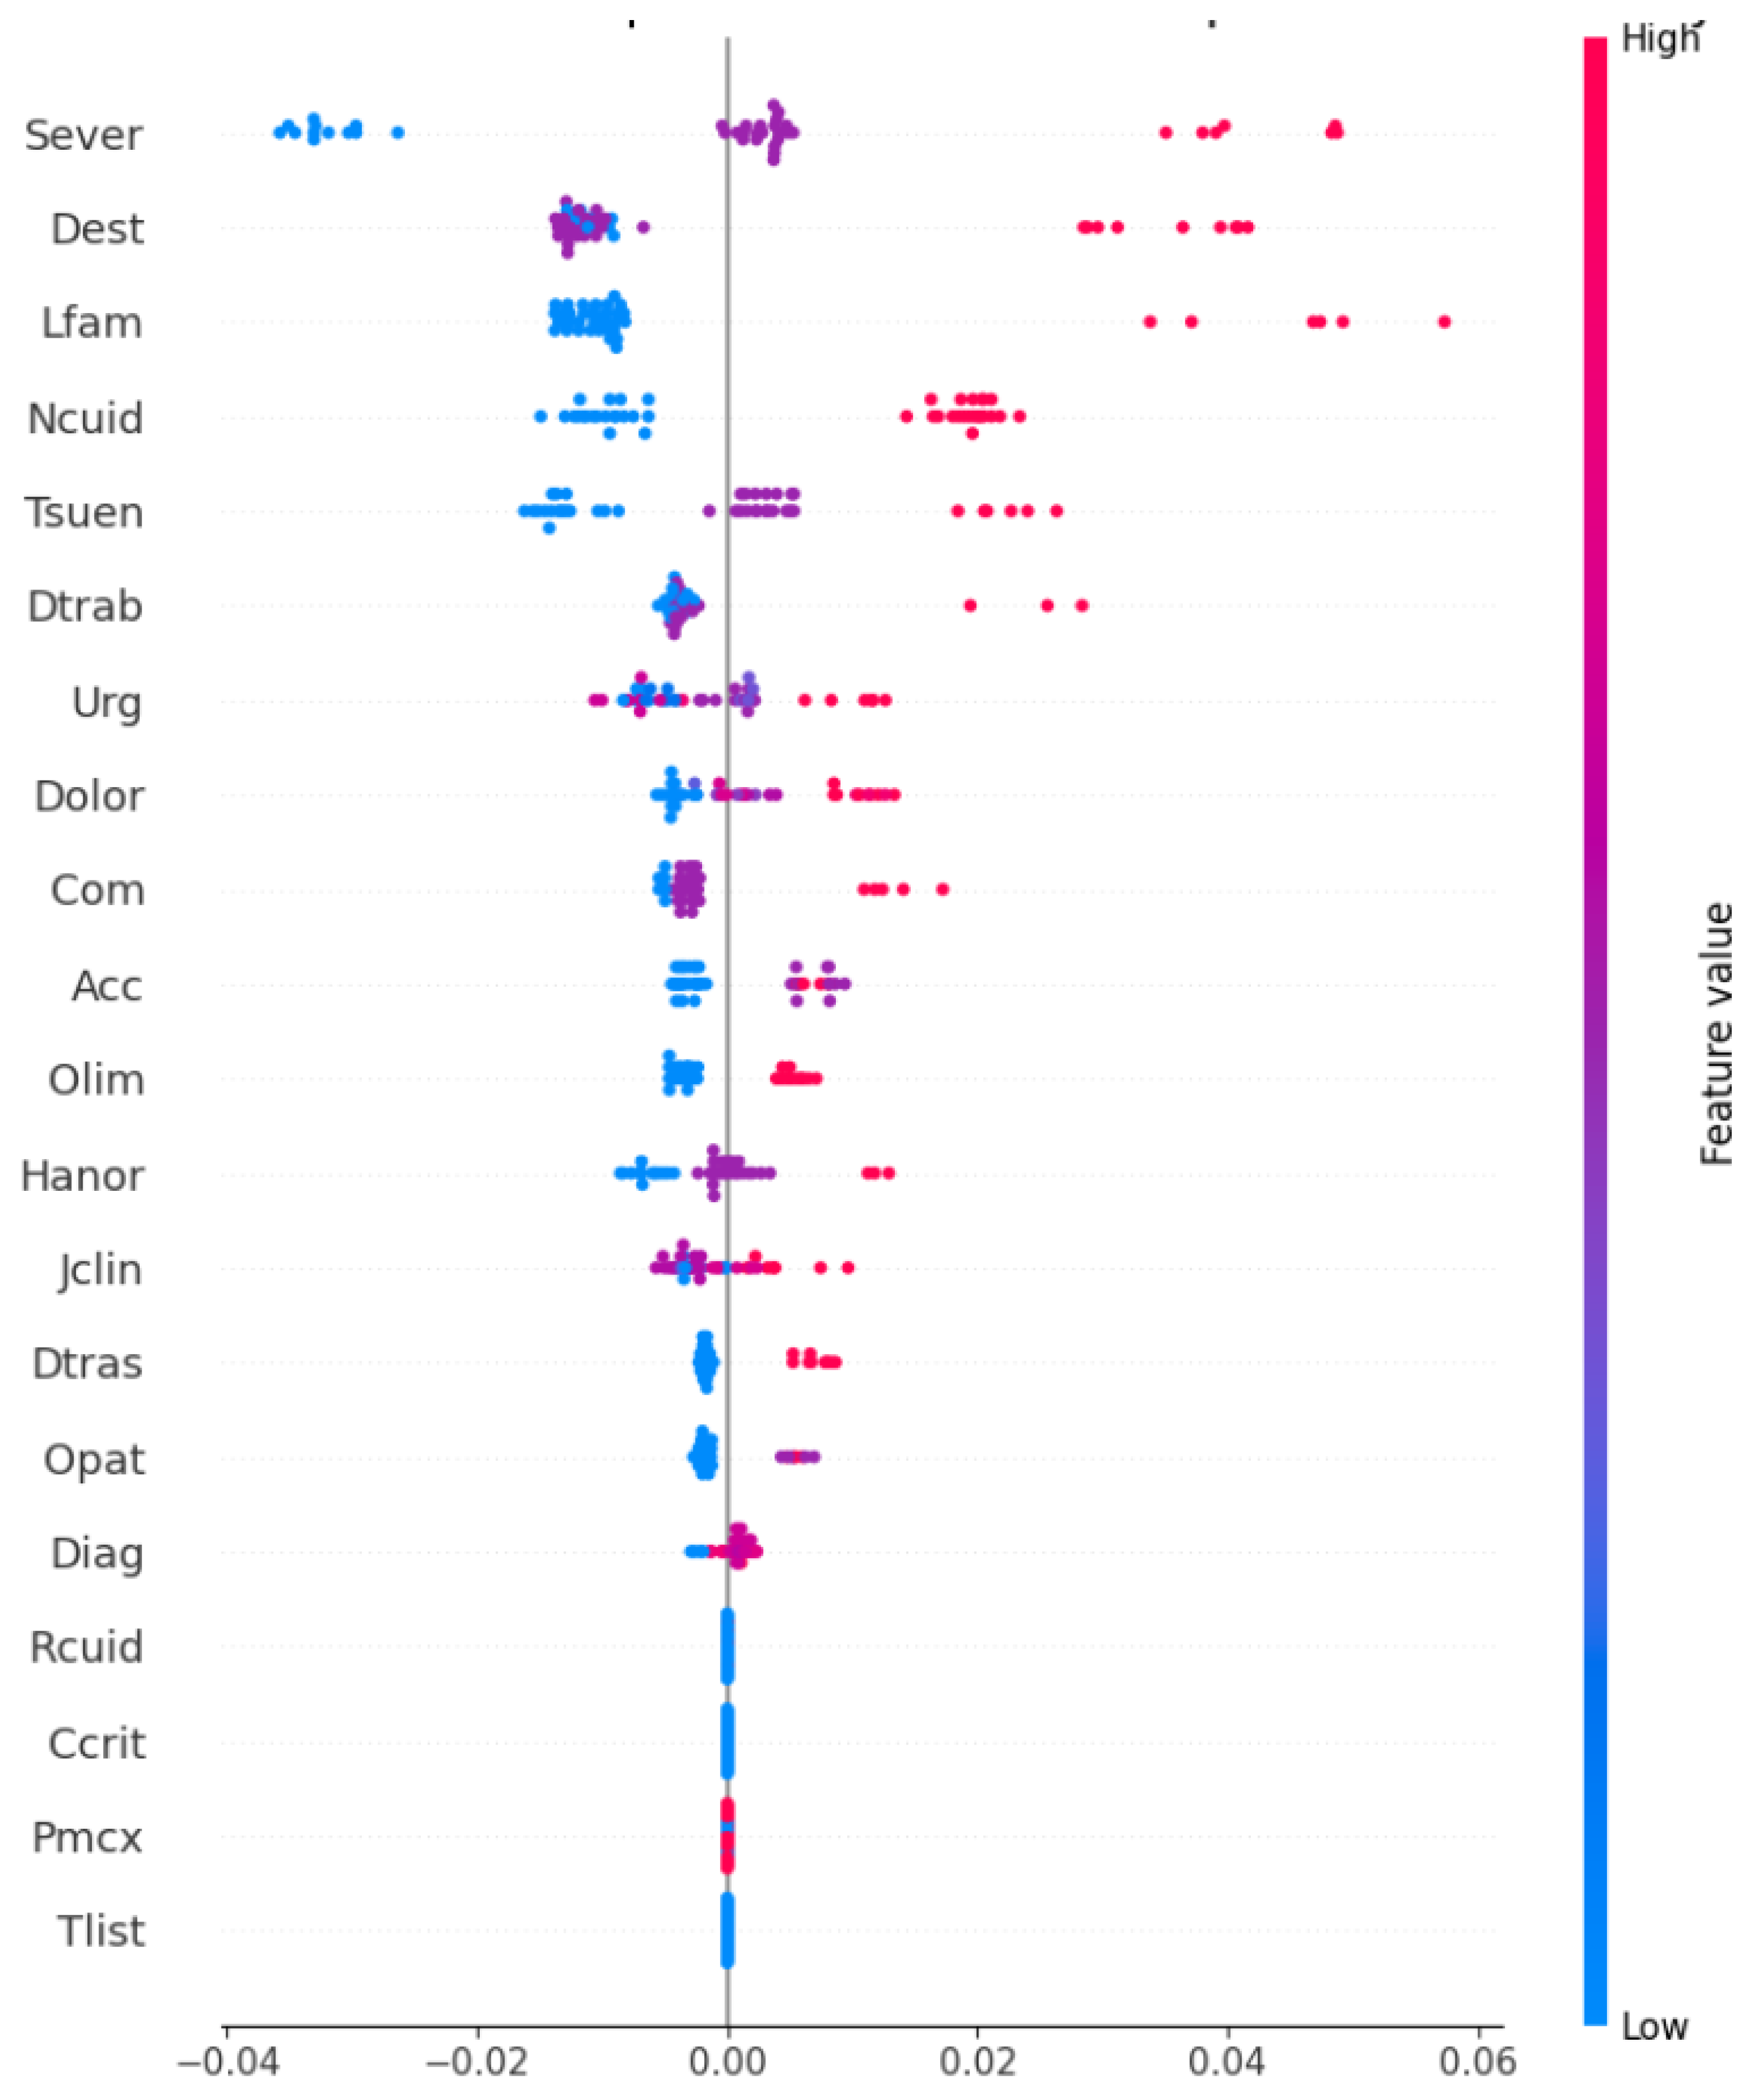
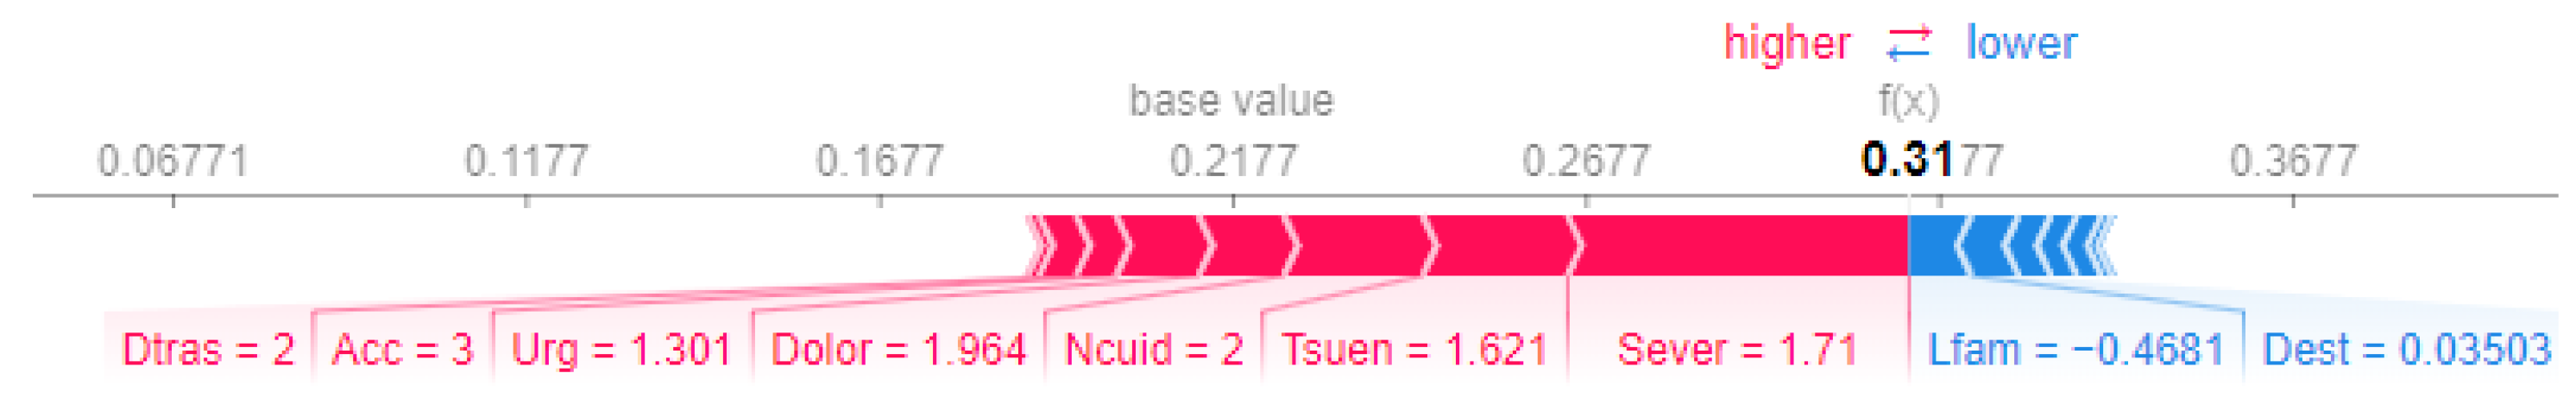
4.4. Insights from SHAP-Based Interpretability of the LightGBM Model

We present the SHAP summary plot in Figure 4, which highlights the global importance and local impact of the characteristics on the predictions of the model. This visualization illustrates how the model prioritizes patients by dynamically predicting q p ( t ) based on static and dynamic variables.
The features are ranked according to their contribution to q p ( t ) , with Sever being the most impactful, followed by Dest, Lfam, and Ncuid. Each dot represents the SHAP value for a feature in a single prediction, where positive values (right of the vertical line) indicate an increase in q p ( t ) , and negative values (left) indicate a decrease. The color gradient shows the magnitudes of the features, with red representing high feature values (e.g., high severe) and blue representing low values.
We observe that Sever and Dest consistently exert strong impacts on q p ( t ) , while features like Lfam and Ncuid show moderate and variable contributions in predictions, reflecting the interaction between clinical severity and contextual factors in determining prioritization scores.
We performed a comparative analysis of the SHAP force plots for Patient 1 and Patient 14, highlighting differences in the feature contributions to their prioritization scores.
For Patient 1 (Figure 5), the final prioritization score of f ( x ) = 0.3177 is significantly driven by positive contributions from Sever (severity, + 1.71 ), Dolor (pain, + 1.964 ), and Tsuen (sleep disorders, + 1.621 ). These contributions reflect the patient’s critical clinical. However, features such as Lfam (capacity of participating in family activities, 0.4681 ) and Dest (capacity to study, 0.03503 ) slightly reduce the prioritization score.
In contrast, Patient 14 (Figure 6) receives a lower prioritization score of f ( x ) = 0.1177 , predominantly influenced by negative contributions. Notably, Sever (severity, 1.406 ) and Com (chances of developing comorbidities, 1.49 ) are the strongest factors that decrease the score, suggesting less severe clinical conditions and reduced complexity.
This comparison underscores the role of severity (Sever) and clinical factors such as pain (Dolor) in driving higher scores for Patient 1, while the absence of these factors in Patient 14 leads to a substantially lower prioritization score.
To quantitatively assess the stability of the importance of the characteristic in the SHAP analysis, we performed a preliminary stability evaluation that analyzed the consistency of the SHAP values in different cross-validation folds (with k = 5). The results indicated that the relative importance of key characteristics, such as severity Sever and urgency Urg, remained stable, with variations below 5%. This suggests that the model’s feature importance ranking is robust to changes in training data.

4.5. Impact of Dynamic Prioritization q p ( t ) on Waiting Time Management

We have demonstrated, through the results presented in Table 5 and Figure 7, that dynamic prioritization q p ( t ) outperforms the static approach Pscore, reducing waiting times by up to 26%. Unlike the static approach, our dynamic model combines static and dynamic variables, enabling real-time adjustments that reflect the clinical evolution of patients.
Although Pscore and q p ( t ) are calculated at different time points ( t = 0 and t = 10 , respectively), we establish their comparability by considering Pscore as a special case of q p ( t ) in which dynamic variables remain constant. Accordingly, as shown in Table 5, our comparison between “Waiting Time Pscore (WTPs)” and “Waiting Time q p ( t ) (WT q p ( t ) )”—which translates Pscore into estimated waiting times—highlights the absence of dynamic adjustments in Pscore that are captured with q p ( t ) . This validates that q p ( t ) not only optimizes surgical allocation by adapting to changes in patient clinical conditions, but also significantly improves the management of the ENT unit, reducing waiting times and benefiting both our clinical decision making and patient outcomes.

5. Discussion

We propose a novel methodology that combines ML, stochastic simulations, and XAI to dynamically prioritize surgical patients on waiting lists. One of the key strengths of our approach lies in our ability to integrate dynamic and static patient variables, ensuring a comprehensive evaluation of clinical, social, and psychological factors. The integration of LightGBM for predictive modeling enables accurate predictions of dynamic prioritization scores q p ( t ) , while SHAP-based interpretability ensures that the decision-making process remains transparent and clinically justifiable.
The stochastic simulation framework introduces dynamism, allowing the model to account for temporal changes and variability in patient conditions. This adaptability ensures that q p ( t ) evolves in response to patient needs, making the model more robust and clinically relevant. Furthermore, our analysis demonstrates that the methodology is scalable, applicable not only to the examples of Patients 1 and 14 but to the entire surgical waiting list, providing a strategy for equitable and efficient resource allocation.
Our 26% reduction in waiting times represents a significant improvement compared with similar methodologies in the literature. For example, Ref. [4] achieved a reduction of 15% to 20% using a risk-based prioritization approach, while [7] reported an improvement of 22% using stochastic optimization techniques. By integrating machine learning, stochastic simulations, and explainable AI, our methodology achieves slightly superior results to these benchmarks, providing a more dynamic and interpretable framework. This makes it possible to support healthcare care services in optimizing and allocating surgical resources and improving patient outcomes in diverse clinical settings.
We acknowledge that a detailed cost–benefit analysis of implementing the proposed system is required. However, we argue that the potential of the methodology to reduce wait times by up to 26% for some patients and improve surgical resource allocation could yield significant economic and operational benefits for healthcare systems. In future work, we will focus on quantifying these benefits, including potential cost savings from optimized resource utilization and improved patient outcomes, to provide a comprehensive assessment of the value of the system.
Despite its strengths, there are limitations to consider. The dataset, while detailed, is limited to 205 patients and specific to an ENT unit in Chile, constraining the generalizability of the findings to other specialties or larger healthcare systems. Furthermore, the relatively small size of the dataset raises concerns about potential impacts on model performance. However, our choice of LightGBM over deep learning was deliberate, as gradient boosting methods are particularly well suited for smaller datasets, offering robust performance through inherent regularization techniques that minimize the risk of overfitting. To further ensure the reliability of our results, we employed cross-validation, which confirmed the robustness and generalizability of the model. Furthermore, the dataset represents a high-complexity otorhinolaryngology unit, providing rich and clinically relevant information despite its size. Future studies will focus on validating the scalability and applicability of our methodology with larger and more diverse datasets.
Certain variables, such as Rcuid and Ccrit, showed minimal impact on q p ( t ) , raising questions about their relevance or potential biases in the data collection process. Future research should aim to validate our findings with larger and more diverse datasets, as well as refine feature engineering to improve the relevance and predictive power of the included variables. These efforts would improve the robustness and generalizability of our methodology to broader clinical contexts.
The reliance on LightGBM, while advantageous for its efficiency and handling of categorical variables, introduces some complexity in model training and parameter optimization. Although SHAP improves interpretability, we recognize the importance of incorporating more clinical stakeholders and management professionals to ensure that the model is aligned with clinical decision making and resource availability in each healthcare facility. In future work, we aim to explore alternative ML techniques and integrate clinical and non-clinical feedback from healthcare services to further refine the methodology.
Physician oversight in the prioritization process is critical. Although our methodology leverages machine learning and stochastic simulations to provide dynamic prioritization scores, these are intended as decision support tools rather than replacing clinical judgment. Physicians retain the ultimate responsibility for validating and refining prioritization decisions, ensuring alignment with patient-specific contexts and ethical considerations. This hybrid approach fosters trust in the system and ensures that data-driven insights complement, rather than replace, the expertise of the medical team.
Lastly, while our methodology demonstrates significant potential for improving surgical patient prioritization, its clinical implementation would require seamless integration with existing hospital management systems. This includes automating data collection for dynamic variables and providing real-time updates to healthcare providers. In addition, extending this approach to other medical specialties could broaden its utility, allowing a unified prioritization framework that can be adjusted to various clinical contexts. These advances would further validate the effectiveness of the model and promote its adoption in real-world healthcare settings.
We recognize the importance of rigorous validation of the mathematical framework integrating LightGBM, stochastic simulations, and XAI. To address this, we employ multiple validation techniques, including k-fold cross-validation to ensure generalizability, sensitivity analyses to evaluate the robustness of stochastic simulation parameters, and stability assessments of SHAP-based feature importance across folds. These complementary approaches provide a robust foundation for the reliability and interpretability of the framework. Future work will explore additional theoretical analyses and real-world case studies to further validate its applicability in diverse clinical contexts.

6. Conclusions

In our work, we present a comprehensive and dynamic methodology to prioritize surgical patients on waiting lists, integrating ML, stochastic simulations, and XAI. Using the predictive power of LightGBM, we demonstrate that our approach accurately estimates dynamic prioritization scores q p ( t ) , with an MSE of 0.00018 and a high R 2 value of 0.96282, showcasing its predictive reliability. Furthermore, SHAP-based interpretability highlights that the Sever variable is the most influential in the system, providing additional insights to the healthcare team to make decision-making processes transparent and justifiable. Furthermore, our methodology achieves a reduction in waiting times of up to 26%, further validating its effectiveness in optimizing surgical prioritization.
Incorporating stochastic simulations allows our methodology to dynamically adapt to temporal changes in patient conditions. Through simulation, we observed that q p ( t ) evolves consistently with patient needs. For example, Patient 1’s q p ( t ) increased from 0.50 (in t = 0 ) to 1.026 (at t = 10 ), driven by a significant growth in dynamic variables such as Sever and Tsuen. This adaptability ensures that our approach is suitable for real-world scenarios where patient conditions fluctuate and healthcare resources must be allocated dynamically.
Our results emphasize the ability of the model to capture and prioritize clinically relevant variables. For example, SHAP analyses reveal that Sever contributes up to 1.71 points to q p ( t ) in Patient 1, while non-clinical factors like Lfam (family participation capacity) exert a moderating influence, reducing scores by up to 0.468. This fine-grained analysis ensures that the model’s predictions align with both medical guidelines and holistic patient care considerations. The scalability of our methodology further ensures its applicability to entire surgical waiting lists and diverse healthcare systems.
Despite its strengths, we acknowledge several limitations in our study. The dataset is specific to an ENT unit in Chile, which may limit the generalizability of our findings to other medical specialties or geographic regions. Furthermore, while our model achieves high predictive accuracy, its implementation requires further validation from other hospital stakeholders, such as clinical and non-clinical managers, to ensure alignment with real-world decision-making processes.
In conclusion, we present a dynamic, interpretable, and data-driven framework to address surgical waiting lists, integrating predictive accuracy, adaptability, and explainability. By prioritizing patients based on evolving clinical and social factors, our methodology offers a scalable and equitable solution to resource allocation challenges. Future efforts should focus on extending the dataset to include patients from multiple specialties and healthcare systems to enhance the generalizability of the findings; conducting a detailed cost–benefit analysis to quantify the economic and operational impact of implementing the proposed system; exploring alternative machine learning models and feature engineering strategies to improve predictive accuracy and interpretability; and developing user-centric interfaces to facilitate the integration of the prioritization system into clinical workflows, ensuring practical applicability and usability in real-world settings.

Author Contributions

Conceptualization, F.S.-A., J.M. and J.H.G.-B.; data curation, F.S.-A., M.J. and J.H.G.-B.; formal analysis, F.S.-A., J.M. and M.E.R.; funding acquisition, F.S.-A. and J.M.; investigation, F.S.-A., J.M., M.J., M.E.R. and J.H.G.-B.; methodology, F.S.-A., J.M., M.J., M.E.R. and J.H.G.-B.; project administration, M.E.R. and J.M.; supervision, J.M. and J.H.G.-B.; writing—original draft, F.S.-A., J.M., M.J., M.E.R. and J.H.G.-B.; writing—review and editing, F.S.-A., J.M., M.J., M.E.R. and J.H.G.-B. All authors have read and agreed to the published version of the manuscript.

Funding

This research was funded by the “ANID Fondecyt Iniciacion a la Investigación 2024 N° 11240214”.

Institutional Review Board Statement

Not applicable.

Informed Consent Statement

Not applicable.

Data Availability Statement

Dataset available on request from the authors.

Acknowledgments

The authors thank the research team for the information provided in the articles [11] and the ENT unit of the high-complexity public hospital of Chile.

Conflicts of Interest

The authors declare no conflicts of interest.

References

  1. Silva-Aravena, F.; Álvarez-Miranda, E.; Astudillo, C.A.; González-Martínez, L.; Ledezma, J.G. Patients’ prioritization on surgical waiting lists: A decision support system. Mathematics 2021, 9, 1097. [Google Scholar] [CrossRef]
  2. García-Corchero, J.D.; Jiménez-Rubio, D. Waiting times in healthcare: Equal treatment for equal need? Int. J. Equity Health 2022, 21, 184. [Google Scholar] [CrossRef] [PubMed]
  3. Rana, H.; Umer, M.; Hassan, U.; Asgher, U.; Silva-Aravena, F.; Ehsan, N. Application of fuzzy TOPSIS for prioritization of patients on elective surgeries waiting list—A novel multi-criteria decision-making approach. Decis. Mak. Appl. Manag. Eng. 2023, 6, 603–630. [Google Scholar] [CrossRef]
  4. Rahimi, S.A.; Jamshidi, A.; Ruiz, A.; Aït-Kadi, D. A new dynamic integrated framework for surgical patients’ prioritization considering risks and uncertainties. Decis. Support Syst. 2016, 88, 112–120. [Google Scholar] [CrossRef]
  5. Mohammed, K.; Zaidan, A.; Zaidan, B.; Albahri, O.S.; Alsalem, M.; Albahri, A.S.; Hadi, A.; Hashim, M. Real-time remote-health monitoring systems: A review on patients prioritisation for multiple-chronic diseases, taxonomy analysis, concerns and solution procedure. J. Med. Syst. 2019, 43, 1–21. [Google Scholar] [CrossRef]
  6. Ahmed, A.; He, L.; Chou, C.a.; Hamasha, M.M. A prediction-optimization approach to surgery prioritization in operating room scheduling. J. Ind. Prod. Eng. 2022, 39, 399–413. [Google Scholar] [CrossRef]
  7. Keyvanshokooh, E.; Kazemian, P.; Fattahi, M.; Van Oyen, M.P. Coordinated and priority-based surgical care: An integrated distributionally robust stochastic optimization approach. Prod. Oper. Manag. 2022, 31, 1510–1535. [Google Scholar] [CrossRef]
  8. Bamaarouf, S.; Jawab, F.; Frichi, Y. Elective surgery prioritization criteria and tools: A literature review. In Proceedings of the 2024 IEEE 15th International Colloquium on Logistics and Supply Chain Management (LOGISTIQUA), Sousse, Tunisia, 2–4 May 2024; IEEE: Piscataway, NJ, USA, 2024; pp. 1–6. [Google Scholar]
  9. Silva-Aravena, F.; Álvarez-Miranda, E.; Astudillo, C.A.; González-Martínez, L.; Ledezma, J.G. On the data to know the prioritization and vulnerability of patients on surgical waiting lists. Data Brief 2020, 29, 105310. [Google Scholar] [CrossRef]
  10. Skillings, J.L.; Lewandowski, A.N. Team-based biopsychosocial care in solid organ transplantation. J. Clin. Psychol. Med. Settings 2015, 22, 113–121. [Google Scholar] [CrossRef]
  11. Silva-Aravena, F.; Morales, J. Dynamic surgical waiting list methodology: A networking approach. Mathematics 2022, 10, 2307. [Google Scholar] [CrossRef]
  12. Stitini, O.; Ouakasse, F.; Rakrak, S.; Kaloun, S.; Bencharef, O. Combining IoMT and XAI for Enhanced Triage Optimization: An MQTT Broker Approach with Contextual Recommendations for Improved Patient Priority Management in Healthcare. Int. Online Biomed. Eng. 2024, 20, 145. [Google Scholar] [CrossRef]
  13. Silva-Aravena, F.; Delafuente, H.N.; Astudillo, C.A. A novel strategy to classify chronic patients at risk: A hybrid machine learning approach. Mathematics 2022, 10, 3053. [Google Scholar] [CrossRef]
  14. Kim, S.Y.; Kim, D.H.; Kim, M.J.; Ko, H.J.; Jeong, O.R. XAI-Based Clinical Decision Support Systems: A Systematic Review. Appl. Sci. 2024, 14, 6638. [Google Scholar] [CrossRef]
  15. Cutillo, C.M.; Sharma, K.R.; Foschini, L.; Kundu, S.; Mackintosh, M.; Mandl, K.D.; MI in Healthcare Workshop Working Group. Machine intelligence in healthcare—Perspectives on trustworthiness, explainability, usability, and transparency. Npj Digit. Med. 2020, 3, 47. [Google Scholar] [CrossRef]
  16. Guo, L.L.; Guo, L.Y.; Li, J.; Gu, Y.W.; Wang, J.Y.; Cui, Y.; Qian, Q.; Chen, T.; Jiang, R.; Zheng, S. Characteristics and Admission Preferences of Pediatric Emergency Patients and Their Waiting Time Prediction Using Electronic Medical Record Data: Retrospective Comparative Analysis. J. Med. Internet Res. 2023, 25, e49605. [Google Scholar] [CrossRef]
  17. Yu, Z.; Ashrafi, N.; Li, H.; Alaei, K.; Pishgar, M. Prediction of 30-day mortality for ICU patients with Sepsis-3. Bmc Med. Inform. Decis. Mak. 2024, 24, 223. [Google Scholar] [CrossRef]
  18. Rathnayake, D.; Clarke, M.; Jayasinghe, V. Patient prioritisation methods to shorten waiting times for elective surgery: A systematic review of how to improve access to surgery. PLoS ONE 2021, 16, e0256578. [Google Scholar] [CrossRef]
  19. Adeniran, I.A.; Efunniyi, C.P.; Osundare, O.S.; Abhulimen, A.O. Data-driven decision-making in healthcare: Improving patient outcomes through predictive modeling. Eng. Sci. Technol. J. 2024, 5, 59–67. [Google Scholar]
  20. Bakker, M.; Tsui, K.L. Dynamic resource allocation for efficient patient scheduling: A data-driven approach. J. Syst. Sci. Syst. Eng. 2017, 26, 448–462. [Google Scholar] [CrossRef]
  21. Morales, J.; Silva-Aravena, F.; Saez, P. Reducing Waiting Times to Improve Patient Satisfaction: A Hybrid Strategy for Decision Support Management. Mathematics 2024, 12, 3743. [Google Scholar] [CrossRef]
  22. Asif, S.; Wenhui, Y.; ur Rehman, S.; ul ain, Q.; Amjad, K.; Yueyang, Y.; Jinhai, S.; Awais, M. Advancements and Prospects of Machine Learning in Medical Diagnostics: Unveiling the Future of Diagnostic Precision. Arch. Comput. Methods Eng. 2024, 1–31. [Google Scholar] [CrossRef]
  23. Li, L. Application of Machine learning and data mining in Medicine: Opportunities and considerations. In Machine Learning and Data Mining Annual Volume 2023; IntechOpen Limited: London, UK, 2023. [Google Scholar]
  24. Nasarian, E.; Alizadehsani, R.; Acharya, U.R.; Tsui, K.L. Designing interpretable ML system to enhance trust in healthcare: A systematic review to proposed responsible clinician-AI-collaboration framework. Inf. Fusion 2024, 108, 102412. [Google Scholar] [CrossRef]
  25. Fahimullah, M.; Ahvar, S.; Agarwal, M.; Trocan, M. Machine learning-based solutions for resource management in fog computing. Multimed. Tools Appl. 2024, 83, 23019–23045. [Google Scholar] [CrossRef]
  26. Yasin, P.; Yimit, Y.; Cai, X.; Aimaiti, A.; Sheng, W.; Mamat, M.; Nijiati, M. Machine learning-enabled prediction of prolonged length of stay in hospital after surgery for tuberculosis spondylitis patients with unbalanced data: A novel approach using explainable artificial intelligence (XAI). Eur. J. Med. Res. 2024, 29, 383. [Google Scholar] [CrossRef]
  27. Khanna, V.V.; Chadaga, K.; Sampathila, N.; Prabhu, S.; Chadaga, R. A machine learning and explainable artificial intelligence triage-prediction system for COVID-19. Decis. Anal. J. 2023, 7, 100246. [Google Scholar] [CrossRef]
  28. Silva-Aravena, F.; Núñez Delafuente, H.; Gutiérrez-Bahamondes, J.H.; Morales, J. A hybrid algorithm of ml and xai to prevent breast cancer: A strategy to support decision making. Cancers 2023, 15, 2443. [Google Scholar] [CrossRef]
  29. Bhandari, M.; Yogarajah, P.; Kavitha, M.S.; Condell, J. Exploring the capabilities of a lightweight CNN model in accurately identifying renal abnormalities: Cysts, stones, and tumors, using LIME and SHAP. Appl. Sci. 2023, 13, 3125. [Google Scholar] [CrossRef]
  30. Gaur, L.; Bhandari, M.; Razdan, T.; Mallik, S.; Zhao, Z. Explanation-driven deep learning model for prediction of brain tumour status using MRI image data. Front. Genet. 2022, 13, 822666. [Google Scholar] [CrossRef]
  31. Rane, N.; Choudhary, S.; Rane, J. Explainable Artificial Intelligence (XAI) in healthcare: Interpretable Models for Clinical Decision Support. SSRN 2023, 4637897. [Google Scholar] [CrossRef]
  32. Frichi, Y.; Aboueljinane, L.; Jawab, F. Using discrete-event simulation to assess an AHP-based dynamic patient prioritisation policy for elective surgery. J. Simul. 2023, 19, 39–63. [Google Scholar] [CrossRef]
  33. Antoniadi, A.M.; Du, Y.; Guendouz, Y.; Wei, L.; Mazo, C.; Becker, B.A.; Mooney, C. Current challenges and future opportunities for XAI in machine learning-based clinical decision support systems: A systematic review. Appl. Sci. 2021, 11, 5088. [Google Scholar] [CrossRef]
  34. Greenhalgh, T.; Shaw, S.; Wherton, J.; Vijayaraghavan, S.; Morris, J.; Bhattacharya, S.; Hanson, P.; Campbell-Richards, D.; Ramoutar, S.; Collard, A.; et al. Real-world implementation of video outpatient consultations at macro, meso, and micro levels: Mixed-method study. J. Med. Internet Res. 2018, 20, e150. [Google Scholar] [CrossRef] [PubMed]
  35. Kislov, R.; Checkland, K.; Wilson, P.M.; Howard, S.J. ‘Real-world’priority setting for service improvement in English primary care: A decentred approach. Public Manag. Rev. 2023, 25, 150–174. [Google Scholar] [CrossRef]
  36. Kundu, S.; Bhattacharya, A.; Chandan, V.; Radhakrishnan, N.; Adetola, V.; Vrabie, D. A Stochastic Multi-Criteria Decision-Making Algorithm for Dynamic Load Prioritization in Grid-Interactive Efficient Buildings. Asme Lett. Dyn. Syst. Control 2021, 1, 031014. [Google Scholar] [CrossRef]
  37. Feng, W.H.; Lou, Z.; Kong, N.; Wan, H. A multiobjective stochastic genetic algorithm for the pareto-optimal prioritization scheme design of real-time healthcare resource allocation. Oper. Res. Health Care 2017, 15, 32–42. [Google Scholar] [CrossRef]
  38. Zion, G.D.; Tripathy, B. Pattern Prediction on Uncertain Big Datasets using Combined Light GBM and LSTM Model. Int. J. Adv. Soft Comput. Its Appl. 2023, 15, 288–310. [Google Scholar]
  39. Zhou, F.; Hu, S.; Du, X.; Wan, X.; Lu, Z.; Wu, J. Lidom: A Disease Risk Prediction Model Based on LightGBM Applied to Nursing Homes. Electronics 2023, 12, 1009. [Google Scholar] [CrossRef]
  40. Saito, H.; Yoshimura, H.; Tanaka, K.; Kimura, H.; Watanabe, K.; Tsubokura, M.; Ejiri, H.; Zhao, T.; Ozaki, A.; Kazama, S.; et al. Predicting CKD progression using time-series clustering and light gradient boosting machines. Sci. Rep. 2024, 14, 1723. [Google Scholar] [CrossRef]
  41. Malik, S.; Rathee, P. Enhancing COVID-19 Diagnosis Accuracy and Transparency with Explainable Artificial Intelligence (XAI) Techniques. Comput. Sci. 2024, 5, 806. [Google Scholar] [CrossRef]
  42. Sadeghi, Z.; Alizadehsani, R.; CIFCI, M.A.; Kausar, S.; Rehman, R.; Mahanta, P.; Bora, P.K.; Almasri, A.; Alkhawaldeh, R.S.; Hussain, S.; et al. A review of Explainable Artificial Intelligence in healthcare. Comput. Electr. Eng. 2024, 118, 109370. [Google Scholar] [CrossRef]
  43. Li, J.; Luo, L.; Wu, X.; Liao, C.; Liao, H.; Shen, W. Prioritizing the elective surgery patient admission in a Chinese public tertiary hospital using the hesitant fuzzy linguistic ORESTE method. Appl. Soft Comput. 2019, 78, 407–419. [Google Scholar] [CrossRef]
  44. Silva-Aravena, F.; Gutiérrez-Bahamondes, J.H.; Núñez Delafuente, H.; Toledo-Molina, R.M. An intelligent system for patients’ well-being: A multi-criteria decision-making approach. Mathematics 2022, 10, 3956. [Google Scholar] [CrossRef]
  45. Raza, A.; Eid, F.; Montero, E.C.; Noya, I.D.; Ashraf, I. Enhanced interpretable thyroid disease diagnosis by leveraging synthetic oversampling and machine learning models. BMC Med. Inform. Decis. Mak. 2024, 24, 364. [Google Scholar] [CrossRef] [PubMed]
  46. Powers, J.; McGree, J.M.; Grieve, D.; Aseervatham, R.; Ryan, S.; Corry, P. Managing surgical waiting lists through dynamic priority scoring. Health Care Manag. Sci. 2023, 26, 533–557. [Google Scholar] [CrossRef]
  47. Cao, X.H.; Stojkovic, I.; Obradovic, Z. A robust data scaling algorithm to improve classification accuracies in biomedical data. BMC Bioinform. 2016, 17, 359. [Google Scholar] [CrossRef]
  48. Henderi, H.; Wahyuningsih, T.; Rahwanto, E. Comparison of Min-Max normalization and Z-Score Normalization in the K-nearest neighbor (kNN) Algorithm to Test the Accuracy of Types of Breast Cancer. Int. J. Inform. Inf. Syst. 2021, 4, 13–20. [Google Scholar] [CrossRef]
  49. Liu, S.; Lu, C. An Active SearchTime Tuning Model Based on the Optimally Weighted LightGBM Algorithm. In Proceedings of the Journal of Physics: Conference Series, Shanghai, China, 26–28 August 2022; IOP Publishing: Bristol, UK, 2022; Volume 2383, p. 012149. [Google Scholar]
  50. Qiuqian, W.; GaoMin; KeZhu, Z.; Chenchen. A light gradient boosting machine learning-based approach for predicting clinical data breast cancer. Multiscale Multidiscip. Model. Exp. Des. 2025, 8, 75. [Google Scholar] [CrossRef]
  51. Kanber, B.M.; Smadi, A.A.; Noaman, N.F.; Liu, B.; Gou, S.; Alsmadi, M.K. LightGBM: A Leading Force in Breast Cancer Diagnosis Through Machine Learning and Image Processing. IEEE Access 2024, 237, 121618. [Google Scholar] [CrossRef]
  52. Rufo, D.D.; Debelee, T.G.; Ibenthal, A.; Negera, W.G. Diagnosis of diabetes mellitus using gradient boosting machine (LightGBM). Diagnostics 2021, 11, 1714. [Google Scholar] [CrossRef]
  53. Yang, H.; Chen, Z.; Yang, H.; Tian, M. Predicting coronary heart disease using an improved LightGBM model: Performance analysis and comparison. IEEE Access 2023, 11, 23366–23380. [Google Scholar] [CrossRef]
  54. Zeng, X. Length of stay prediction model of indoor patients based on light gradient boosting machine. Comput. Intell. Neurosci. 2022, 2022, 9517029. [Google Scholar] [CrossRef] [PubMed]
  55. Li, S.; Jin, N.; Dogani, A.; Yang, Y.; Zhang, M.; Gu, X. Enhancing LightGBM for Industrial Fault Warning: An Innovative Hybrid Algorithm. Processes 2024, 12, 221. [Google Scholar] [CrossRef]
  56. Altenbuchinger, M.; Weihs, A.; Quackenbush, J.; Grabe, H.J.; Zacharias, H.U. Gaussian and Mixed Graphical Models as (multi-) omics data analysis tools. Biochim. Biophys. Acta (BBA)-Gene Regul. Mech. 2020, 1863, 194418. [Google Scholar] [CrossRef] [PubMed]
  57. Bakhshaei, K.; Salavatidezfouli, S.; Stabile, G.; Rozza, G. Stochastic Parameter Prediction in Cardiovascular Problems. arXiv 2024, arXiv:2411.18089. [Google Scholar]
  58. Heo, J.; Lee, H.B.; Kim, S.; Lee, J.; Kim, K.J.; Yang, E.; Hwang, S.J. Uncertainty-aware attention for reliable interpretation and prediction. Adv. Neural Inf. Process. Syst. 2018, 31. [Google Scholar]
  59. Bloch, L.; Friedrich, C.M.; Initiative, A.D.N. Data analysis with Shapley values for automatic subject selection in Alzheimer’s disease data sets using interpretable machine learning. Alzheimer’S Res. Ther. 2021, 13, 155. [Google Scholar] [CrossRef]
  60. Yu, Q.; Hou, Z.; Wang, Z. Predictive modeling of preoperative acute heart failure in older adults with hypertension: A dual perspective of SHAP values and interaction analysis. BMC Med. Inform. Decis. Mak. 2024, 24, 329. [Google Scholar] [CrossRef]
  61. Dobbin, K.K.; Simon, R.M. Optimally splitting cases for training and testing high dimensional classifiers. BMC Med. Genom. 2011, 4, 31. [Google Scholar] [CrossRef]
Figure 1. Scatter plot comparing q p ( t ) with Pscore p .
Technologies 13 00072 g001
Figure 2. Comparison of Sever and Urg evolution for 3 patients over 10 time steps.
Technologies 13 00072 g002
Figure 3. Dynamic evolution of q p ( t ) over time for 3 patients.
Technologies 13 00072 g003
Figure 4. SHAP summary plot illustrating global feature importance and local impact on model predictions.
Technologies 13 00072 g004
Figure 5. SHAP force plot for Patient 1.
Technologies 13 00072 g005
Figure 6. SHAP force plot for Patient 14.
Technologies 13 00072 g006
Figure 7. Percentage improvement in waiting times for patients using dynamic prioritization ( q p ( t ) ).
Technologies 13 00072 g007
Table 1. Variables defined by ENT physicians. Certain variables evolve over time, marked with an asterisk (*), indicating their dynamic nature.
No.VariableDefinition
1Sever (*)Severity
2Urg (*)Urgency
3JclinMaximum waiting time
4Tsuen (*)Sleep disorder
5TlistTime on list
6Pmcx(*)Expected improvement due to surgery
7Dest(*)Capacity to study
8Com(*)Chances of developing comorbidities
9Lfam(*)Capacity of participating in family activities
10Hanor(*)Affected area
11OpatPresence of other pathologies
12DiagDiagnosis
13Olim(*)Other limitations
14NcuidNeed of a caregiver
15RcuidPatient cares for another person
16Dolor(*)Pain sale
17DtrabCapacity to work
18AccType of residence area
19DtrasDifficulty in transferring
20CcritNeed for clinical bed
21PscorePhysician’s score, given by the health team
Table 2. Comparison of Pscore p , q p ( t ) , and residuals for a sample of 10 patients.
Patient Pscore ( p ) q p ( t ) Residual
10.780.760.02
20.850.87−0.02
30.660.68−0.02
40.720.73−0.01
50.810.790.02
60.750.740.01
70.690.670.02
80.880.860.02
90.770.760.01
100.800.82−0.02
Table 3. Initial values of dynamic variables and prioritization scores for all patients ( t = 0 ).
PatientSeverUrg q p ( t )
Patient 10.540.520.50
Patient 20.590.430.50
Patient 30.550.430.50
Table 4. Sample q p ( t ) values at selected time steps for Patient 1.
Time (t)SeverUrg q p ( t )
50.7800.6300.720
101.2500.6901.026
Table 5. Comparison of static and dynamic prioritization metrics and their impact on waiting times.
PatientPscore q p ( t = 0 ) q p ( t = 10 ) WTPsWT q p (t)Improvement (%)
70.700.430.591.230.9126.10
60.870.490.631.621.3516.83
50.770.490.621.621.3516.79
30.630.831.103.923.3913.56
20.980.971.264.804.2112.24
90.690.760.943.403.0310.94
80.740.911.124.464.059.18
40.930.750.903.393.108.39
10.540.620.722.492.288.33
100.510.820.983.833.518.25
Disclaimer/Publisher’s Note: The statements, opinions and data contained in all publications are solely those of the individual author(s) and contributor(s) and not of MDPI and/or the editor(s). MDPI and/or the editor(s) disclaim responsibility for any injury to people or property resulting from any ideas, methods, instructions or products referred to in the content.

