Article

Particle Size Distribution in Holby–Morgan Degradation Model of Platinum on Carbon Catalyst in Fuel Cell: Normal Distribution

by
Victor A. Kovtunenko
1,2
1
Department of Mathematics and Scientific Computing, Karl-Franzens University of Graz, NAWI Graz, Heinrichstr. 36, 8010 Graz, Austria
2
Lavrentyev Institute of Hydrodynamics, Siberian Division of the Russian Academy of Sciences, 630090 Novosibirsk, Russia
Technologies 2024, 12(10), 202; https://doi.org/10.3390/technologies12100202
Submission received: 15 September 2024 / Revised: 13 October 2024 / Accepted: 14 October 2024 / Published: 17 October 2024
(This article belongs to the Section Environmental Technology)

Abstract

:
The influence of particle size distribution in platinum catalysts on the aging of PEM fuel cells described by Holby–Morgan electrochemical degradation model is under investigation. The non-diffusive model simulates mechanisms of particle drop by Pt dissolution and particle growth through Pt ion deposition. Without spatial dependence, the number of differential equations can be reduced using the first integral of the system. For an accelerated stress test, a non-symmetric square-wave potential profile is applied according to the European harmonized protocol. The normal particle size distribution determined by two probability parameters of the expectation and the standard deviation is represented within finite groups. Numerical solution of the nonlinear diffusion equation justifies dispersion for small and narrowing for large distribution means, decrease or increase in amplitude, and movement of Pt particle diameters towards small sizes, which is faster for small particles.

Graphical Abstract

1. Introduction

The transition from fossil fuels such as gasoline, diesel, and coal toward sustainable energy aims to minimize environmental impact by reducing global greenhouse gas emissions that cause climate changes. Hydrogen is a promising alternative carrier for chemical energy within emerging renewable energy sources. Against conventional hydrogen that is generated through natural gas, membrane-based water electrolysis results in green hydrogen, which is considered as the most advanced technology for sustainability. Environmental impact, efficiency, and costs are the key factors influencing hydrogen production solutions in all kinds of stationary, portable, and mobile applications. Readers can find a compendium of hydrogen energy in the monographs by Ball et al. [1], Barbir [2], Hacker and Mitsushima [3], Eikerling and Kulikovsky [4], Kulikovsky [5] and current trends of hydrogen engineering and future developments of (bio-) membrane technologies in the collection by Basile et al. [6]. Guerrero-Rodríguez et al. [7] studied efficiency trends and long-term viability of powered hydrogen production involving data collection, environmental impact, and production costs.
Fuel cells are governed by the same principle as electrolyzers and have promising potential to provide clean energy efficiently. FCs are classified primarily by the kind of electrolyte they use, chemical reactions that occur within the cell, and operating conditions. The main types of electrolyte-based fuel cells include the polymer electrolyte membrane fuel cell (PEMFC). However, their progress is slowed down by some critical challenges which include high manufacturing costs, the relatively low energy density of hydrogen, fuel cell durability issues, and complicated hydrogen storage and transportation. Another significant issue is reduction in Pt degradation in the catalyst, which is essential to lower the costs of fuel cells since platinum is a precious metal of high cost. Researchers are intensively working upon mitigation strategies to reduce degradation in the course of fuel cell operation, see Gohar et al. [8], Padgett et al. [9]. Simulation of complex behavior in the membrane electrode assembly (MEA) stack unit can help to optimize its performance and durability by adjusting parameters and operating conditions in real time, for example, by the voltage fluctuations studied in Ding et al. [10]. Tian et al. [11] summarized the recent progress in the optimization and new mechanisms of catalysts.
Fuel cells comprise together several key components that generate electricity, such as electrodes (anode and cathode), gas diffusion layer (GDL), membrane (electrolyte), and catalyst layer (CL) as illustrated in Figure 1. Bipolar plates serve as the anode to one cell and the cathode to the adjacent cell. PEMs are composed of polymers with sulfonic groups that aid proton transport from anode to cathode and separate fuel and oxidant gasses. The anode and cathode CLs are placed on two sides of the PEM and usually consist of platinum nanoparticles supported by carbon possessing waste surface area. They comprise a three-layer MEA also known as a catalyst-coated membrane (CCM), and a five-layer MEA when integrated together with the GDL. The performance of the PEMFCs is significantly affected by the electrochemical activity of the platinum-based catalyst layers serving as materials that enhance the rate of electrochemical reactions at the electrodes. Protons can pass through the electrocatalyst layers owing to an added ionomer. Among various electrochemical processes, the hydrogen oxidation reaction (HOR) at the anode and the oxygen reduction reaction (ORR) at the cathode facilitate conversion of hydrogen fuel into electrical energy. The review by Jithul et al. [12] examines comprehensively the role of ORR electrocatalysts in fuel cell efficiency.
Within the theory of electrochemical systems, coupled Nernst–Planck–Poisson–Navier–Stokes equations were applied in Fuhrmann [13] for thermodynamically consistent modeling of isothermal and incompressible ionic mixtures in mechanical equilibrium. Numerical solution of the nonlinear diffusion system ensuring a non-negative and non-oscillatory solution was developed based on two-point flux finite volume methods on unstructured triangular meshes. The numerical procedure was used for semiconductor simulation taking into account finite ion size and solvation effects. Addressing relevant issues, we refer to Fellner and Kovtunenko [14], González-Granada and Kovtunenko [15], Kovtunenko and Zubkova [16] for electrochemical modeling with Poisson–Nernst–Planck equations, to Alekseev and Spivak [17] for temperature-dependent coupling, and to González-Durán et al. [18] for computational fluid dynamics. In the monographs of Khludnev and Kovtunenko [19], one can find variational models suitable for mechanical degradation and in Efendiev [20] the abstract theory of nonlinear evolution equations. For statistical-based and machine-learning methods see Khajavian and Haseli [21], Khatun et al. [22].
The performance and durability of PMFCs is strongly correlated with parameters like the platinum particle size. Sevjidsuren et al. [23] studied and compared the structure and morphology of support materials for electrocatalysts and demonstrated that the carbon support affects the electrode layer and catalyst characteristics such as platinum particle size and dispersion. Transmission electron microscopy (TEM) images show that Pt particle size distribution (PSD) is not homogeneous on the support and particles tend to agglomerate, which is called Ostwald ripening (see [24]) because larger particles are energetically more stable. Not only Pt/C but also nano-structures, including carbon nano-tubes (CNTs) are widely used as support materials. Mensharapov et al. [25] estimated the effect of CNT-based support on the resulting size distribution of Pt nanoparticles. To determine the platinum PSD they employed the semi-empirical model based on Sakurai et al. [26] to describe the Ostwald ripening mechanism. Growth of large particles owing to size re-distribution can be modeled by introducing varied particle size groups to represent a nearly continuous particle size distribution.
In the literature, there are a number of models of catalyst degradation describing various individual mechanisms; see the overview by Jahnke et al. [27]. The coupling of different degradation processes is crucial for understanding the fuel cell behavior in whole. Darling and Meyer [28] were the first who developed kinetic rate equations for the description of electrochemical mechanisms of Pt dissolution and Pt oxide film formation. Then, oxide chemical dissolution was canceled by Holby and Morgan [29] since it was negligible compared to the two others. The authors used a Butler–Volmer equation accounting for the Gibbs–Thomson energy and the coupled mechanisms of Ostwald ripening, together with the Pt band formation in the membrane. Later Holby et al. [30] and Li et al. [31] refined the catalyst modeling with PSD of many finite sizes. The simulation of PSD was in good qualitative agreement with the experimental data. The Holby–Morgan model was investigated with respect to various industrial protocols of the cyclic voltammetry (CV) of square-waves (SWs) and triangle-waves (TWs) in Kovtunenko and Karpenko-Jereb [32]. Further, we employed the EU harmonized Fuel Cell and Hydrogen Joint Undertaking (FCH JU2) non-symmetric SW. Local sensitivity analysis for lifetime prognosis of the catalyst after accelerated stress test (AST) was utilized in Kovtunenko and Karpenko-Jereb [33], and feasible domains for operating conditions and model parameters of Pt/C electrocatalysts in PEMFCs were derived in Karpenko-Jereb and Kovtunenko [34] and Kovtunenko [35,36,37].
In the present paper, we analyze the impact of AST on electrochemical degradation in the Holby–Morgan model with respect to changes in amplitude and dispersion of the initial PSD. For computer simulation, a continuous normal distribution of Pt particle diameters is approximated by finite size groups. Without ion diffusion, theoretically we obtain the fist integral of the system reducing the number of equations to solve. Numerically, we justify both mechanisms: the shrinking of small Pt particles through Pt dissolution, as well as the growing of large particles by Pt ion deposition. The change in particle diameter distribution in catalysts is accompanied by loss in electrochemical surface area (ECSA) and Pt mass.

2. Materials and Methods

Let us consider the normal distribution of platinum particle diameter d > 0 , which is determined by two parameters of expectation d ˜ > 0 (which coincide with the mean) and standard deviation σ > 0 . The probability density function:
ϕ ( d ) = 1 σ 2 π e ( d d ˜ ) 2 / ( 2 σ 2 )
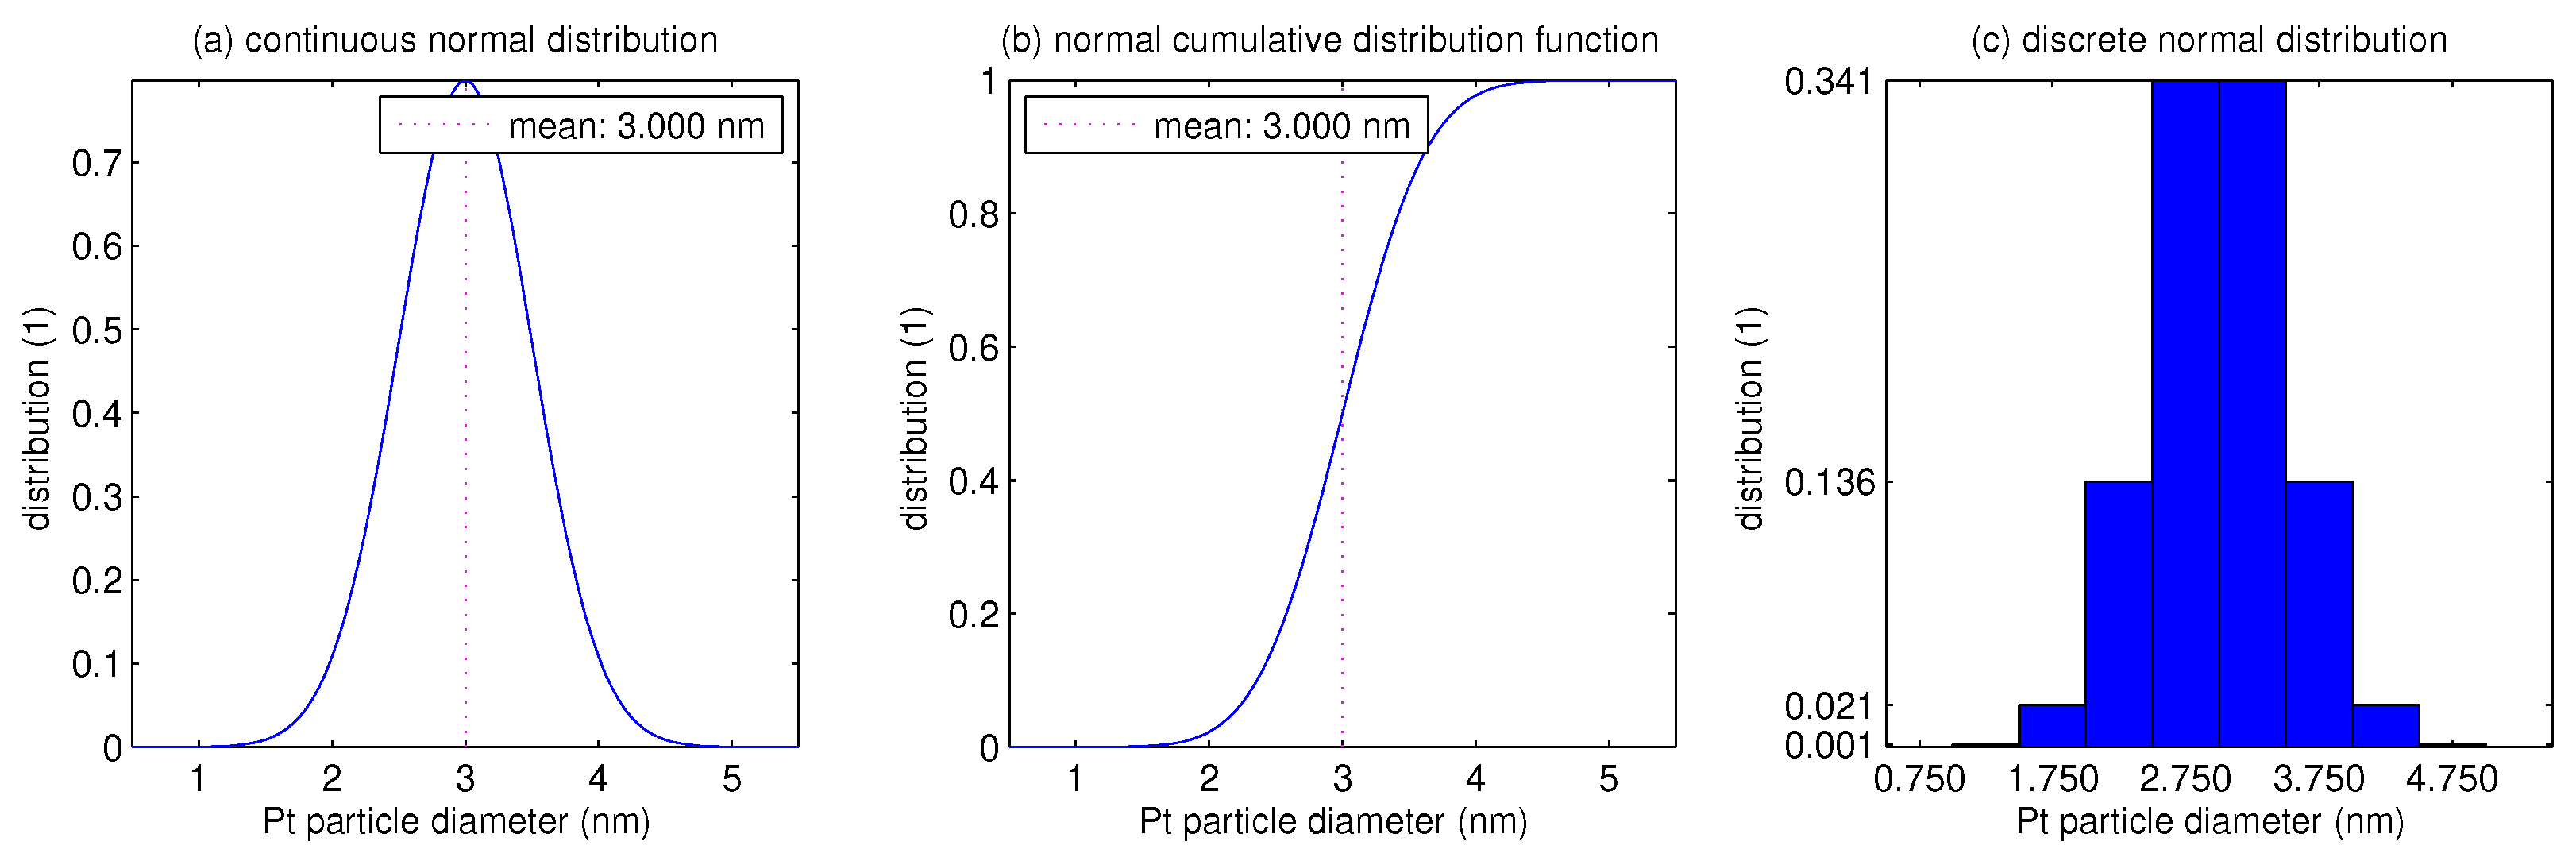
is depicted in the range d ( 1.5 , 5.5 ) (nm) for d ˜ = 3 and σ = 0.5 in Figure 2a. In Figure 2b, the cumulative distribution function corresponding to (1) is drawn:
Φ ( d ) = 1 2 π d e s 2 / 2 d s .
Splitting the interval of particle diameters into sub-intervals between finite number P > 0 of equidistant points d i = d i 1 + σ which are symmetric with respect to the mean d ˜ :
d 1 = d ˜ σ ( P 1 ) / 2 , , d P = d 1 + σ ( P 1 ) = d ˜ + σ ( P 1 ) / 2 ,
we partition 1 = ϕ 1 + + ϕ P by finite particle size groups ϕ 1 , , ϕ P with piecewise-constant probabilities which are defined according to (2) and (3) as follows:
ϕ 1 = Φ ( d 1 ) for d < d 1 , ϕ P = 1 Φ ( d P 1 ) for d P 1 d , ϕ i = Φ ( d i ) Φ ( d i 1 ) for d i 1 d < d i , i = 2 , , P 1 .
The probability of eight particle size groups from (4) for d ˜ = 3 and σ = 0.5 are drawn with bars in Figure 2c and gathered in Table 1. Values ϕ i imply the probability of diameters lying within sub-intervals [ 0 , d 1 + σ / 2 ) , [ d i σ / 2 , d i + σ / 2 ) for i = 2 , , 7 , and [ d 8 σ / 2 , ) such that their sum equals the one. In computer simulation, we vary parameters d ˜ and σ , which satisfies the weight distribution ϕ 1 , , ϕ 8 from Table 1.
We start with a non-diffusive Holby–Morgan model in time t [ 0 , t EoL ) for some end of life (EoL) t EoL > 0 (s). Let a potential difference V (V) vary according to the FCH JU2 non-symmetric SW protocol of AST given by the piecewise-constant periodic function:
V ( t ) = 0.6 for t ( k 1 ) τ + ( 0 , 10 ) 0.9 for t ( k 1 ) τ + ( 10 , 40 ) , k = 1 , , # k ,
where # k = t EoL / τ stands for the number of cycles with period τ = 40 (s). Introduce the space variable x [ 0 , L ] along the CL thickness L = 10 (µm). We look for the Pt ion concentration c (mol/ cm 3 ) taken within the distribution of the Pt particle diameters d i (nm) weighted by ϕ i and the ratios of Pt oxide coverage θ i (1) such that
c ( t ) > 0 , d 1 ( t ) , , d P ( t ) > 0 , θ 1 ( t ) , , θ P ( t ) ( 0 , 1 ) ,
which solves the coupled system of nonlinear differential ( 2 P + 1 ) -equations:
ε d c d t = π N Pt 2 V Pt i = 1 P ϕ i d i 2 r dissol ( c , d i , θ i ) ,
d ( d i ) d t = Ω r dissol ( c , d i , θ i ) , i = 1 , , P ,
d d t ln ( θ i d i 2 ) = 1 Γ θ i r oxide ( θ i ) , i = 1 , , P .
The Butler–Volmer equations describe the reaction rate for Pt ion dissolution (mol/( cm 2 s)):
r dissol ( c , d i , θ i ) = Γ ( 1 θ i ) ( ν 1 exp H 1 , fit + ( 1 β 1 ) H 1 ( d i , θ i ) R T ν 2 c c ref exp H 1 , fit + β 1 H 1 ( d i , θ i ) R T ) ,
where F is the Faraday constant and R is the gas constant; the molar enthalpy difference for dissolution (J/mol) is defined by
H 1 ( d i , θ i ) = n F ( U eq V ) 4 Ω d i γ 0 ( θ i ) Γ n 2 F θ i V ,
and the surface tension difference (J/ cm 2 ) is
γ 0 ( θ i ) = γ + Γ R T θ i ( ln ν 2 ν 1 10 2 p H + 2 n 2 F U fit + ω θ i 2 R T + ln θ i 2 + 2 θ i θ i ln 1 θ i 2 ) ;
and the reaction rate for the Pt oxide coverage (mol/( cm 2 s)) is:
r oxide ( θ i ) = Γ ( ν 1 1 θ i 2 exp H 2 , fit + λ θ i + ( 1 β 2 ) H 2 ( θ i ) R T ν 2 10 2 p H exp H 2 , fit λ θ i + β 2 H 2 ( θ i ) R T ) ,
where the molar enthalpy difference for oxidation (J/mol) is:
H 2 ( θ i ) = n 2 F ( U fit V ) + ω θ i .
The first-order differential Equations (6)–(8) are endowed with the initial conditions:
c ( 0 ) = 0 , d i ( 0 ) = d i 0 , θ i ( 0 ) = 0 ,
where an initial PSD d 1 0 , , d P 0 > 0 is prescribed at t = 0 .
After multiplication of (6) by Ω and (7) by π N Pt / ( 2 V Pt ) ϕ i d i 2 , using summation of the result over i = 1 , , P we cancel the right-hand side and arrive at the homogeneous ordinary differential equation (ODE):
d d t Ω ε c + π N Pt 6 V Pt i = 1 P ϕ i d i 3 = 0 for t ( 0 , t EoL ) .
The solution of (10) using initial values from (9) implies the first integral of the system:
Ω ε c = π N Pt 6 V Pt i = 1 P ϕ i ( d i 0 ) 3 d i 3 .
Inserting c from (11) into (7), the ODE system is reduced to 2 P -equations for unknown variables d 1 ( t ) , , d P ( t ) and θ 1 ( t ) , , θ P ( t ) .
The Pt nanoparticles are assumed to be hemispheric with the volume V Pt = π d Pt 3 / 6 and the particle number N Pt = p Pt / ( L ρ Pt ) , where Pt particle density ρ Pt = 21.45 (g/ cm 3 ) and Pt particle loading p Pt = 4 × 10 4 (g/ cm 2 ). The reference Pt particle diameter d Pt (cm) is varied with the expectation d ˜ . In Table 2, we assemble the material and fitting parameters for Pt ion formation and diffusion and for Pt oxide formation which are employed in the Holby–Morgan model. The potential of hydrogen p H = 0 and Pt/C volume fraction ε = 0.02 are set. The reference parameters for catalyst are taken from the literature [28,29,30,31]. In the previous works [34,36,37], we considered the influence of model parameters and cycling operating conditions on the simulation result. For instance, Pt dissolution was raised much with either an increase in the temperature or Pt/C volume fraction or with a decrease in pH, whereas the impact of Pt particle loading was less essential. Bridging the gap between modeling and the real test of commercial electrocatalysts is discussed in Cherevko [38].
For numerical solution of the Cauchy problem (6)–(9), we develop a variable time-step approach based on the Runge–Kutta–Fehlberg method (RKF45). The basic coarse time step Δ t = 10 2 (s) is refined locally to 10 4 (s) within the ( Δ t , Δ t ) -neighborhood of points t = ( k 1 ) τ + 10 , k = 1 , 2 , , # k , where the potential V in (4) has lift-off. It takes 4037 time steps within each cycle to solve for ( 2 P + 1 ) -unknowns. Readers can find the details in refs. [33,34].

3. Results

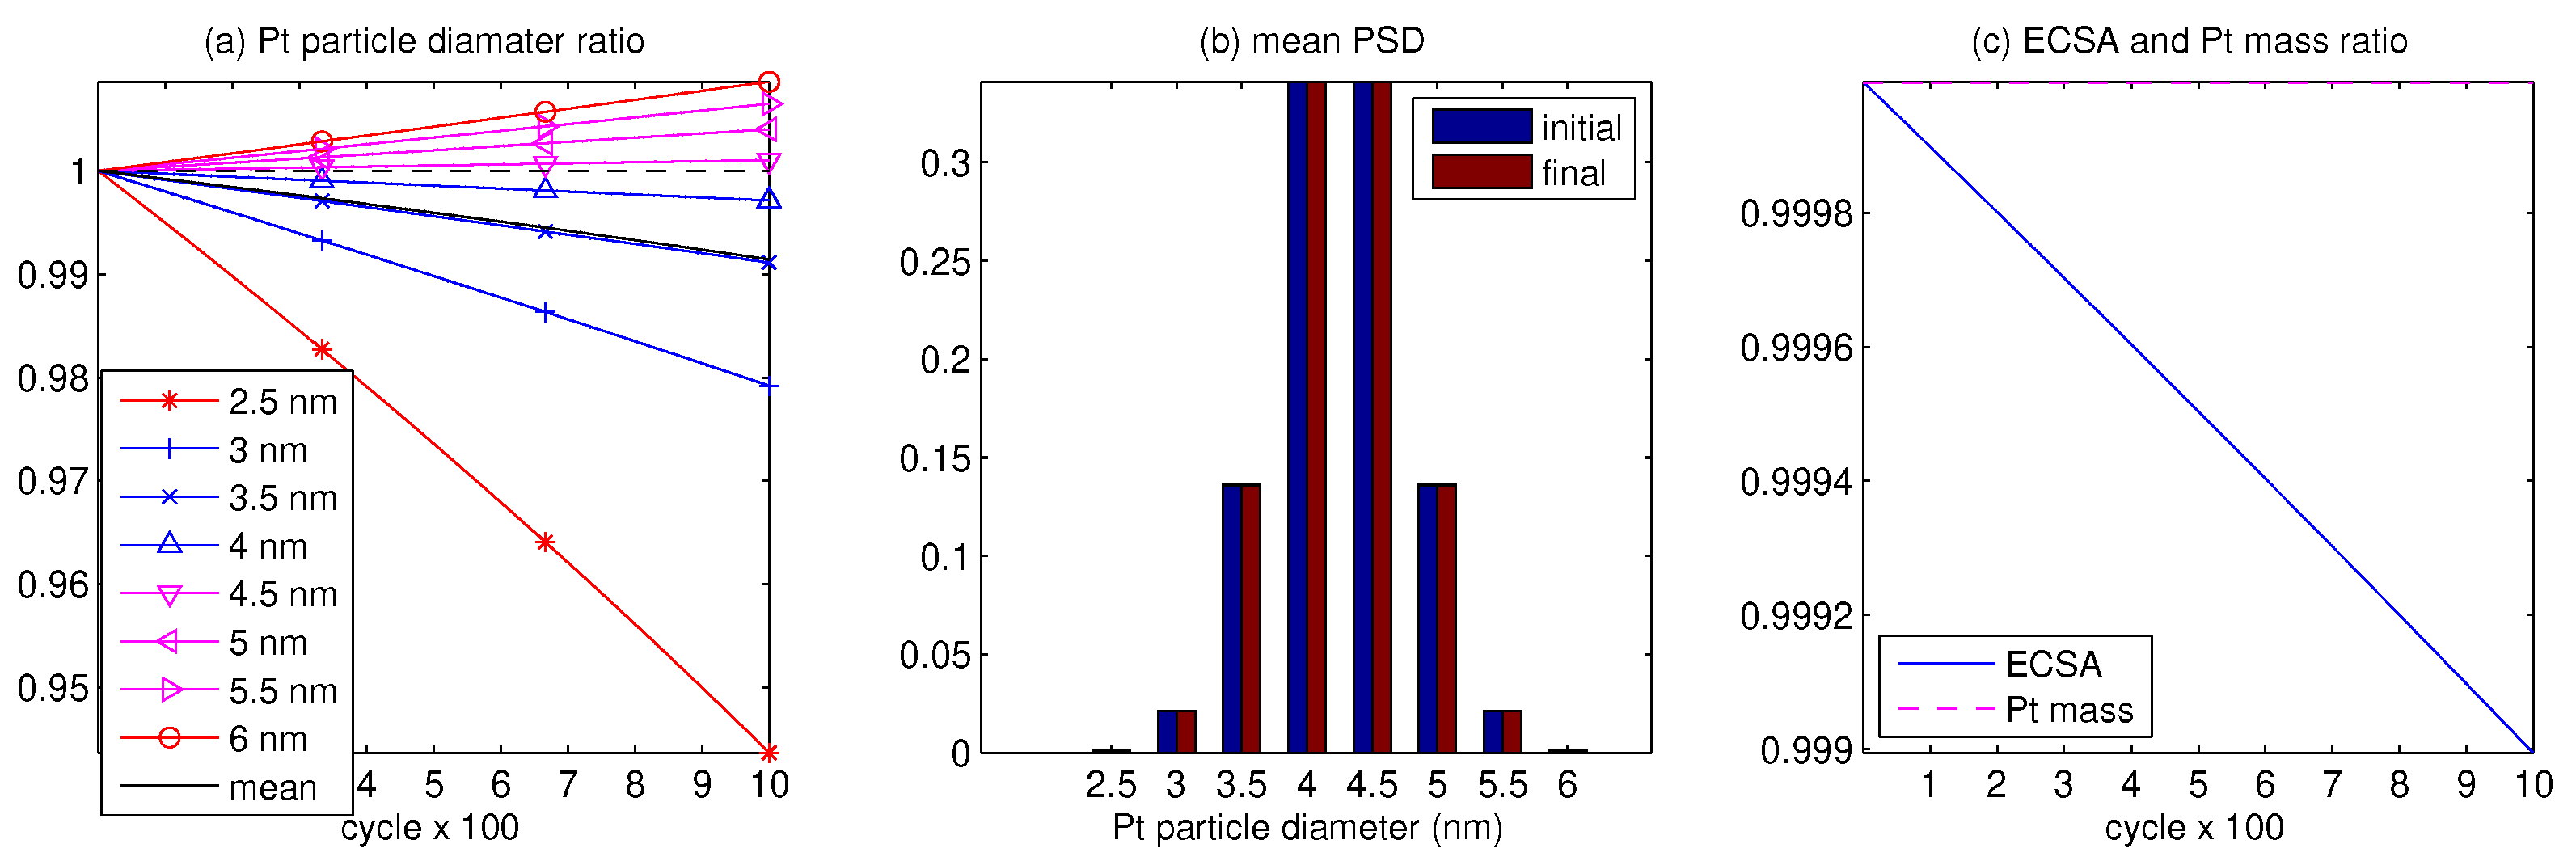
Let P = 8 with normal probabilities ϕ 1 , , ϕ 8 and the initial distribution d 1 0 , , d 8 0 taken from Table 1 for [ d ˜ = 3 , σ = 0.5 ] (nm). We present the corresponding numerical solution of (6)–(9). In Figure 3a the time-evolution of Pt particle diameter ratios d 1 / d 1 0 , , d 8 / d 8 0 are depicted starting from the one at t = 0 during # k = 1000 potential cycles (5) corresponding to CV time t EoL = 11 . 1 ¯ (h). Each solid line describes the dynamics of the individual size group within the PSD. The small particles less than 4.5 (nm) are reduced by platinum dissolution, whereas the larger particles grow by Pt ion deposition. By this, the initial PSD is not changing during potential cycling without ion diffusion, as we can observe in the center bar-plot Figure 3b. In Figure 3c, the ECSA ratio with respect to the reference active area is depicted with solid lines:
E ( t ) = ϕ 1 d 1 ( t ) d 1 0 2 + + ϕ P d P ( t ) d P 0 2 , E ( 0 ) = 1 ,
and the weighted relative Pt mass ratio with respect to the reference one:
m Pt ( t ) = ϕ 1 d 1 ( t ) d 1 0 3 + + ϕ P d P ( t ) d P 0 3 , m Pt ( 0 ) = 1 .
Both quantities E and m Pt decrease by AST cycling, thus justifying degradation of the platinum catalyst.
Now we take into account the diffusion of Pt ion particles and for x [ 0 , L ] , we look for the space-dependent variables:
c ( t , x ) > 0 , d 1 ( t , x ) , , d P ( t , x ) > 0 , θ 1 ( t , x ) , , θ P ( t , x ) ( 0 , 1 )
satisfying instead of ODE (6) the nonlinear diffusion equation:
ε c t ε 3 / 2 D Pt 2 c x 2 = π N Pt 2 V Pt i = 1 P ϕ i d i 2 r dissol ( c , d i , θ i )
endowed with mixed boundary conditions:
c x ( t , 0 ) = 0 , c ( t , L ) = 0 for t ( 0 , t EoL ) ,
which imply no flux at the CL left end x = 0 where the catalyst layer matches the GDL, and perfectly absorbs the boundary with the PEM at the CL right end x = L . For numerical solution of the partial differential equation (PDE) (12) with boundary conditions (13), we apply the implicit–explicit scheme IMEX2 from [33,34]. On the uniform mesh size Δ x = 1 (µm), the algebraic equation after discretization has 11 ( 2 P + 1 ) degrees of freedom (DOFs) at each time. This results in 754919 DOFs at each cycle for P = 8 .
Accounting for diffusion, we present the numerical solution of the Holby–Morgan model (7), (8), (12) under initial (9) and boundary (13) conditions for the initial distribution [ d ˜ = 2.65 , σ = 0.002 ] (nm) during 6 . 6 ¯ (min) CV time. In Figure 4a, the platinum ion concentration c ( t , x ) (mol/ cm 3 ) is depicted versus # k = 10 voltage cycles across the catalyst thickness x ( 0 , 10 ) (µm). It builds the surface which behaves periodically by cycling. To observe changes in PSD at the CL end points, in two bar plots in Figure 4, we show evolution with respect to the cycles of probability of the eight particle size groups at x = 0 , 10 . There is no change of the initial partial size distribution on the GDL-CL interface x = 0 (b), whereas PSD changes at the 10th cycle on the CL-PEM interface x = 10 (c).
The other components of the solution depicted in Figure 4a are shown in Figure 5 and Figure 6 below. In the eight plots of Figure 5, the surfaces corresponding Pt particle size groups d 1 , , d 8 are presented, where the diameters are depicted in the same range across the catalyst thickness 10 (µm) for 10 potential cycles. We can observe that the Pt ion diffusion is non-uniform, decreasing at the membrane interface and increasing when approaching the interface with the gas diffusion layer, which is confirmed by the result of Figure 4b,c. From Figure 5, we see small fluctuations by cycling and conclude that Pt particles of small size decrease more strongly than large particles.
In the eight plots of Figure 6, the ratio groups of Pt oxide coverage θ 1 , , θ 8 are depicted in the same coordinates. The groups behave rather similarly: the Pt surface changes periodically with respect to cycles with the large amplitude from almost 0 to about 1 across the whole catalyst thickness. In every cycle, the platinum oxide is formed at the high potential, and the reverse reaction reduces PtO to platinum at the low potential.
Further, we consider the average over CL values in dependence on time:
d 1 ( t ) = mean x [ 0 , L ] d 1 ( t , x ) , , d P ( t ) = mean x [ 0 , L ] d P ( t , x ) .
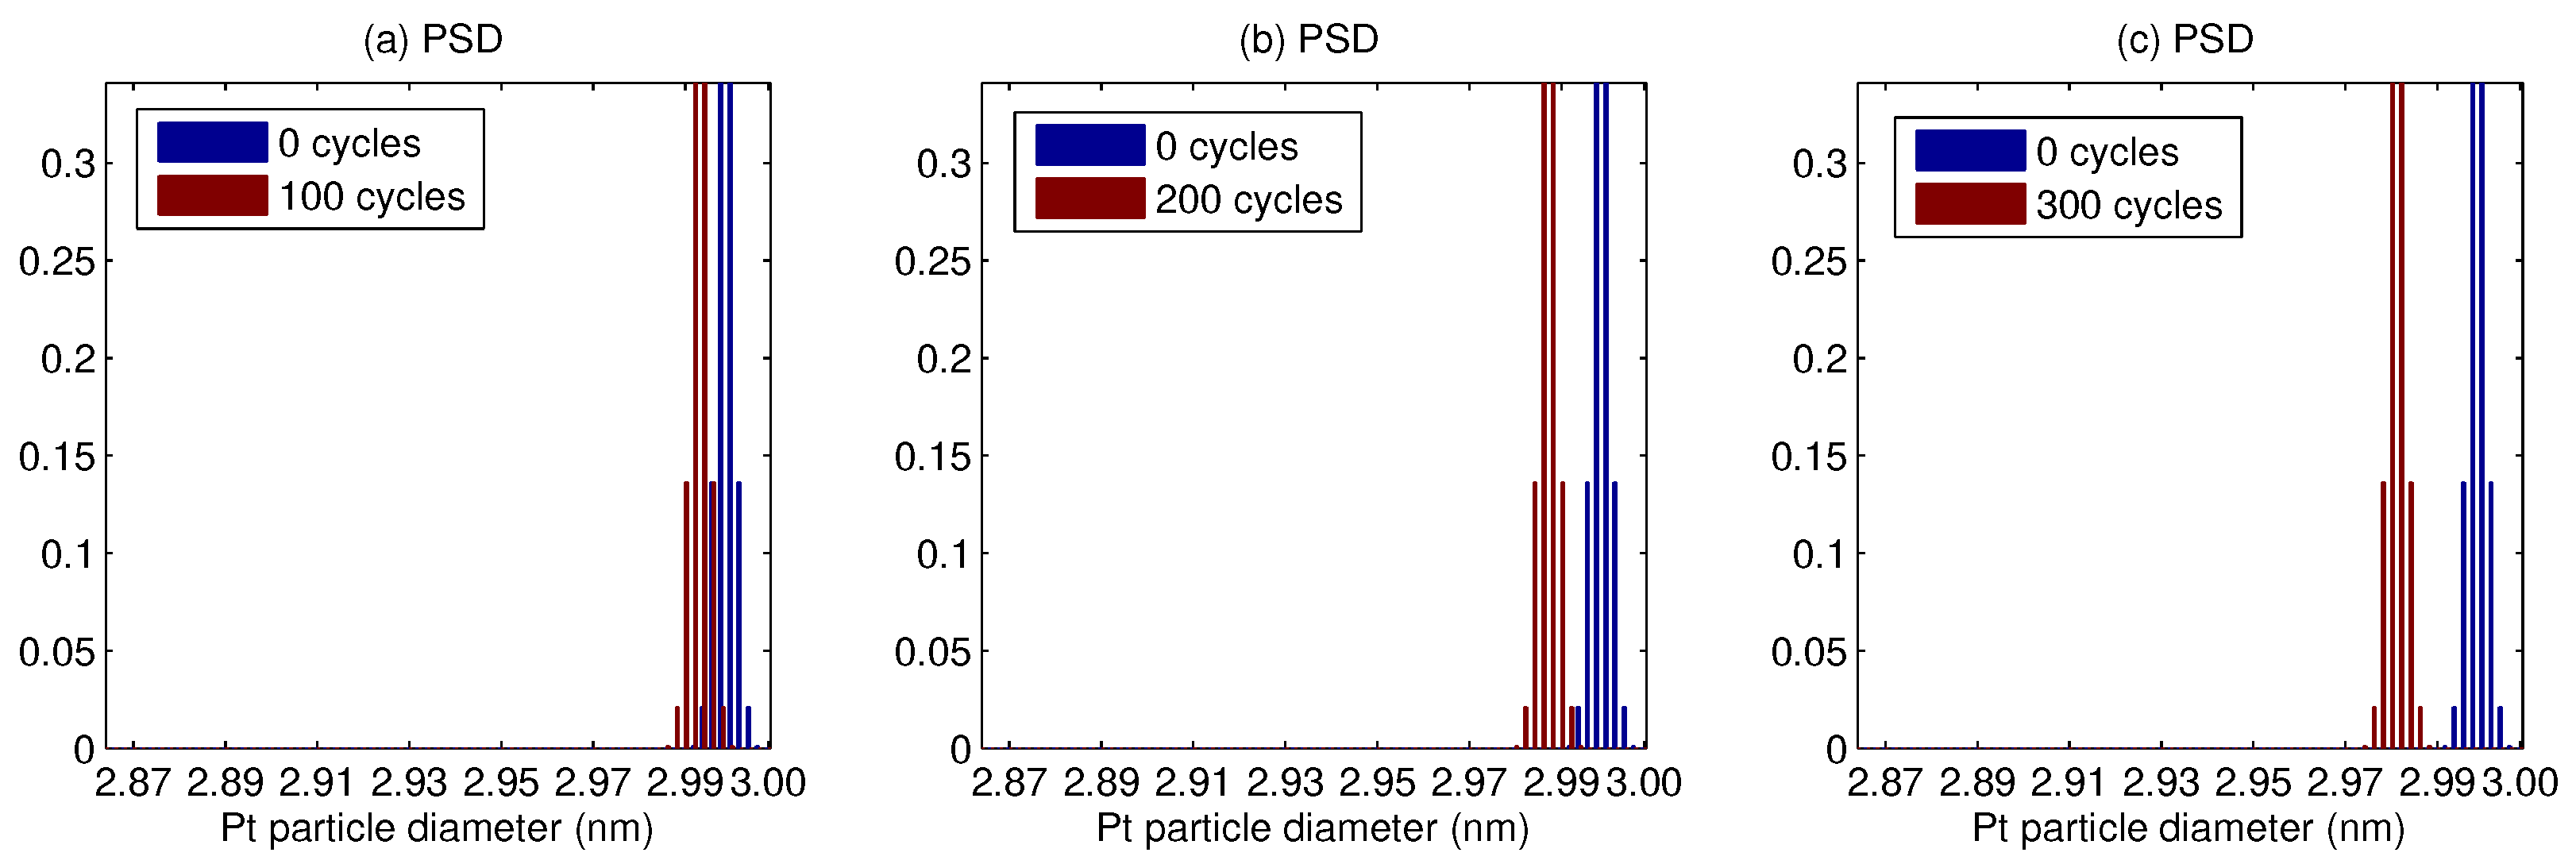
In the following Figure 7, Figure 8, Figure 9 and Figure 10, we aim to discover which changes may happen in the normal PSD with respect to its shift, dispersion, and amplitude under the periodic cycling when varying the Pt particle sizes. The average by (14) initial PSD is compared with PSD when computed after # k = 100 , 200, and 300 cycles for the time 3 . 3 ¯ (h). With this, the expectation is varied in the range of d ˜ = 2–6 (nm) for the standard deviation σ = 0.002 (nm) fixed. In Figure 7a–c the respective average PSD is drawn with bar plots for d ˜ = 2 (nm). We conclude with permanent movement to the left of the initial PSD, implying reduction in all Pt particle sizes. For # k = 300 cycles the movement is over 0.123 (nm), and the initial size groups disperse from the initial range 0.016 (nm) to 0.022 (nm).
The change in the average Pt particle diameters for d ˜ = 3 (nm) is presented in the previous window width of 0.14 (nm). In Figure 8a–c, for larger means, we clearly observe slowing of the PSD movement over 0.019 (nm) for # k = 300 cycles, and the initial distribution does not disperse during the reported period of time.
In Figure 9a–c the average PSD for the distribution mean d ˜ = 4 (nm) is depicted in window of the width 0.02 (nm). Here PSD movement to the left is over 0.007 (nm) for # k = 300 cycles. In the opposite of spreading, the initial distribution narrows from 0.016 (nm) to 0.015 (nm). Moreover, we observe the change of distribution amplitude after # k = 200 cycles: the two size groups with probabilities ϕ 3 and ϕ 4 are unified together in one size group of the probability 0.4772 which then moves to the left.
Finally, for the large Pt particle mean size d ˜ = 5 (nm) time-evolution of PSD is shown in Figure 10a–c of the same window width as before. For # k = 300 potential cycles, the initial PSD moves to the left over 0.005 (nm) and narrows to 0.0155 (nm). At # k = 200 cycles, two size groups with probabilities ϕ 2 and ϕ 3 unify in the larger size group with the higher probability 0.1573 and then split again. Similar findings can be reported for d ˜ = 6 (nm). Indeed, larger Pt nanoparticles have larger surface areas and therefore are more stable against agglomeration compared to the smaller particles by the Gibbs–Thompson effect.

4. Discussion

Mathematical modeling supported by computer simulation is very helpful for better understanding mechanisms of electrochemical degradation which cause aging of PEMFCs. However, precise theoretical models can be realized only with computationally expensive algorithms that require a large number of time steps to be computed. With the demand for low computational costs, data-driven models (DDMs) are often used in systems analysis and generally do not reach beyond the trained set of parameters. In contrary, determining optimal design of calibration parameters enables us to reduce efforts for parameterizing the electrochemical FC models used in observer applications. Applying the design of experiments (DOE) approach, Kravos et al. [39] suggested a reduced quasi-1D electrochemical model that was appropriate for numerical computation and consistent from the point of view of thermodynamics. Vrlić et al. [40] measured the power demand from real fuel cell vehicles built by AVL List GmbH. Using the concept of model predictive control (MPC), the authors proposed a nonlinear mass-driven 0-D transient fuel cell model with the control goal to track the power demand. The model was described by the system of first-order differential equations linearized around a steady-state in the context of MPC.
To increase the performance and lifetime of a fuel cell stack, suitable control and mitigation strategies are of crucial importance for sustainable technology solutions. The Pt degradation mechanisms by AST were examined by Bi and Fuller [41] using a bi-modal catalyst consisting of two distinguishable size populations of 1.5 nm small and 1.75 nm large particles in catalyst. By simulation without ion diffusion, small particles shrank through Pt dissolution, and large particles grew with a net gain by Pt ion deposition during voltage cycling. In Schröder et al. [42], a bi-modal distribution was performed to treat the depth-dependent degradation mechanism of electrochemical Ostwald ripening. The larger population increased more in particle size at the expense of the smaller population, where re-deposition was absent. These results justify that not all degradation necessarily leads to shrinkage or growth in each of their own-size populations. Kregar and Katrašnik [43] established the Lifshitz–Slyozov–Wagner equations of coarsening to perform Pt particle re-distribution in fuel cells by the classical Ostwald ripening that is driven by diffusion. Kregar et al. [44] obtained linear growth of particles in the case of particle agglomeration compared to the root function in the case of Ostwald ripening.

5. Conclusions

We have simulated the Holby–Morgan electrochemical degradation model of the aging of platinum on carbon catalyst in PEMFCs. We tested the normal probability distribution determined by two parameters of the expectation and the standard deviation, which was approximated by discrete groups of finite size. From simulation, we report the following changes in amplitude and dispersion of the initial PSD by cyclic voltammetry. Without diffusion, platinum nanoparticle size decreases for small particles and increases for Pt particles larger than 4.5 nm due to re-deposition in CL. Pt ion diffusion is close to constant near the GDL and drops when reaching the PEM. The probability of each size group either increases or decreases, and the PSD disperses toward small and narrows toward large particles. Pt particle sizes are reduced under AST and cause loss in ECSA and relative platinum mass, which is less for large Pt particle diameters since the latter are more stable thermodynamically.

Funding

This research received no external funding.

Institutional Review Board Statement

Not applicable.

Informed Consent Statement

Not applicable.

Data Availability Statement

The raw data supporting the conclusions of this article will be made available by the author on request.

Conflicts of Interest

The author declares no conflicts of interest.

Abbreviations

The following abbreviations are used in this manuscript:
ASTaccelerated stress test
BoL/EoLbeginning/end of life
CNTcarbon nanotube
CCMcatalyst-coated membrane
CLcatalyst layer
CVcyclic voltammetry
DDMdata-driven model
DOFdegree of freedom
DOEdesign of experiments
ECSAelectrochemical surface area
FCfuel cell
FCH JU2fuel cell and hydrogen joint undertaking
GDLgas diffusion layer
HORhydrogen oxidation reaction
LPL/UPLlower/upper potential level
MEAmembrane electrode assembly
MPCmodel predictive control
ODEordinary differential equation
ORRoxygen reduction reaction
PDEpartial differential equation
PSDparticle size distribution
Pt/Cplatinum on carbon
Pt/PtOplatinum/platinum oxide
PEMFCpolymer electrolyte fuel cell
PEMpolymer electrolyte membrane/proton exchange membrane
pHpotential of hydrogen
SW/TWsquare/triangle wave
TEMtransmission electron microscopy

References

  1. Ball, M.; Basile, A.; Veziroǧlu, T.N. Compendium of Hydrogen Energy: Hydrogen Use, Safety and the Hydrogen Economy; Woodhead Publishing: Sawston, UK, 2016. [Google Scholar]
  2. Barbir, F. PEM Fuel Cells: Theory and Practice; Elsevier: Amsterdam, The Netherlands, 2013. [Google Scholar]
  3. Hacker, V.; Mitsushima, S. (Eds.) Fuel Cells and Hydrogen: From Fundamentals to Applied Research; Elsevier: Amsterdam, The Netherlands, 2018. [Google Scholar]
  4. Eikerling, M.; Kulikovsky, A. Polymer Electrolyte Fuel Cells: Physical Principles of Materials and Operation; Elsevier: Amsterdam, The Netherlands, 2017. [Google Scholar]
  5. Kulikovsky, A. Analytical Modeling of Fuel Cells; Elsevier: Amsterdam, The Netherlands, 2019. [Google Scholar]
  6. Basile, A.; Lipnizki, F.; Rahimpour, M.R.; Piemonte, V. (Eds.) Current Trends and Future Developments on (Bio-) Membranes: Advances on Membrane Engineering; Elsevier: Amsterdam, The Netherlands, 2024. [Google Scholar]
  7. Guerrero-Rodríguez, N.F.; De La Rosa-Leonardo, D.A.; Tapia-Marte, R.; Ramírez-Rivera, F.A.; Faxas-Guzmán, J.; Rey-Boué, A.B.; Reyes-Archundia, E. An overview of the efficiency and long-term viability of powered hydrogen production. Sustainability 2024, 16, 5569. [Google Scholar] [CrossRef]
  8. Gohar, O.; Khan, M.Z.; Saleem, M.; Chun, O.; Babar, Z.U.D.; Rehman, M.M.U.; Hussain, A.; Zheng, K.; Koh, J.-H.; Ghaffar, A.; et al. Navigating the future of solid oxide fuel cell: Comprehensive insights into fuel electrode related degradation mechanisms and mitigation strategies. Adv. Colloid Interface Sci. 2024, 331, 103241. [Google Scholar] [CrossRef]
  9. Padgett, E.; Yarlagadda, V.; Holtz, M.E.; Ko, M.; Levin, B.D.A.; Kukreja, R.S.; Ziegelbauer, J.M.; Andrews, R.N.; Ilavsky, J.; Kongkanand, A.; et al. Mitigation of PEM fuel cell catalyst degradation with porous carbon supports. J. Electrochem. Soc. 2019, 166, F198–F207. [Google Scholar] [CrossRef]
  10. Ding, Y.; Luo, X.; Chang, L.; Dong, C. Response characteristics of platinum coated titanium bipolar plates for proton exchange membrane water electrolysis under fluctuating conditions. Electrochem. Commun. 2024, 168, 107819. [Google Scholar] [CrossRef]
  11. Tian, H.; Wang, X.; Ge, J.; Wan, H.; Ma, W.; Xie, G.; Ge, J. Pt-based intermetallic compound catalysts for the oxygen reduction reaction: From problems to recent developments. J. Energy Chem. 2024, 99, 302–324. [Google Scholar] [CrossRef]
  12. Jithul, K.P.; Tamilarasi, B.; Pandey, J. Electrocatalyst for the oxygen reduction reaction (ORR): Towards an active and stable electrocatalyst for low-temperature PEM fuel cell. Ionics 2024. [Google Scholar] [CrossRef]
  13. Fuhrmann, J. A numerical strategy for Nernst–Planck systems with solvation effect. Fuel Cells 2016, 16, 704–714. [Google Scholar] [CrossRef]
  14. Fellner, K.; Kovtunenko, V.A. A singularly perturbed nonlinear Poisson–Boltzmann equation: Uniform and super-asymptotic expansions. Math. Meth. Appl. Sci. 2015, 38, 3575–3586. [Google Scholar] [CrossRef]
  15. González-Granada, J.R.; Kovtunenko, V.A. Entropy method for generalized Poisson–Nernst–Planck equations. Anal. Math. Phys. 2018, 8, 603–619. [Google Scholar] [CrossRef]
  16. Kovtunenko, V.A.; Zubkova, A.V. Mathematical modeling of a discontinuous solution of the generalized Poisson–Nernst–Planck problem in a two-phase medium. Kinet. Relat. Mod. 2018, 11, 119–135. [Google Scholar] [CrossRef]
  17. Alekseev, G.V.; Spivak, Y.E. Stability estimates of optimal solutions for the steady magnetohydrodynamics-Boussinesq equations. Mathematics 2024, 12, 1912. [Google Scholar] [CrossRef]
  18. González-Durán, J.E.E.; Olivares-Ramírez, J.M.; Luján-Vega, M.A.; Soto-Osornio, J.E.; García-Guendulain, J.M.; Rodriguez-Resendiz, J. Experimental and numerical analysis of a novel cycloid-type rotor versus S-type rotor for vertical-axis wind turbine. Technologies 2024, 12, 54. [Google Scholar] [CrossRef]
  19. Khludnev, A.M.; Kovtunenko, V.A. Analysis of Cracks in Solids; WIT-Press: Southampton, UK, 2000. [Google Scholar]
  20. Efendiev, M. Evolution Equations Arising in the Modelling of Life Sciences; Springer: Basel, Switzerland, 2013. [Google Scholar]
  21. Khajavian, M.; Haseli, A. Modeling the adsorption of ibuprofen on the Zn-decorated S,P,B co-doped C2N nanosheet: Machine learning and central composite design approaches. J. Ind. Eng. Chem. 2024, 137, 583–592. [Google Scholar]
  22. Khatun, M.; Litagin, H.; Jung, R.; Glaß, M. Safe scenario boundaries determination by parameter variation for an automated driving system. In Proceedings of the IEEE 11th Conference on Systems, Process & Control (ICSPC), Malacca, Malaysia, 16 December 2023; pp. 22–27. [Google Scholar]
  23. Sevjidsuren, G.; Zils, S.; Kaserer, S.; Wolz, A.; Ettingshausen, F.; Dixon, D.; Schoekel, A.; Roth, C.; Altantsog, P.; Sangaa, D.; et al. Effect of different support morphologies and Pt particle sizes in electrocatalysts for fuel cell applications. J. Nanomater. 2010, 2010, 852786. [Google Scholar] [CrossRef]
  24. Ostwald, W. Lehrbruck der Allgemeinen Chemie; W. Engelmann: Leipzig, Germany, 1896. [Google Scholar]
  25. Mensharapov, R.M.; Ivanova, N.A.; Zasypkina, A.A.; Spasov, D.D.; Sinyakov, M.V.; Grigoriev, S.A.; Fateev, V.N. Model study of CNT-based PEMFCs’ electrocatalytic layers. Catalysts 2022, 12, 1227. [Google Scholar] [CrossRef]
  26. Sakurai, S.; Nishino, H.; Futaba, D.N.; Yasuda, S.; Yamada, T.; Maigne, A.; Matsuo, Y.; Nakamura, E.; Yumura, M.; Hata, K. Role of subsurface diffusion and Ostwald ripening in catalyst formation for single-walled carbon nanotube forest growth. J. Am. Chem. Soc. 2012, 134, 2148–2153. [Google Scholar]
  27. Jahnke, T.; Futter, G.; Latz, A.; Malkow, T.; Papakonstantinou, G.; Tsotridis, G.; Schott, P.; Gérard, M.; Quinaud, M.; Quiroga, M.; et al. Performance and degradation of Proton Exchange Membrane Fuel Cells: State of the art in modeling from atomistic to system scale. J. Power Sources 2016, 304, 207–233. [Google Scholar] [CrossRef]
  28. Darling, R.M.; Meyers, J.P. Kinetic model of platinum dissolution in PEMFCs. J. Electrochem. Soc. 2003, 150, A1523–A1527. [Google Scholar] [CrossRef]
  29. Holby, E.F.; Morgan, D. Application of Pt nanoparticle dissolution and oxidation modeling to understanding degradation in PEM fuel cells. J. Electrochem. Soc. 2012, 159, B578–B591. [Google Scholar] [CrossRef]
  30. Holby, E.F.; Sheng, W.; Shao-Horn, Y.; Morgan, D. Pt nanoparticle stability in PEM fuel cells: Influence of particle size distribution and crossover hydrogen. Energy Environ. Sci. 2009, 2, 865–871. [Google Scholar] [CrossRef]
  31. Li, Y.; Moriyama, K.; Gu, W.; Arisetty, S.; Wang, C.Y. A one-dimensional Pt degradation model for polymer electrolyte fuel cells. J. Electrochem. Soc. 2015, 162, F834–F842. [Google Scholar] [CrossRef]
  32. Kovtunenko, V.A.; Karpenko-Jereb, L. Study of voltage cycling conditions on Pt oxidation and dissolution in polymer electrolyte fuel cells. J. Power Sources 2021, 493, 229693. [Google Scholar] [CrossRef]
  33. Kovtunenko, V.A.; Karpenko-Jereb, L. Lifetime of catalyst under voltage cycling in polymer electrolyte fuel cell due to platinum oxidation and dissolution. Technologies 2021, 9, 80. [Google Scholar] [CrossRef]
  34. Karpenko-Jereb, L.; Kovtunenko, V.A. Modeling of the impact of cycling operating conditions on durability of polymer electrolyte fuel cells and its sensitivity analysis. Int. J. Hydrog. Energy 2023, 48, 15646–15656. [Google Scholar] [CrossRef]
  35. Kovtunenko, V.A. Variance-based sensitivity analysis of fitting parameters to impact on cycling durability of polymer electrolyte fuel cells. Technologies 2022, 9, 111. [Google Scholar] [CrossRef]
  36. Kovtunenko, V.A. The Holby–Morgan model of platinum catalyst degradation in PEM fuel cells: Range of feasible parameters achieved using voltage cycling. Technologies 2023, 11, 184. [Google Scholar] [CrossRef]
  37. Kovtunenko, V.A. Feasible domain of cycling operating conditions and model parameters for Holby–Morgan model of platinum catalyst degradation in PEMFC. Int. J. Hydrog. Energy 2024, 51C, 1518–1526. [Google Scholar] [CrossRef]
  38. Cherevko, S. Stability and dissolution of electrocatalysts: Building the bridge between model and “real world” systems. Curr. Opin. Electrochem. 2018, 8, 118–125. [Google Scholar] [CrossRef]
  39. Kravos, A.; Ritzberger, D.; Tavčar, G.; Hametner, C.; Jakubek, S.; Katrašnik, T. Thermodynamically consistent reduced dimensionality electrochemical model for proton exchange membrane fuel cell performance modelling and control. J. Power Sources 2020, 454, 227930. [Google Scholar] [CrossRef]
  40. Vrlić, M.; Ritzberger, D.; Jakubek, S. Safe and efficient polymer electrolyte membrane fuel cell control using successive linearization based model predictive control validated on real vehicle data. Energies 2020, 13, 5353. [Google Scholar] [CrossRef]
  41. Bi, W.; Fuller, T.F. Modeling of PEM fuel cell Pt/C catalyst degradation. J. Power Sources 2008, 178, 188–196. [Google Scholar] [CrossRef]
  42. Schröder, J.; Pittkowski, R.K.; Martens, I.; Chattot, R.; Drnec, J.; Quinson, J.; Kirkensgaard, J.J.K.; Arenz, M. Tracking the catalyst layer depth-dependent electrochemical degradation of a bimodal Pt/C fuel cell catalyst: A combined operando small- and wide-angle X-ray scattering study. ACS Catal. 2022, 12, 2077–2085. [Google Scholar] [CrossRef]
  43. Kregar, A.; Katrašnik, T. Theoretical analysis of particle size re-distribution due to Ostwald ripening in the fuel cell catalyst layer. Open Phys. 2019, 17, 779–789. [Google Scholar] [CrossRef]
  44. Kregar, A.; Kravos, A.; Katrašnik, T. Methodology for evaluation of contributions of Ostwald ripening and particle agglomeration to growth of catalyst particles in PEM fuel cells. Fuel Cells 2020, 20, 487–498. [Google Scholar] [CrossRef]
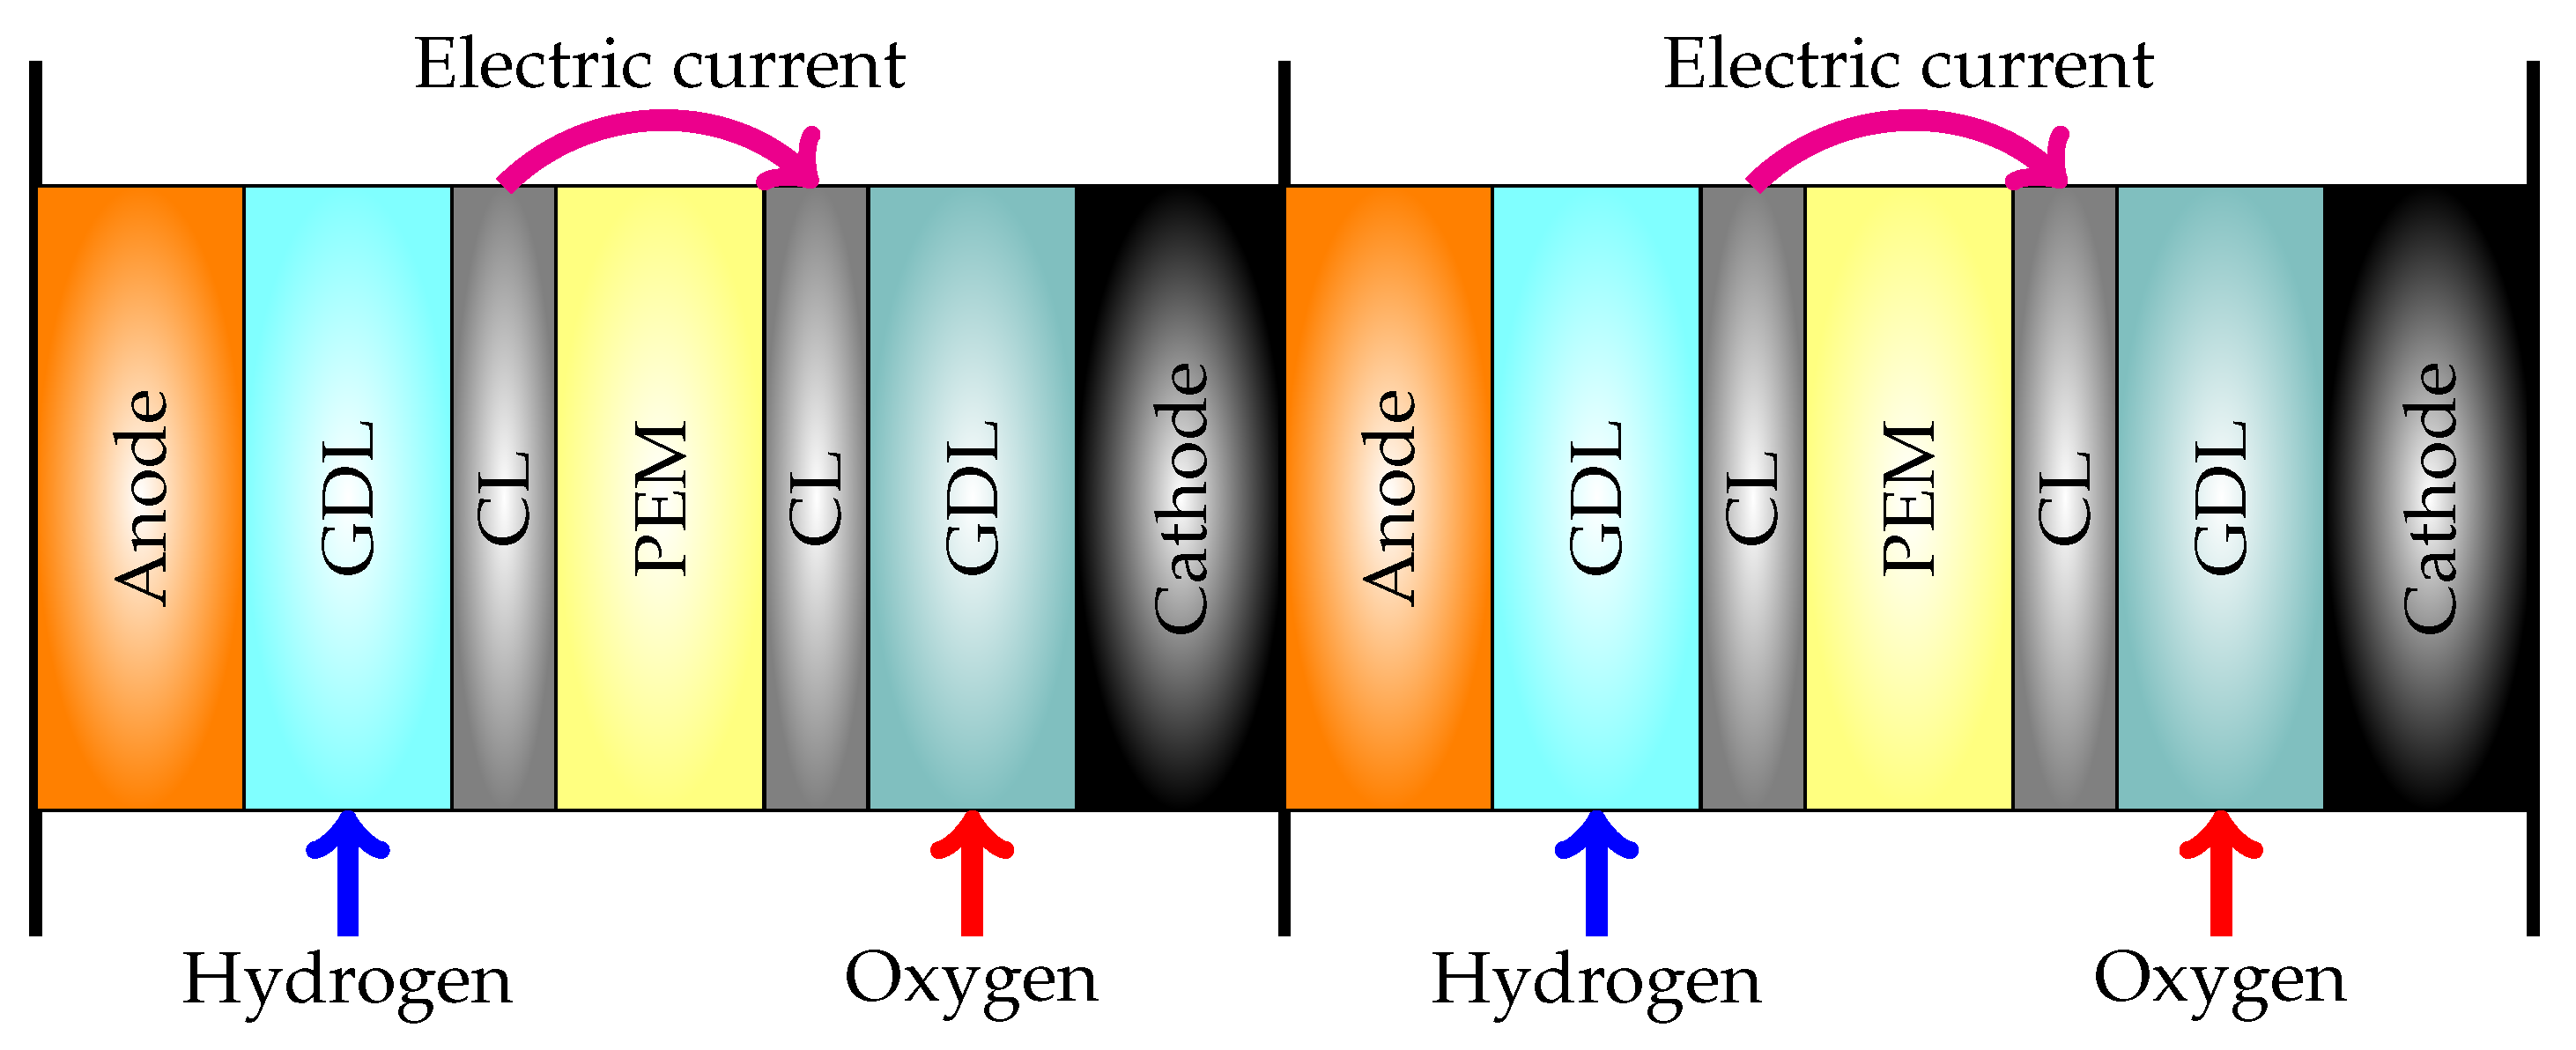
Figure 1. Scheme of two-fuel-cell MEA stack: end plate—anode—GDL—CL—PEM—CL—GDL—bi-polar plate—GDL—CL—PEM—CL—GDL—cathode—end plate.
Technologies 12 00202 g001
Figure 2. Normal distribution for [ d ˜ = 3 , σ = 0.5 ] : (a) Probability density function ϕ . (b) Cumulative distribution function Φ . (c) Particle size groups ϕ 1 , , ϕ P for P = 8 .
Technologies 12 00202 g002
Figure 3. Non-diffusive model for [ d ˜ = 3 , σ = 0.5 ]: (a) Pt particle diameter ratio d i / d i 0 versus cycles. (b) Non-change of PSD. (c) Ratio E of ECSA and m Pt of Pt mass loss versus cycles.
Technologies 12 00202 g003
Figure 4. Diffusive model for [ d ˜ = 2.65 , σ = 0.002 ]: (a) Pt ion concentration c ( t , x ) versus cycles across CL. (b) Non-change of PSD at interface with GDL. (c) Change of PSD at interface with PEM.
Technologies 12 00202 g004
Figure 5. Diffusive model for [ d ˜ = 2.65 , σ = 0.002 ]: Pt particle diameters d 1 , , d 8 .
Technologies 12 00202 g005
Figure 6. Diffusive model for [ d ˜ = 2.65 , σ = 0.002 ]: Pt oxide coverage ratios θ 1 , , θ 8 .
Technologies 12 00202 g006
Figure 7. Change in the average initial PSD for [ d ˜ = 2 , σ = 0.002 ]: (a) For # k = 100 cycles. (b) For # k = 200 cycles. (c) For # k = 300 cycles.
Technologies 12 00202 g007
Figure 8. Change in the average initial PSD for [ d ˜ = 3 , σ = 0.002 ]: (a) For # k = 100 cycles. (b) For # k = 200 cycles. (c) For # k = 300 cycles.
Technologies 12 00202 g008
Figure 9. Change in the average initial PSD for [ d ˜ = 4 , σ = 0.002 ]: (a) For # k = 100 cycles. (b) For # k = 200 cycles. (c) For # k = 300 cycles.
Technologies 12 00202 g009
Figure 10. Change in the average initial PSD for [ d ˜ = 5 , σ = 0.002 ]: (a) For # k = 100 cycles. (b) For # k = 200 cycles. (c) For # k = 300 cycles.
Technologies 12 00202 g010
Table 1. Discrete probabilities of P = 8 particle size groups ϕ 1 , , ϕ 8 for [ d ˜ = 3 , σ = 0.5 ] .
Particle SizeRangeProbability
d 1 = 1.25 d < d 1 + σ / 2 ϕ 1 = 0.0013
d 2 = 1.75 d 2 σ / 2 d < d 2 + σ / 2 ϕ 2 = 0.0214
d 3 = 2.25 d 3 σ / 2 d < d 3 + σ / 2 ϕ 3 = 0.1359
d 4 = 2.75 d 4 σ / 2 d < d 4 + σ / 2 ϕ 4 = 0.3413
d 5 = 3.25 d 5 σ / 2 d < d 5 + σ / 2 ϕ 5 = 0.3413
d 6 = 3.75 d 6 σ / 2 d < d 6 + σ / 2 ϕ 6 = 0.1359
d 7 = 4.25 d 7 σ / 2 d < d 7 + σ / 2 ϕ 7 = 0.0214
d 8 = 4.75 d 8 σ / 2 d ϕ 8 = 0.0013
Table 2. Parameters for Pt ion formation and diffusion and for Pt oxide formation.
SymbolValueUnitsDescription
ν 1 1 × 10 4 Hzdissolution attempt frequency
ν 2 8 × 10 5 Hzbackward dissolution rate factor
β 1 0.5 Butler transfer coefficient for Pt dissolution
n2 electrons transferred during Pt dissolution
U eq 1.118VPt dissolution bulk equilibrium voltage
Ω 9.09 cm 3 /molmolar volume of Pt
γ 2.4 × 10 4 J/ cm 2 Pt [1 1 1] surface tension
c ref 1mol/ cm 3 reference Pt ion concentration
H 1 , fit 4.4 × 10 4 J/molpartial molar Pt dissolution activation enthalpy
D Pt 1 × 10 6 cm 2 /sdiffusion coefficient of Pt ion in the membrane
ν 1 1 × 10 4 Hzforward Pt oxide formation rate constant
ν 2 2 × 10 2 Hzbackward Pt oxide formation rate constant
Γ 2.2 × 10 9 mol/ cm 2 Pt surface site density
β 2 0.5 Butler transfer coefficient for PtO formation
n 2 2 electrons transferred during Pt oxide formation
U fit 0.8VPt oxide formation bulk equilibrium voltage
λ 2 × 10 4 J/molPt oxide dependent kinetic barrier constant
ω 5 × 10 4 J/molPt oxide–oxide interaction energy
H 2 , fit 1.2 × 10 4 J/molpartial molar oxide formation activation enthalpy
Disclaimer/Publisher’s Note: The statements, opinions and data contained in all publications are solely those of the individual author(s) and contributor(s) and not of MDPI and/or the editor(s). MDPI and/or the editor(s) disclaim responsibility for any injury to people or property resulting from any ideas, methods, instructions or products referred to in the content.