Abstract
Using existing software technologies for imputing missing genetic data (GD), such as Beagle, HPImpute, Impute, MACH, AlphaPlantImpute, MissForest, and LinkImputeR, has its advantages and disadvantages. The wide range of input parameters and their nonlinear dependence on the target results require a lot of time and effort to find optimal values in each specific case. Thus, optimizing resources for GD imputation and improving its quality is an important current issue for the quality analysis of digitized deoxyribonucleic acid (DNA) samples. This work provides a critical analysis of existing methods and approaches for obtaining high-quality imputed GD. We observed that most of them do not investigate the problem of time and resource costs, which play a significant role in a mass approach. It is also worth noting that the considered articles are often characterized by high development complexity and, at times, unclear (or missing) descriptions of the input parameters for the methods, algorithms, or models under consideration. As a result, two algorithms were developed in this work. The first one aims to optimize the imputation time, allowing for real-time solutions, while the second one aims to improve imputation accuracy by selecting the best results at each iteration. The success of the first algorithm in improving imputation speed ranges from 47% (for small files) to 87% of the time (for medium and larger files), depending on the available resources. For the second algorithm, the accuracy has been improved by about 0.1%. This, in turn, encourages continued research on the latest version of Beagle software, particularly in the selection of optimal input parameters and possibly other models with similar or higher imputation accuracy.
1. Introduction
The modern evolution of science and technology has provided a wide range of opportunities for sequencing and digitizing the DNA of living organisms, particularly plants [1]. This facilitates the in-depth analysis of various variations (mutations), enabling the identification (or even creation) of diverse organism characteristics to meet certain criteria. Examples include increased resistance to arid climates, insufficient natural light and water, resistance to a particular type of pest or disease, and so on.
In this context, a primary focus is on the extensive analysis of the digitized DNA sample, as digitization itself is time-consuming and resource-intensive. When used on a large scale, the total cost of such experiments increases. One objective is to save resources and costs, achievable by utilizing modern approaches in machine learning and Big Data analysis methods [1,2,3,4].
Another concurrent issue is the presence of gaps in the DNA (regions that were not fully digitized), where the data quality is poor and requires further imputation at a sufficiently high level [3,5,6,7,8,9,10].
In this paper, we conducted a systematic review of existing publications over the past five years using Scopus and PubMed databases according to the PRISMA methodology [11]. The main advantages and disadvantages of the results obtained after applying all the filtering criteria are described. In total, 61 articles from Scopus and 113 articles from PubMed were obtained. Figure 1 shows the step-by-step PRISMA workflow for systematically identifying scientific literature.
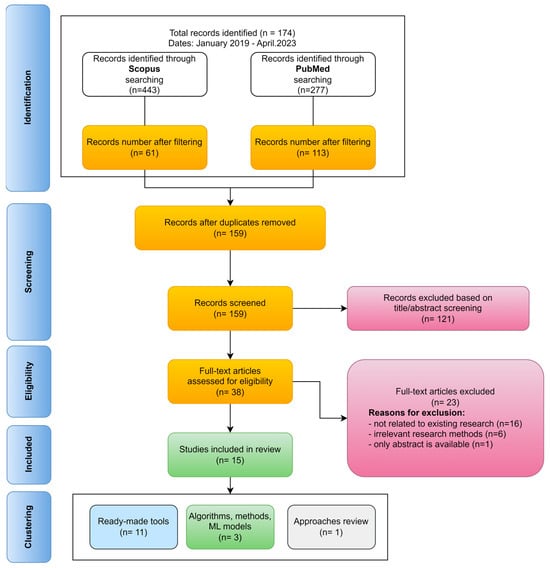
Figure 1.
PRISMA workflow for systematic identification of scientific literature.
So in [1], the authors conducted a review of modern machine learning (ML) methods aimed at their application for a wide range of bioinformatics tasks, including the imputation of missing DNA sequences. For instance, missing data were categorized into three groups: Missing Completely At Random (MCAR), Missing At Random (MAR), and Missing Not At Random (MNAR). On the positive side, there is a comprehensive overview of applicable technologies or approaches for solving analysis, imputation, DNA normalization tasks, and more using modern ML methods. However, a clear disadvantage is the overly general recommendations. In each specific case, these need to be refined, but they can always serve as a foundation for further research.
We particularly focus on the paper [4], which explored the optimization of GD imputation using GBS technology for some plant species with existing tools and ML methods. The following data imputation algorithms were examined: Beagle 5.1, LinkImputeR, RFI (random forest imputation), kNNI (K-nearest neighbor imputation), EMI (expectation maximization imputation), PPCAI (probabilistic PCA imputation), SVDI (Singular value decomposition imputation), FImpute, and MNI (mean imputation). The key conclusion of this work is the identification of the top three methods that demonstrated the best results on two different datasets, with LinkImputeR leading (over 90% correctly imputed data), followed by FImpute with pedigree information, and Beagle. Advantages include a comprehensive review of various ML methods with detailed applications for different scenarios, along with a scientific focus on the mathematical aspect of the methods where necessary. Such comparisons save researchers’ time, allowing them to focus on more efficient algorithms and their disadvantages, discarding the less efficient ones. A potential disadvantage could be the reliance on somewhat dated publications in the field (mostly 4–5 years or older), considering the rapid evolution in ML. It might have been interesting to include AlphaPlantImpute and, possibly, convolutional (CNN), recurrent (RNN), fully connected (DNN) neural networks, or even generative adversarial networks (GAN), which have shown promising results in other fields. This study also lacked information on the time required for the imputation, focusing only on the comparison of the accuracy of the results.
Paper [6] proposes a new process for GD imputation named “HBImpute”. Its key idea revolves around using haplotype blocks (sequences of genetic markers with a predefined minimum frequency in a population), obtained via the HaploBlocker software, to identify locally similar lines. Advantages include the fact that the proposed approach has an optimized execution time, and it also reduced the overall error rate from 0.89% for Beagle 5.0 to 0.47–0.54% for HBImpute. We also provide a comprehensive set of charts and comparisons of results for various input datasets. The HBImpute code in R has been uploaded to GitHub for free access (for non-commercial use only), and the HBImpute approach is expecting a patent. Disadvantages to mention include the use of relatively old versions of Beagle: Approximately 5.0 and 4.1 (the current version as of now is 5.4, which has many improvements and enhancements), and the lack of description of the parameters used (except one—‘ne’). It is unclear how the parameters for the given software were selected.
In [8], the authors explored the dependence of imputation accuracy on minor allele frequencies (MAF). Results from several software solutions, including Impute, MACH, fastPHASE, and Beagle, were analyzed with each of their unique functionalities taken into account. We found that imputation accuracy increases as allele frequencies rise, from 25.7% (for allele frequencies < 5%) to 99.7% (for allele frequencies > 95%). The imputation accuracy reached 94% when the allele frequency was >65%. Among the advantages of this work is the detailed analysis of the accuracy dependence for four genomes of different crops, including barley and wheat. Limitations include the use of outdated software (notably Beagle 3.3) and the lack of explanations for the chosen software input parameters.
In [12], the authors proposed a dual-stream convolutional neural network (CNN) approach for predicting quantitative phenotypes among plants and animals. The research shows that deep learning methods outperform other widely recognized statistical methods in forecasting results. The described models were implemented using the Keras framework. Accuracy was compared using the Pearson correlation coefficient. Notable advantages include a detailed description of the neural network architecture and excellent performance metrics of the studied model, along with open-source code availability on GitHub. A drawback is that the primary focus is on predicting individual genotypes rather than individual nucleotides, and the experiments were conducted only for soybeans.
In the study [13], researchers conducted a comparison of existing software tools for genotype data imputation with the aim of achieving the best results, which included comparatively higher quality and accuracy of genotype data. In particular, some of the most popular software like Beagle 5.0 [14], Impute 5, and AlphaPlantImpute were examined. Their disadvantages and advantages were highlighted. For instance, AlphaPlantImpute better adapts to populations with two parents (bi-parental populations) as it can trace the inheritance of parental alleles and haplotypes in their offspring. AlphaPlantImpute was specifically designed for the imputation of low- and high-density genotypic markers. On the other hand, other imputation methods based on pedigree information, such as Tassel-FSFHap, LP-impute, and Noisy Imputer, are designed for imputing random missing data in the input dataset, not for adding new markers based on parental or other genotypes. Beagle 5 and Impute 5 rely on bond inequality to find the best match between this study and reference panels. It is important to note that using the AlphaPlantImpute software, imputation accuracy increased from 83.51% to 97.9% by increasing the number of markers from 5 to 50, while a further increase from 50 to 160 led to an insignificant improvement in imputation accuracy (from 97.9% to 98.76%). Thus, we demonstrated the dependence of imputation accuracy on the number of markers in this study panel. An advantage of this study is the consideration of the specifics of each of the examined softwares when comparing the results obtained with them, depending on the scenarios of each experiment. Testing of a set of main parameters for Beagle versions 4.1 and 5.0 was also carried out. Among the disadvantages of the results described in the article [13], it is worth noting the absence of a comparison of the duration of the processes for the described software and corresponding scenarios, as well as the resources required for this. This complicates decision-making when choosing the appropriate approach, software, and relevant parameters.
The paper [15] attracts particular attention, where the problem of enhancing the quality of imputed genotype data by utilizing a combination of established software solutions, Beagle and AlphaPlantImpute2, and optimizing their input parameters is explored. Imputation accuracy was measured as the Pearson correlation coefficient between the simulated and imputed data. Particularly, the authors described methods for selecting parameters for both software solutions in a way that they could be compared to each other (since the input parameters of both software vary significantly). Specifically, we established a strict inverse relationship between imputation accuracy and the ‘ne’ parameter values of Beagle 5.1. The ‘iterations’ parameter also greatly influences imputation accuracy; starting at around 3000 iterations, accuracy stops to increase. The main conclusion is that maximum average imputation accuracy is achieved by using Beagle for the phasing step, followed by AlphaPlantImpute2 for genotype data imputation, achieving values between 0.89 and 0.9, which is a commendable metric. Furthermore, although Beagle was specifically designed and adapted for human genomes, this study recommends its application in plants only after default parameter adaptation. The demonstration also highlights that Beagle 5.2 outperforms versions 5.1 and 5.3, while AlphaImpute2 consistently delivers good results, as it was exclusively developed for plants. Among the strengths of this study is that several recent versions of the Beagle software were tested (5.1, 5.2—beagle.28Jun21.220, and 5.3—beagle.08Feb22.fa4) to cover the latest developments. Another important aspect is that this publication provides tabular values for both software, including optimized values, and defines the dependency of imputed data accuracy values for certain parameters of the studied software. The limitations include the absence of a final publication at the time of the literature review (the article remains in preprint) and the conduct of studies exclusively for one plant species, namely sugar beet.
In [16], the authors proposed their approach to genotype imputation—the Practical Haplotype Graph (PHG), which utilizes a reference panel of haplotypes to achieve high-precision genotype imputation. One advantage of this method is a slightly improved imputation accuracy compared to the standard application of Beagle version 5, especially for predicting rare alleles and when phased haplotypes are available. On the other hand, at a high sequence coverage of 5x and above, the difference in imputation accuracy between PHG and Beagle virtually disappears. Furthermore, the code described in the publication is freely available on bitbucket.org, allowing for its reuse and improvement. A limitation is that the results were only compared for one plant species—cassava (Manihot esculenta, a tuber with a high heterozygosity level). The application of PHG to other heterozygous plant species heavily relies on the availability of phased haplotype sampling within a given population, which needs to be developed for each species. Additionally, the comparatively high complexity of the overall process (even with the available open-source code) raises questions regarding the computing resources required for the described calculations. Moreover, it is unclear from the article which set of parameters (default or optimized) was used for the Beagle program to which the primary results were compared.
In [17], the authors explored the use of the Practical Haplotype Graph (PHG) approach to enhance the efficiency of storing and imputing genotype data for wheat (Triticum aestivum L.). The results were compared to the Beagle software (version 5.0). This approach indicates its greater effectiveness when using rare haplotypes included in the reference panel for imputation, as compared to the standard method used in Beagle. Particularly, a significant advantage is the improved genotype imputation accuracy (on average by 3.5%) compared to Beagle 5.0. Another crucial feature of the described approach is the capability to directly use sequenced data in FASTQ format, significantly simplifying and reducing the data processing time. Additionally, we conducted a wide range of comparisons between PHG and Beagle on various input datasets, revealing slightly higher imputation accuracy values (3–5%) for PHG. Disadvantages include a lack of description regarding any optimization (if carried out) of Beagle parameters, which can heavily influence the final results, and it is unclear what database structure was used in the process. This study also did not specify the time required to perform the investigated operations, as in most cases, genotype imputation for a large dataset demands a significant amount of time and resources.
In the study [18], the authors discuss approaches to organizing a service for genotype data imputation (GD) and provide recommendations for parallelizing calculations to reduce execution time. The paper briefly describes a method for automating imputation tasks using the Apache Spark framework and Kubernetes. Overall, the paper is of a recommendatory nature and requires many additional experiments to make a final decision. Advantages include a review of modern approaches utilizing Big Data technologies such as Kubernetes, Apache Spark, and SparkBeagle. Limitations to note include the lack of a description of the specific algorithm that was tested. Also, parameters are missing regarding the use of Beagle and SparkBeagle software. Moreover, the absence of code complicates the critical analysis of the approach recommended in this study.
Authors from [19] have developed an extension for the AlphaPlantImpute software aimed at imputing the GD of parental organisms for bi-parental populations that are either fully or partially non-genotyped. The study showed that the accuracy of the imputed data exceeded 98% and did not fall below 96%. Later, the imputed genotypes of the parents were used for imputation among their offspring. This extension will be beneficial in breeding plant populations aiming to include genome selection for a large number of candidates genotyped with low density (LD), where one parent lacks high-density genotypes (HD phased). The advantages of this study include sufficiently high imputation accuracy and the use of an existing software platform that supports various extensions. Limitations include the absence of the code for this extension in open access for its testing and further modernization (the article only links to the primary AlphaPlantImpute program). Furthermore, testing was conducted on simulated data, which on the one hand allows better control of each experiment, but on the other hand, it would have been useful to obtain results for real data. Although time and resource costs were not the subjects of this research, it is crucial to understand the duration and, consequently, the total cost of such experiments when analyzing a larger amount of material.
A study [20] describes the web service for genotype data (GD) imputation and a database for a broad range of different plant species. The existence of such databases considerably reduces the time researchers spend searching for and filtering the required dataset. The vast number of samples contained in this service (which evidently is updated periodically), as well as the available functionality for concurrent analysis, can be employed for various studies. Currently, reference panels for 12 different plant species are available. Advantages undeniably include the presence of a ready-made service where a vast amount of digitized DNA samples are stored. This service allows users to conduct their own research and experiments using freely available databases. A limitation to note is that the service uses default parameters for conducting imputation on user-provided input files. Current analysis of other publications indicates that optimizing input parameters is crucial for the accuracy of the results obtained.
In the study [21], the authors developed the BWGS library in R to enhance genomic selection quality, one of the features of which is the imputation of missing data. Most of the multi-nucleotide (MN) methods considered in this work provide roughly equivalent results but are superior to LASSO, BRNN, and EN (Elastic Net). The advantages of this study include a comprehensive set of capabilities for performing genomic selection as well as descriptions of available tools for parametric or semi-parametric genomic prediction (in total, 15 different methods). Among the limitations is the fact that for genome-wide data (GD) imputation, heuristic methods were employed: Expectation-Maximization from the rrBLUP package in R and MNI (mean imputation), which is only advisable to use when there are very few missing values. The authors are aware of these constraints, so for more complex scenarios, they recommend using dedicated software like Beagle before employing the BWGS library. It is also worth noting that testing was mainly carried out on bovine milk.
In the paper [22], the authors conducted an imputation of 3 million SNPs for Arabidopsis thaliana using the Beagle software. They considered the specialty of using this software with plants. The obtained results were validated using cross-validation (CV) and allele correlation (AR2). It was determined that CV accuracy serves as a reliable predictor for SNP accuracy. A notable advantage of the study is the inclusion of mathematical descriptions of the methods and approaches used, providing a strong foundation for further analysis and the utilization of the findings. A disadvantage is the application of Beagle software (originally designed for the human genome) to Arabidopsis thaliana, for which, as the authors themselves note, suboptimal parameter calibration is necessary.
The authors from [23] propose a three-stage approach for missing data imputation in Big data interfaces. The described method creates additional data values using a base domain and functional dependencies, which are then added to the available training data. It also allows for the analysis of different types of data. The correctness of the imputed values is verified using a classifier built on the original dataset. The method outperforms the EM and RF methods for 30% of missing data by 12% and supports parallel execution in distributed databases. Advantages are the use of functional dependencies and association rules for missing data recovery, which might offer a fresh perspective compared to traditional methods; the method outperforms established methods like EM and RF by 12% for datasets with 30% missing data; in addition, the method supports parallel execution in distributed databases, making it suitable for large-scale bioinformatic datasets. Disadvantages are: the method’s performance advantage is specifically mentioned for 30% missing data, but its performance in other scenarios (e.g., higher or lower percentages of missing data) is not discussed; the acceleration benefits are tied to the use of multiple servers or processors, but in cases of limited hardware resources, the advantages might not be as pronounced. Given the large-scale nature of bioinformatic datasets and the frequent occurrence of missing data, the proposed method’s scalability and performance advantages make it a promising approach for missing data imputation in bioinformatics. However, its complexity and potential hardware dependencies might pose challenges in some scenarios.
In the paper [24], the authors introduce the Data Analytics and Reporting API (DARAPI), which offers Analytics as a Service in the form of an API. DARAPI simplifies the data analysis process for users, regardless of their expertise in the field. The system accepts input files and performs various pre-processing techniques, including imputation of missing data, outlier detection and replacement, encoding of categorical variables, and more. Feature engineering is conducted, and DARAPI then runs different classification or regression models, delivering the model with the best accuracy for future predictions. The entire system is available as an API accessible from any internet-enabled device. A unique feature of DARAPI is its embedded feedback mechanism, which provides valuable input for future predictions, enhancing system performance compared to existing tools. There are a few valuable advantages, like a user-friendly approach by eliminating the need for in-depth knowledge about data analytics processes; the system handles various data pre-processing tasks, including missing data imputation, which is crucial for bioinformatics datasets; DARAPI can run multiple classification and regression models, ensuring the best model is chosen based on accuracy; an embedded feedback feature that can provide valuable insights for improving future predictions; and an API-based interface. However, there are some disadvantages: The system’s performance might be dependent on the quality of the input file provided by the user; while DARAPI is designed for a broad range of applications, its specific applicability to bioinformatics datasets is not explicitly mentioned. To summarize, DARAPIs ability to handle missing data imputation is particularly relevant for bioinformatics, where datasets often have gaps. Its comprehensive pre-processing and feature engineering capabilities can help in improving bioinformatics datasets for better analysis. However, its general applicability to specific bioinformatics challenges would need further exploration and validation.
In the paper [25], the authors address the challenge of missing values in datasets, which can negatively impact the performance of machine learning models. The authors propose a method that uses Support Vector Machine (SVM) regression for imputing these missing values and introduces a two-level classification process to reduce false classifications. The evaluation was conducted using the PIMA Indian dataset for diabetes classification. There are the following advantages: the use of SVM regression for imputing missing values is a novel approach (SVM is a powerful machine learning model, and its application for imputation can potentially lead to more accurate and reliable results); the introduction of a two-level classification process is a significant advantage (this process activates a second level of classification only when the first level classifies a result as negative, ensuring a reduction in false negative classifications, which is crucial for medical diagnoses); the authors conducted a thorough evaluation using the PIMA Indian dataset for diabetes classification (compared performance of five different machine learning models, providing a comprehensive view of how their method stacks up against other techniques); the results showed that the SVM classifier achieved the highest accuracy of 94.89%, indicating the effectiveness of the proposed method. However, there are some disadvantages: the evaluation was conducted using a specific dataset (PIMA Indian dataset for diabetes classification); the applicability of the method to other bioinformatics datasets or different types of missing data scenarios remains untested; introducing SVM regression for imputation and a two-level classification process can increase the complexity of the model (this might make it harder to implement and interpret, especially in real-world bioinformatics applications where simplicity and interpretability are often crucial); while the method showed perspective in the context of diabetes classification, its generalizability to other bioinformatics challenges, especially those with different data characteristics, is not clear. In conclusion, while the article presents a promising method for handling missing values, its broader applicability and usability in the field of bioinformatics need further exploration and validation.
Thus, optimizing resources for the imputation of genetic data (GD) and enhancing their quality is a crucial current challenge for conducting quality analysis of digitized DNA samples.
A critical review of the current state and achievements in the field of GD research and their quality enhancement highlights several problems associated with GD imputation, specifically:
- Unreliable imputed GD with low accuracy leads to erroneous decisions when analyzing the derived data. This affects not only the final cost of the results but also the overall timeframe since planting and harvesting cycles cannot be accelerated or “rewound”. Consequently, geneticists and bioinformaticians require highly reliable tools and strategies when working with GD.
- Most existing software tools are highly sensitive to input parameters, necessitating special attention to their selection in every specific case for various plant species.
- GD imputation for a vast set of materials requires substantial time and corresponding software and hardware resources.
- Many modern solutions fundamentally use software tools poorly adapted for cloud environments, aiming to reduce computation time through distributed data processing.
- In some cases, increased imputation accuracy is achieved by increasing the number of iterations at individual stages, which, without proper parallelization, significantly extends the overall time needed to complete the given task.
The mentioned problems, to varying extents, are present in most of the reviewed publications. Each issue demands individual research. Suggested algorithms and strategies have their own sets of advantages and disadvantages. Nevertheless, a large amount of data and high load bring new challenges for existing tools, so imputation time becomes much more important. So this study primarily focuses on time optimization and enhancing the accuracy of GD imputation using ready-made software solutions. Specifically, we propose an approach for computation parallelization in a cloud environment.
The main contribution of this article can be summarized in this way.
- -
- Existing approaches for GD imputation are established, and their advantages and disadvantages are analyzed.
- -
- An algorithm for parallelization of calculations is proposed to optimize the total time of imputation of GD using existing tools and their combination.
- -
- An algorithm for increasing the accuracy of imputation is proposed.
- -
- Through large-scale testing, it was established that, based on the proposed algorithms, it was possible to increase the speed of imputation (in the range of 47% to 87%, depending on the amount of input data) and obtain a slightly higher accuracy (by approximately 0.1%).
We organize the rest of this article as follows: Chapter 2 summarizes the advantages and disadvantages of the analyzed articles. Chapter 3 describes suggested approaches. Chapter 4 describes the test data and obtained results in detail. The last chapter shows the conclusions and prospects for further research.
2. Materials and Methods
Certainly, to enhance the quality of genotype data imputation, it is crucial to consider the specificity of the data, resources, and research requirements. The chosen imputation approach may depend on the type of missing data, the linkage level of genotypes, the size of the reference panel, the availability of training data, and computational resources.
2.1. Using Cloud Technologies
While researchers heavily rely on the high accuracy of imputed data to make informed decisions, time and resource expenditures often take a backseat. However, as the number of such experiments grows, the optimization of time and resources to achieve real-time solutions becomes paramount.
Indeed, employing cloud computing can aid in reducing computational and temporal costs associated with genotype data imputation. Given that cloud platforms offer scalability, accessibility, and flexibility, they can be advantageous for optimizing various imputation methods. Some viable strategies include:
- Parallelization and Computation Distribution. Dividing the imputation task into subtasks and processing data in parallel across multiple cloud nodes can accelerate the process. This is particularly beneficial for methods based on Markov models (like IMPUTE2 and BEAGLE) and deep learning (like DeepVariant and DeepImpute).
- Resource Elasticity. Depending on current needs, the quantity of utilized resources can be dynamically adjusted, which can enhance both cost-effectiveness and computation efficiency. This can be advantageous for methods based on machine learning (like K-NN and Random Forest) and statistical algorithms (like FILLING and fast phase).
- Using Ready-made Cloud Services. Some cloud providers offer pre-built services and pipelines for genomic analysis, including imputation. This can simplify the process, reducing both development time and infrastructure maintenance costs.
- Data Storage and Processing. Cloud platforms provide vast scales for data storage and processing, which can foster efficient utilization of reference panels and training datasets, thereby enhancing imputation accuracy. Using cloud storage can also facilitate data exchange among different researchers, promoting collaboration.
- Automation and Monitoring. Cloud platforms allow the automation of various processes linked to genetic data imputation, such as initiating imputation algorithms, progress monitoring, and result collection. Automation can bolster the efficiency, reliability, and reproducibility of studies.
- Selection of a Cloud Provider and Computational Resources. Among available providers (e.g., Amazon Web Services, Google Cloud Platform, or Microsoft Azure), one should choose the one that offers suitable computational resources and services for the current research.
When selecting a cloud provider, it is essential to consider resources, budget, data confidentiality, and research specifics. Different cloud providers offer diverse services and solutions that can be adapted to specific needs.
In this study, the chosen cloud provider is Amazon Web Services (AWS).
2.2. Algorithm A: Imputation Time Optimization
The algorithm proposed in this study for optimizing imputation time includes the following steps:
- Cloud Environment Setup: Virtual nodes (hosts) with the appropriate resources for distributed data processing have to be set up. Install the necessary software (in our case, all versions of Beagle) on each node. One of the simplest approaches is, for example, using pre-built images with pre-installed (or pre-configured by the user) software. Within the AWS environment, this is carried out by using Amazon Machine Image (AMI).
- Data Partitioning: The input data (VCF file) is divided into smaller parts (each file represents a separate chromosome) for distributed computations across different cloud nodes.
- Distributed Processing Across Cloud Nodes: Execute the imputation algorithm separately on each node for each chromosome.
- Results Aggregation: After completing computations on all nodes, you need to collect the imputed results (imputed VCF files) and merge them into the final imputed dataset.
- Monitoring and Automation (optional): Use the cloud provider’s tools for monitoring computational progress, detecting issues, and optimizing resources. Additionally, set up alerts and automated actions (if necessary) to address any problems that might arise during the imputation process. The use of automated pipelines and CI/CD (Continuous Integration/Continuous Deployment) can ensure the efficiency, reliability, and reproducibility of processes.
The described steps are illustrated in Figure 2.
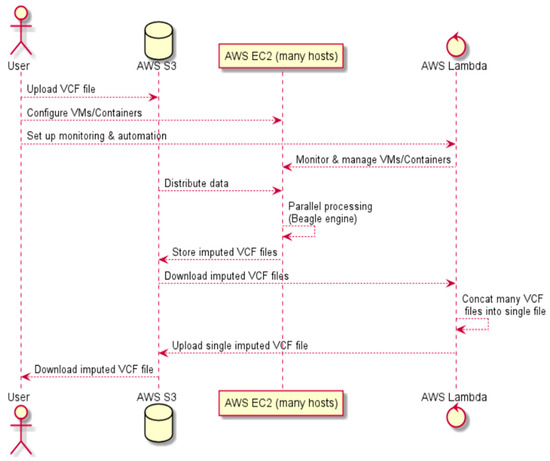
Figure 2.
A high-level diagram of parallelized cloud computing for Algorithm A.
Algorithm 1 describes the parallelized cloud computing pseudocode for Algorithm A (see Figure 2).
| Algorithm 1: Parallelized cloud computing |
| Input: original file path on AWS S3 |
| Output: path on AWS S3 to the imputed file |
| 1: Download file from AWS S3 bucket |
| 2: FOR each chromosome: |
| Perform parallel processing using Beagle engine |
| OUTPUT: imputed file |
| Upload processed data to AWS S3 bucket |
| ENDFOR |
| 3: AWS Lambda handles imputed files: |
| - Download multiple imputed files |
| - Concatenates multiple files into a single file |
| - Upload concatenated file back to AWS S3 |
| OUTPUT: path to concatenated imputed file on AWS S3 |
| 4: Download concatenated imputed VCF file from AWS S3 |
2.3. Algorithm B: Enhancing Imputation Accuracy
The algorithm proposed in this study to enhance imputation accuracy includes the following steps:
- 1.
- Cloud Environment Setup: As in the previous case, virtual nodes (hosts) with the necessary resources for distributed data processing should be created.
- 2.
- Input Data Preparation: Before performing imputation, it is suggested to prepare the input file by:
- -
- dividing it into individual chromosomes;
- -
- for each chromosome, generate a mask whose task is to “hide” a portion of the real data to calculate the achieved accuracy after imputation;
- -
- apply the mask to the input data (mask the input data);
- -
- save intermediate files.
Figure 3 shows the input data masking scheme. This approach will allow for immediate accuracy in the assessment of imputed data for each chromosome, comparing the original and masked data. The main idea is to generate a “mask” with existing, well-known values. Those values will be used as the ground truth for the accuracy computation step. After applying “mask” to the original raw dataset, existing well-known values are marked as missing (in addition to already missed values), so we obtain masked data. It is used during accuracy computation to calculate the ratio of true positives.

Figure 3.
Input data masking scheme for Algorithm B.
- 3.
- Distributed Processing Across Cloud Nodes: At this stage, you should impute the masked data using different models, software, or input parameters.
- 4.
- Results Comparison and Final Imputation: For each chromosome, use the relevant mask and obtain imputed results to calculate the imputation accuracy. Use the model, software, or input parameters that offer the best imputation accuracy for the final imputation on the original data.
- 5.
- Data Collection. The final step involves gathering the obtained results and generating the final file (see Figure 4). This operation can be performed using the AWS Lambda service or on one of the nodes using the AWS EC2 service.
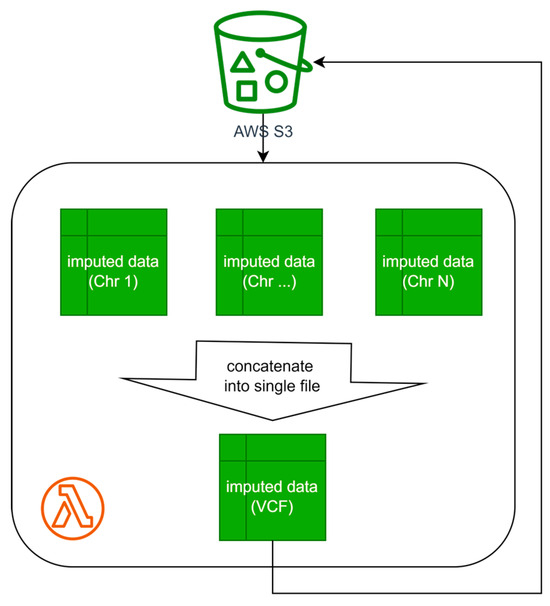 Figure 4. Result aggregation and target file preparation diagram for Algorithms A and B.
Figure 5 illustrates the process of preparing input data (splitting and masking). The described approach to enhancing the accuracy of imputed data are schematically represented in Figure 6, while the process of collecting imputed data into a single file is depicted in Figure 4.
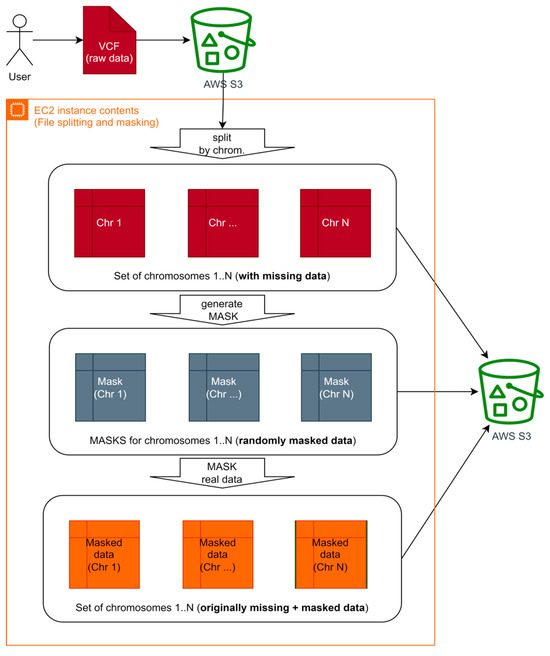
Figure 5.
Input file splitting and data masking high-level diagram for Algorithm B.
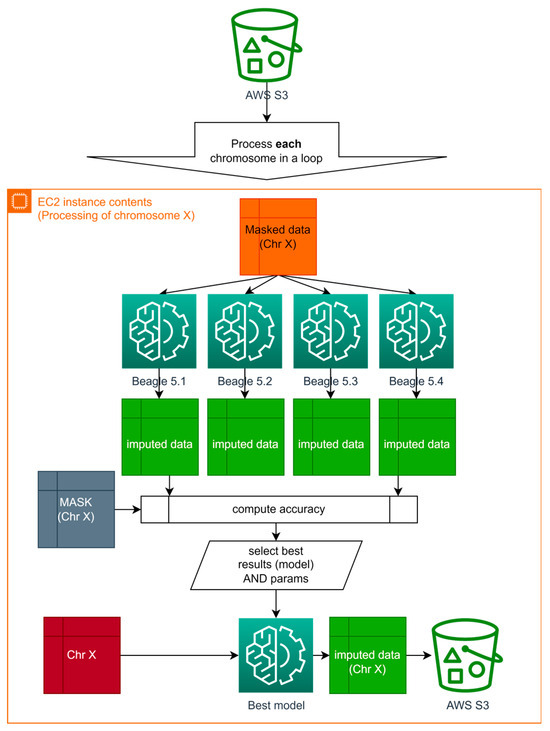
Figure 6.
Parallel processing diagram with best results selection on each iteration for Algorithm B.
Consequently, in addition to parallelizing computations for each chromosome, imputation is carried out using different software, with subsequent selection of the best results. The model, software, or set of input parameters, which have superior imputation quality for each chromosome specifically, are employed for the final imputation of the original input data.
Algorithm 2 presented file splitting and data masking pseudocodes for Algorithm B (see Figure 5).
| Algorithm 2: File split and data masking |
| Method: splitFileAndApplyMasking |
| Input: filePath: STRING, maskingRatio: NUMBER |
| Output: STRING |
| 1: downloadedFile ← downloadFromS3(filePath) |
| 2: numChromosomes ← calculateNumberOfChromosomes(downloadedFile) |
| 3: chromosomeFiles ← splitFileByChromosomes(downloadedFile, numChromosomes) |
| 4: FOR i = 1 TO numChromosomes DO |
| 5: paths ← CALL generateAndApplyMask(chromosomeFiles[i], maskingRatio) |
| 6: CALL uploadToS3(paths[“mask”], “specified path on s3”) |
| 7: CALL uploadToS3(paths[“maskedValues”], “specified path on S3”) |
| 8: ENDFOR |
| 9: RETURN “Masking and upload completed.” |
| Method: generateAndApplyMask |
| Input: file: FILE, maskingRatio: NUMBER |
| Output: DICTIONARY |
| 1: mask ← generateMask(file, maskingRatio) |
| 2: maskedValues ← applyMask(file, mask) |
| 3: RETURN { |
| “mask”: saveFileLocally(mask), |
| “maskedValues”: saveFileLocally(maskedValues) |
| } |
Algorithm 3 presented parallel processing with the best results selection pseudocode for Algorithm B (see Figure 6).
| Algorithm 3: Parallel processing with the best results selection |
| Method: processAllChromosomes |
| Input: chromosomeList: LIST of STRINGS |
| Output: None |
| 1: FOR EACH chrom IN chromosomeList DO |
| 2: originalFile ← downloadFromS3(chrom + “/raw_file”) |
| 3: mask ← downloadFromS3(chrom + “/mask”) |
| 4: maskedData ← downloadFromS3(chrom + “/masked_data”) |
| 5: tools ← [Beagle_v_5.1, Beagle_v_5.2, Beagle_v_5.3, Beagle_v_5.4] |
| 6: bestAccuracy ← 0 |
| 7: bestTool ← NULL |
| 8: FOR EACH tool IN tools DO |
| 9: imputedData ← runTool(tool, maskedData) |
| 10: accuracy ← computeAccuracy(imputedData, mask) |
| 11: IF accuracy > bestAccuracy THEN |
| 12: bestAccuracy ← accuracy |
| 13: bestTool ← tool |
| 14: ENDIF |
| 15: ENDFOR |
| 16: bestImputedData ← runTool(bestTool, originalFile) |
| 17: CALL uploadToS3(chrom, bestImputedData) |
| 18: ENDFOR |
The flowcharts of parallel processing with the best results selection and accuracy computation for Algorithm B (see Figure 6) are illustrated in Figure 7 and Figure 8.
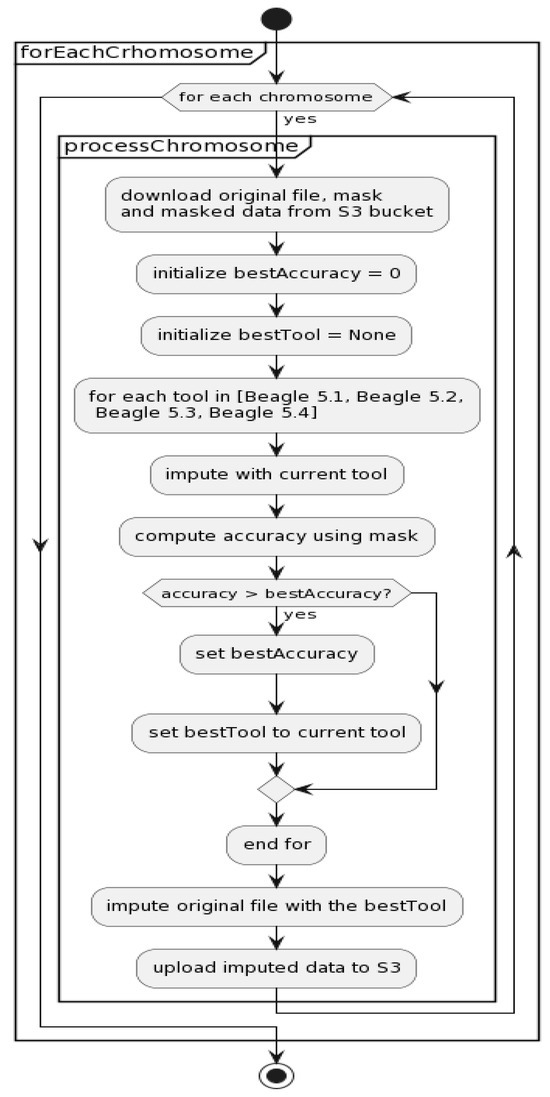
Figure 7.
Parallel processing with the best results selection flowchart for Algorithm B (see Figure 6).
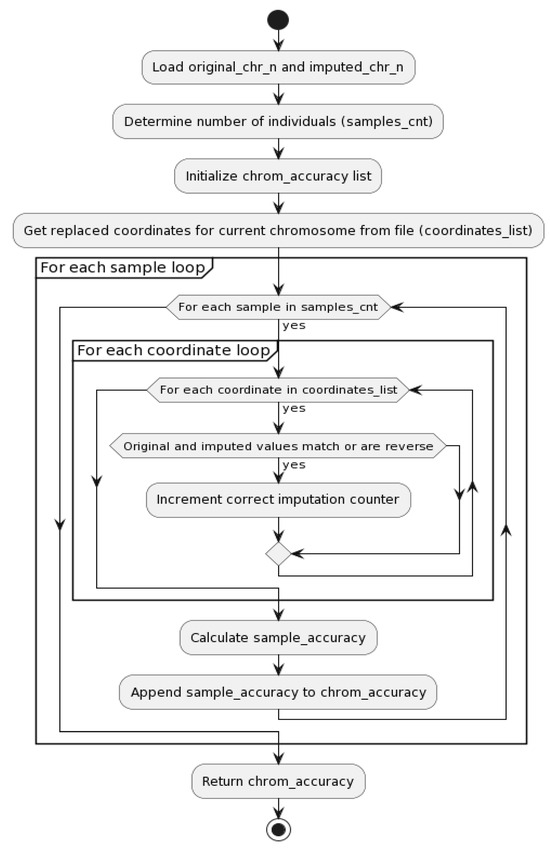
Figure 8.
Accuracy computation flowchart for Algorithm B (see Figure 6).
The approach suggested in this article is scaled without addressing significant issues related to security. Nevertheless, in a cloud environment, different network issues, synchronization errors, etc. may occur, which may cause some instability and additional failures that affect time and target costs. Resolving such issues requires improved architecture. There are some recommendations on this matter:
- -
- Introducing an additional orchestration level for the elimination of risks caused by network instability and synchronization errors while increasing target costs.
- -
- Virtual instances with modern architecture and enough RAM work much faster since most of the calculations are performed in memory.
- -
- To save costs, you should consider virtual instances optimized for calculations (so-called “compute optimized”) or “memory optimized” based on ARM processors or Gravitron2/Gravitron3;
- -
- An additional way to save costs is by using so-called “spot instances”, which save up to 90% of costs compared to so-called “on-demand instances” but require additional orchestration for potential retries.
Orchestration-based distributed computing that solves the described issues depicted in Figure 9.
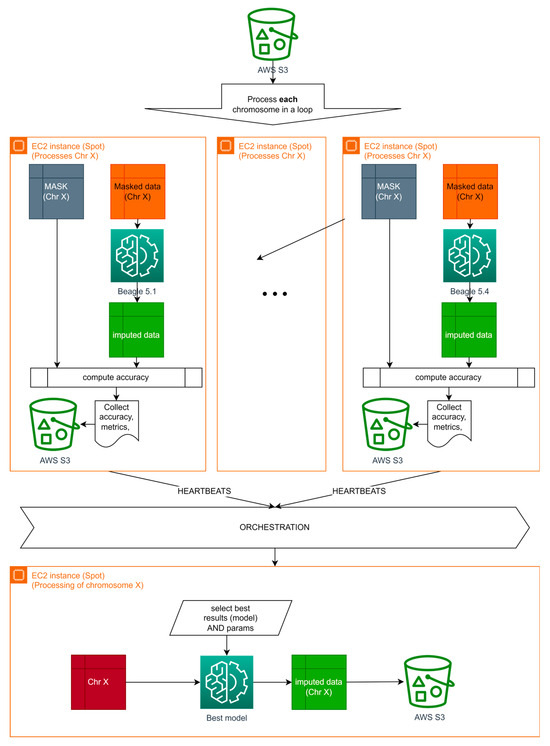
Figure 9.
Orchestration-based distributed computing for Algorithm B.
In this article, the authors were focused on the approach without an orchestration layer and plan to improve it in their future work.
One more pitfall is related to the time and complexity of deploying genetic data imputation tools in a cloud environment. To avoid distracting attention from different automated flows, we decided to use a so-called Amazon Machine Image (AMI). It allows us to configure the whole environment once, save the appropriate AMI to the cloud, and then use it every time it is needed. This saves time for configuring and deploying the required environment.
3. Results
As input data, three datasets with varying numbers of chromosomes were selected, the primary characteristics of which are provided in Table 1. To ensure greater variability, between 3% and 70% of genotypes were removed (masked). Approximately the same size characterizes the first two datasets, with them masking 3% and 30% of genotypes, respectively. Because the third dataset is larger, we decided to mask up to 70% of its data to test imputation accuracy. Experiments demonstrated an almost linear dependency of imputation duration on chromosome length; thus, such a spread in the proportions of missing data covers typical scenarios (small, medium, and large amounts of missing data). Datasets described in Table 1 were downloaded in VCF format for all available chromosomes (each link opens a page with an appropriate number of *.vcf.gz files).

Table 1.
Input datasets characteristics.
3.1. Algorithm A (Time Optimization): Analysis of the Obtained Results
The execution time is dependent on the number of CPU cores and the available RAM. In this study, we demonstrate only a proportional relationship between computation time and the hardware resources used. However, the primary focus is on analyzing the time differences between the described approach and the original application of the considered software.
Figure 10, Figure 11 and Figure 12 illustrate the imputation results for all three datasets A, B, and C, along with the corresponding time savings.
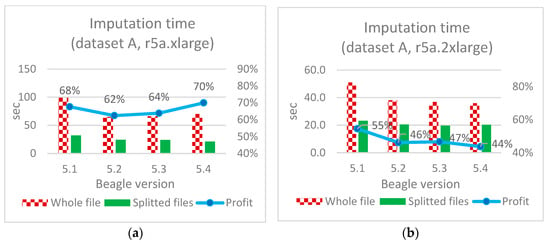
Figure 10.
Imputation time optimization (dataset A): (a)—based on the original application of the considered software; (b)—described Algorithm A.
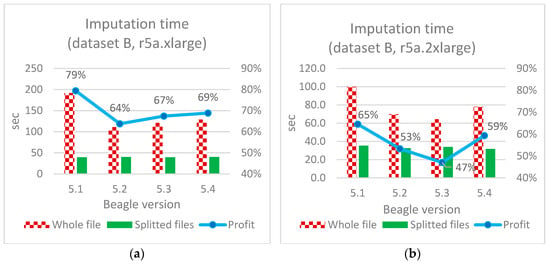
Figure 11.
Imputation time optimization (dataset B): (a)—based on the original application of the considered software; (b)—described Algorithm A.
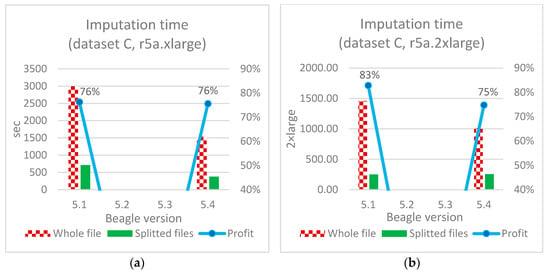
Figure 12.
Imputation time optimization (dataset C): (a)—based on the original application of the considered software; (b)—described Algorithm A.
It should be noted that during the imputation of data from dataset C, versions Beagle 5.2 and 5.3 consistently produced an “IndexOutOfBounds” error. The authors were unable to diagnose and correct this independently, so further experiments with these versions for dataset C were excluded from consideration.
Based on these results, several important conclusions can be drawn:
Imputing an entire file (not divided by chromosomes) using Beagle software versions 5.2 and above takes on average 40% less time compared to version 5.1 (see Figure 11a);
Doubling hardware resources results in an almost double increase in performance for imputing an entire file, further confirming the reliability of the obtained results and indicating an almost linear relationship of execution time to the resources used;
Doubling the hardware resources results in a minor time increment for smaller-sized files and approximately 33–64% for medium-sized files when imputing separate files (see Figure 11a vs. Figure 11b).
The speed increase for the proposed algorithm ranged from 44–47% (datasets A and B in Figure 10 and Figure 11) to 75% (dataset C in Figure 12b). In absolute terms for medium-sized files (dataset C), this is 255 and 1010 s for individual and continuous files, respectively, when using Beagle 5.4 with 4 vCore and 32 Gb RAM (r5a.2xlarge).
The imputation durations for each chromosome and corresponding chromosome lengths for 4 vCore and 32 Gb RAM (r5a.2xlarge) are depicted in Figure 13, Figure 14 and Figure 15. As observed from the charts, the only “outlier” is Beagle version 5.1, while the other versions have shorter execution times and display similar results compared to their adjacent versions. As the dataset size increases, the time advantage of the latest versions significantly grows. For instance, for the smallest dataset A, the time difference between Beagle 5.1 and, for example, Beagle 5.4 ranges from 0% to 20%. For dataset B, it is between −10% and 34%, and for the largest dataset C, the time difference between Beagle 5.1 and 5.4 (using EC2 = r5a.2xlarge) is 39–42% for each chromosome. In addition, it is easy to see a mostly linear dependency between imputation time and chromosome length.
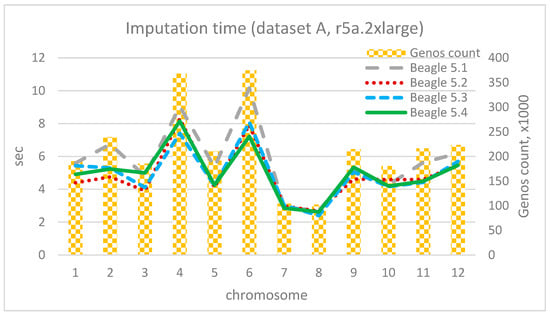
Figure 13.
Imputation time per chromosome and chromosome length (dataset A, r5a.2xlarge).
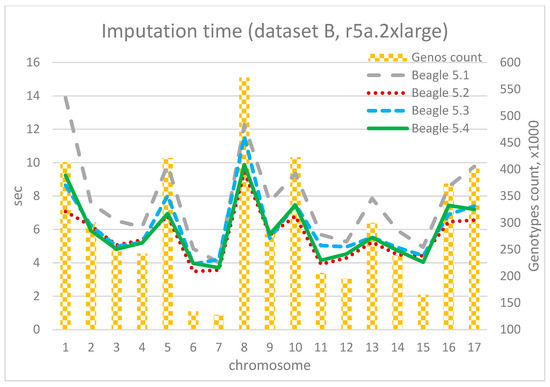
Figure 14.
Imputation time per chromosome and chromosome length (dataset B, r5a.2xlarge).
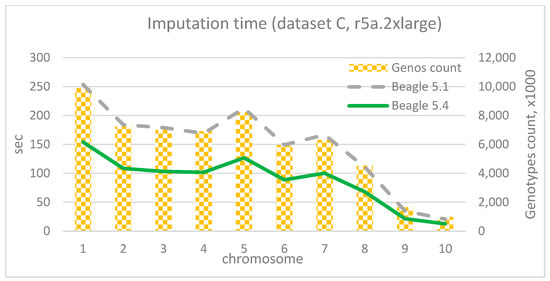
Figure 15.
Imputation time per chromosome and chromosome length (dataset C, r5a.2xlarge).
3.2. Algorithm B (Enhancing Imputation Accuracy): Analysis of the Obtained Results
Below are the comparative Table 2, Table 3, Table 4, Table 5 and Table 6, showcasing the average imputation accuracy (per sample) for each chromosome for every version of the Beagle software. Additionally, we present the maximum imputation accuracy for each chromosome. The version of Beagle software that yielded the highest result was employed for the final imputation of the respective chromosome. As such, the last column, “Max accuracy”, reflects the final imputation accuracy for each chromosome. For clarity, the maximum values within each chromosome are highlighted in green.

Table 2.
Imputation accuracy of each chromosome (dataset A, r5a.xlarge).

Table 3.
Imputation accuracy of each chromosome (dataset A, r5a.2xlarge).

Table 4.
Imputation accuracy of each chromosome (dataset B, r5a.xlarge).

Table 5.
Imputation accuracy of each chromosome (dataset B, r5a.2xlarge).

Table 6.
Imputation accuracy of each chromosome (dataset C, r5a.2xlarge).
From the data tables, it is evident that the latest two versions, Beagle 5.3 and 5.4, yield identical results. Nevertheless, there are instances for certain chromosomes where other versions exhibit superior imputation accuracy. However, even with the algorithm proposed in this study, while there was a slight improvement in imputation accuracy (less than 0.1%), the authors believe that the outcomes do not justify the time and resources expended. As such, we cannot recommend the current implementation of the approach for application.
Additionally, we compared mean imputation accuracy and mean execution time with similar ones from [15]. The authors of this work conducted a set of experiments related to Beagle parameter optimization. As a result, after using those optimized parameters (ne = 4, window = 100, burnin = 90, iterations = 5000, phase-states = 30), we receive an average 67% faster execution time (22.30 min vs. 74.92 min) and a maximum of 1.8% higher mean accuracy (93.2% vs. 91.5%). A comparison of imputation time (Algorithm A) and imputation accuracy (Algorithm B) is illustrated in Figure 16.
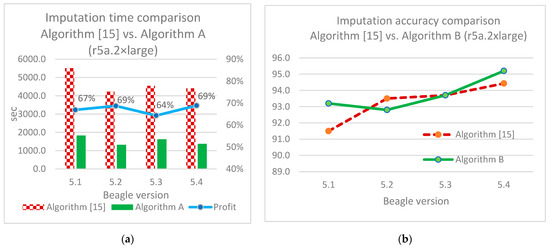
Figure 16.
Imputation results comparison: (a)—imputation time for Algorithm [15] and Algorithm A (using r5a.2xlarge); (b)—imputation accuracy for Algorithm [15] and Algorithm B (using r5a.2xlarge).
4. Conclusions
Based on the research findings:
- -
- A detailed analytical review of literature sources in scientometric databases like Scopus and PubMed was conducted following the PRISMA methodology.
- -
- Significant interest in the research topic was demonstrated, highlighting its relevance and the continuous increase in publications relevant to this topic.
- -
- The features of the approach and application domain of each scientific source reviewed, as well as their advantages and disadvantages, were identified.
- -
- An approach to parallelizing calculations was proposed, aiming at optimizing the overall execution time.
- -
The researched articles typically feature high development complexity and sometimes unclear (or, in some cases, absent) descriptions of the input parameters for the described methods, algorithms, or models. A common issue for most approaches is the execution time of the algorithm, along with satisfactory results for a limited set of plant species or their subspecies. Although there is no single solution, most of the reviewed publications admit that Beagle software provides acceptable (sometimes much better than others) accuracy but requires separate parameter tuning for each specific case. This is part of our further investigation.
We established objectives and tasks for our research to address the disadvantages of the current studies analyzed in the critical review.
Two approaches were proposed for optimizing execution time and enhancing imputation accuracy. The first involves splitting the input file into separate chromosomes and subsequently imputing each of them on a separate virtual machine (host), followed by the results’ consolidation. This approach results in a time savings ranging from 47% (for smaller files, see Figure 10 and Figure 11) to 87% (for medium and larger files, see Figure 12). Big amount of data and high load bring new challenges for existing tools, so imputation time becomes much more important. It may be vital, especially when data grows significantly. As a first step, we aim to improve imputation speed.
The second approach, besides computation parallelization, includes masking input data and intermediate imputation, followed by the selection of the best results and final imputation for each chromosome. This method demonstrated superior outcomes; however, the benefit was less than 0.1%. In the authors’ opinion, this, firstly, does not justify the time and resource expenditures required for implementing this method, and secondly, it prompts further experiments in this direction.
As a last step, we compared the obtained mean imputation accuracy and mean execution time with those from [15]. One of the most impactful changes related to the parameter “iterations” (set to 5000) significantly increases total execution time in any case (although mean accuracy is also increased). So, as suggested in our article, an approach for such cases is a reasonable and promising strategy. Since the values of optimized parameters may be different for each specific case, we plan to focus our further investigation on adaptive parameter optimization.
In a generalized context, the approaches proposed in this article can be extended to a broader set of input data.
Our next steps and future perspectives are:
- -
- Investigate the main parameters’ influence on imputation speed/accuracy.
- -
- Investigate and prove or disprove if conclusions regarding the imputation metrics of a single chromosome may be applied to the rest.
- -
- Investigate adaptive parameter optimization for each chromosome (this may slow down target time but should improve overall accuracy).
Author Contributions
Conceptualization, L.M. and P.H.; methodology, L.M. and P.H.; software, P.H.; validation, L.M.; formal analysis, P.H.; investigation, L.M.; resources, P.H.; data curation, P.H.; writing—original draft preparation, L.M.; writing—review and editing, L.M. and P.H.; visualization, P.H.; supervision, L.M. All authors have read and agreed to the published version of the manuscript.
Funding
This research received no external funding.
Institutional Review Board Statement
Not applicable.
Informed Consent Statement
Not applicable.
Data Availability Statement
All data are fully available without restriction. They may be found at [26,27,28].
Acknowledgments
The authors would like to thank the scientific direction “Analysis of Big Data” of the National University “Lviv Polytechnic” of the Department of Artificial Intelligence Systems.
Conflicts of Interest
The authors declare no conflict of interest.
References
- Bhandari, N.; Walambe, R.; Kotecha, K.; Khare, S.P. A comprehensive survey on computational learning methods for analysis of gene expression data. Front. Mol. Biosci. 2022, 9, 907150. [Google Scholar] [CrossRef] [PubMed]
- Budhlakoti, N.; Rai, A.; Mishra, D.C. Statistical Approach for Improving Genomic Prediction Accuracy through Efficient Diagnostic Measure of Influential Observation. Sci. Rep. 2020, 10, 8408. [Google Scholar] [CrossRef] [PubMed]
- Wu, X.; Heffelfinger, C.; Zhao, H.; Dellaporta, S.L. Benchmarking variant identification tools for plant diversity discovery. BMC Genom. 2019, 20, 701. [Google Scholar] [CrossRef] [PubMed]
- Munyengwa, N.; Le Guen, V.; Bille, H.N.; Souza, L.M.; Clément-Demange, A.; Mournet, P.; Masson, A.; Soumahoro, M.; Kouassi, D.; Cros, D. Optimizing imputation of marker data from genotyping-by-sequencing (GBS) for genomic selection in non-model species: Rubber tree (Hevea brasiliensis) as a case study. Genomics 2021, 113, 655–668. [Google Scholar] [CrossRef] [PubMed]
- Emmanuel, T.; Maupong, T.; Mpoeleng, D.; Semong, T.; Mphago, B.; Tabona, O. A survey on missing data in machine learning. J. Big Data 2021, 8, 140. [Google Scholar] [CrossRef] [PubMed]
- Pook, T.; Nemri, A.; Segovia, E.G.G.; Torres, D.V.; Simianer, H.; Schoen, C.-C. Increasing calling accuracy, coverage, and read-depth in sequence data by the use of haplotype blocks. PLOS Genet. 2021, 17, e1009944. [Google Scholar] [CrossRef]
- Pook, T.; Mayer, M.; Geibel, J.; Weigend, S.; Cavero, D.; Schoen, C.C.; Simianer, H. Improving Imputation Quality in BEAGLE for Crop and Livestock Data. G3 Genes Genomes Genet. 2020, 10, 177–188. [Google Scholar] [CrossRef]
- Alipour, H.; Bai, G.; Zhang, G.; Bihamta, M.R.; Mohammadi, V.; Peyghambari, S.A. Imputation accuracy of wheat genotyping-by-sequencing (GBS) data using barley and wheat genome references. PLoS ONE 2019, 14, e0208614. [Google Scholar] [CrossRef]
- Mochurad, L.; Kryvinska, N. Parallelization of Finding the Current Coordinates of the Lidar Based on the Genetic Algorithm and OpenMP Technology. Symmetry 2021, 13, 666. [Google Scholar] [CrossRef]
- Mochurad, L.; Panto, R. A Parallel Algorithm for the Detection of Eye Disease. In Advances in Intelligent Systems, Computer Science and Digital Economics IV; Lecture Notes on Data Engineering and Communications Technologies; Hu, Z., Wang, Y., He, M., Eds.; Springer Nature: Cham, Switzerland, 2023; Volume 158, pp. 111–125. [Google Scholar] [CrossRef]
- Moher, D.; Liberati, M.; Tetzlaff, J.; Altman, D.G.; PRISMA Group. Preferred Reporting Items for Systematic Reviews and Meta-Analyses: The PRISMA Statement. PLoS Med. 2009, 6, e1000097. [Google Scholar] [CrossRef]
- Liu, Y.; Wang, D.; He, F.; Wang, J.; Joshi, T.; Xu, D. Phenotype Prediction and Genome-Wide Association Study Using Deep Convolutional Neural Network of Soybean. Front. Genet. 2019, 10, 1091. [Google Scholar] [CrossRef] [PubMed]
- Chen, L.; Yang, S.; Araya, S.; Quigley, C.; Taliercio, E.; Mian, R.; Specht, J.E.; Diers, B.W.; Song, Q. Genotype imputation for soybean nested association mapping population to improve precision of QTL detection. Theor. Appl. Genet. 2022, 135, 1797–1810. [Google Scholar] [CrossRef] [PubMed]
- Browning, B.L.; Browning, S.R. Genotype Imputation with Millions of Reference Samples. Am. J. Hum. Genet. 2016, 98, 116–126. [Google Scholar] [CrossRef] [PubMed]
- Niehoff, T.; Pook, T.; Gholami, M.; Beissinger, T. Imputation of low-density marker chip data in plant breeding: Evaluation of methods based on sugar beet. Plant Genome 2022, 15, e20257. [Google Scholar] [CrossRef] [PubMed]
- Long, E.M.; Bradbury, P.J.; Romay, M.C.; Buckler, E.S.; Robbins, K.R. Genome-wide imputation using the practical haplotype graph in the heterozygous crop cassava. G3 Genes Genomes Genet. 2022, 12, jkab383. [Google Scholar] [CrossRef]
- Jordan, K.W.; Bradbury, P.J.; Miller, Z.R.; Nyine, M.; He, F.; Fraser, M.; Anderson, J.; Mason, E.; Katz, A.; Pearce, S.; et al. Development of the Wheat Practical Haplotype Graph database as a resource for genotyping data storage and genotype imputation. G3 Genes Genomes Genet. 2022, 12, jkab390. [Google Scholar] [CrossRef]
- Feser, M.; König, P.; Fiebig, A.; Arend, D.; Lange, M.; Scholz, U. On the way to plant data commons—A genotyping use case. J. Integr. Bioinform. 2022, 19, 20220033. [Google Scholar] [CrossRef]
- Gonen, S.; Wimmer, V.; Gaynor, R.C.; Byrne, E.; Gorjanc, G.; Hickey, J.M. Phasing and imputation of single nucleotide polymorphism data of missing parents of biparental plant populations. Crop Sci. 2021, 61, 2243–2253. [Google Scholar] [CrossRef]
- Gao, Y.; Yang, Z.; Yang, W.; Yang, Y.; Gong, J.; Yang, Q.-Y.; Niu, X. Plant-ImputeDB: An integrated multiple plant reference panel database for genotype imputation. Nucleic Acids Res. 2021, 49, D1480–D1488. [Google Scholar] [CrossRef]
- Charmet, G.; Tran, L.-G.; Auzanneau, J.; Rincent, R.; Bouchet, S. BWGS: A R package for genomic selection and its application to a wheat breeding programme. PLoS ONE 2020, 15, e0222733. [Google Scholar] [CrossRef]
- Arouisse, B.; Korte, A.; van Eeuwijk, F.; Kruijer, W. Imputation of 3 million SNPs in the Arabidopsis regional mapping population. Plant J. 2020, 102, 872–882. [Google Scholar] [CrossRef] [PubMed]
- Wang, C.; Shakhovska, N.; Sachenko, A.; Komar, M. A New Approach for Missing Data Imputation in Big Data Interface. Inf. Technol. Control. 2020, 49, 541–555. [Google Scholar] [CrossRef]
- Ignatius, J.L.P.; Selvakumar, S.; Jsn, S.; Govindarajan, S. Data Analytics and Reporting API—A Reliable Tool for Data Visualization and Predictive Analysis. Inf. Technol. Control. 2022, 51, 59–77. [Google Scholar] [CrossRef]
- Palanivinayagam, A.; Damaševičius, R. Effective Handling of Missing Values in Datasets for Classification Using Machine Learning Methods. Information 2023, 14, 92. [Google Scholar] [CrossRef]
- Rice (Oryza Sativa Japonica).” [VCF]. Available online: http://gong_lab.hzau.edu.cn/Plant_imputeDB/#!/download_rice (accessed on 17 October 2023).
- Greg Baute, “Sunflower (Wild Helianthus).” [VCF]. Available online: https://sunflowergenome.org/diversity/assets/data/diversity/WildHelianthusGBS/295i_GATK.vcf.bz2 (accessed on 17 October 2023).
- Maize (Zea mays).” [VCF]. Available online: http://gong_lab.hzau.edu.cn/Plant_imputeDB/#!/download_maize (accessed on 17 October 2023).
Disclaimer/Publisher’s Note: The statements, opinions and data contained in all publications are solely those of the individual author(s) and contributor(s) and not of MDPI and/or the editor(s). MDPI and/or the editor(s) disclaim responsibility for any injury to people or property resulting from any ideas, methods, instructions or products referred to in the content. |
© 2023 by the authors. Licensee MDPI, Basel, Switzerland. This article is an open access article distributed under the terms and conditions of the Creative Commons Attribution (CC BY) license (https://creativecommons.org/licenses/by/4.0/).