1. Introduction
The past two decades have witnessed an unparalleled surge in the use of mobile phones, making them an integral part of our daily lives. Alongside this technological revolution comes increased exposure to electromagnetic fields (EMFs) emitted by mobile communication technologies [
1,
2,
3]. This raises concerns regarding the potential health effects associated with prolonged exposure to radio frequency (RF) and microwave (MW) radiation emitted by the user’s devices.
The assessment of human exposure to EMFs in the RF and MW ranges involves various metrics and guidelines established by international organizations [
4,
5]. These metrics are designed to protect public health and ensure that exposure levels remain within safe limits. Above 10 MHz, the effects of EMFs are primarily related to tissue heating resulting from prolonged exposure, and specific metrics are used to address this thermal effect [
6,
7,
8]. Specific Absorption Rate (SAR) is a key metric used to assess the rate at which RF energy is absorbed by body tissues when exposed to EMFs. Regulatory bodies, such as the International Commission on Non-Ionizing Radiation Protection (ICNIRP) and the Federal Communications Commission (FCC), have established SAR limits to protect against harmful thermal effects. International guidelines, such as those issued by ICNIRP, the World Health Organization (WHO), and various national regulatory agencies, define exposure limits for different frequency ranges. These limits set constraints on the maximum allowed power density or electric field strength to avoid excessive RF exposure and potential health risks.
While SAR and exposure limits primarily address thermal effects resulting from prolonged exposure to RF EMF, there is ongoing research into potential non-thermal effects [
9,
10,
11]. Non-thermal effects refer to biological responses or health effects that occur at exposure levels below those causing significant tissue heating. The evidence regarding non-thermal effects is still a subject of debate and investigation [
12,
13]. Some studies suggest possible biological effects at low-level exposures, such as alterations in cellular activity, gene expression, and oxidative stress. However, the scientific consensus on the significance and mechanisms of these non-thermal effects is not yet fully established.
As the field of research progresses, exposure guidelines may be adjusted to account for new scientific findings and further understand the potential effects of RF EMF on human health [
14]. The development of the NextGEM Innovation and Knowledge Hub for EMF and Health [
15] established, starting in 2022, a partnership spanning telecommunication engineering, cell biology, human studies, and epidemiology, and the gained knowledge will be integrated into an evidence-based risk assessment for use by different stakeholders.
By examining relevant literature and research about the latest generations of mobile communication standards, respectively the fourth (4G)—Long Term Evolution (LTE) and the fifth (5G)—New Radio (NR) generations; we shed light on the unique characteristics of mobile phones’ emissions, their ubiquitous presence, and the need for proactive measures to minimize exposure risks. Recently, research has been conducted that proves the prevalence of mobile phone human exposure due to 4G and 5G signals among all mobile communications exposure sources [
16,
17]. However, studying the dynamics of 5G signals emitted by a phone is still scarce and can be worthwhile, as it can provide valuable information about the characteristics of the signals and their potential biological effects.
It should be mentioned that most of the research has been conducted on base station emissions in relation to human EMF exposure to 4G and 5G signals. In this regard, measurement procedures have been proposed and refined [
18,
19,
20,
21], tests and monitoring have been settled, scenarios have been analyzed [
22,
23,
24], and much knowledge has been gathered. Opposite, the user device as a source of EMF exposure has been much less investigated, mainly in realistic usage conditions, even if multiple studies have been devoted to dosimetry to compare the specific absorption rate (SAR) of energy deposition in the head/brain to the regulated safety limits [
25,
26].
We start our research work with the idea that the time-domain characteristics of the waveforms emitted by mobile phones in 4G and 5G standards are somewhat different [
27,
28]. The time-structure and time-dynamics of these two standards can differ due to differences in the modulation and coding schemes (MCS), resource allocation methods, and frequency ranges used by each standard. MCS used in wireless communication systems can affect exposure variability to some extent. The variability of exposure refers to the fluctuations in the intensity or pattern of EMFs to which individuals may be exposed over time. The choice of modulation scheme can influence the temporal characteristics of the transmitted signal. For example, some modulation schemes involve transmitting data in bursts or packets with specific time intervals between them. This can result in exposure patterns that are characterized by intermittent periods of high intensity followed by periods of low or no intensity. Similarly, coding schemes can affect the efficiency of data transmission and the duration of active transmission. More efficient coding schemes may allow for shorter active transmission times, reducing the overall exposure duration.
Given the limited research specifically focused on the biological effects of MCS in MW radiation, there is a need for more comprehensive studies to investigate this aspect. As the field progresses, new research findings may emerge that provide deeper insights into the relationship between modulation schemes and potential biological effects. Orthogonal Frequency-Division Multiplexing (OFDM) and Quadrature Amplitude Modulation (QAM) are two different techniques used in modern digital communication systems to increase data throughput and spectral efficiency. OFDM is a method of transmitting digital data over multiple carrier frequencies that are orthogonal to each other. Each carrier is modulated with a low data rate stream, and the subcarriers are spaced apart so that they do not interfere with each other. This allows for more efficient use of the available frequency spectrum. QAM is a modulation technique that combines amplitude and phase modulation to transmit digital data over a carrier wave. It works by encoding data into different amplitude and phase combinations, which are then transmitted as a signal. In modern digital communication systems, OFDM is often used in conjunction with QAM to further increase spectral efficiency [
29]. QAM is used to modulate each of the subcarriers in the OFDM system, allowing multiple bits to be transmitted simultaneously. This enables higher data rates to be achieved without increasing the required bandwidth. The combination of OFDM and QAM is known as OFDM-QAM, and it is widely used in technologies such as Wi-Fi, 4G, and 5G mobile networks.
4G signals are typically divided into multiple subcarriers, each of which can carry data at a different rate, and these subcarriers are grouped into resource blocks that are dynamically allocated to different users based on their data needs. This allocation is typically performed at a fixed interval, resulting in a relatively fixed time-structure and time-dynamics for 4G signals. OFDM divides the signal into multiple subcarriers and transmits them simultaneously. The subcarriers are modulated with different symbols and have a relatively long symbol duration. The result is a 4G waveform with a relatively constant envelope over time.
5G-FR1 signals (<6 GHz) are OFDM modulated, which divides the signal into multiple narrowband subcarriers that are orthogonal to each other. These subcarriers are grouped into resource blocks that can be dynamically allocated to different users based on their data needs. The allocation of these resource blocks can occur more frequently than in 4G, resulting in a more dynamic time-structure and time-dynamics of 5G-FR1 signals [
30]. 5G uses a waveform technology called Filtered-Orthogonal Frequency Division Multiplexing (F-OFDM) or Generalized Frequency Division Multiplexing (GFDM). F-OFDM/GFDM is similar to OFDM but includes a filter that shapes the waveform and introduces a certain degree of variation in the envelope over time. This results in a waveform that is more variable in the time-domain compared to 4G waveforms. Additionally, 5G also uses a technology called Millimeter Wave (mmWave) that operates at much higher frequencies than 4G, resulting in much shorter wavelengths. This means that the waveforms emitted by 5G mobile phones at these higher frequencies may have more complex time-domain characteristics due to the high-frequency components of the signal. Another key difference between 4G and 5G-FR1 signals is that the latter can use more advanced antenna systems, such as massive multiple input-multiple output (MIMO), which can result in a more dynamic time-structure, so the time-dynamics of 5G-FR1 signals are larger than those of 4G signals [
31].
Overall, 5G-FR1 signals tend to be more dynamic due to their use of OFDM and advanced antenna systems; however, the peculiarities can depend on the specific implementation and network configuration.
5G NR uses several modulation types, including, in the case of the uplink signal: (a) Quadrature Phase Shift Keying (QPSK); (b) 16-QAM; (c) 64-QAM; and (d) 256-QAM. The choice of modulation scheme depends on various factors, such as the available bandwidth, the signal-to-noise (SNR) ratio, and the distance between the transmitter and the receiver. 5G NR uses adaptive modulation and coding techniques to dynamically adjust the modulation and coding scheme based on channel conditions, which helps optimize the data throughput and improve the overall system performance [
32].
Statistical techniques may be used to quantify differences in the dynamics of 4G versus 5G signals, such as calculating the mean or variance of the signal over time or analyzing the distribution of the signal power over different time intervals. Moreover, Amplitude Probability Density (APD) and Complementary Cumulative Distribution Function (CCDF) analyses might help in understanding the temporal behavior of EMF signals and identifying specific high-power events that could be relevant for exposure assessment [
33,
34]. APD and CCDF will depend on various factors, including deployment scenarios, network configurations, and measurement conditions. Therefore, conducting a detailed analysis based on actual measurements in specific scenarios would provide more accurate and meaningful results. However, it is essential to interpret the findings in conjunction with comprehensive dosimetric assessments and regulatory guidelines to assess the potential impact on human exposure and health effects [
4,
5].
Signals with high peak-to-average power ratios (PAPRs) can produce stronger electric (E)-fields in certain tissues, potentially leading to higher levels of energy absorption and increased biological effects [
35]. PAPR is a measure of the amplitude variations in a signal, and it describes how much higher the peak power of a signal is compared to its average power. Signals with high PAPRs can have sharp peaks and rapid changes in amplitude, which can lead to the creation of stronger electric fields in certain tissues, such as those with high conductivity. There, the E-field generated by the signal can be much stronger than the average power would suggest. This increased E-field strength can potentially lead to increased energy absorption in these tissues, which can have biological effects [
36]. It is important to note, however, that the potential biological effects of 4G and 5G signals are still the subject of ongoing research [
10,
37,
38,
39,
40], and the current scientific consensus is that the levels of exposure from 5G signals are well below the safety limits set by international organizations.
The modulation technique used to transmit a signal is highlighted in the spectrogram, where different modulation techniques have different spectral characteristics, which can be visualized in the time-frequency domain. Therefore, the spectrogram can be used to identify specific features, which can be recognized by specialized algorithms. In QAM or OFDM, for example, the spectrogram of the signal shows a complex pattern of spectral lines and bands, which can be analyzed to extract information about the modulation parameters, such as the modulation order, the carrier frequency, and the symbol rate.
Using artificial intelligence (AI) in the field of signal recognition and classification is already represented in the literature [
41,
42,
43,
44]. Machine learning and its subclass, deep learning, have been successfully used. Related to EMF exposure, a series of papers have been published in the last few years [
45,
46,
47,
48,
49].
You Only Look Once (YOLO) is a deep learning algorithm that falls under the category of object detection in computer vision [
50,
51]. It uses a deep (convolutional) neural network to predict bounding boxes and class labels for multiple objects in a single pass over the input image. It divides the image into a grid and applies convolutional layers to make predictions at multiple spatial scales. This approach allows YOLO to detect objects of different sizes and aspect ratios efficiently. It has been proven that YOLO v7 has the highest speed and accuracy among all known real-time object detectors [
52,
53]. Based on its features, we aimed at its application in our research work to emphasize the differences in spectrograms of 4G versus 5G signals and, more particularly, for the recognition of different mobile applications running on the mobile phone. The spectrogram of a 4G signal will show a series of horizontal lines corresponding to the different subcarriers, with each line corresponding to a particular frequency band. The spectrogram of a 5G signal will show a more complex pattern compared to 4G, with the frequency content of the signal changing more rapidly over time and with many more frequency bands and potentially more rapid changes in frequency content over time.
The objectives of present work are connected with the study of the dynamics of human EMF exposure and aim:
- (a)
to analyze the amplitude-time variability of the signals emitted by mobile phones in 5G-FR1 versus 4G networks, based on the probability distribution of the amplitude of the emitted signals, on their tail distribution function (probability that the amplitude exceeds a given threshold) and on the channel power dynamics;
- (b)
to analyze the spectrograms of the emissions corresponding to four different mobile applications running in either 5G-FR1 or 4G standards, with the aim of observing peculiarities of changes of power or energy content in different frequency bands over time, and to check the capability of YOLO v7 convolutional neural network algorithm in recognizing and classifying the emission types.
The results will contribute to a deeper understanding of the role that time-variability of EMF exposure has on dosimetric quantification and on the biological impact of mobile communication equipment’s emissions.
2. Materials and Methods
The experimental setup used here for signal acquisition is set to emphasize the capabilities of analyzing the real-life phone’s emissions. In an earlier paper of ours [
54], we applied a controlled assessment of EMF exposure based on monitoring the base station emissions and specific software monitoring all transmission parameters on the mobile terminal (by using QualiPoc Android tool and the TSMA6 network scanner, both by Rhode and Schwarz, Germany). The power emitted by a mobile phone depends on several factors, including the RSRP Reference Signal Received Power (RSRP) and the Reference Signal Received Quality (RSRQ). However, the present approach focused on extracting differences between emissions in a given situation based on real-life mobile usage. Using CCDF statistics, for example, may reveal differences in peak exposure, which may affect mainly the non-thermal response of biological systems.
2.1. Experimental Set-Up and Field Stregth Estimation
The emitting phones used in the work were: (a) the iphone 14pro (model A 2890, Apple, Zhengzhou, China)—for 4G emissions; (b) the iphone 13 (model A2633, Apple, Zhengzhou, China)—for 5G-FR1 emissions. The monitoring of the emitted power levels was carried out in four situations of phone usage:
File download
Internet Video Streaming
File upload
Video call
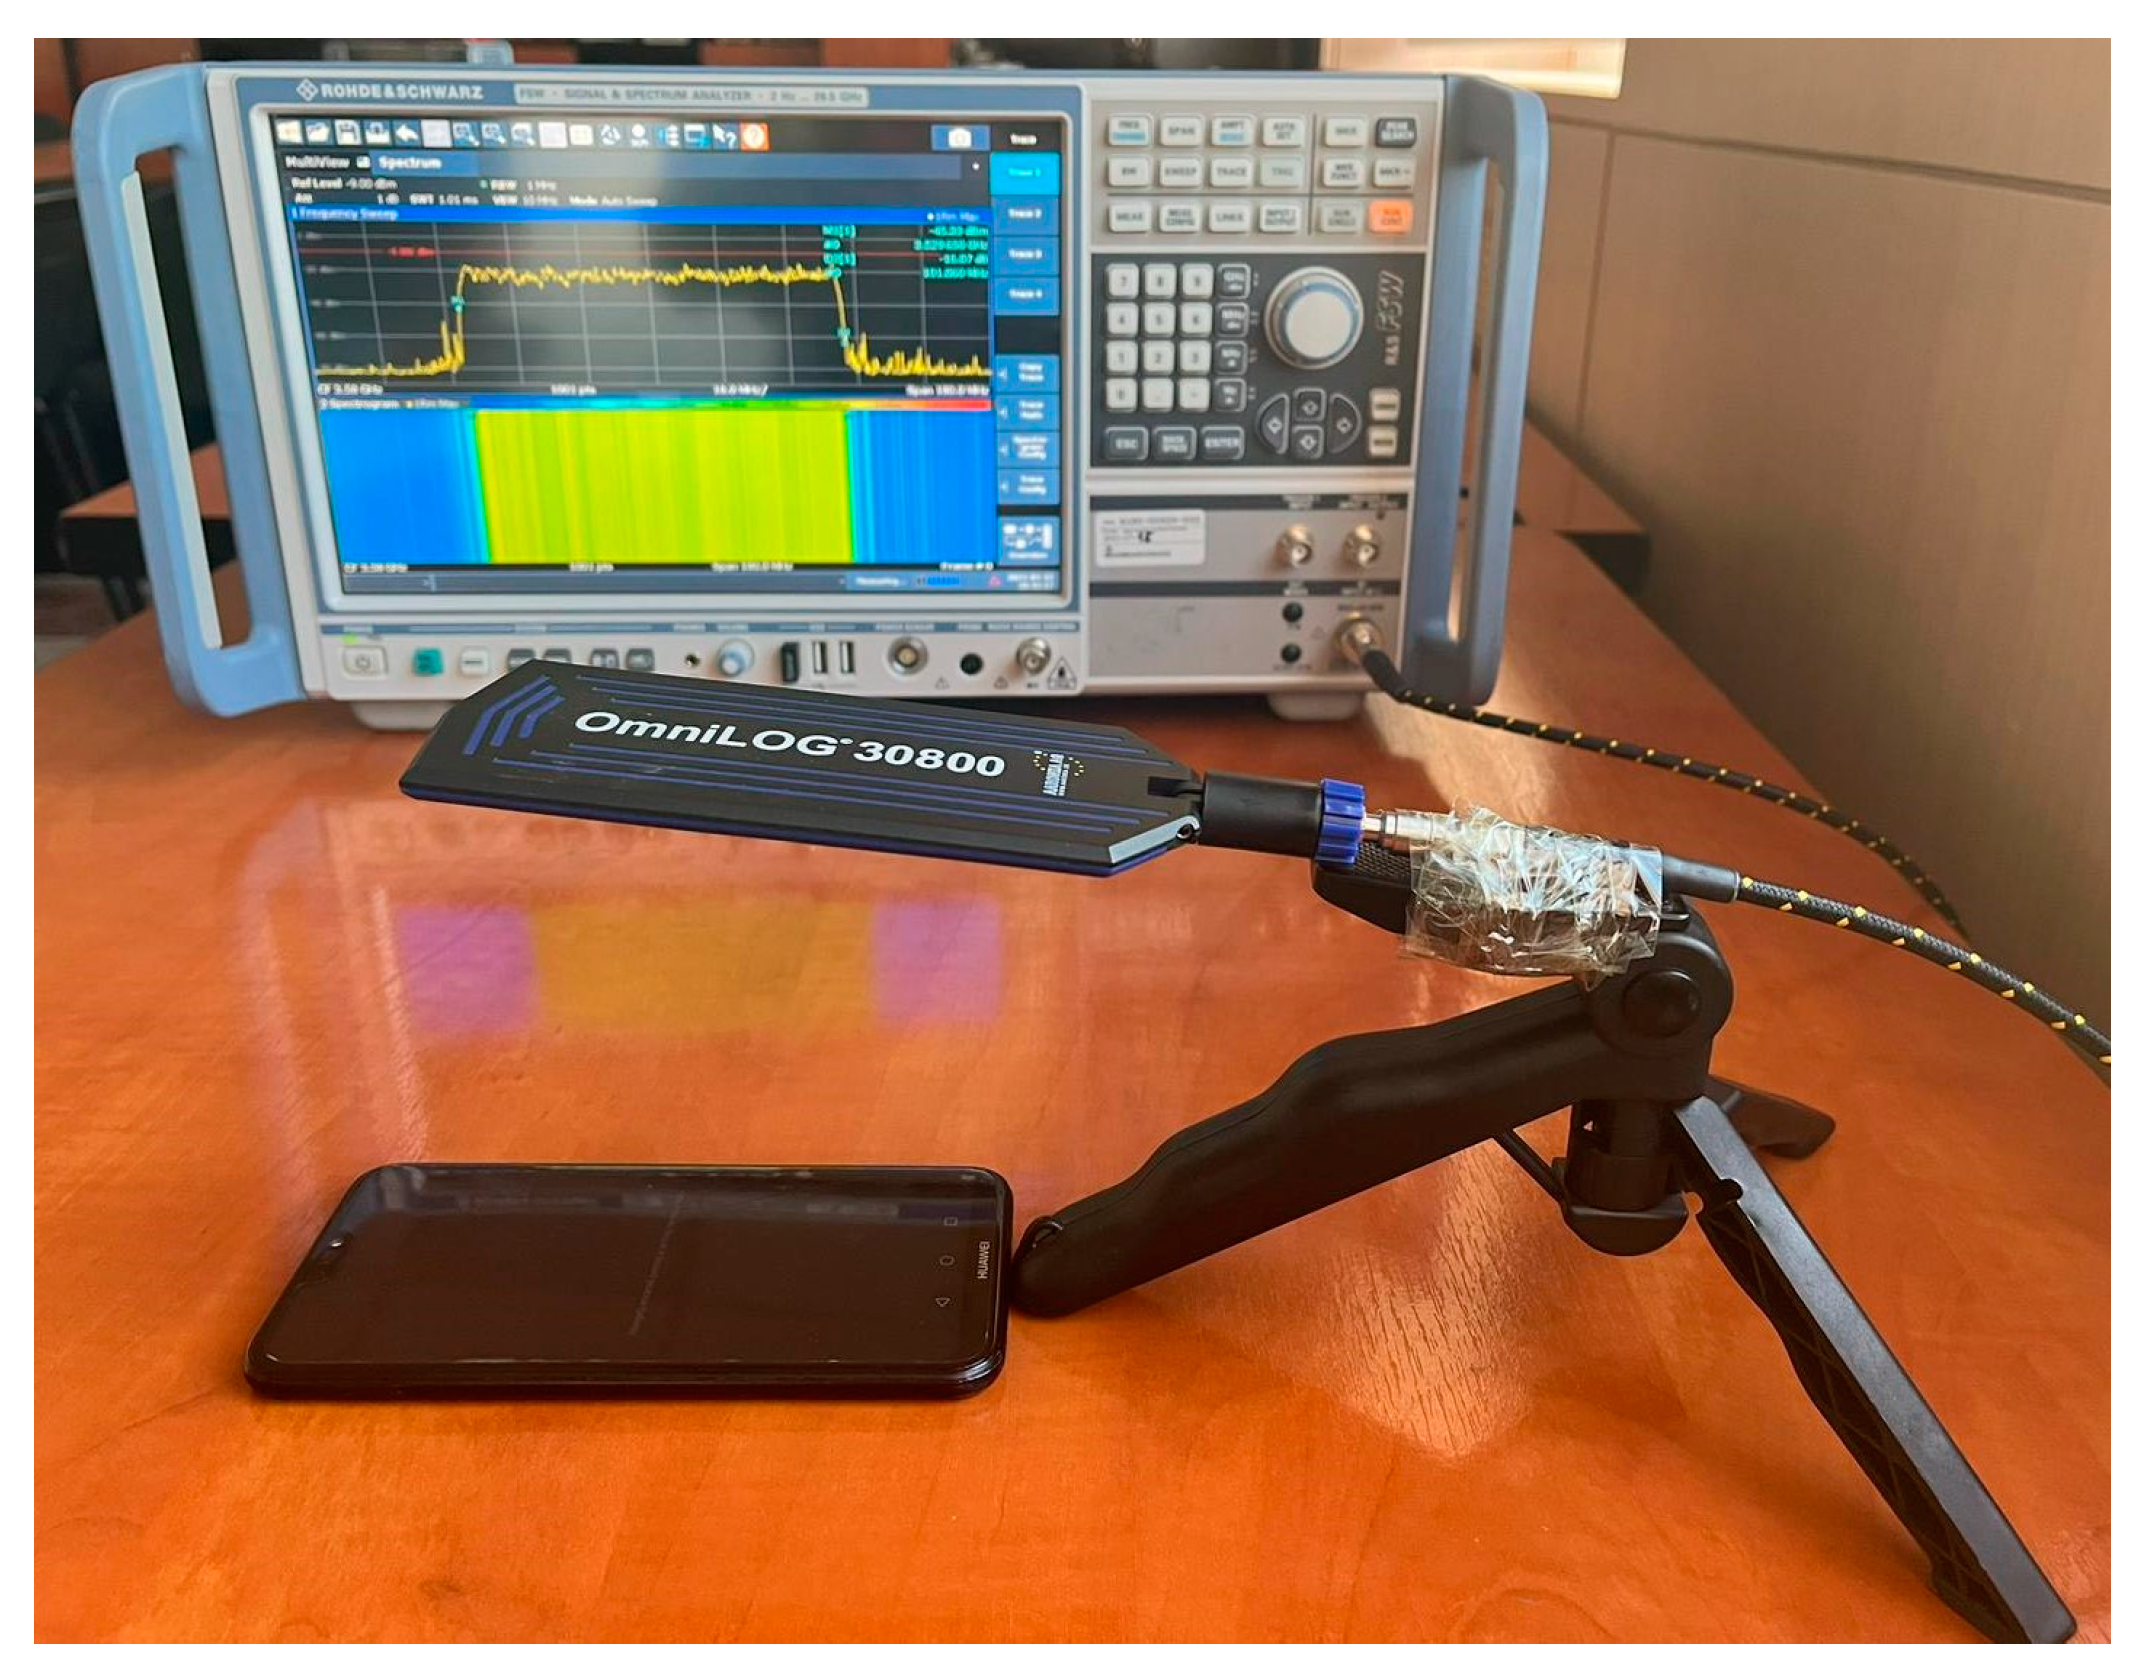
The measurements of the emissions were made by two vector signal analyzers (VSAs), namely a FSV-3013 spectrum and signal analyzer (both by Rohde&Schwarz) with a real-time analysis bandwidth of 40 MHz (for 4G measurements) and a FSW signal analyzer (Rohde&Schwarz) with a real-time analysis bandwidth of 160 MHz (for 5G measurements).
The receiving antenna was an Aaronia Omnilog 30800 (300–8000) MHz (by Aaronia, Germany) with an omnidirectional azimuthal characteristic, positioned in all cases at 10 cm from the surface of the phone, and connected to the VSA as shown in
Figure 1.
The central frequency of the 4G uplink signal was f1 = 1.75 GHz with a bandwidth of 20 MHz, while in 5G it was f2 = 3.58 GHz with a bandwidth of 100 MHz. The antenna factors (AF) of the receiving antenna at both frequencies were available from the provider and used in calculations.
The momentary E-field strength emitted in the air in front of a mobile phone (in the far field) depends on several factors, such as the transmitted power, the emitting antenna gain, the distance from the phone, and the propagation environment. An approximate estimate can be made based on some assumptions and typical values.
The formula to estimate the E-field strength in air at a distance d from a mobile phone (in far-field conditions), based on Friis’ equation, is [
55]:
where:
E is the electric field strength in volts per meter (V/m); Pt is the transmit power in watts; Gt is the antenna gain of the transmitter; Gr is the antenna gain of the receiver; d is the distance between the transmitter and the measurement point in meters; Z is the impedance of free space, which is approximately 377 ohms.
Let us assume the following values for the example calculation: Pt = 0.2 W; Gt = Gr = 3 dBi; d = 0.1 m. Using these values, we obtain E ≈ 0.084 V/m.
This value is still just an estimate and can vary in real-world conditions. Calculating the exact E-field strength requires complex modeling and simulations that consider factors such as antenna radiation pattern, multipath propagation, signal losses, and environmental reflections and absorptions. These calculations are typically performed using specialized software and equipment. It is important to note that even with detailed information and precise calculations, the actual E-field strength can still vary due to real-world complexities and uncertainties.
On the other side, to experimentally express the E-field strength in the air at the receiving antenna site (imaginary body surface), we can use the following formula:
where:
E is the E-field strength in volts per meter (V/m); P is the channel power emitted in watts; AF is the antenna factor in volts per square root of watt (V/√W). In the present case, we expressed the E-field level based on channel power measurements made with the analyzer.
It is important to note that the accuracy of the estimate depends on the accuracy of the antenna factor and the assumption that the antenna is well-calibrated and suitable for the measurement scenario. Additionally, other factors such as distance, propagation environment, and antenna characteristics can still affect the actual E-field strength in real-world conditions.
While the emitted signals’ amplitudes are continuously changing, statistical processing is needed. The time-structure and time-dynamics of 4G and 5G-FR1 signals can differ in several ways due to differences in the underlying technologies used by each standard.
2.2. Performing Emitted Signals Statistics
The APD function describes the distribution of amplitude values in a signal. It shows how frequently a particular amplitude occurs in the signal. CCDF is a statistical metric used to measure the power distribution of a signal, and it shows the probability that the mean signal power amplitude will be exceeded in percent. Practically, we will express the mean power, the peak power, the crest factor (CF)—which is the ratio between the peak and the mean powers; the 10% probability that the level exceeds the mean power + [x] dB, the 1% probability, the 0.1% probability, and the 0.01% probability, respectively. In this way, the largest power level percentages are indicated by CCDF.
The APD function and CCDF have important implications for understanding the amplitude-time profiling of user exposure in different mobile communication technologies, especially in terms of RF exposure. The APD function and CCDF help assess exposure scenarios by considering rare but high-amplitude events that might lead to elevated exposure levels. This information is crucial in ensuring compliance with safety guidelines and understanding potential health risks.
For APD and CCDF measurements, we used the built-in functions of the real-time analyzers with the settings indicated in
Table 1. After a chosen number of counts, the average histogram is presented. For each emission type out of the four, we repeated the measurement five times and expressed the mean of the APD and CCDF curves.
When a signal has a bandwidth larger than the analysis bandwidth of the VSA, the signal may be under-sampled, which can result in aliasing. Aliasing is a phenomenon where high-frequency components of a signal are incorrectly represented as lower-frequency components. This can lead to inaccuracies in the APD measurement and distortion of the signal. To avoid these issues, it is important to ensure that the analysis bandwidth of the VSA is sufficient to cover the bandwidth of the signal of interest. This is the reason for which we used two different VSAs for 4G and 5G signal power statistics to ensure proper analysis bandwidths: 40 MHz for the 4G signal (of 20 MHz bandwidth) and 160 MHz for the 5G signal (of 100 MHz bandwidth), respectively.
The findings from analyzing power distribution functions and the prevalence of the highest power levels contribute to a better understanding of human exposure dynamics in the following ways: a. RF exposure patterns emphasize the differences in power distribution functions between 4G and 5G emissions that can lead to variations in the RF exposure patterns experienced by users. For example, if 5G networks tend to use higher power levels more frequently for shorter bursts, the exposure dynamics might differ from 4G networks that have more consistent power levels. b. Hotspots and high exposure areas: identifying the prevalence of the highest power levels helps in locating areas with potential hotspots of high RF exposure. Understanding these hotspots is crucial for implementing appropriate mitigation strategies to reduce exposure levels in specific locations. c. Safety assessments enable detailed knowledge of power distribution and the prevalence of the highest power levels, which is vital for safety assessments. Regulatory bodies set exposure limits based on these metrics, and ensuring compliance with these limits is crucial for protecting public health. d. Network Optimization is possible by understanding how power is distributed in both 4G and 5G networks, which can guide network optimization efforts. By fine-tuning power allocation strategies, network operators can achieve better coverage, improved efficiency, and potentially lower overall RF exposure levels for users.
2.3. Performing Channel Power Measurements
Channel power measurements have also been performed. The main objective of this measurement was to express the E-field strength in air, the incident field level on a hypothetic tissue situated 10 cm from the phone, and its time-variability. In order to make an accurate assessment, a number of things should be taken into account.
The minimum time at which the channel power changes in a frequency band depends on several factors, such as the channel bandwidth, the modulation scheme, and the signaling rate. In general, the minimum time at which the channel power changes is equal to the reciprocal of the symbol rate (SR), which is the symbol duration (SD). For example, if SR = 1 Msps, SD = 1/106 = 1 µs. However, the actual time at which the channel power changes may be longer than the SD due to factors such as pulse shaping, filtering, and guard intervals. These factors are used to minimize the impact of inter-symbol interference and improve the spectral efficiency of the communication system.
SD can be calculated for each modulation type used, for example, in 5G, based on the SR and the number of bits per symbol (Bps). Therefore, in QPSK-2 Bps, SD = 1/(2 × SR); in 16-QAM-4 Bps, SD = 1/(4 × SR)); in 64-QAM-6 Bps, SD = 1/(6 × SR)); in 256-QAM-8 Bps, SD = 1/(8 × SR). For a SR = 100 kHz, we would have the following symbol durations: (a) QPSK: SD = 5 µs; (b) 16-QAM: SD = 2.5 µs; (c) 64-QAM: SD = 1.67 µs; (d) 256-QAM: SD = 1.25 µs. These symbol durations are theoretical and may be longer in practice due to the factors mentioned above. In 5G, the symbol rate is determined by the specific modulation and coding scheme (MCS) used in the transmission.
In general, the symbol rate can be calculated as the product of the channel bandwidth and the number of bits per symbol divided by the coding rate. For example, if the channel bandwidth is 100 MHz, the modulation scheme is 256-QAM (8 bits per symbol), and the coding rate is 0.9, the symbol rate would be:
If we measure the channel power in 5G with a measurement time longer than the SD, we can still obtain an accurate result. In fact, in many cases, it is common practice to measure the channel power over a longer period of time in order to obtain a more accurate average power value. During a longer measurement period, of the order of milliseconds, multiple symbols are transmitted, and the channel power should be averaged over these symbols. It is worth noting that the longer measurement time may also include other factors that can affect the measured power level, such as fading, interference, and noise. These factors can cause the measured power level to fluctuate and result in higher measurement uncertainty. To minimize the effects of these factors, we performed multiple measurements over a longer period of time and took the average value to obtain a more accurate estimate of the channel power level. If we had used the “max hold” function, this would have led to an overestimation of the power level, particularly when the measurement time is longer than the SD. This is because the “max hold” function only records the highest power level and does not take into account the fluctuations in the power level that occur over the measurement period.
Practically, as shown in
Table 2, we used RMS power measurement for both 4G and 5G emissions, with 20 sweeps to provide one average value. We repeated the measurements five times and indicated at the end the mean channel power along with the standard deviation (Stdev). Using the AF values and the relation (2), we then calculated the mean E-field strength in air at 10 cm from the phone +/− Stdev. The settings of the analyzer for the channel power measurements are presented in
Table 2.
One important indicator of exposure level is connected to data rates, as we have shown in an earlier paper [
56]. Higher data rates typically require the use of higher MCS values, which might impact RF exposure levels. 5Gs ability to provide higher data rates with more advanced MCS might result in shorter transmission times and potentially reduced overall exposure. Understanding exposure patterns is crucial: differences in MCS, frequency bands, and network densification can lead to variations in user exposure patterns between the two networks.
Analyzing exposure metrics can help identify areas with potentially higher RF exposure levels, allowing for targeted optimizations or regulatory interventions. Insights into 5Gs use of beamforming, MIMO, and higher frequency bands can provide a better understanding of how these technologies affect user exposure compared to traditional 4G deployments. Comparing exposure metrics against established safety guidelines can ensure that both 4G and 5G networks adhere to the prescribed limits to protect public health.
2.4. Performing Spectrograms Recordings and Signal Classification
During the measurements, RF signal data may be logged over a certain time period. The data are then analyzed to assess the time variability of the emissions. In a previous work of ours, we applied time series analysis to 4G and 5G signals using the Poincare plots method [
57]. The temporal patterns and fluctuations of mobile phone emissions showed a more intensive dynamic in 5G than in 4G uplink signals, while short-term variability and long-term variability were different in the two networks. Here we concentrated only on the short-term variability, and we proposed spectrogram use and deep learning for exposimetric variability profiling. Such analysis, together with theoretical dosimetry studies, may provide essential knowledge on the potential biological consequences.
Convolutional neural network usage supports traceability and understanding of exposure dynamics by accurately recognizing and classifying emissions from different mobile communication technologies (e.g., 4G and 5G). The collected data can be analyzed over time and space to identify exposure patterns, hotspots, and areas with potential elevated exposure levels. Through deep learning techniques, our understanding of human exposure dynamics is enhanced in several ways: a. by exposure mapping, the maps of RF emissions can help identify regions with higher exposure levels, leading to more targeted investigations and potential optimizations; b. by variability analysis, the changes in emission patterns can help us understand factors influencing exposure levels, such as network usage, traffic, or network upgrades; c. safety assessments: by correlating exposure levels with human activity patterns, it is possible to assess potential risks and ensure compliance with safety standards.
An analysis of the time-domain characteristics of 4G and 5G signals was made by spectrogram recordings for all the cases of emission. Since spectrograms are essentially 2D representations of signals that show the frequency content of a signal over time, by converting a signal into a spectrogram, we can analyze the frequency content of the signal at different points in time, which can be useful for identifying certain characteristics of the signal. Due to the noise and interference present, we manually settled a reference level of the VSA that enabled the observation of just the 4G and 5G signals of the traced mobile phone. This was possible because it was obviously the highest signal in the band. To record the spectrogram of 5G versus 4G emissions in a way that emphasizes the main differences in the time-domain, we adjusted the settings of the spectrogram recording software to achieve the desired results. The tips we followed were:
- i.
Setting the time resolution appropriately: The time resolution of the spectrogram determines the time interval between successive snapshots of the signal. A shorter time resolution will result in a more detailed view of the signal in the time-domain; however, it may sacrifice frequency resolution. Therefore, we adjusted the time resolution to a value that allowed us to capture the main differences in the time-domain without sacrificing frequency resolution.
- ii.
Adjusting the window size and shape: The window size and shape determine how the signal is sliced into segments for Fourier analysis. A smaller window size will give a more detailed view of the signal in the time-domain; however, it may sacrifice frequency resolution. The choice of window shape can also have an impact on the quality of the spectrogram. We used a Hanning window shape.
- iii.
Setting the frequency range: The frequency range of the spectrogram should be set appropriately to capture the relevant frequency bands for 5G and 4G emissions.
- iiii.
Normalizing the spectrogram: It can help to emphasize the main differences in the time-domain. This was achieved by applying a logarithmic scale to the amplitude values in the spectrogram, which made small differences more visible.
By adjusting the above settings, we could record spectrograms that emphasized the main differences in the time-domain for 5G versus 4G emissions. The spectrograms formed the dataset used for signal detection and classification. The YOLO object detection algorithm, which uses deep learning techniques to identify objects in images, was used in its seventh version. To use YOLO on the spectrograms, we first preprocessed the spectrograms to make them suitable for object detection. We resized them to a standard size, normalized the pixel values, and applied other transformations to enhance certain features. YOLO works by dividing the input image into a grid and predicting bounding boxes for objects within each grid cell. It then applies non-maximum suppression to remove redundant bounding boxes and produces a final set of detections.
The YOLOv7 object detection algorithm was tested here with spectrograms. New architectural advancements and optimizations for better performance were available. The following steps were taken: a. data preparation is provided by collecting/generating the dataset of annotated spectrograms where the objects of interest are labeled with bounding boxes; b. data augmentation was not employed here, however it may be used to increase the diversity of the spectrogram dataset with the aim of model generalization; c. model architecture of YOLOv7 was adapted to process spectrogram data by adjusting the input layer to accommodate the dimensions of the spectrogram images and potentially tweaking other layers to work well with this type of data; d. training of the model on the annotated spectrogram dataset followed; the loss function was adjusted to consider the detection accuracy of objects within the spectrograms; e. inference was produced, because once the YOLOv7 model was trained on the spectrogram data, it can be used for real-time or batch processing to detect objects of interest within new, unseen spectrograms.
We trained the YOLO model on a dataset of 300 spectrograms per type of emission out of four and per each of the two communication standards. The YOLO model learned to identify the features that distinguish 5G and 4G signals from other signals in the environment and use this knowledge to classify new spectrograms that it encounters. The objects to be detected included features related to 4G and 5G emissions, such as signal peaks, frequency bands, or other signal patterns specific to the mobile application. Afterwards, we validated the model with 30 spectrograms for each of the eight situations. At the end, 10 spectrograms per situation were presented for classification, and the probability of recognition was computed as the average +/− Stdev.
3. Results and Discussion
3.1. Signal Statistics and Prevalence of Peaks and Highest Power Levels in 4G versus 5G Emissions of the Mobile Phone
The APD distributions of 4G and 5G signals differ due to several factors, including differences in modulation schemes, frequency ranges, transmission power, and other signal parameters. By comparing the APD curves, we can assess whether there are differences in the average power levels, peak power levels, or likelihood of occurrence for specific power levels between the two technologies. This comparison can help determine if there are notable differences in the power distribution of the uplink emissions.
Figure 2 shows the average APD curves for the whole captured power range (upper row) and for just the uplink signals, which are the most powerful (lower row). In all figures, there are four traces, corresponding to the four mobile applications used as emitting sources: file download, Internet video streaming, file upload, and video call.
Figure 2a,b correspond to the whole analysis bandwidths around the 4G and 5G signals, respectively. They present two humps: the one corresponding to lower power levels (left hump) corresponds to other signals, interferences, and noise. The second hump (right hump) corresponds to the distribution of emitted power levels of the targeted uplink signals.
To better observe the peculiarities, in
Figure 2c,d a zoom is made on just the second hump of the 4G and 5G signals emitted by the phone. To accurately compare the APD of 4G and 5G signals, we measured the signals under similar conditions and with similar settings. Therefore, we can clearly identify the differences between the types of mobile applications belonging to the same standard of communication and the differences between the two standards, respectively. In 4G, the allure of the curve for file upload is clearly detached, showing a much higher probability of the apparition of higher power levels (
Figure 2c). Internet video streaming and video calls present very similar power distributions, while file download presents higher power emissions; however, its probabilities of apparition are consistently smaller than for file upload. 5G emissions are much more similar to each other. File upload and file download traces are practically the same, which is also true for the other tandem of traces, respectively for Internet video streaming and video calls. So, each of these two groups presents the same probabilities of the apparition of the same emitted powers. Probabilities are approximately double for file upload and download than for video streaming and video calls.
The differences observed between the APD traces of 4G and 5G signals expressed by the curve forms of probability versus power and by their spreading are due to: (a) the different modulation scheme used; (b) the frequency range, with consequences on the distribution of amplitude values due to differences in path loss, propagation, and interference; and (c) 5G signals typically use higher transmission power levels than 4G signals, which led to a net different distribution of amplitudes. The maximum received powers in 4G were situated in the range (−17…−10) dBm, while the ones in 5G are much more grouped, in the range (−12…−11.5) dBm. We have to underline at this stage that the values of the received powers should not be used as a reference for comparison because the antenna factor of the receiving antenna is different at the two frequency ranges. Therefore, later in the paper we will refer to the E-field strength in the emitting band, and this will be the proper indicator for a correct comparison of absolute amplitudes and respective exposure levels.
To expand the discussion, we can mention some examples of distinguishing characteristics of the APD distributions between 4G and 5G emissions. 5G networks are designed to handle a wide range of applications, including both low-latency and high-data-rate services. This diversity of applications can lead to more sparsity and burstiness in the APD distributions. For example, applications requiring periodic transmission, such as voice calls in 4G or ultra-reliable low-latency communication (URLLC) in 5G, may exhibit specific patterns in the APD due to their different transmission characteristics. Differences in traffic load and user density between 4G and 5G networks can also impact APD distributions. As 5G deployment expands and user adoption increases, the distribution of user activities and traffic patterns may differ from those in mature 4G networks. This, in turn, can affect the temporal characteristics of APD distributions, particularly during periods of high network utilization. The lower latency capabilities of 5G make it suitable for real-time applications such as augmented reality (AR) and virtual reality (VR). These applications may require continuous and high-speed data transmission, resulting in specific APD patterns characterized by frequent bursts and higher signal amplitudes.
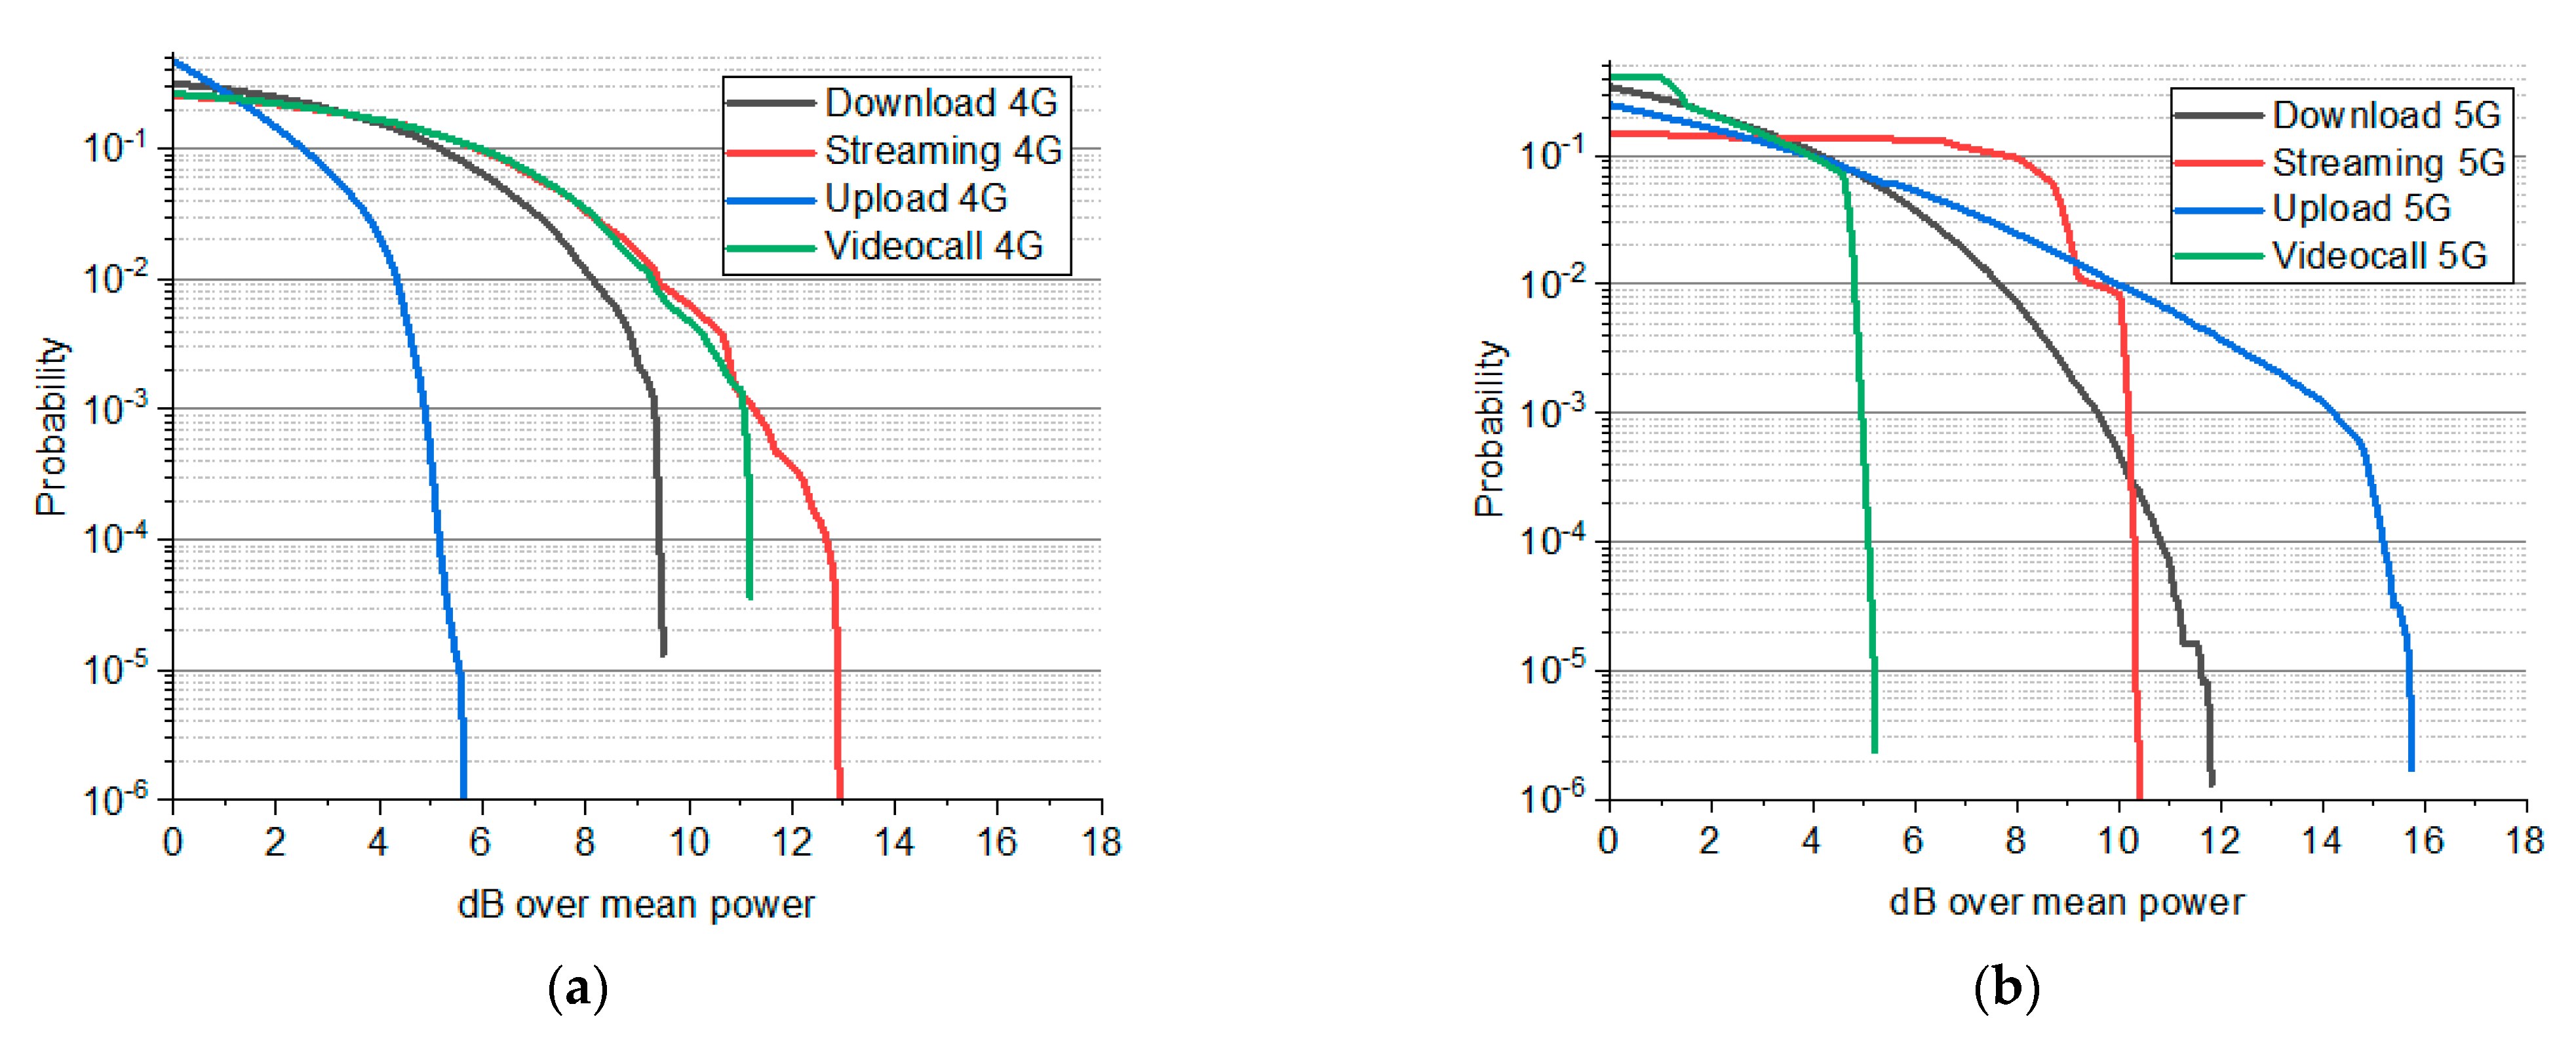
High-Power Events: CCDF analysis is particularly useful for analyzing high-power events and extreme power levels. Comparing the CCDF curves of 4G and 5G uplink emissions can indicate differences in the occurrence of high-power events. This comparison can provide insights into whether there are variations in the tail of the power distribution and the probability of exceeding specific power levels between the two technologies.
The differences between the experimental CCDF traces of 4G and 5G signals can be observed in
Figure 3. They are due to several factors, including modulation schemes, resource allocation techniques, and power control mechanisms. In 4G, the high tail power levels exceed the mean power by (5.7–12.5) dB, while in 5G, this range covers (4.6–15.8) dB. Moreover, the differences between mobile applications are larger in 5G than in 4G, and the corresponding curves are ordered differently. The minimum exceedance of mean power belongs to file upload in 4G and to video calls in 5G. The maximum exceedance over mean power belongs to Internet video streaming in 4G and to file upload in 5G. Moreover, in 5G emissions, video calls and Internet video streaming show the steepest CCDF curves, with probabilities of the tail powers decreasing abruptly beyond approx. 5 dB and 10 dB, respectively.
The differences between the CCDF functions of 5G and 4G signals may be explained based on the following phenomena:
- i.
Signal waveforms: 5G uses more complex modulation schemes such as QPSK, 16-QAM, and 64-QAM, while 4G primarily uses QPSK and 16-QAM. These modulation schemes have different power distributions, which can result in different CCDF functions.
- ii.
Resource allocation: 5G uses a more flexible and dynamic resource allocation mechanism, allowing for more efficient use of available spectrum. This can result in a different power distribution compared to the fixed allocation mechanism used in 4G.
- iii.
Power control: 5G uses advanced power control mechanisms to optimize the transmission power and reduce interference, which can result in a different power distribution compared to 4G.
Referring now to a comparison between the mobile application emissions in 5G-FR1 (
Figure 3b), the following modulation schemes are generally preferred on a 100 MHz bandwidth in the 3.5 GHz band: (a) for file download the preferred modulation scheme is typically 256-QAM which allows high data rates; (b) for Internet streaming the preferred modulation scheme is typically 64QAM that provides a good balance between data rate and robustness to channel impairments, such as noise and interference; (c) for file upload the preferred modulation scheme is typically 16-QAM or 64-QAM, depending on the channel conditions, which allow for a moderate data rate while maintaining good reliability; (d) for video call the preferred modulation scheme is typically Quadrature Phase Shift Keying (QPSK) or 16-QAM, depending on the required data rate and the channel conditions, these schemes providing a good balance between data rate and reliability, which is important for real-time video communication. In general, the higher the modulation and coding scheme used, the higher the data rate that can be achieved. However, as the modulation and coding scheme increase, the transmitted signal becomes more sensitive to noise and interference. This means that in order to maintain a certain level of signal quality and reliability, the transmitted signal may need to be amplified, which can increase the emitted field strength. The choice of modulation and coding schemes also depends on the requirements of the service being used. For example, services that require low latency and high reliability, such as mission-critical communications, may use lower-order modulation schemes such as QPSK or 16QAM, even if this results in lower data rates. On the other hand, services that require high data rates, such as video streaming, may use higher-order modulation schemes such as 256QAM, even if this results in higher error rates.
Observing
Figure 3b, we are entitled to note that the following modulation schemes have been used in our case: file upload–256-QAM (or 64-QAM); Internet streaming and file download–64-QAM (or 16-QAM); video call–16-QAM (or QPSK). In practice, 5G-FR1 uses adaptive modulation and coding techniques to dynamically adjust the modulation and coding scheme based on channel conditions, which helps optimize the data throughput and improve the overall system performance.
The temporal behavior of emissions can be indicated by both APD and CCDF analyses. By examining the curves over time, we could identify any differences in the temporal patterns, such as variations in power levels or the occurrence of specific events. This analysis can help us understand how the temporal behavior of the uplink emissions differs between 4G and 5G.
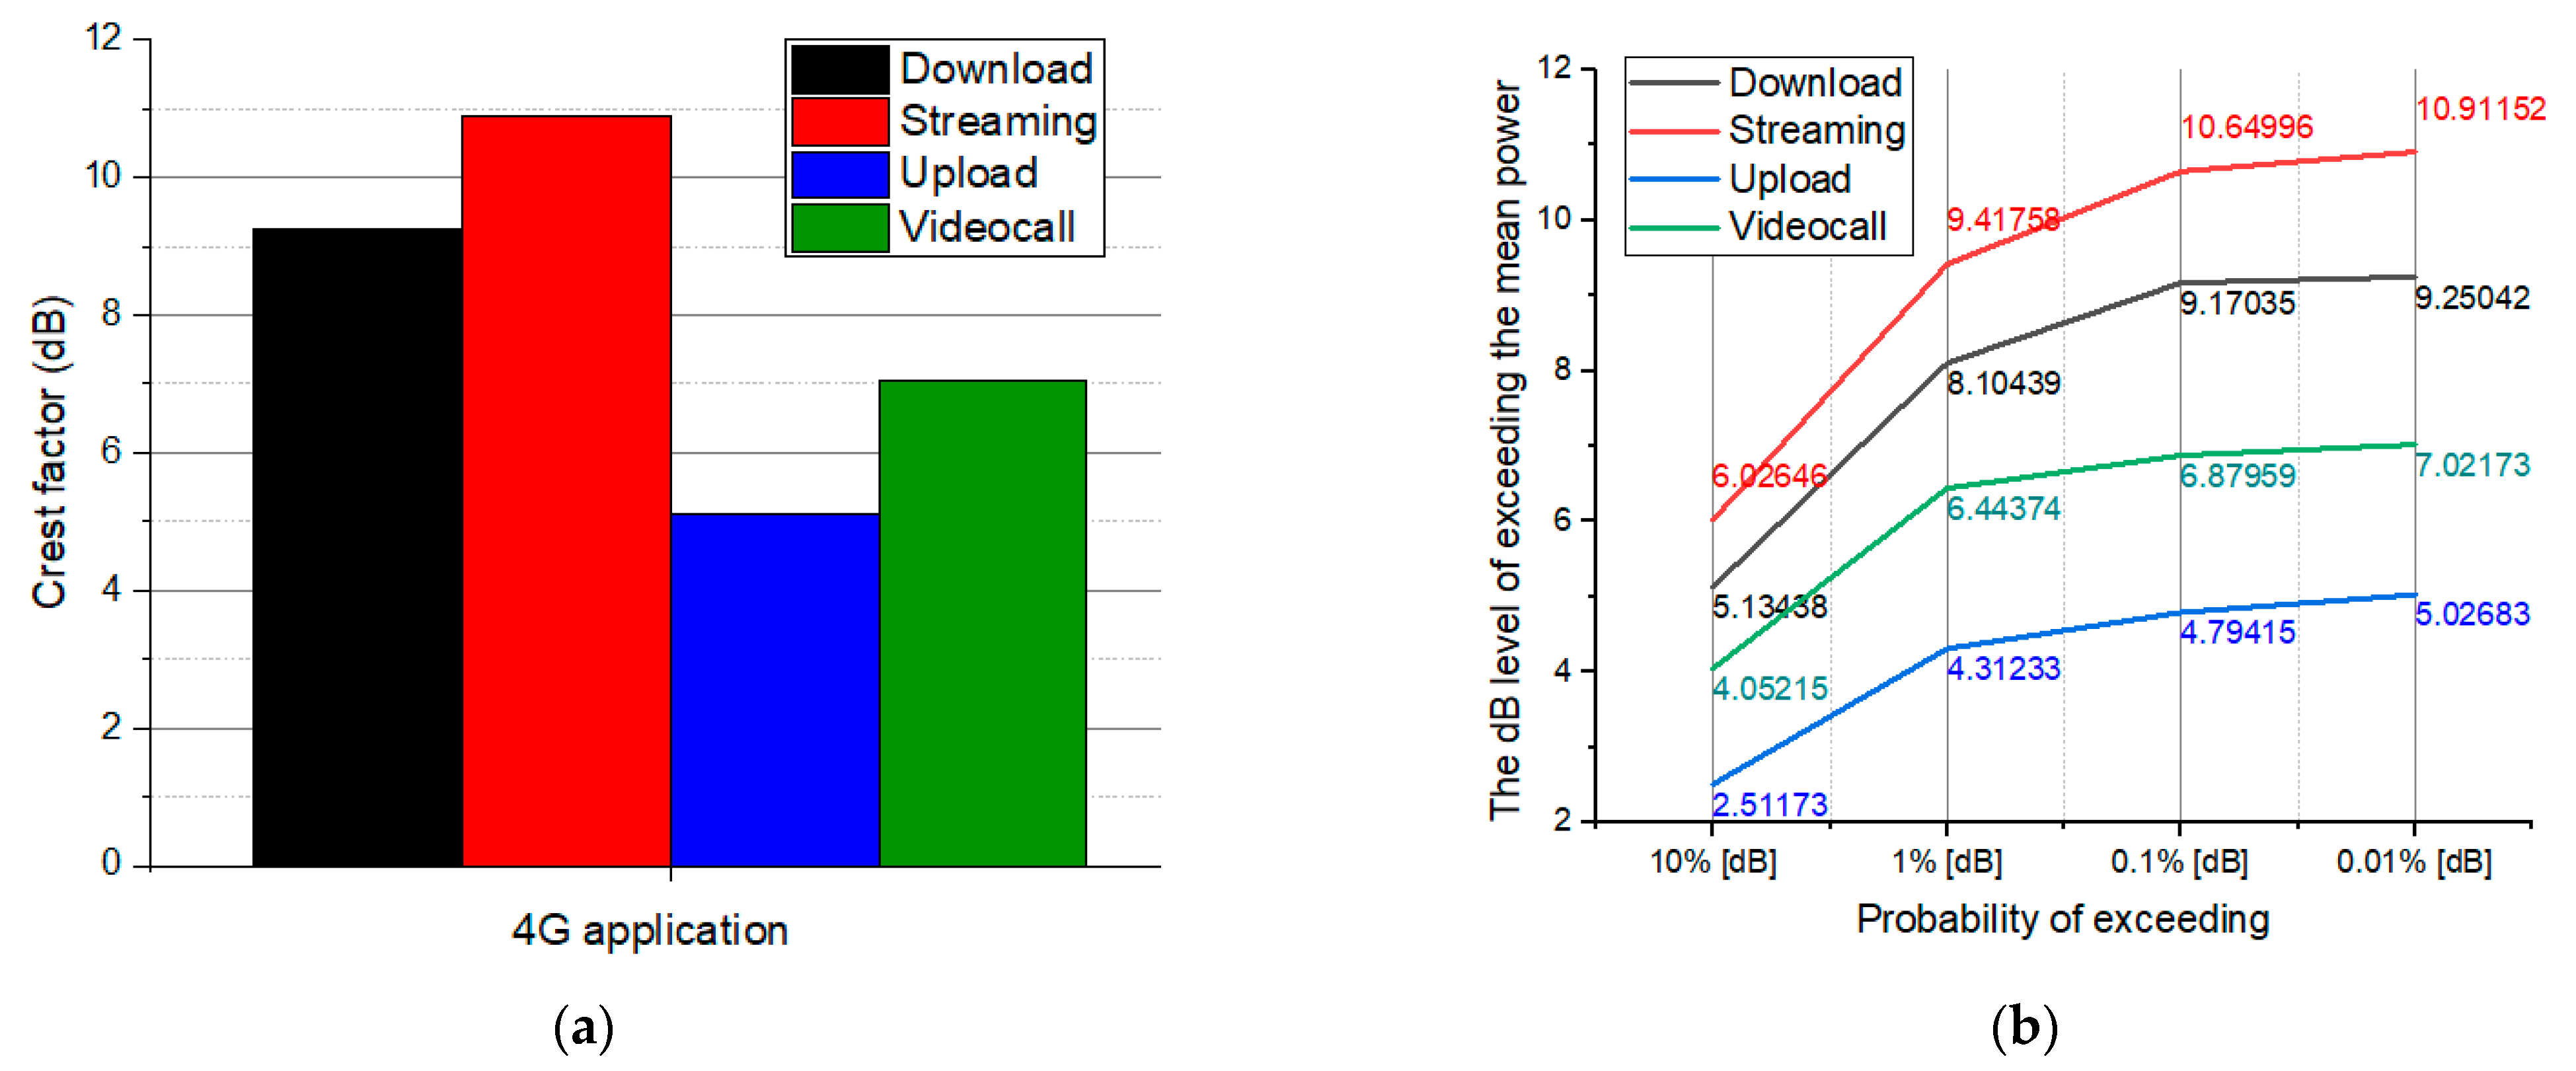
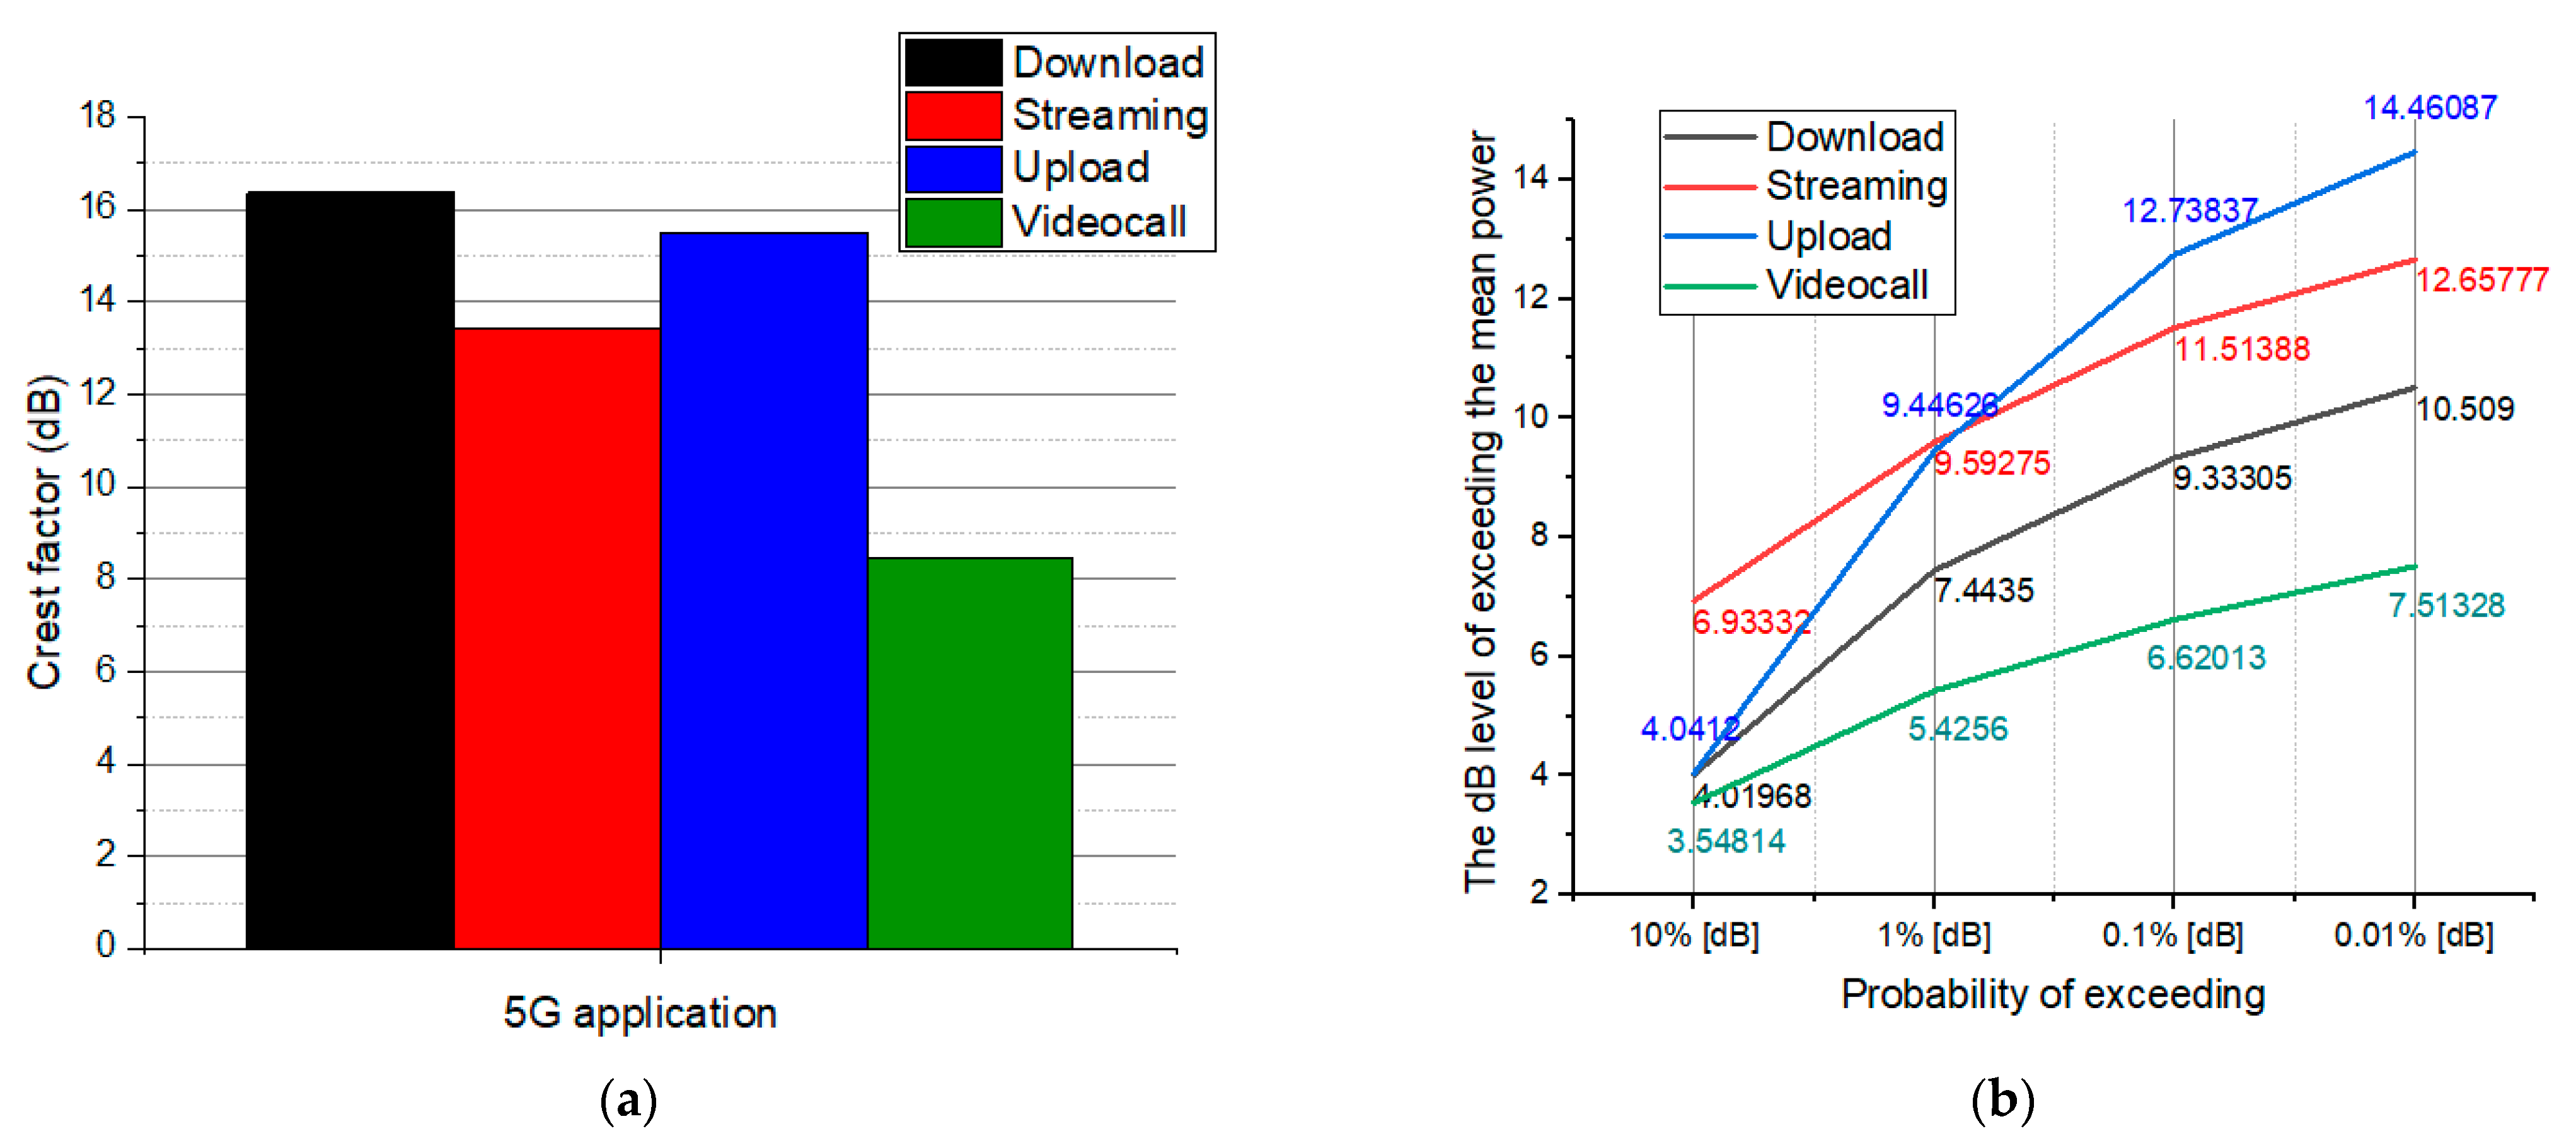
One key difference between 4G and 5G signals is that 5G signals typically have a higher peak-to-average power ratio (PAPR) than 4G signals. Based on the CCDF curve analyses, we extracted the average crest factors and the tails of the distributions comparatively for all the mobile applications belonging to the same transmission technology. In
Figure 4a, we may observe the crest factor values, while in
Figure 4b, we show the probabilities of exceeding the highest emitted power levels for 4G emissions. Similarly, the same graphs are represented for 5G signals in
Figure 5a,b. CF values for 4G emissions are situated in the range (5–11) while for 5G-FR1 emissions they are higher, between (8.5–16.2). Interesting to note is the fact that the CFs are very similar in 4G and 5G-FR1 for Internet video streaming and video calls, indicating very similar modulation and coding schemes in the present situations. In contrast, CF for file upload is three times higher in 5G than in 4G, while CF for file download is almost double in 5G than in 4G. This situation must be due to the use of 256-QAM and 64-QAM in 5G for the two highest field levels, when the highest data rates per unit time of transmission are also used.
Let us consider a scenario where a 5G signal is emitted with a high CF (and PAPR), such as the 256-QAM signal. Due to the high PAPR, the peak power of the signal can be significantly higher than its average power. This means that in certain tissues of the head with high conductivity, such as the eyes or the skin, the electric field generated by the signal can be much stronger than the average power would suggest. If the tissue absorbs more energy than it can dissipate, this can lead to a local temperature increase and potential tissue damage or other biological effects. In [
37], the authors specify that “there are knowledge gaps with respect to local heat developments on small living surfaces, e.g., on the skin or on the eye, which can lead to specific health effects. In addition, the question of any possibility of non-thermal effects needs to be answered”.
The trend of extreme values of power levels is depicted in
Figure 4b versus
Figure 5b. Differences in power tail distributions are evident between the two communication standards and also between mobile applications. The maximum exceedance of mean power in 5G versus 4G belongs to file upload mobile applications, and the value is 9.5 dB.
3.2. Electric Field Strengths in Air, at 10 cm from the Mobile Phone in 4G versus 5G Emissions
Channel power was another interesting indicator of the EMF exposure because, based on its value and its dynamics, we expressed the E-field strength incident on the body part hypothetically situated at a 10 cm distance and its variability.
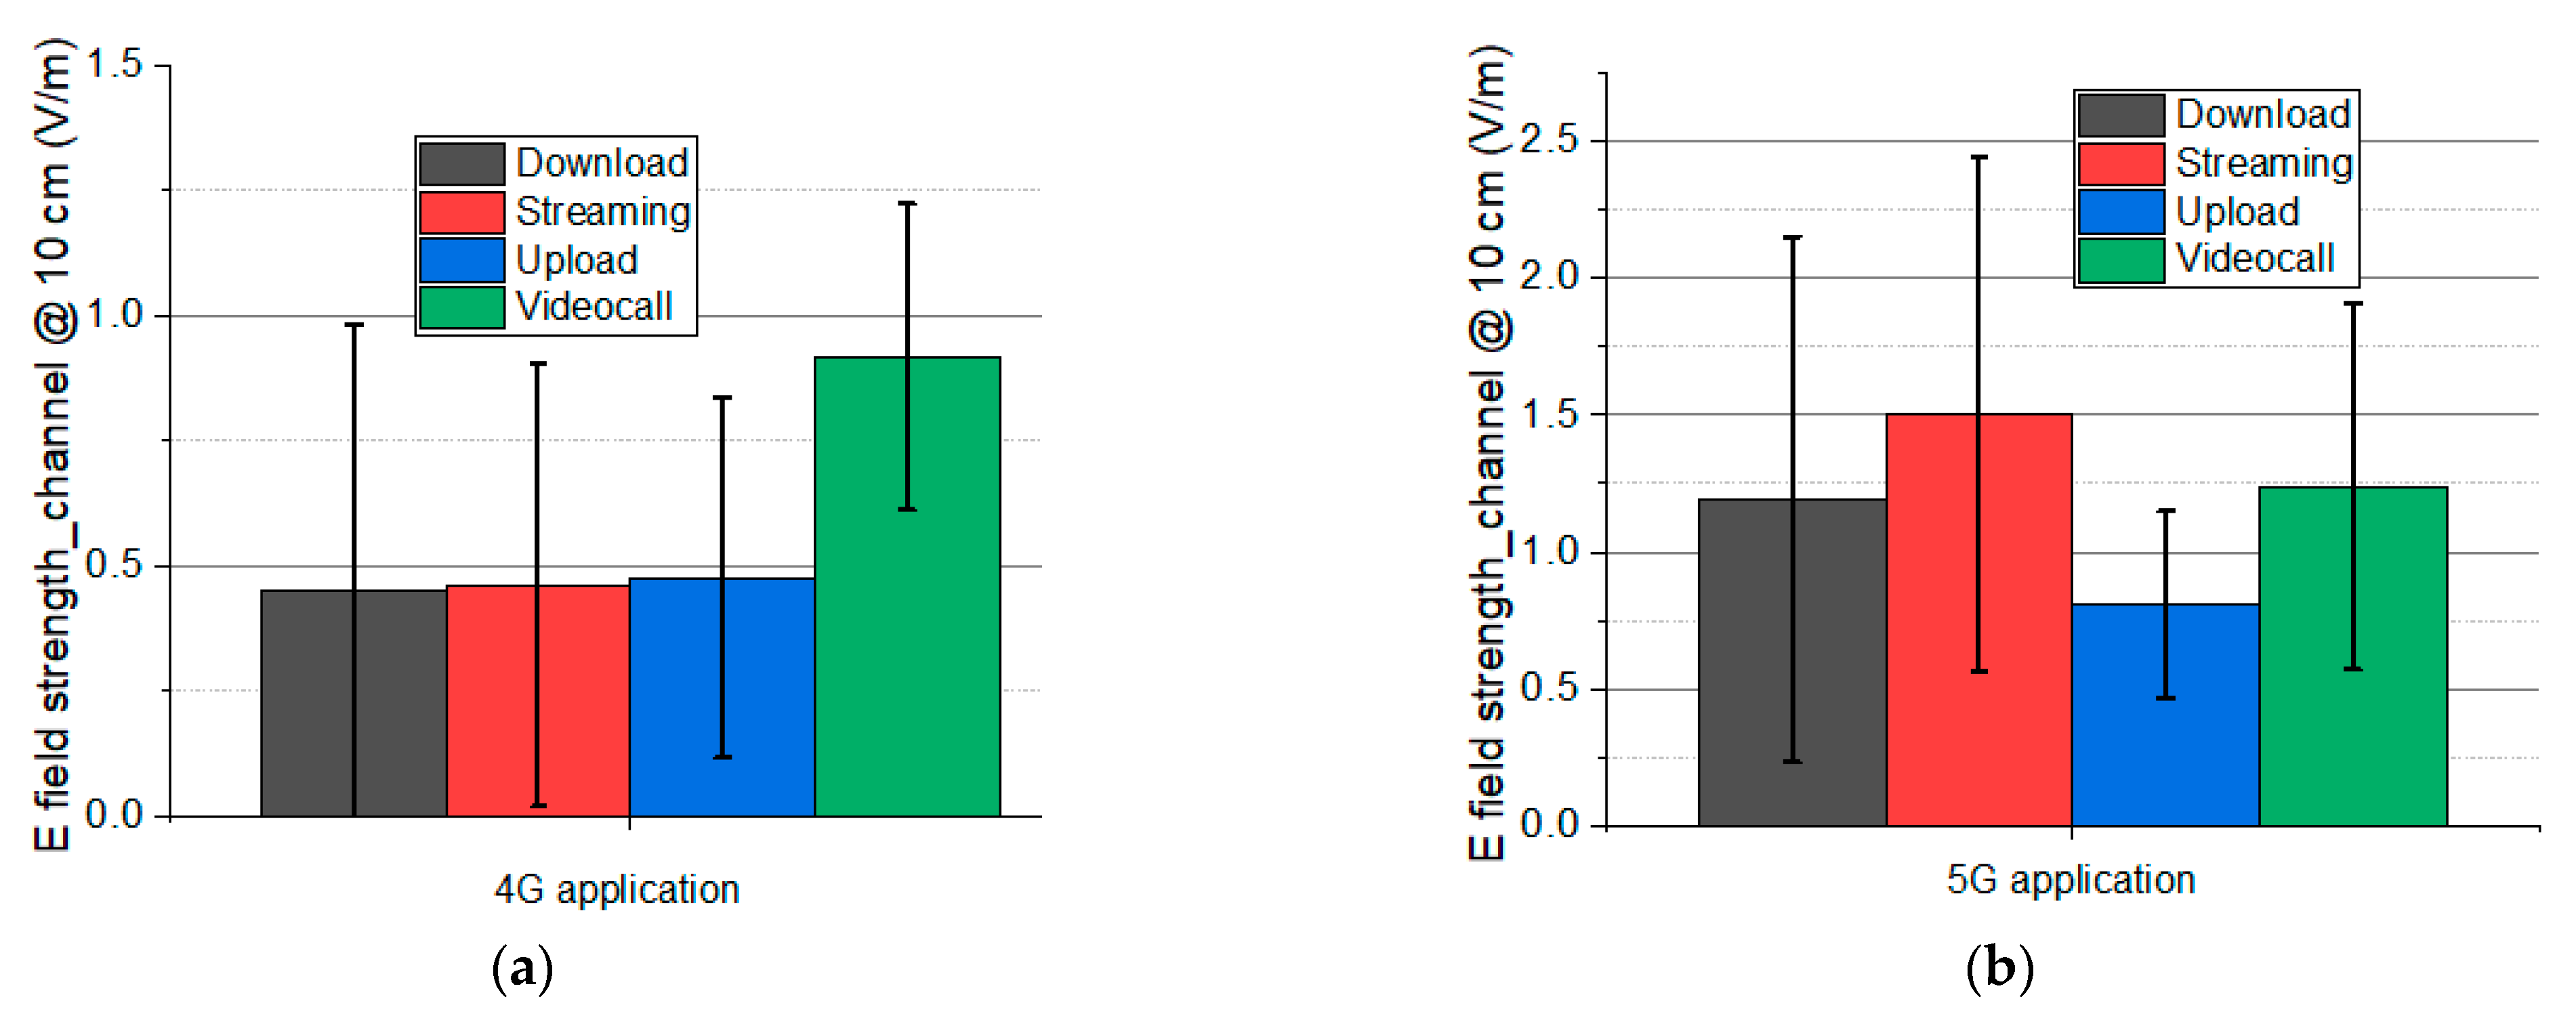
Figure 6 depicts the E-field strengths due to the four mobile applications used in the 4G standard (
Figure 6a) and the 5G standard (
Figure 6b). The general observation is that 5G emissions are stronger than 4G emissions, and the differences between applications are different between the two communication technologies. Standard deviations around the average are the same in both standards, proving the large variability of exposure. In 4G, the largest E-field strength is produced during video calls, while in 5G, it is produced during Internet video streaming. However, one must take into account that the emissions in 4G and 5G used different models of mobile phones. Even if it had been the same model, due to the fact that the phone’s antennas have different gains at the two frequencies, the realistic emitted power could be different.
Reliable assessments of EMF exposure require more sophisticated setups, such as the use of dedicated base stations where the channel power requested by the mobile terminal can be set and controlled or specific software that monitors all transmission parameters on the mobile terminal (e.g., QualiPoc by Rhode and Schwarz). Otherwise, the measurements risk being random numbers.
It is difficult to make a general statement about whether 5G signals in FR1 generally conduct to a higher E-field strength than 4G signals in exactly the same situation, as it depends on a range of factors such as the frequency band, the transmission power, the antenna configuration, and the propagation environment.
That being said, there are some factors that may lead to higher E-field strengths for 5G signals in FR1 compared to 4G signals. For example:
Frequency band: 5G signals in FR1 typically operate at higher frequencies than 4G signals, which may lead to higher E-field strengths due to higher path loss and greater attenuation through obstacles.
Transmission power: 5G technology enables higher transmission power levels compared to 4G, which may lead to higher E-field strengths in some situations.
Antenna configuration: The antenna configuration for 5G is more complex than for 4G, with more antennas and potentially more directional beams, which may lead to higher E-field strengths in certain directions or at certain locations.
On the other hand, there are also factors that may lead to lower E-field strengths for 5G signals in FR1 compared to 4G signals, such as:
Antenna beamforming: 5G technology utilizes advanced beamforming techniques to direct the signal towards the user, which may reduce the overall E-field strength in some directions.
Spectrum sharing: 5G may share spectrum with other services, which may limit the available transmission power and result in lower E-field strengths compared to 4G signals.
Overall, the answer to whether 5G signals in FR1 generally conduct to a higher E-field strength than 4G signals in exactly the same situation is complex and depends on a range of factors, as demonstrated.
3.3. Classification of Mobile Application Emissions in 4G and 5G Networks Based on the YOLO v7 Object Detection Algorithm
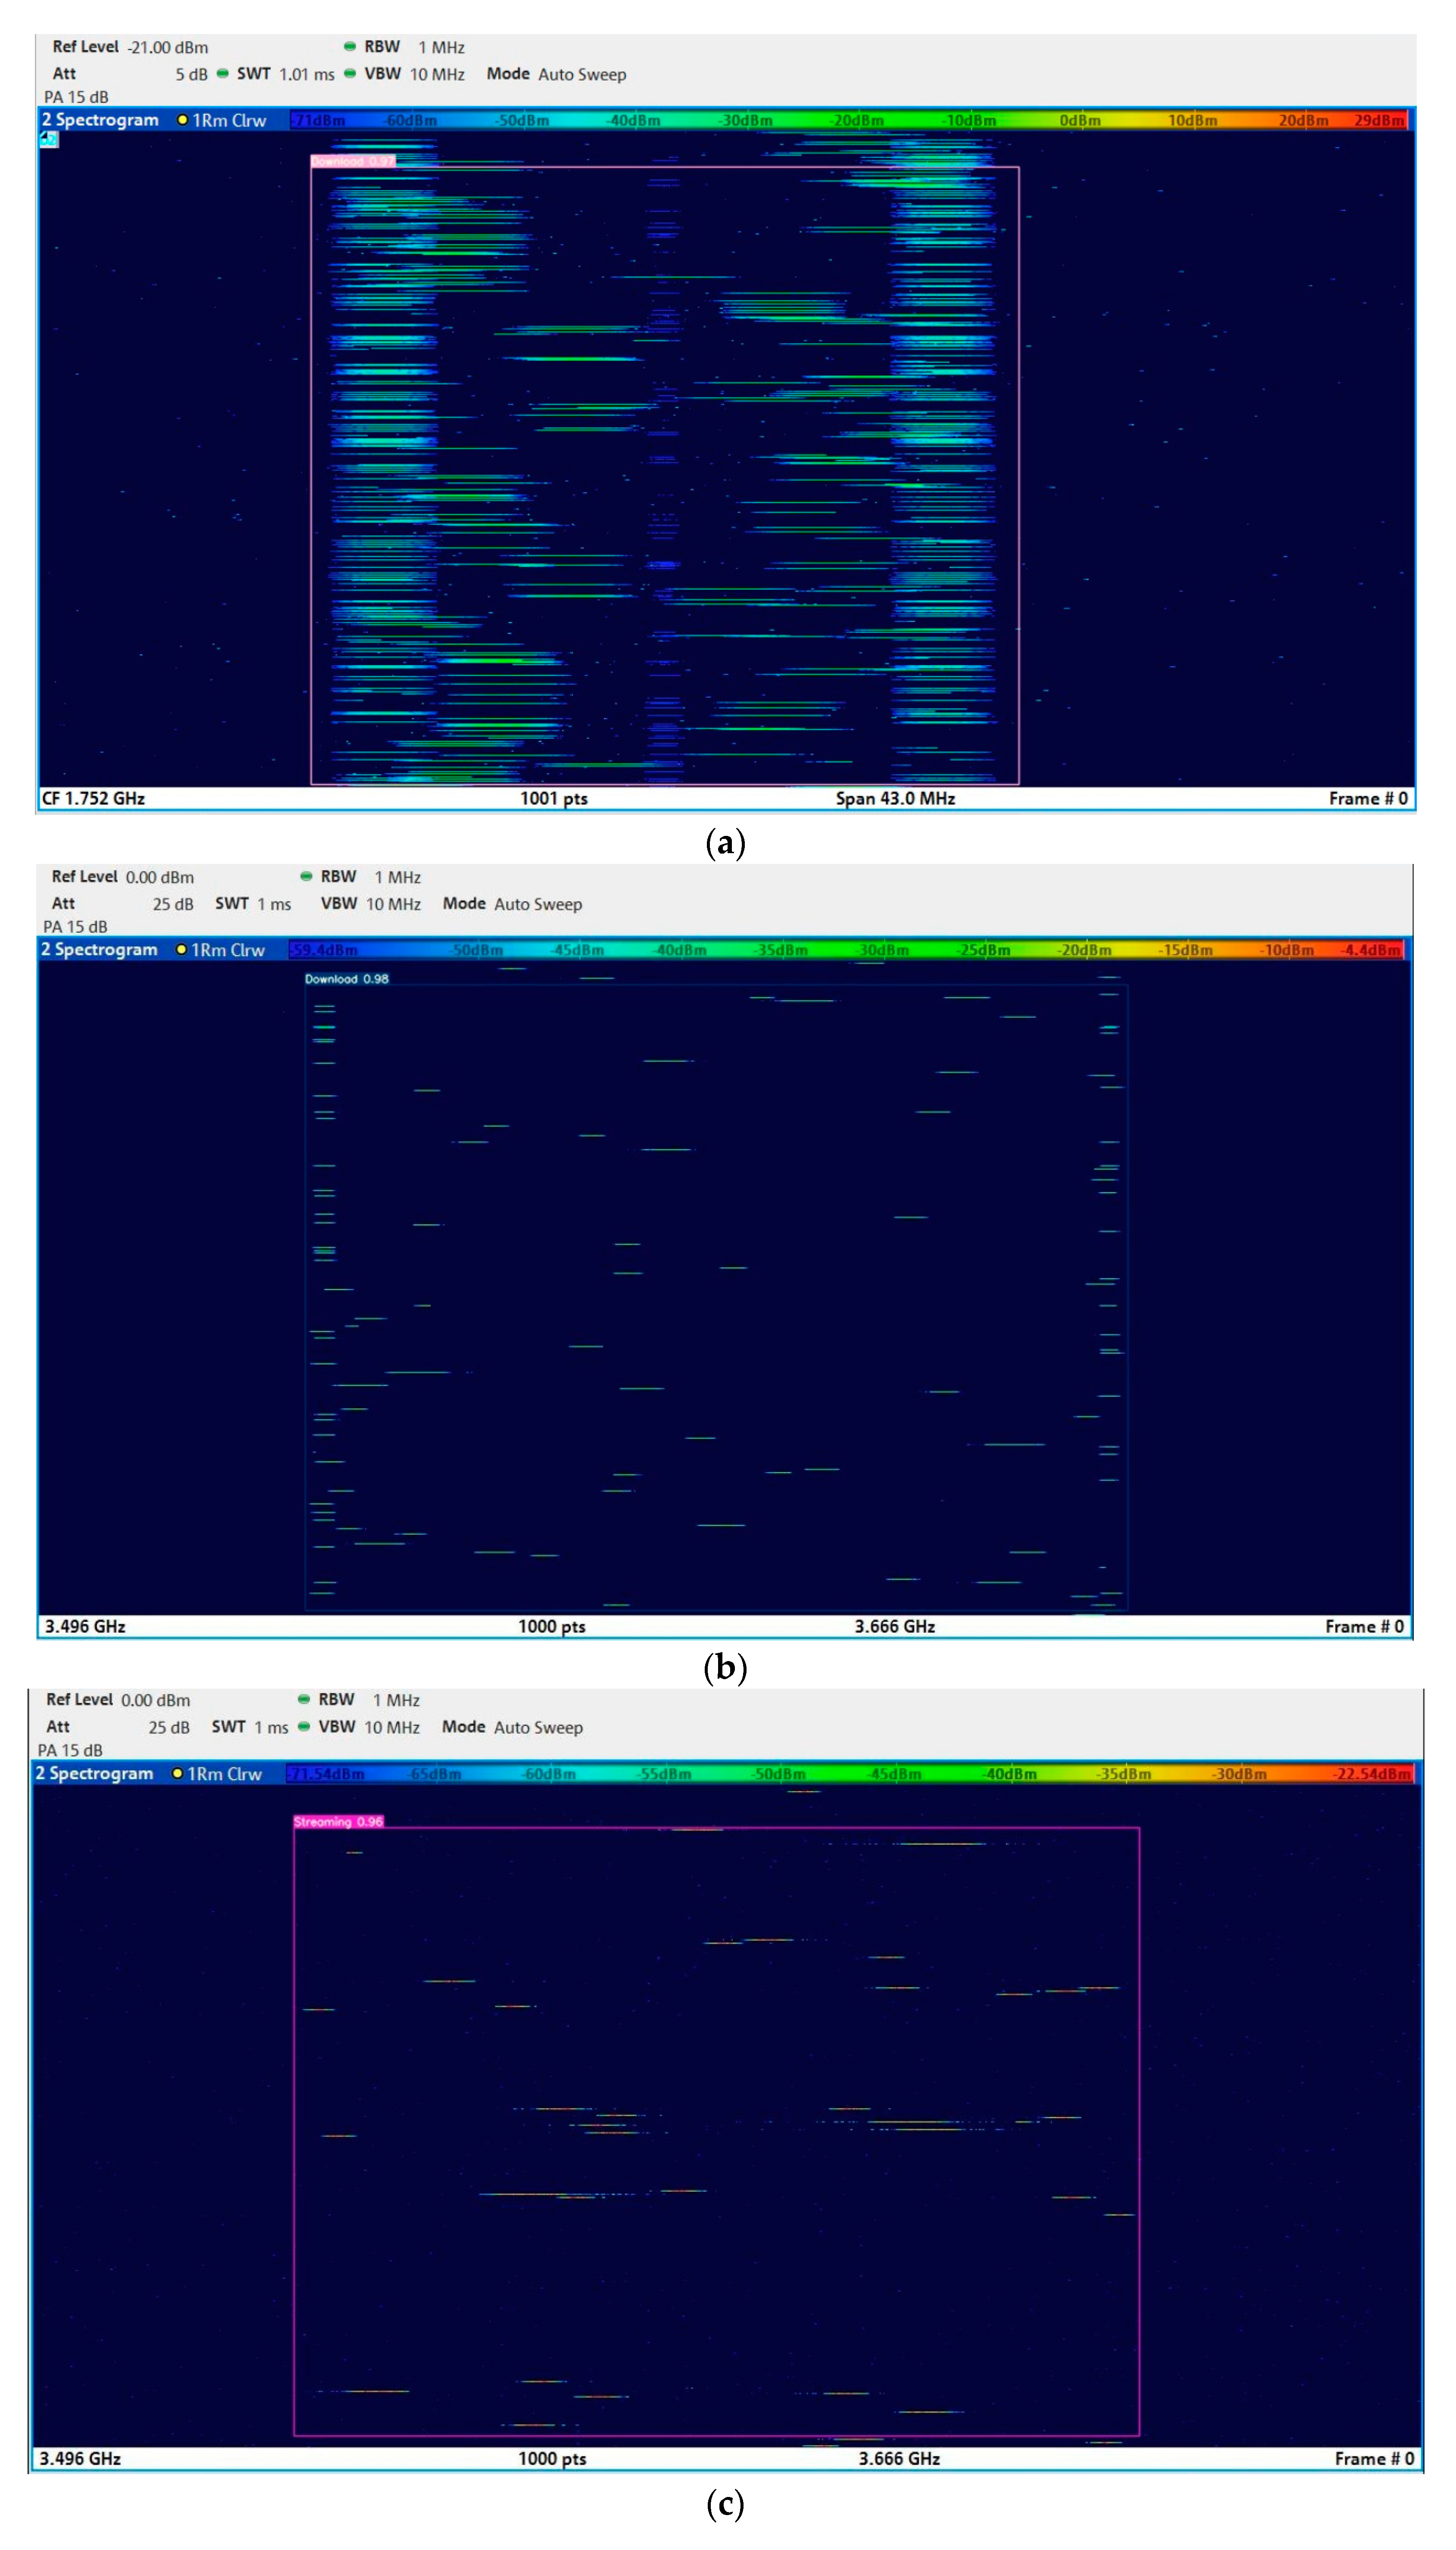
Examples of spectrograms recorded for 4G and 5G signals are given in
Figure 7a–e.
Figure 7a,b depict the visual conformation of a spectrogram corresponding to file download in 4G (
Figure 7a) and in 5G (
Figure 7b). Notable differences are observed. In addition to the detailed differences in modulation schemes, the main distinction between 4G and 5G signals lies in the adopted duplexing mode (FDD vs. TDD), resulting in a noticeable difference in the resources allocated to uplink and downlink. This difference is reflected in the spectrogram of a 5G signal compared to a 4G signal.
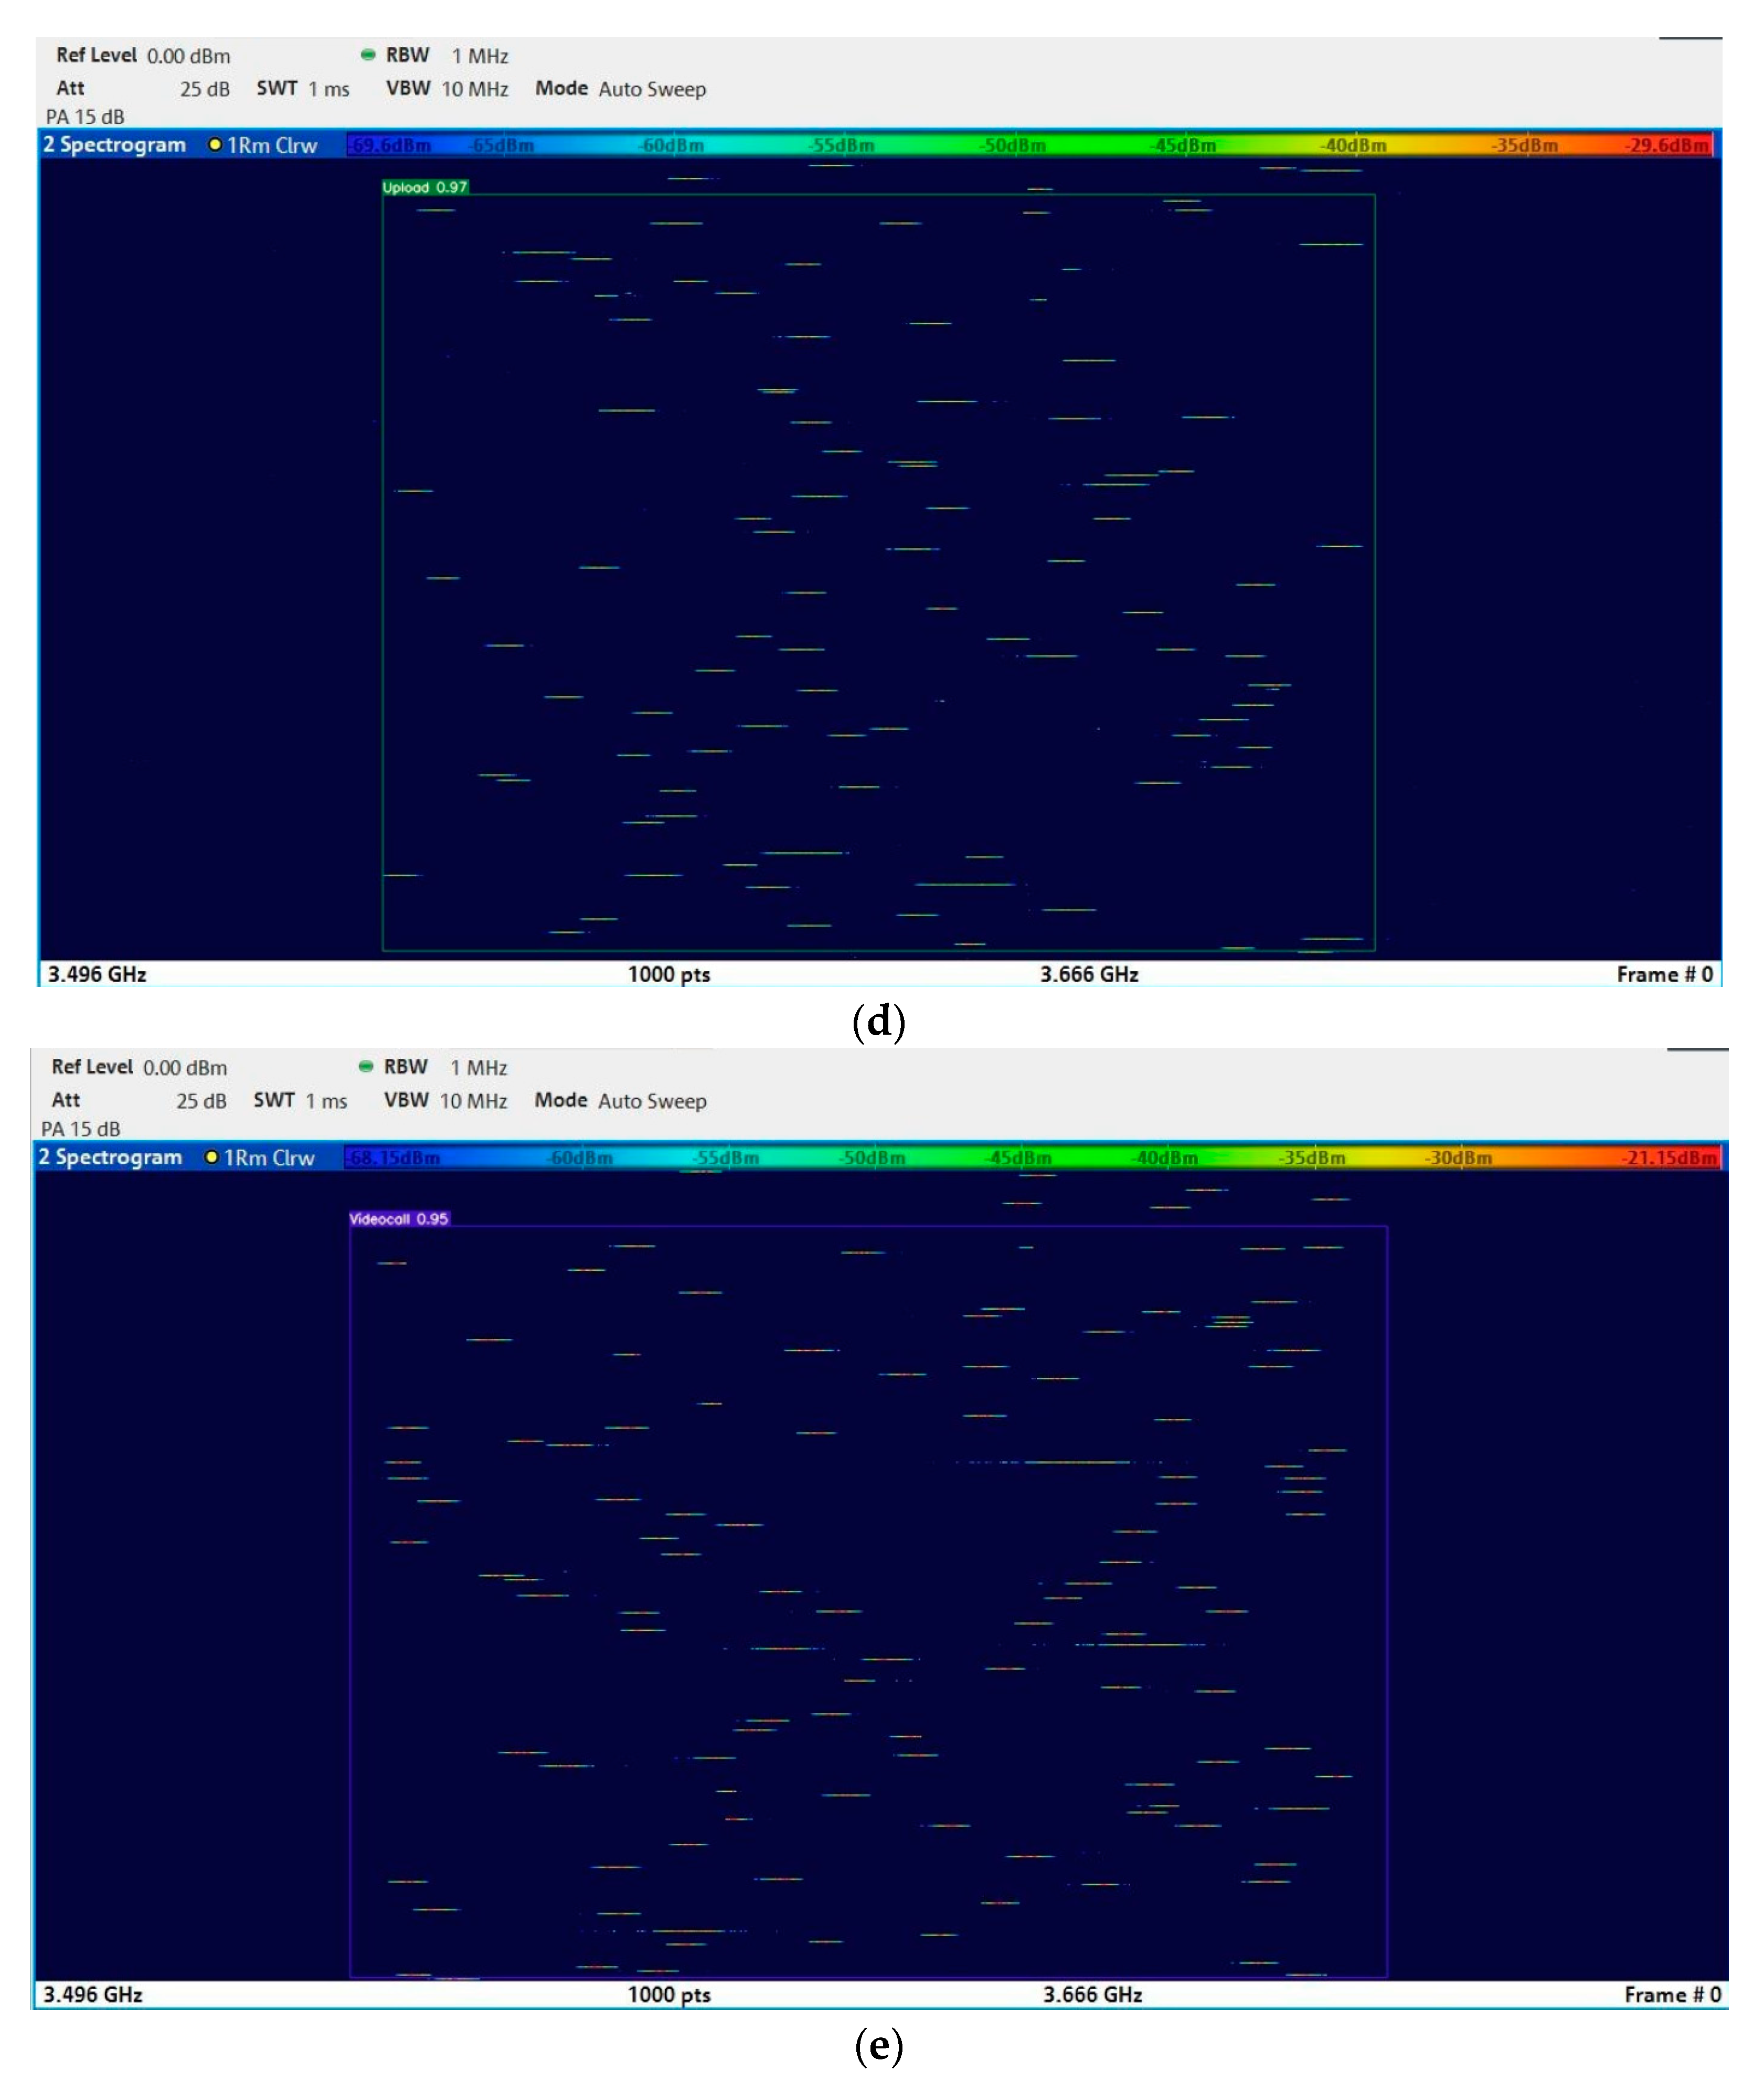
Figure 7c–e show examples of 5G spectrograms corresponding to Internet streaming, file uploads, and video calls, respectively. File upload and video call spectrograms seem very similar visually. In QAM, the spectrogram of the signal shows a set of spectral lines at equally spaced frequencies, corresponding to the different phase and amplitude states of the modulated signal. The number and spacing of these lines depend on the modulation order, with higher-order QAM schemes having more lines. In OFDM, the spectrogram of the signal shows a set of closely spaced subcarriers, each carrying a narrowband modulated signal. The spacing and number of subcarriers would depend on the system parameters, such as the carrier frequency, the symbol rate, and the guard interval.
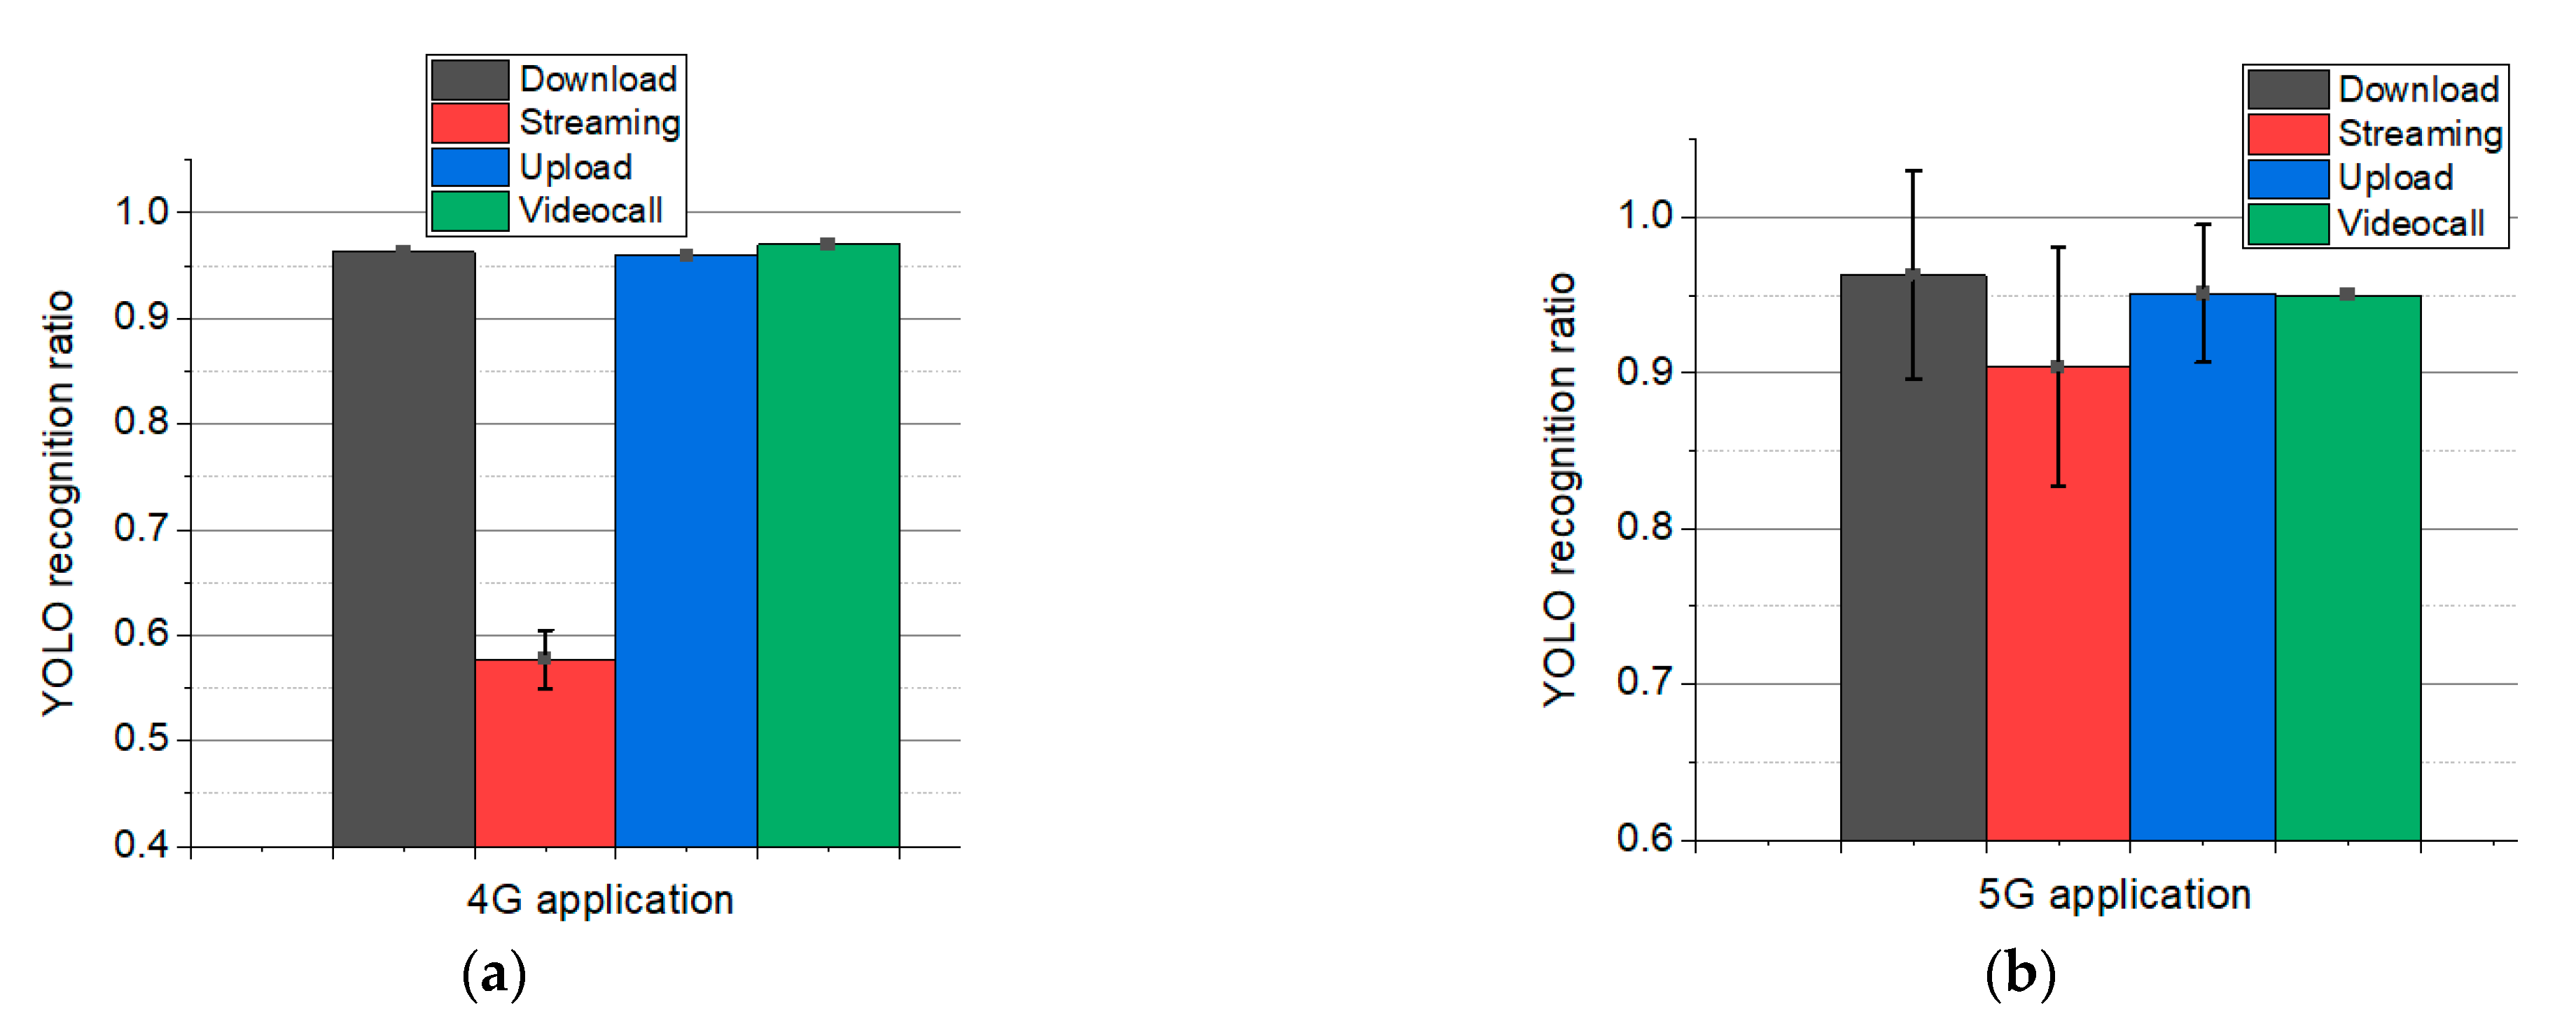
After the Yolo v7 algorithm was trained on 300 spectrograms and 15 spectrograms were used for validation, it ran on the 10 spectrograms per mobile application for identification and classification of the respective emission. The rate of success, measured by recognition rate, was very high, generally higher than 95%, with one single exception: 4G Internet video streaming had a very low recognition rate of only 57%, as can be seen in
Figure 8a. Anyway, Internet video streaming was the hardest to recognize in 5G, too; however, the rate of success was higher, at 90%. Uncertainties were generally larger for 5G emissions (
Figure 8b) than for 4G, and they are indicated by error bar lengths. It results in the fact that, with proper manual settings, the prepared spectrograms are very successfully classified by the YOLO v7 algorithm, even if the training and validation were made on a reduced number of samples. Therefore, YOLO v7 proved to be a very powerful algorithm in recognition of the features of power spectrum variability.
4. Conclusions
In this present work, we aim to quantify the time variability of emissions in the proximity of a mobile phone connected to either a 4G or a 5G-FR1 network when using four different mobile applications. The central objective was to provide knowledge on human exposure dynamics that completes the dosimetric studies necessary to describe the potential biological effects.
The main contribution of this study to current knowledge belongs to the topics of the effects of EMF exposure on humans that are not limited to induced heating, while non-thermal effects remain subjects of debate and investigation. To gain a deeper understanding of this aspect, new metrics and methodologies need to be adopted. The direction proposed in this work, which includes peak exposure analysis and not just time-averaged analysis, aligns well with this goal.
A supplementary benefit is the possibility to discern between exposure dynamics corresponding to one specific mobile application based on the capability of a real-time detection algorithm to successfully classify the emission type.
The proposed methodology is not intended to facilitate a comparison of the general characteristics between 4G and 5G signals. Instead, its purpose is to provide a means for analyzing specific real-life exposure conditions that may vary based on multiple parameters.
Synthetically, our results showed that:
Electric field strengths in the air at 10 cm from the phone were higher for 5G-FR1 emissions than for 4G, on average by 60%. None of the values exceeded human health and safety levels. The highest difference between technologies corresponded to Internet video streaming emissions, where 5G field strength was three times higher than 4G.
4G and 5G-FR1 amplitude probability density distributions differ; 4G traces depend much more on the type of mobile application used, while 5G traces are more similar one to another and more independent of the mobile application. The same probability range of power level distribution was covered by a larger window of power values in 5G than in 4G.
Crest factors were higher for 5G-FR1 emissions than for 4G emissions; the highest difference (almost double) evolved during file download applications, while the lowest difference was observed during Internet video streaming.
The prevalence of the highest power levels (superior tail emissions) appeared much more frequent for 5G-FR1 emissions than for 4G, and a difference of as much as 9.5 dB over mean power was encountered in 5G versus 4G emissions.
The recorded spectrograms emphasized peculiarities that have been excellently captured and valorized by the YOLO v7 deep learning algorithm. Practically, excellent recognition and classification rates were obtained for each technology and each category of mobile application with a minimum of training.
Overall, the contribution of the present approach consists in the provision of an exposimetric tool that underlines the differences in amplitude-time profiling of a user’s exposure when running various applications on the mobile phone in two different mobile communication technologies. Due to the limitations of the methodology employed, the data presented cannot be considered to be of total generality. However, realistic exposure and time-variability analysis need further investigation in varied situations.


