

Validation of Aerobic Capacity (VO2max) and Lactate Threshold in Wearable Technology for Athletic Populations


Abstract
1. Introduction
2. Materials and Methods
2.1. Study Design
2.2. Participants
2.3. Data Analysis
3. Results
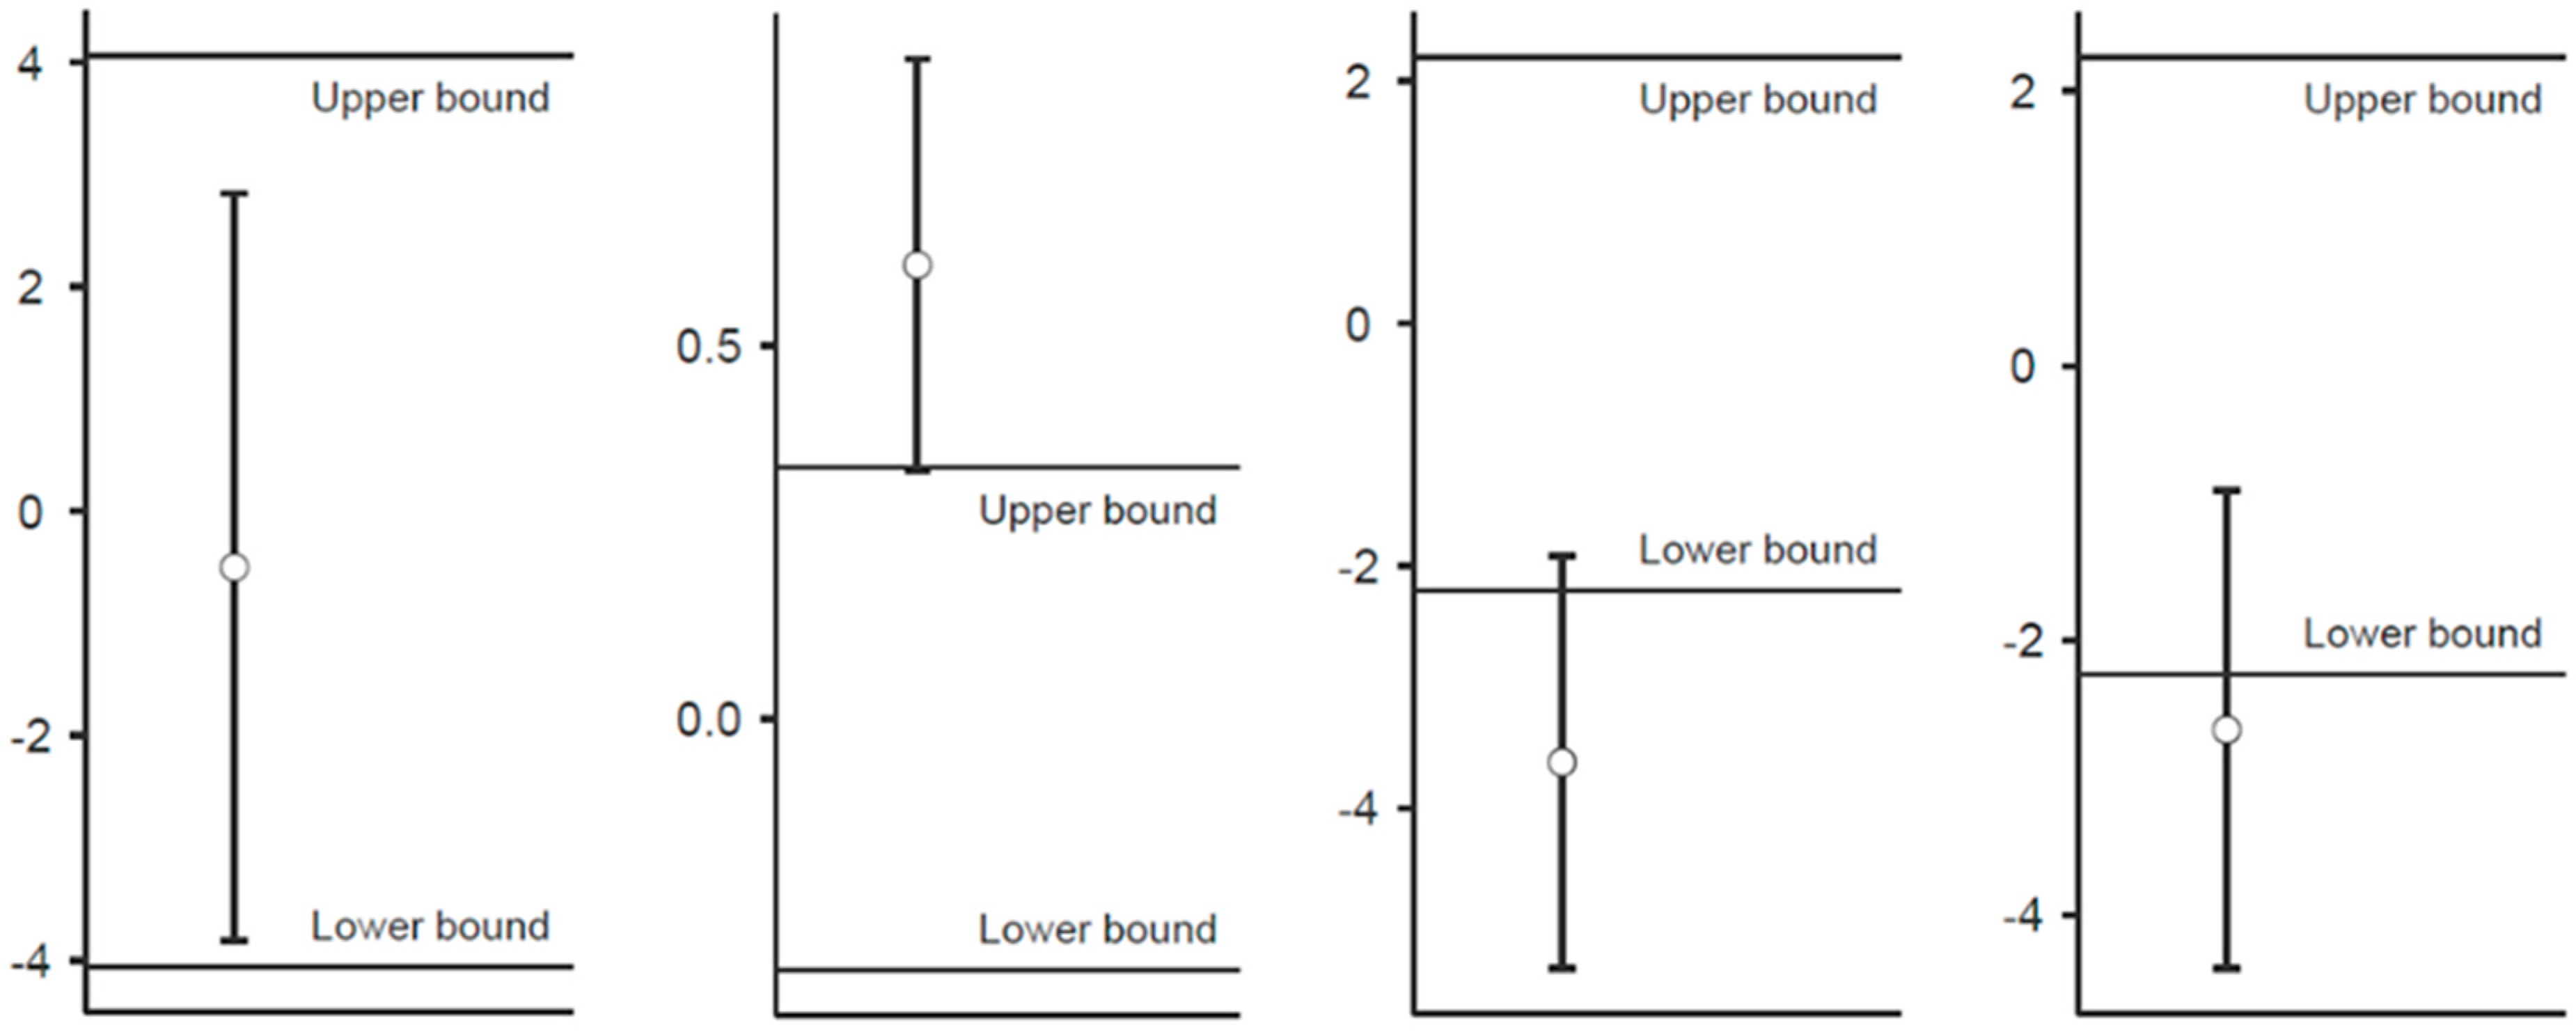
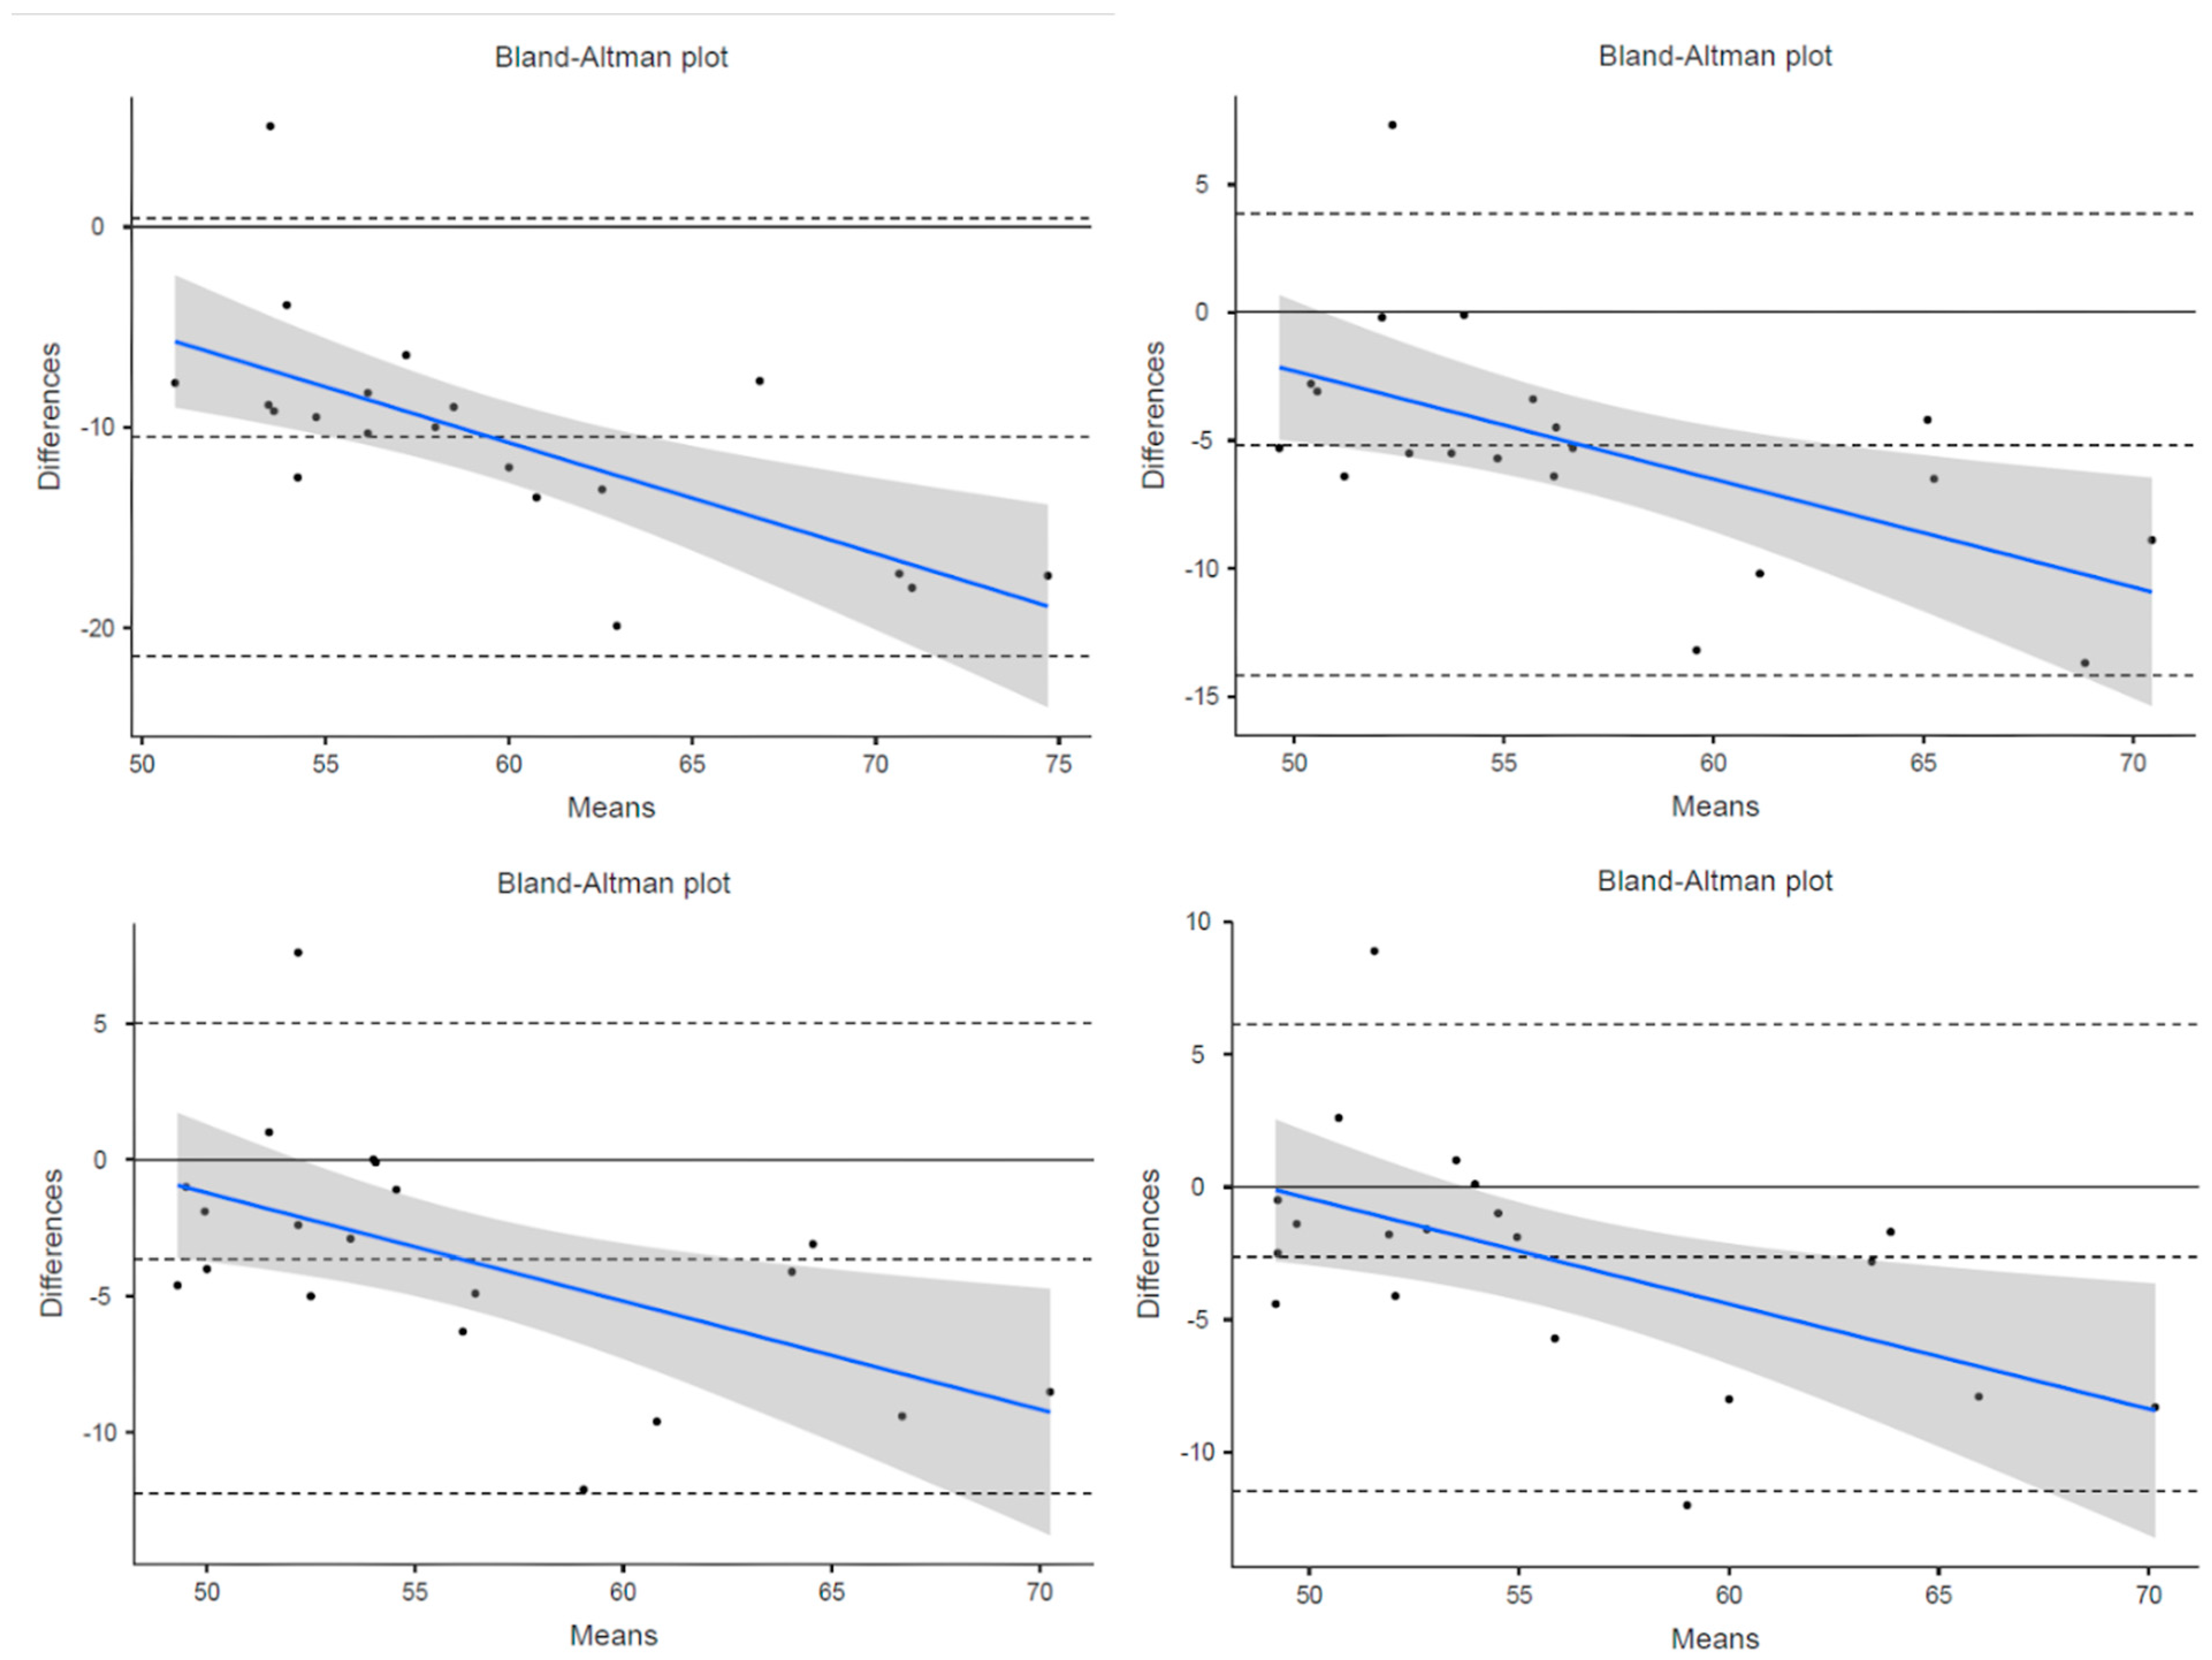
3.1. VO2max
3.2. Lactate Threshold
4. Discussion
Limitations
5. Conclusions
Author Contributions
Funding
Institutional Review Board Statement
Informed Consent Statement
Data Availability Statement
Conflicts of Interest
References
- Bassett, D.R.; Howley, E.T. Limiting factors for maximum oxygen uptake and determinants of endurance performance. Med. Sci. Sports Exerc. 2000, 32, 70–84. [Google Scholar] [CrossRef]
- Boullosa, D.; Esteve-Lanao, J.; Casado, A.; Peyré-Tartaruga, L.A.; Gomes Da Rosa, R.; Del Coso, J. Factors Affecting Training and Physical Performance in Recreational Endurance Runners. Sports 2020, 8, 35. [Google Scholar] [CrossRef] [PubMed]
- Joyner, M.J. Physiological limiting factors and distance running: Influence of gender and age on record performances. Exerc. Sport Sci. Rev. 1993, 21, 103–134. [Google Scholar] [CrossRef] [PubMed]
- Kenney, W.L.; Wilmore, J.H.; Costill, D.L. Physiology of Sport and Exercise, 5th ed.; Human Kinetics: Champaign, IL, USA, 2011; ISBN 978-0-7360-9409-2. [Google Scholar]
- Grant, J.A.; Joseph, A.N.; Campagna, P.D. The prediction of VO2max: A comparison of 7 indirect tests of aerobic power. J. Strength Cond. Res. 1999, 13, 346–352. [Google Scholar] [CrossRef]
- Metaxas, T.I.; Koutlianos, N.A.; Kouidi, E.J.; Deligiannis, A.P. Comparative study of field and laboratory tests for the evaluation of aerobic capacity in soccer players. J. Strength Cond. Res. 2005, 19, 79–84. [Google Scholar]
- Zwiren, L.D.; Freedson, P.S.; Ward, A.; Wilke, S.; Rippe, J.M. Estimation of VO2max: A Comparative Analysis of Five Exercise Tests. Res. Q. Exerc. Sport 1991, 62, 73–78. [Google Scholar] [CrossRef]
- Thompson, W.R. Worldwide Survey of Fitness Trends for 2016. ACSM’S Health Fit. J. 2015, 19, 9–18. [Google Scholar] [CrossRef]
- Thompson, W.R. Worldwide Survey of Fitness Trends for 2022. ACSM’S Health Fit. J. 2022, 26, 11–20. [Google Scholar] [CrossRef]
- Thompson, W.R. Worldwide Survey of Fitness Trends for 2017. ACSM’S Health Fit. J. 2016, 20, 8–17. [Google Scholar] [CrossRef]
- Thompson, W.R. Worldwide Survey of Fitness Trends for 2018: The CREP Edition. ACSM’s Health Fit. J. 2017, 21, 10–19. [Google Scholar] [CrossRef]
- Thompson, W.R. Worldwide survey of fitness trends for 2019. ACSM’s Health Fit. J. 2018, 22, 10–17. [Google Scholar] [CrossRef]
- Thompson, W.R. Worldwide Survey of Fitness Trends for 2020. ACSM’S Health Fit. J. 2019, 23, 10–18. [Google Scholar] [CrossRef]
- Thompson, W.R. Worldwide Survey of Fitness Trends for 2021. ACSM’S Health Fit. J. 2021, 25, 10–19. [Google Scholar] [CrossRef]
- Insight on Global Wearable Technology Market Size and Share. Available online: https://www.globenewswire.com/news-release/2022/04/13/2421597/0/en/Insights-on-Global-Wearable-Technology-Market-Size-Share-to-Surpass-USD-380-5-Billion-by-2028-Exhibit-a-CAGR-of-18-5-Industry-Analysis-Trends-Value-Growth-Opportunities-Segmentatio.html (accessed on 14 July 2022).
- Carrier, B.; Barrios, B.; Jolley, B.D.; Navalta, J.W. Validity and Reliability of Physiological Data in Applied Settings Measured by Wearable Technology: A Rapid Systematic Review. Technologies 2020, 8, 70. [Google Scholar] [CrossRef]
- Lu, L.; Zhang, J.; Xie, Y.; Gao, F.; Xu, S.; Wu, X.; Ye, Z. Wearable Health Devices in Health Care: Narrative Systematic Review. JMIR mHealth uHealth 2020, 8, e18907. [Google Scholar] [CrossRef] [PubMed]
- Clermont, C.A.; Benson, L.C.; Edwards, W.B.; Hettinga, B.A.; Ferber, R. New considerations for wearable technology data: Changes in running bio-mechanics during a marathon. J. Appl. Biomech. 2019, 35, 401–409. [Google Scholar] [CrossRef]
- Favorov, O.; Kursun, O.; Challener, T.; Cecchini, A.; McCulloch, K.L. Wearable sensors detect movement differences in the Portable Warrior Test of Tac-tical Agility after mTBI in service members. Mil. Med. 2021, 188, e637–e645. [Google Scholar] [CrossRef]
- Sperlich, B.; Aminian, K.; Düking, P.; Holmberg, H.-C. Editorial: Wearable Sensor Technology for Monitoring Training Load and Health in the Athletic Population. Front. Physiol. 2020, 10, 1520. [Google Scholar] [CrossRef]
- Aerobic Fitness Level (VO2max) Estimation–Firstbeat White Paper. Available online: https://www.firstbeat.com/en/aerobic-fitness-level-vo%e2%82%82max-estimation-firstbeat-white-paper-2/ (accessed on 14 July 2022).
- Fitness Level (VO2max). Available online: https://www.firstbeat.com/en/science-and-physiology/fitness-level/ (accessed on 14 July 2022).
- Lactate Threshold. Available online: https://www.firstbeatanalytics.com/en/features/lactate-threshold/ (accessed on 14 July 2022).
- Dellaserra, C.L.; Gao, Y.; Ransdell, L. Use of integrated technology in team sports: A review of opportunities, challenges, and future directions for athletes. J. Strength Cond. Res. 2014, 28, 556–573. [Google Scholar] [CrossRef]
- Borges, N.R.; Driller, M. Wearable Lactate Threshold Predicting Device is Valid and Reliable in Runners. J. Strength Cond. Res. 2016, 30, 2212–2218. [Google Scholar] [CrossRef]
- Farzam, P.; Starkweather, Z.; Franceschini, M.A. Validation of a novel wearable, wireless technology to estimate oxygen levels and lactate threshold power in the exercising muscle. Physiol. Rep. 2018, 6, e13664. [Google Scholar] [CrossRef] [PubMed]
- Gillan, L.; Teerinen, T.; Suhonen, M.; Kivimäki, L.; Alastalo, A. Simultaneous multi-location wireless monitoring of sweat lactate trends. Flex. Print. Electron. 2021, 6, 034003. [Google Scholar] [CrossRef]
- Seki, Y.; Nakashima, D.; Shiraishi, Y.; Ryuzaki, T.; Ikura, H.; Miura, K.; Suzuki, M.; Watanabe, T.; Nagura, T.; Matsumato, M.; et al. A novel device for detecting anaerobic threshold using sweat lactate during exercise. Sci. Rep. 2021, 11, 4929. [Google Scholar] [CrossRef] [PubMed]
- Sun, F.; Yi, C.; Li, W.; Li, Y. A wearable H-shirt for exercise ECG monitoring and individual lactate threshold computing. Comput. Ind. 2017, 92-93, 1–11. [Google Scholar] [CrossRef]
- Parak, J.; Uuskoski, M.; Machek, J.; Korhonen, I. Estimating Heart Rate, Energy Expenditure, and Physical Performance with a Wrist Photoplethysmographic Device During Running. JMIR mHealth uHealth 2017, 5, e97. [Google Scholar] [CrossRef]
- Passler, S.; Bohrer, J.; Blöchinger, L.; Senner, V. Validity of wrist-worn activity trackers for estimating VO2max and energy expendi-ture. Int. J. Environ. Res. Public Health 2019, 16, 3037. [Google Scholar] [CrossRef]
- Carrier, B.; Creer, A.; Williams, L.R.; Holmes, T.M.; Jolley, B.D.; Dahl, S.; Weber, E.; Standifird, T. Validation of Garmin Fenix 3 HR Fitness Tracker Biomechanics and Metabolics (VO2max). J. Meas. Phys. Behav. 2020, 3, 331–337. [Google Scholar] [CrossRef]
- Welk, G.J.; Bai, Y.; Lee, J.-M.; Godino, J.; Saint-Maurice, P.F.; Carr, L. Standardizing Analytic Methods and Reporting in Activity Monitor Validation Studies. Med. Sci. Sports Exerc. 2019, 51, 1767–1780. [Google Scholar] [CrossRef]


| Fēnix 6 VO2max Estimate | Lab VO2max—4 Breath Avg | Lab VO2max—15 Sec Avg | Lab VO2max—30 Sec Avg | Lab VO2max—1 Min Avg | |
|---|---|---|---|---|---|
| Mean (mL/kg/min) | 54.00 | 64.73 | 59.43 | 57.88 | 56.89 |
| Standard Deviation | 5.18 | 8.83 | 7.80 | 7.62 | 7.60 |
| MAPE | 16.91% | 10.04% | 7.67% | 6.85% | |
| Pearson Correlation | 0.81 | 0.82 | 0.82 | 0.81 | |
| Lin’s Concordance | 0.34 | 0.58 | 0.67 | 0.70 | |
| Bland–Altman Bias | −10.485 (−13.09, −7.88) | −5.18 (−7.33, −3.03) | −3.62 (−5.68, −1.56) | −2.65 (−4.75, −0.55) | |
| TOST Test (Upper) | <0.001 | <0.001 | <0.001 | <0.001 | |
| TOST Test (Lower) | 1.00 | 0.994 | 0.917 | 0.653 |
| Fēnix6 LT Estimate (mph) | Lab LT (mph) | Lab OBLA (mph) | Fēnix6 HR @ LT (bpm) | Lab HR @ LT (bpm) | |
|---|---|---|---|---|---|
| Mean | 7.99 | 8.44 | 8.60 | 174.44 | 173.94 |
| Standard Deviation | 1.04 | 1.35 | 1.33 | 4.79 | 8.87 |
| MAPE | 7.52% | 8.20% | 3.60% | ||
| Pearson Correlation | 0.87 | 0.87 | 0.42 | ||
| Lin’s Concordance | 0.79 | 0.74 | 0.35 | ||
| Bland–Altman Bias | −0.45 (−0.79, −0.12) | −0.61 (−0.94, −0.27) | 0.5 (−3.54, 4.54) | ||
| TOST Test (Upper) | 0.762 | 0.947 | 0.015 | ||
| TOST Test (Lower) | <0.001 | <0.001 | 0.040 |
Disclaimer/Publisher’s Note: The statements, opinions and data contained in all publications are solely those of the individual author(s) and contributor(s) and not of MDPI and/or the editor(s). MDPI and/or the editor(s) disclaim responsibility for any injury to people or property resulting from any ideas, methods, instructions or products referred to in the content. |
© 2023 by the authors. Licensee MDPI, Basel, Switzerland. This article is an open access article distributed under the terms and conditions of the Creative Commons Attribution (CC BY) license (https://creativecommons.org/licenses/by/4.0/).
Share and Cite
Carrier, B.; Helm, M.M.; Cruz, K.; Barrios, B.; Navalta, J.W. Validation of Aerobic Capacity (VO2max) and Lactate Threshold in Wearable Technology for Athletic Populations. Technologies 2023, 11, 71. https://doi.org/10.3390/technologies11030071
Carrier B, Helm MM, Cruz K, Barrios B, Navalta JW. Validation of Aerobic Capacity (VO2max) and Lactate Threshold in Wearable Technology for Athletic Populations. Technologies. 2023; 11(3):71. https://doi.org/10.3390/technologies11030071
Chicago/Turabian StyleCarrier, Bryson, Macy M. Helm, Kyle Cruz, Brenna Barrios, and James W. Navalta. 2023. "Validation of Aerobic Capacity (VO2max) and Lactate Threshold in Wearable Technology for Athletic Populations" Technologies 11, no. 3: 71. https://doi.org/10.3390/technologies11030071
APA StyleCarrier, B., Helm, M. M., Cruz, K., Barrios, B., & Navalta, J. W. (2023). Validation of Aerobic Capacity (VO2max) and Lactate Threshold in Wearable Technology for Athletic Populations. Technologies, 11(3), 71. https://doi.org/10.3390/technologies11030071