1. Introduction
Polymers have become an indispensable material in our daily life because of their lightness and durability [
1,
2]. Porous polymers are also an important material; they are lightweight due to the pores, and they can be used to absorb liquid, filter liquid or gas, and absorb shocks and sounds [
3,
4,
5]. In addition, porous polymers can be used as heat insulators [
6]. In general, there are several methods to generate porous polymer materials, such as using physical blowing agents [
7], using templates [
8], and the freeze-drying method [
9]. For methods that include the use of gases, one mixes high-pressure gases to generate porous polymers during injection molding [
10,
11].
The carbon dioxide-assisted polymer compression (CAPC) method, which uses CO
2 to plasticize and bond fiber polymers at room temperature, is a fast and simple method for producing porous polymers that fit the molds [
12]. This method features the elimination of the need for a heater as it can be applied at room temperature. In addition, as the method uses vapor-pressure CO
2, it only requires a ball valve to introduce the gas, which eliminates the need for a pump. Compared to the equipment configuration of a typical supercritical fluid process, it is very simple; it only needs a press machine as the main equipment, with no pumps or heaters.
Fibrous polymers are used as the raw material in this method. The use of fibrous-polymer sheets is advantageous as a drug-loaded porous material can be easily prepared from it, for example, loading the drug in the center of a sheet in advance [
13] or by placing the drug in the center of a fiber sheet and putting it in a mold [
14].
For the raw material of fibers, it is better to use nonwoven fabrics due to their mass production and low price [
15,
16]. When the fiber sheets are laminated, the fibers are spread in the direction of the fiber sheet and the overlapping portions of the fibers are crimped together by point bonding. In this case, the resulting porous body will have anisotropic properties in the direction of fiber layering and its perpendicular direction. The anisotropic properties include both peel strength and puncture strength. These anisotropic properties are also desirable for filter applications.
The peel and penetration resistance behaviors and the filtering properties have already been investigated [
17,
18]. Although scanning electron microscopy has been used to observe porous materials, the observation was limited to the surface. In order to understand the three-dimensional shape, samples were cut and immersed in liquid nitrogen to observe the cross-section, but the effect of cutting on the cross-section can lead to unreliable results.
The relationship between the structure and properties of porous materials made of fibers has been extensively investigated [
19,
20]. In applications where liquids and gases are required to permeate, the void structure of the porous material plays a crucial role, and this information is necessary to analyze the flow within the porous material. Products containing powder in their center have been successfully fabricated using the CAPC method [
14]. By applying this technology, it is possible to create tablets with a certain amount of drug loaded in their center. When considering the sustained release of a drug from a tablet with a drug-loaded center, the anisotropy of permeation affects the rate of sustained release from the top, bottom, and side surfaces, and this is essential for tablet design.
This study aims to quantify the anisotropy of permeation and interpret its relationship to porosity in terms of structure. The anisotropy was quantified by conducting dye solution permeation experiments and calculating the aspect ratio of the vertical and horizontal permeation distances of the permeation area. A three-dimensional structure was obtained using X-ray computed tomography (X-ray CT). Since the anisotropy is a result of fiber orientation, it was hypothesized that an increase in the number of oriented fibers per unit volume would increase the anisotropy. This study tests this hypothesis.
2. Materials and Methods
The TK3 poly(ethylene terephthalate) (CAS RN: 25038-59-9) pellets manufactured by Bell Polyester Products, Inc. (Houfu, Japan) were processed into a nonwoven fabric by the melt-blowing method [
21] at Nippon Nozzle Co. Ltd. (Kobe, Japan). The nonwoven fabric was fabricated at a basis weight of 30 g/m
2, with an average fiber diameter of 8 μm. The nonwoven fabric was punched out to 18 mm in diameter using a punch, and the sample sets of 80 (0.637 g), 100 (0.796 g), 120 (0.956 g), 140 (1.115 g), and 160 sheets (1.274 g) were prepared for the permeation tests. In addition, the sample sets of 8 (0.062 g), 10 (0.078 g), 12 (0.093 g), 14 (0.109 g), and 16 (0.125 g) were prepared for X-ray CT.
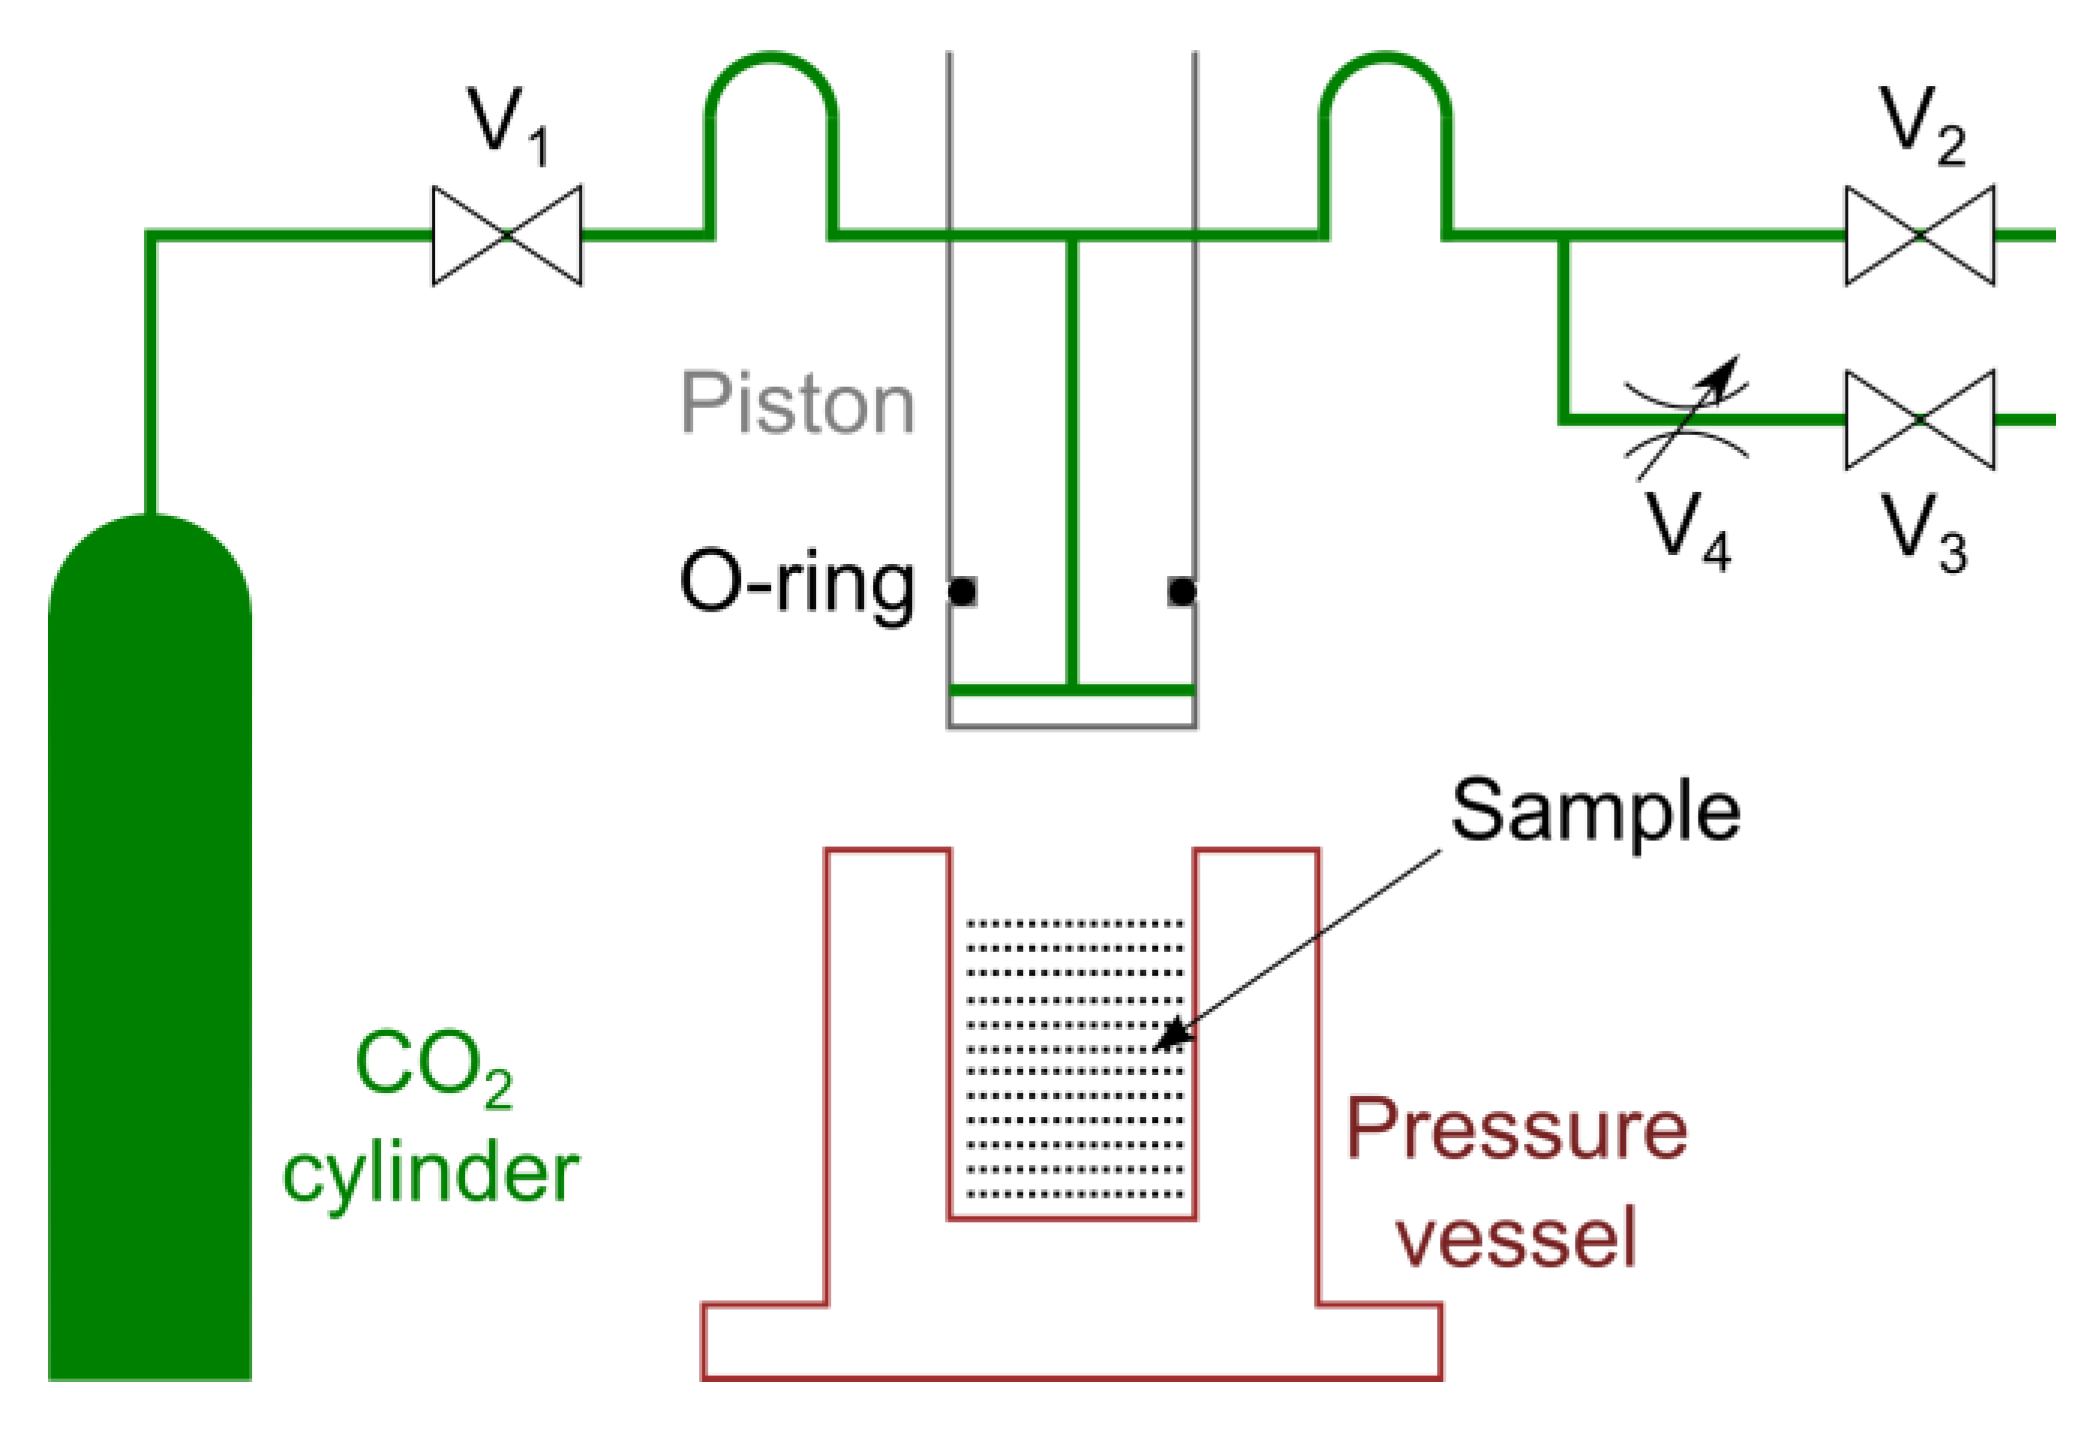
The CAPC processing apparatus is shown in
Figure 1. The piston was mounted on the servo press machine JP-1504 (JANOME Co., Hachioji, Japan). The corresponding procedure of CAPC processing went as follows: a sample with a specified number and weight was placed in a cylindrical high-pressure container directly below the piston under atmospheric conditions. The piston was then lowered to the 7.5 mm position, and CO
2 was injected and exhausted 3 times to replace the air in the container with CO
2. Then, CO
2 was injected again at vapor pressure (6 MPa at 23 °C), and the piston was lowered to the 5 mm position and pressed for 10 s. After pressing, the CO
2 was slowly exhausted for 30 s through the metering valve V
4, and was then released into the atmosphere by opening the valve V
2. The piston was then raised and a 5 mm thick sample could be prepared. The samples for X-ray CT were prepared in the same manner, but with CO
2 introduced when the piston was at the 0.75 mm position and pressed when the piston was at the 0.5 mm position. The CAPC process was performed at 23 °C.
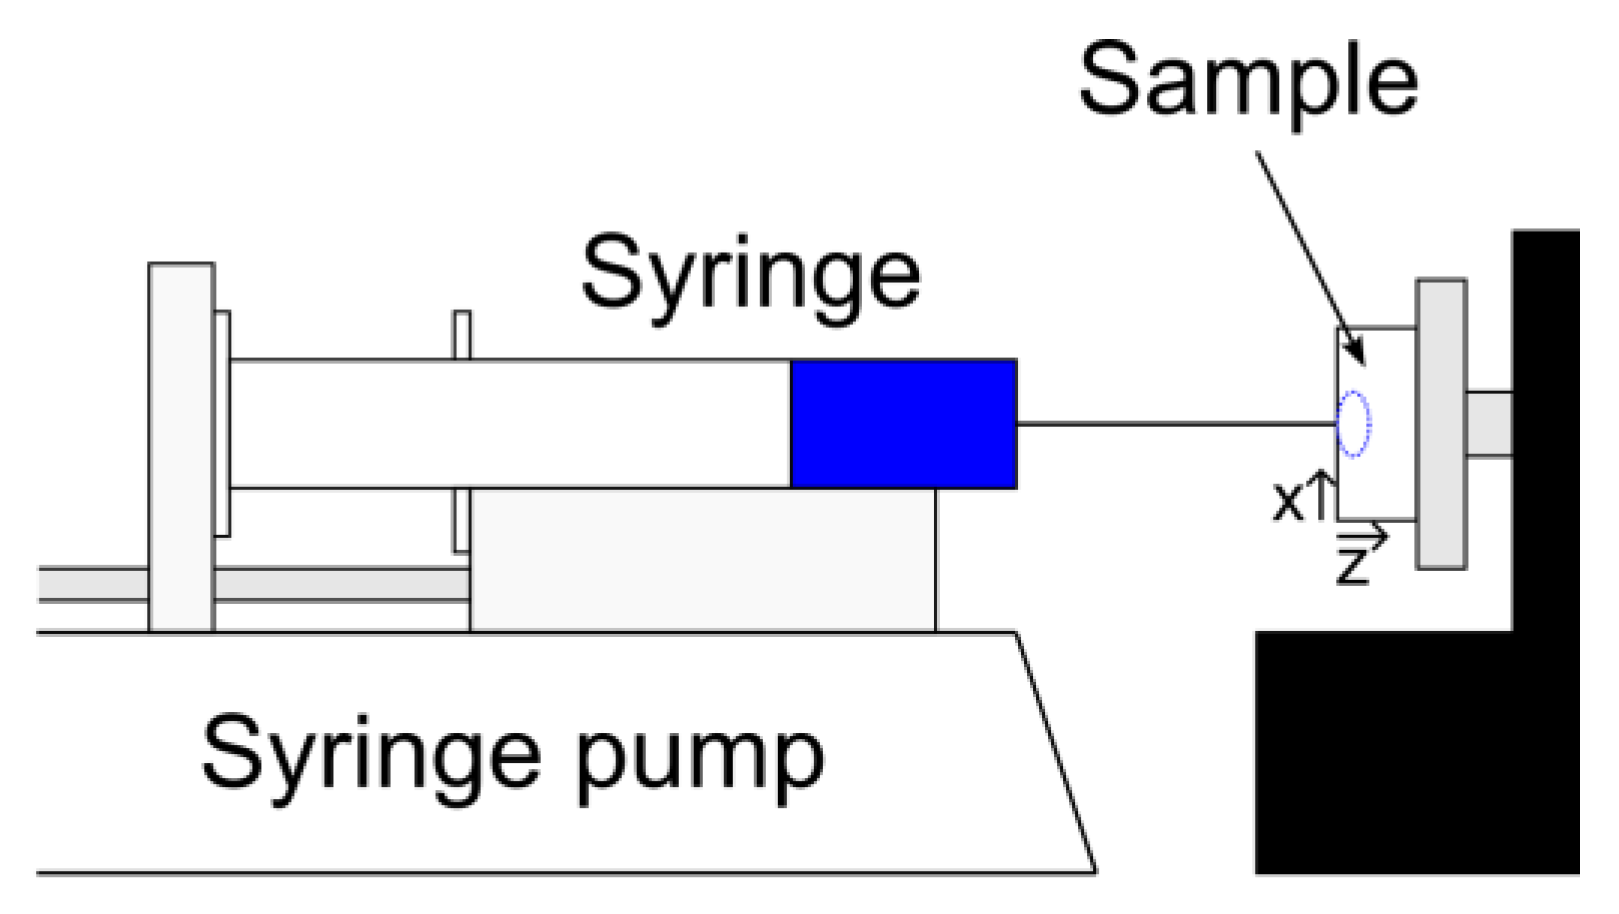
The permeation tests were performed using a Brilliant Blue (CAS RN: 3844-45-9) solution at a concentration of 0.1 wt% in an aqueous solution of 20 wt% ethanol (CAS RN: 64-17-5). Brilliant Blue and ethanol were purchased from FUJIFILM Wako Pure Chemical Co. (Osaka, Japan) and used without further purification. The temperature of the permeation solution was 20 °C. The setup of the permeation test is shown in
Figure 2. The dye solution was placed in a syringe and set in the syringe pump Fusion 100 (Chemyx Inc., Stafford, TX, USA), and 0.01 mL of the solution was introduced at a rate of 0.05 mL/min. The sample was set vertically in the sample holder as shown in
Figure 2, with the tip of the syringe in horizontal contact with the center of the sample. The liquid extruded from the tip of the needle on the syringe was immediately absorbed by the sample due to the high wettability of the 20 wt% ethanol aqueous solution to the poly(ethylene terephthalate) fiber. The experiments were performed five times under each condition to obtain the averaged results.
The sectioning was performed with the ultrasonic cutter ZO-80 (Honda Electronics Co. Ltd., Toyohashi, Japan) installed vertically in the numerical-controlled computer-aided manufacturing KitMill BT100 (Originalmind Inc., Okaya, Japan). The movement speed of the ultrasonic cutter was accurately controlled to 1 mm/s. The cut cross-sections were observed with the optical microscope RH-2000 (Hirox Co. Ltd., Suginami-ku, Japan). Since the permeation area was not able to fit into the images even at the lowest magnification, the stage was moved to take the images, which resulted in partial overlaps. Then, the overlap was automatically recognized and combined using the Microsoft Image Composite Editor (Microsoft Co., Redmond, WA, USA). The aspect ratio of the permeation area was calculated by fitting the edges of the pigment into the combined image with an ellipse. The experiment was performed five times, and the average of the results was used to analyze the aspect ratio.
A three-dimensional structural evaluation using X-ray CT was performed using the nano3DX submicron-resolution X-ray CT scanner (Rigaku Co., Akishima, Japan) at Industrial Technology Institute, Miyagi Prefectural Government (ITIM, Sendai, Japan). The resolution was 0.629 μm with a reconstruction range of 1.288 mm. The image was analyzed by taking the histogram of the brightness, which showed a lower peak for the pore peak and a higher peak for the solid peak. The pore-solid threshold was set to be the center of the two peaks.
The surface observation by scanning electron microscopy was performed using the TM-1000 (Hitachi High-Tech Co., Minato-ku, Japan).
The materials and instruments used in the experiments in this study are summarized in
Table 1 and
Table 2.
3. Results and Discussion
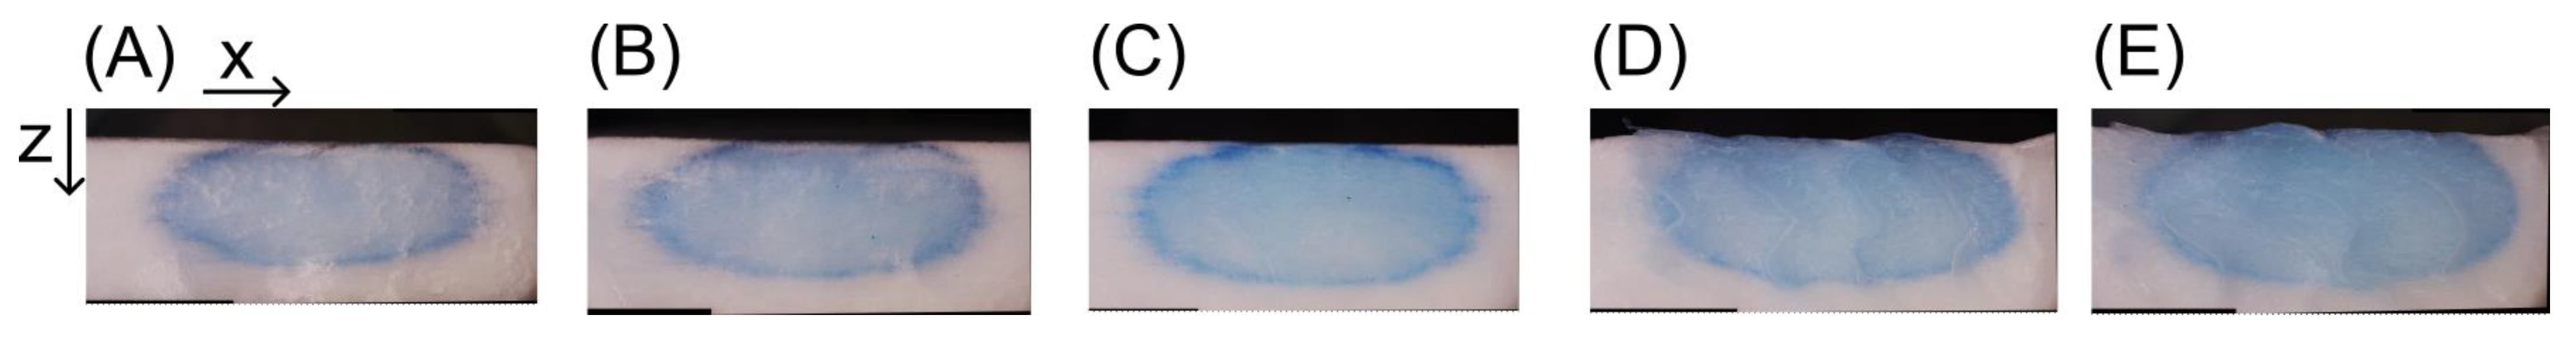
The cross-sectional results of the dye solution-permeated samples are shown in
Figure 3. All images were elliptical and well fitted. In addition, there was no effect of gravity for this experiment, and the dye permeated equally well both downward and upward from the syringe. The results of fitting and averaging all data are shown in
Table 3. The standard deviation is also included to show the data variability. Reproducible results were obtained from the dye solution injection test, indicating that the anisotropy of permeation can be evaluated using the quantitative value of the aspect ratio of the cross-section of the permeation area. The experimental results showed that with the increase in the number of layers, the range of permeation increased both vertically and horizontally, simply due to the decrease in porosity. In addition, the aspect ratio became small, indicating that it was easier for the material to permeate deeper as the number of layers increased. The hypothesis that an increase in the number of oriented fibers per unit volume would increase the anisotropy was denied via the experimental results.
From these results, the permeation mechanism is discussed by first focusing on the extent of permeation and the volume of pores. The porosity of the porous sample was derived from the weight of the sample, the volume of the cylinder (1.27 mL) that is obtained from the diameter (1.8 cm) and height (0.5 cm) of the cylinder of the porous sample, and the density of the polymer (1.34 g/mL). For example, for a sample of 80-ply, the weight of a solid cylinder with a diameter of 1.8 cm and a thickness of 0.5 cm should be 1.704 g. However, the actual weight was 0.637 g. The weight discrepancy (1.067 g) is caused by the existence of pores, and it can be used to derive the associated porosity (0.63). Since permeation takes place in the voids, the volume of the voids in this ellipsoid body was obtained by calculating the volume of the ellipsoid body from the fitted width and depth and multiplying it by the porosity of the porous material. By injecting 0.01 mL of the dye solution, the occupancy rate of the dye solution relative to the void was calculated to be 34% for 80-ply samples and 50% for 160-ply samples. This occupancy rate suggests that the dye solution permeates among the fibers while wetting the fiber surface, and simultaneously fills the voids due to the capillary effect.
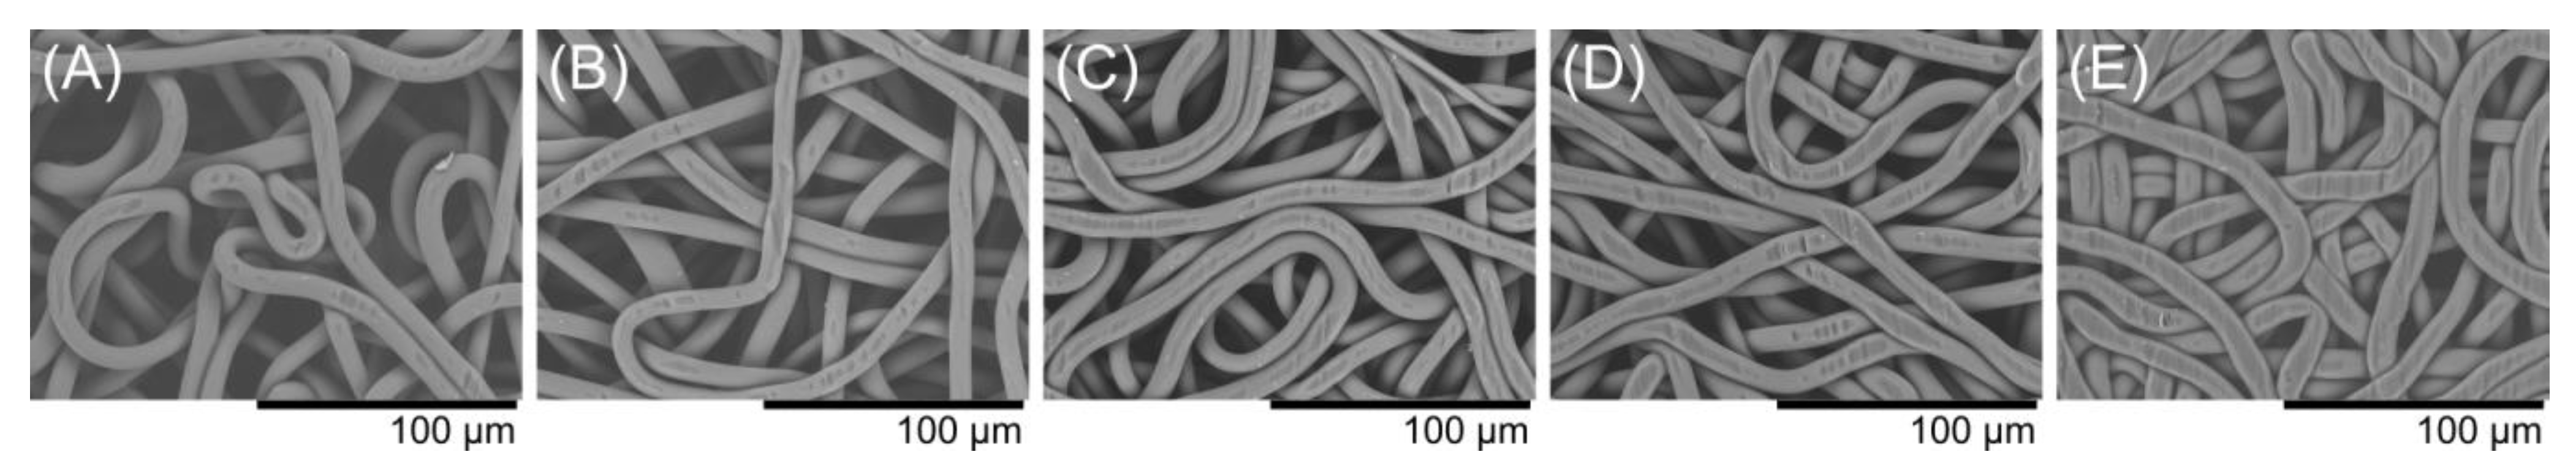
Next, the cause of lateral permeation and the decrease in aspect ratio is discussed based on the results from the X-ray CT images. The scanning electron microscope images of the surface of a 0.5 mm thick CAPC product are shown in
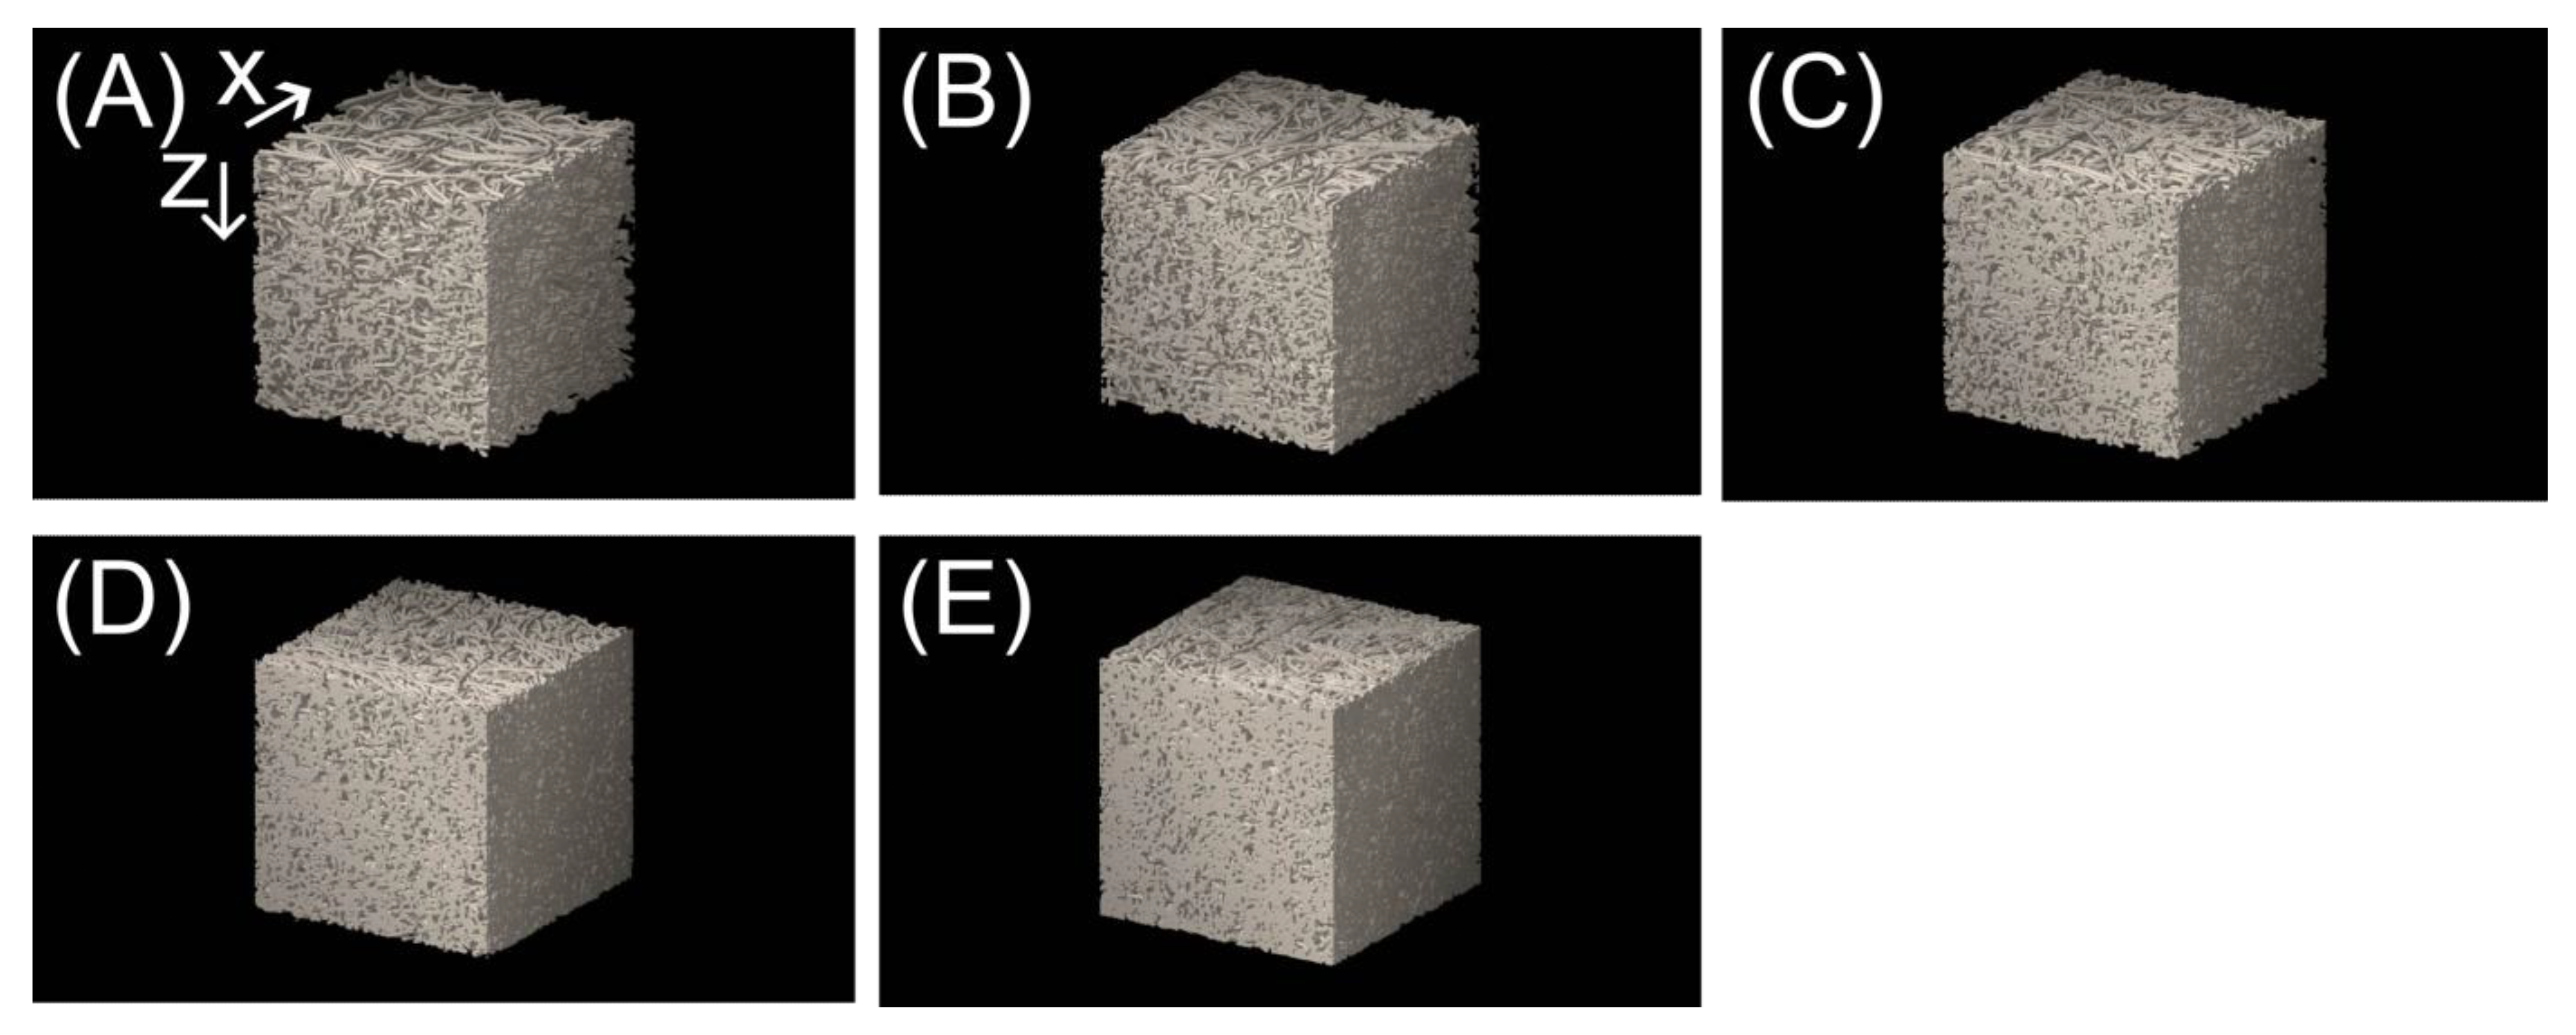
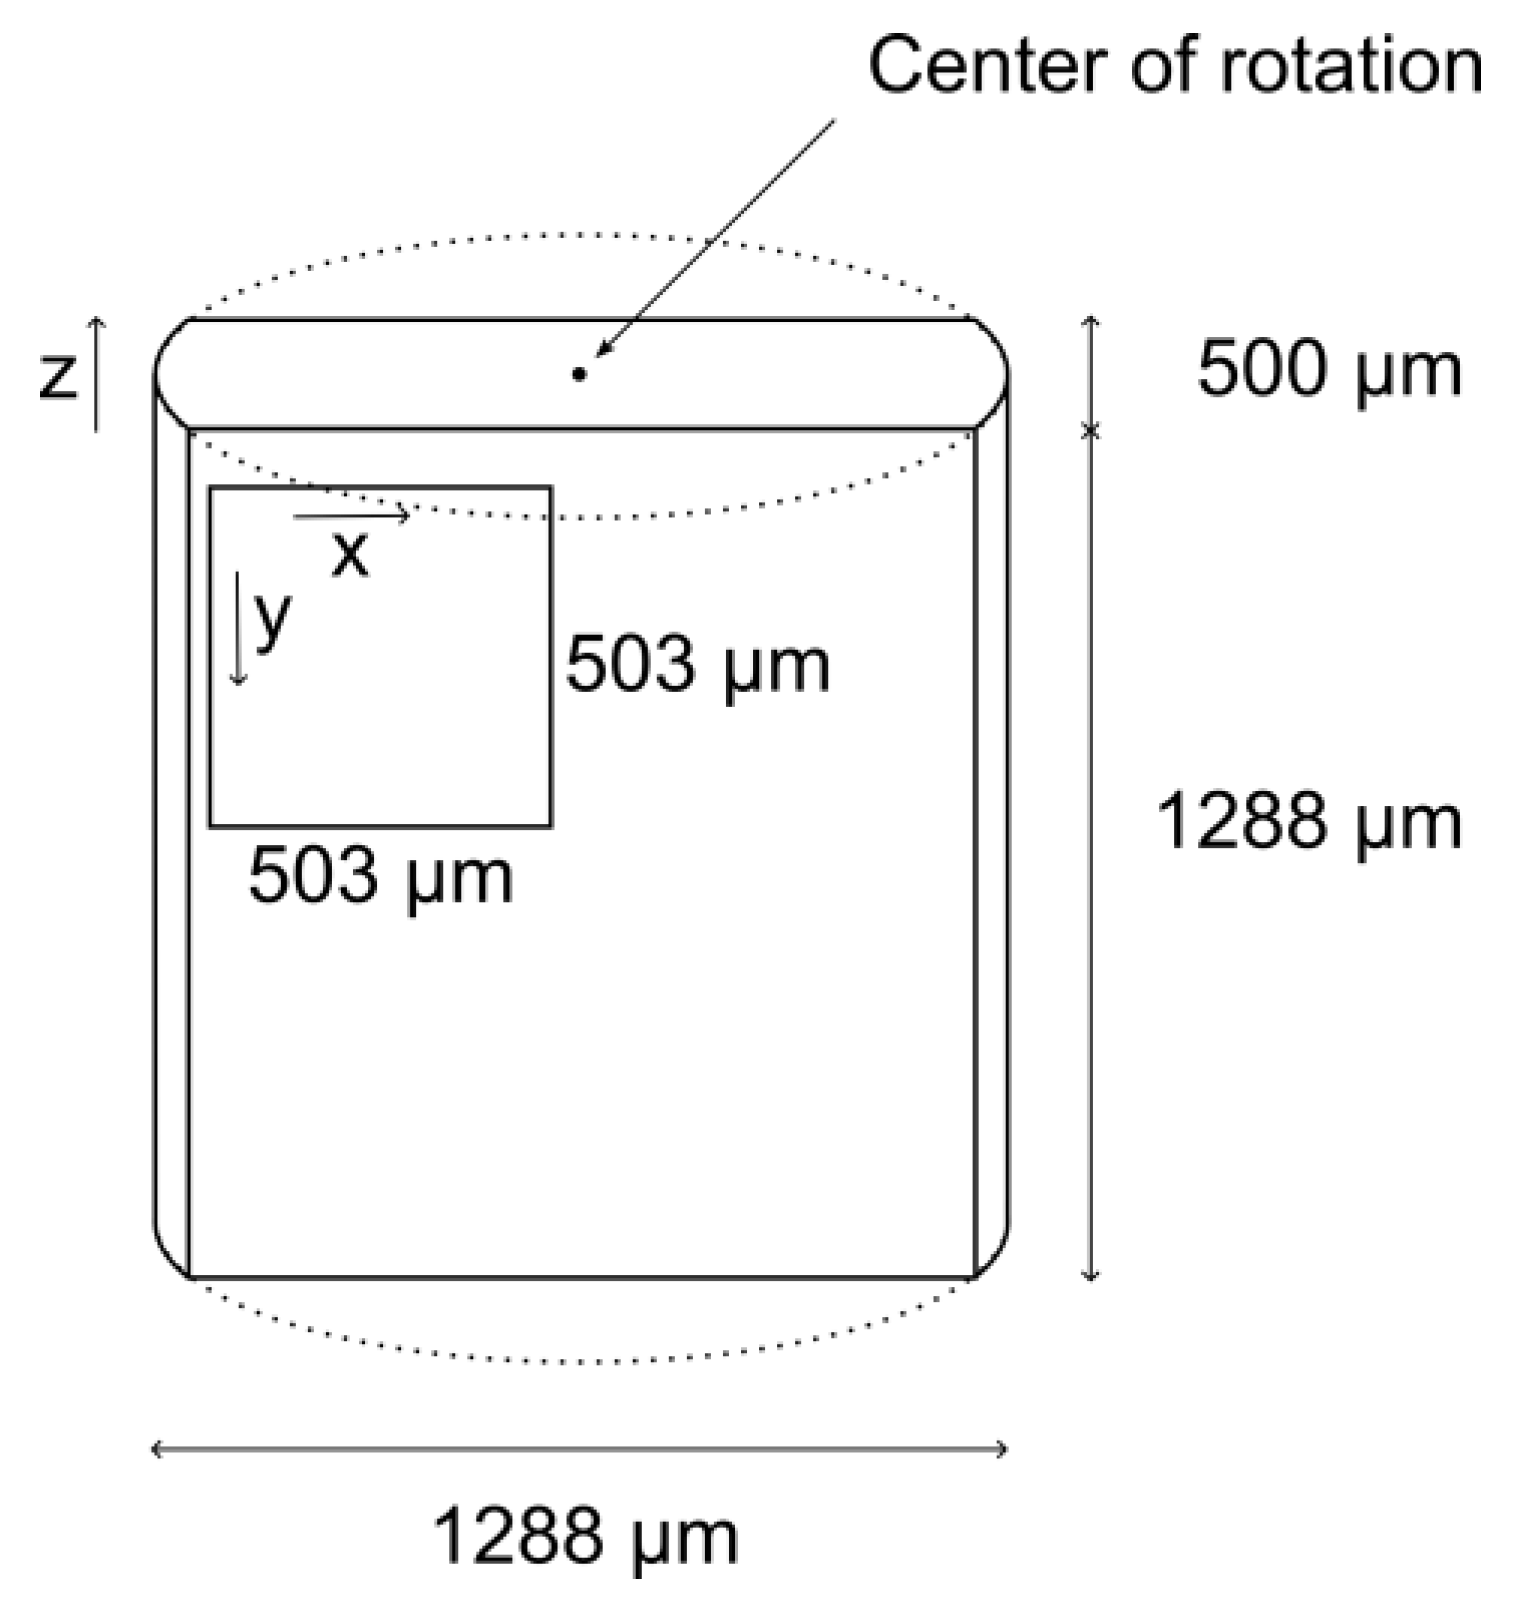
Figure 4. The porosities calculated from the sample size, weight, and solid density were 0.64, 0.54, 0.45, 0.36, and 0.27 for the 8-, 10-, 12-, 14-, and 16-ply samples, respectively. The X-ray CT images of a sample cropped to 503 μm in length and width are shown in
Figure 5. The size of the reconstructed X-ray CT image and the cropped area are shown in
Figure 6. For X-ray CT, a cut-out was made to avoid the center of rotation because the reconstruction accuracy near the center of rotation is low. In the porous material, the fiber direction was spread in the xy-plane, and both the permeation that wetted the fiber surface and filled the voids (such as the capillary action) tended to spread in the lateral direction. In contrast, for the cross-section, as the number of laminated sheets increased, the area where fibers adhered to each other in the z-direction increased, and wetting across the fibers occurred from the adhered area to the z-direction while the voids were also connected in the z-direction, leading to increased permeation in the z-direction. This phenomenon was also observed from the cross-sectional analysis model in the previous simulation of adhesive strength, indicating that more bonding and higher adhesive strength can be found in the z-direction with higher compression [
17].
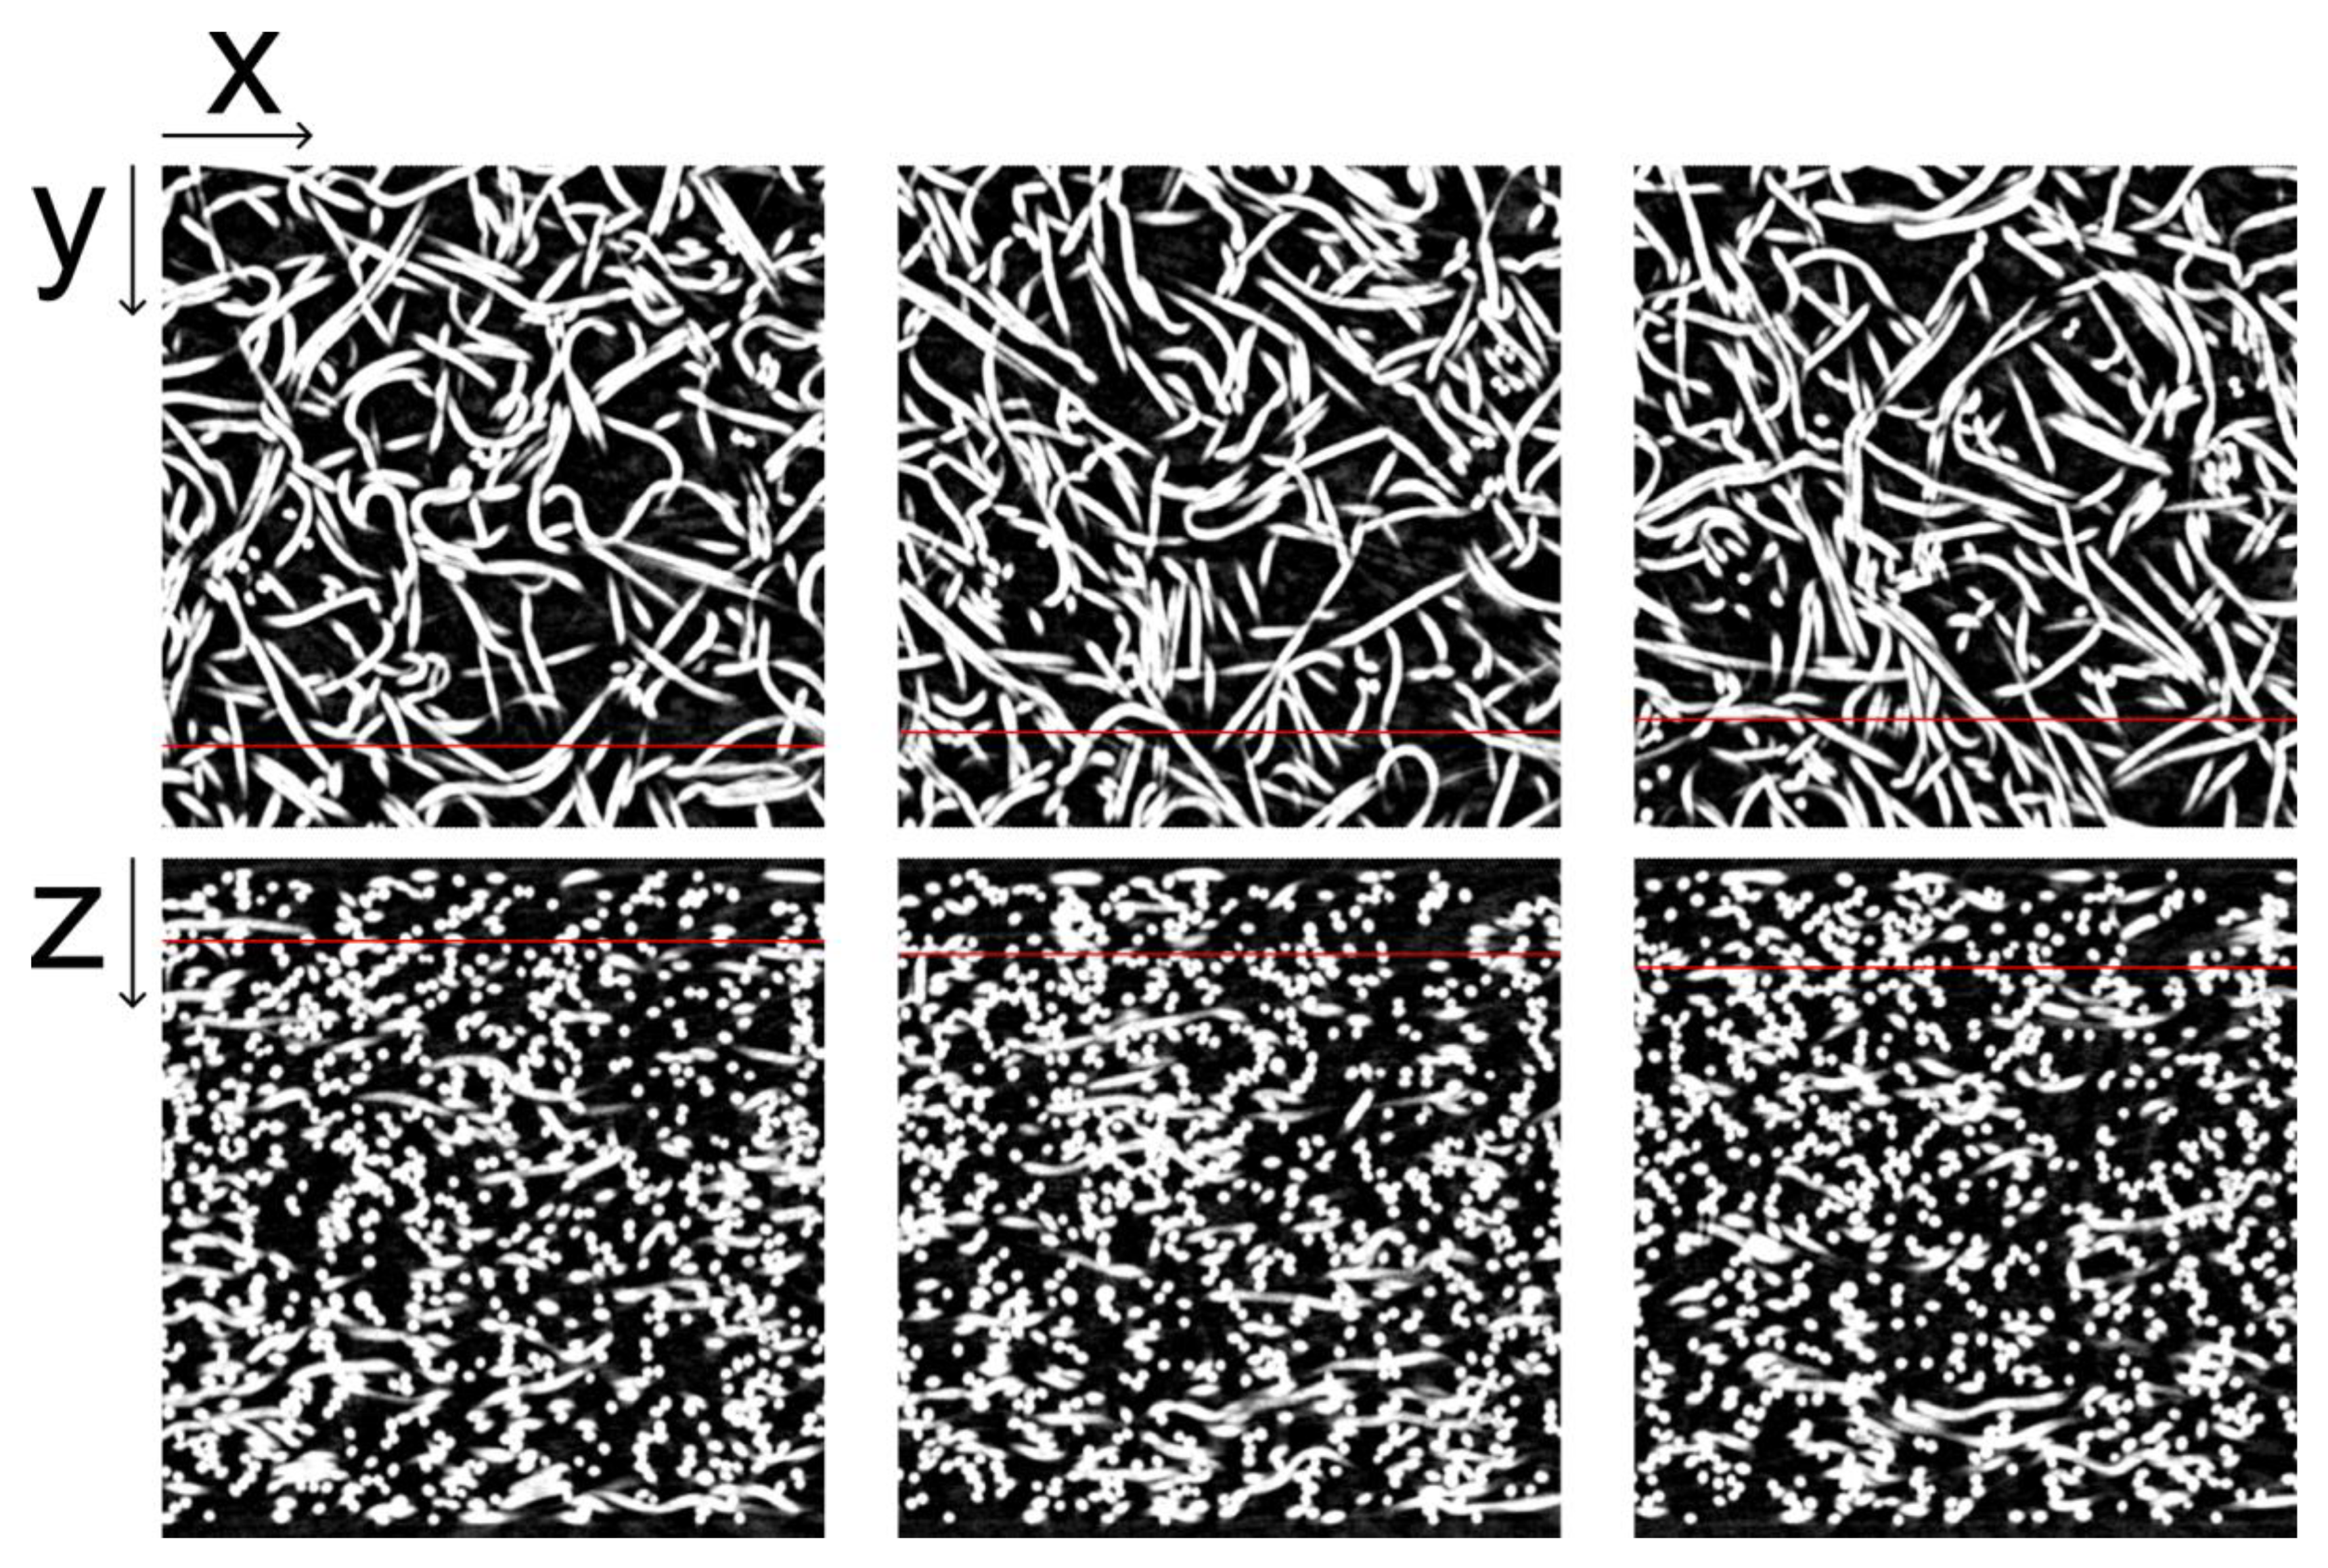
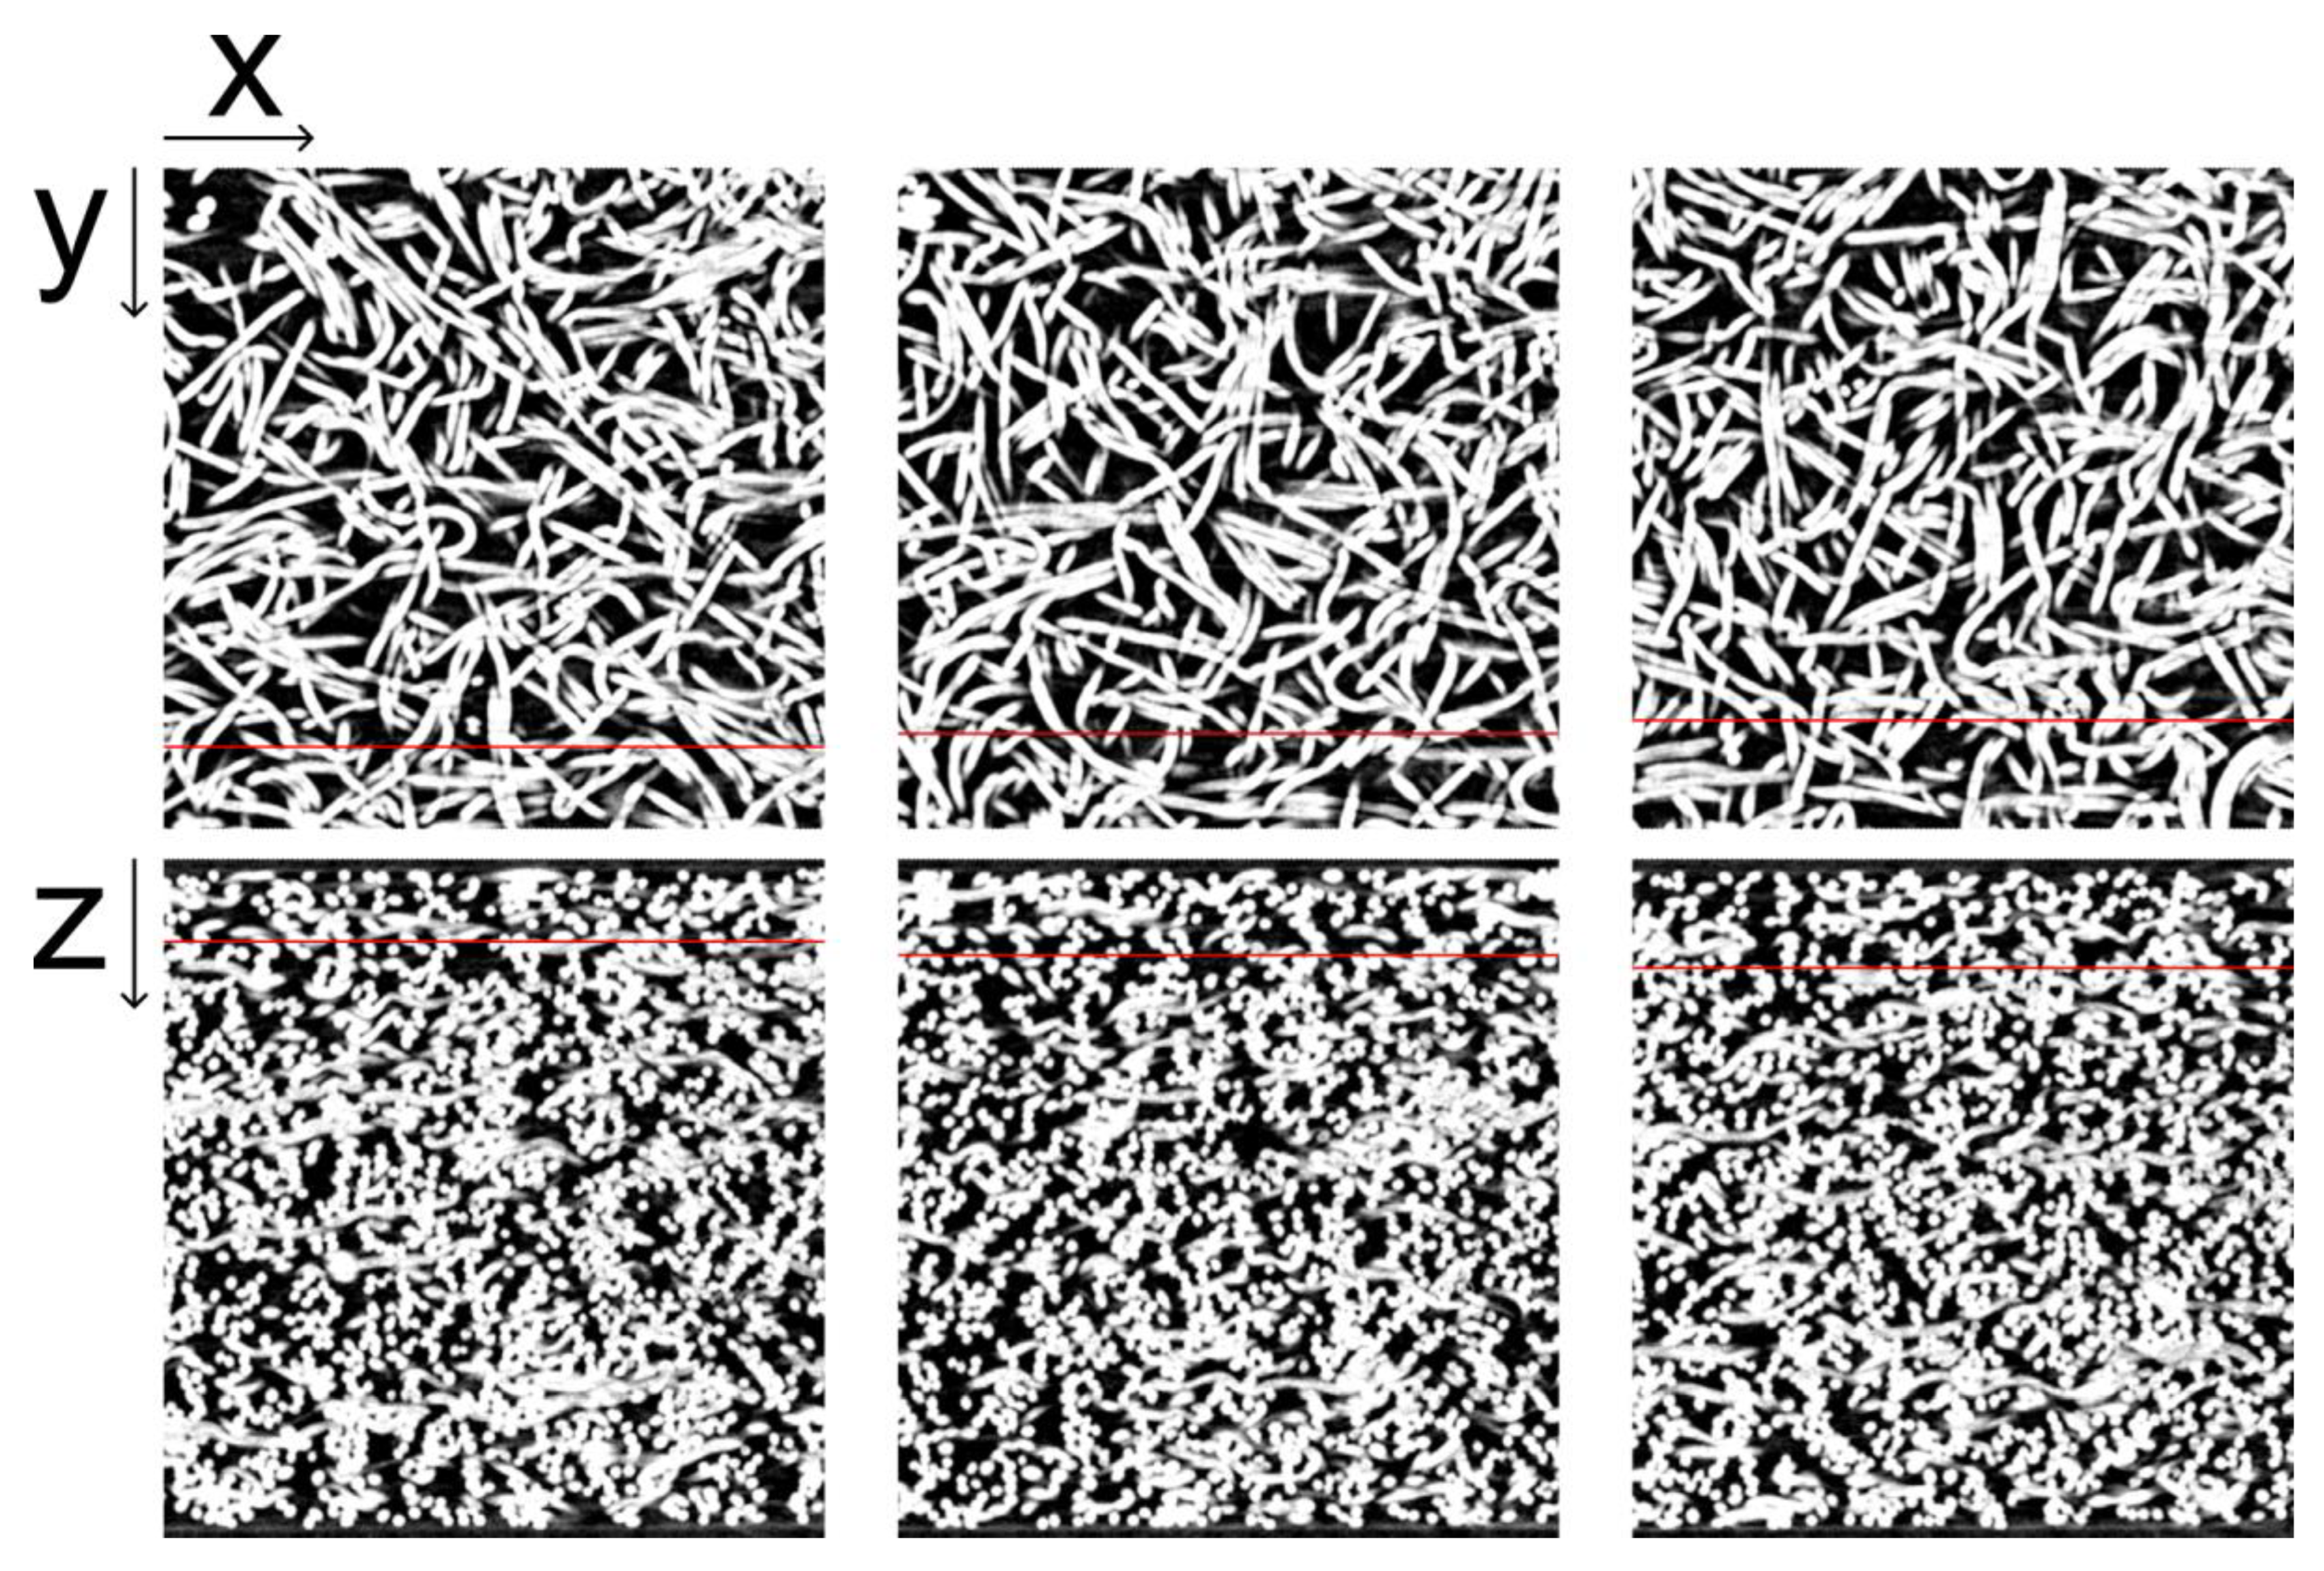
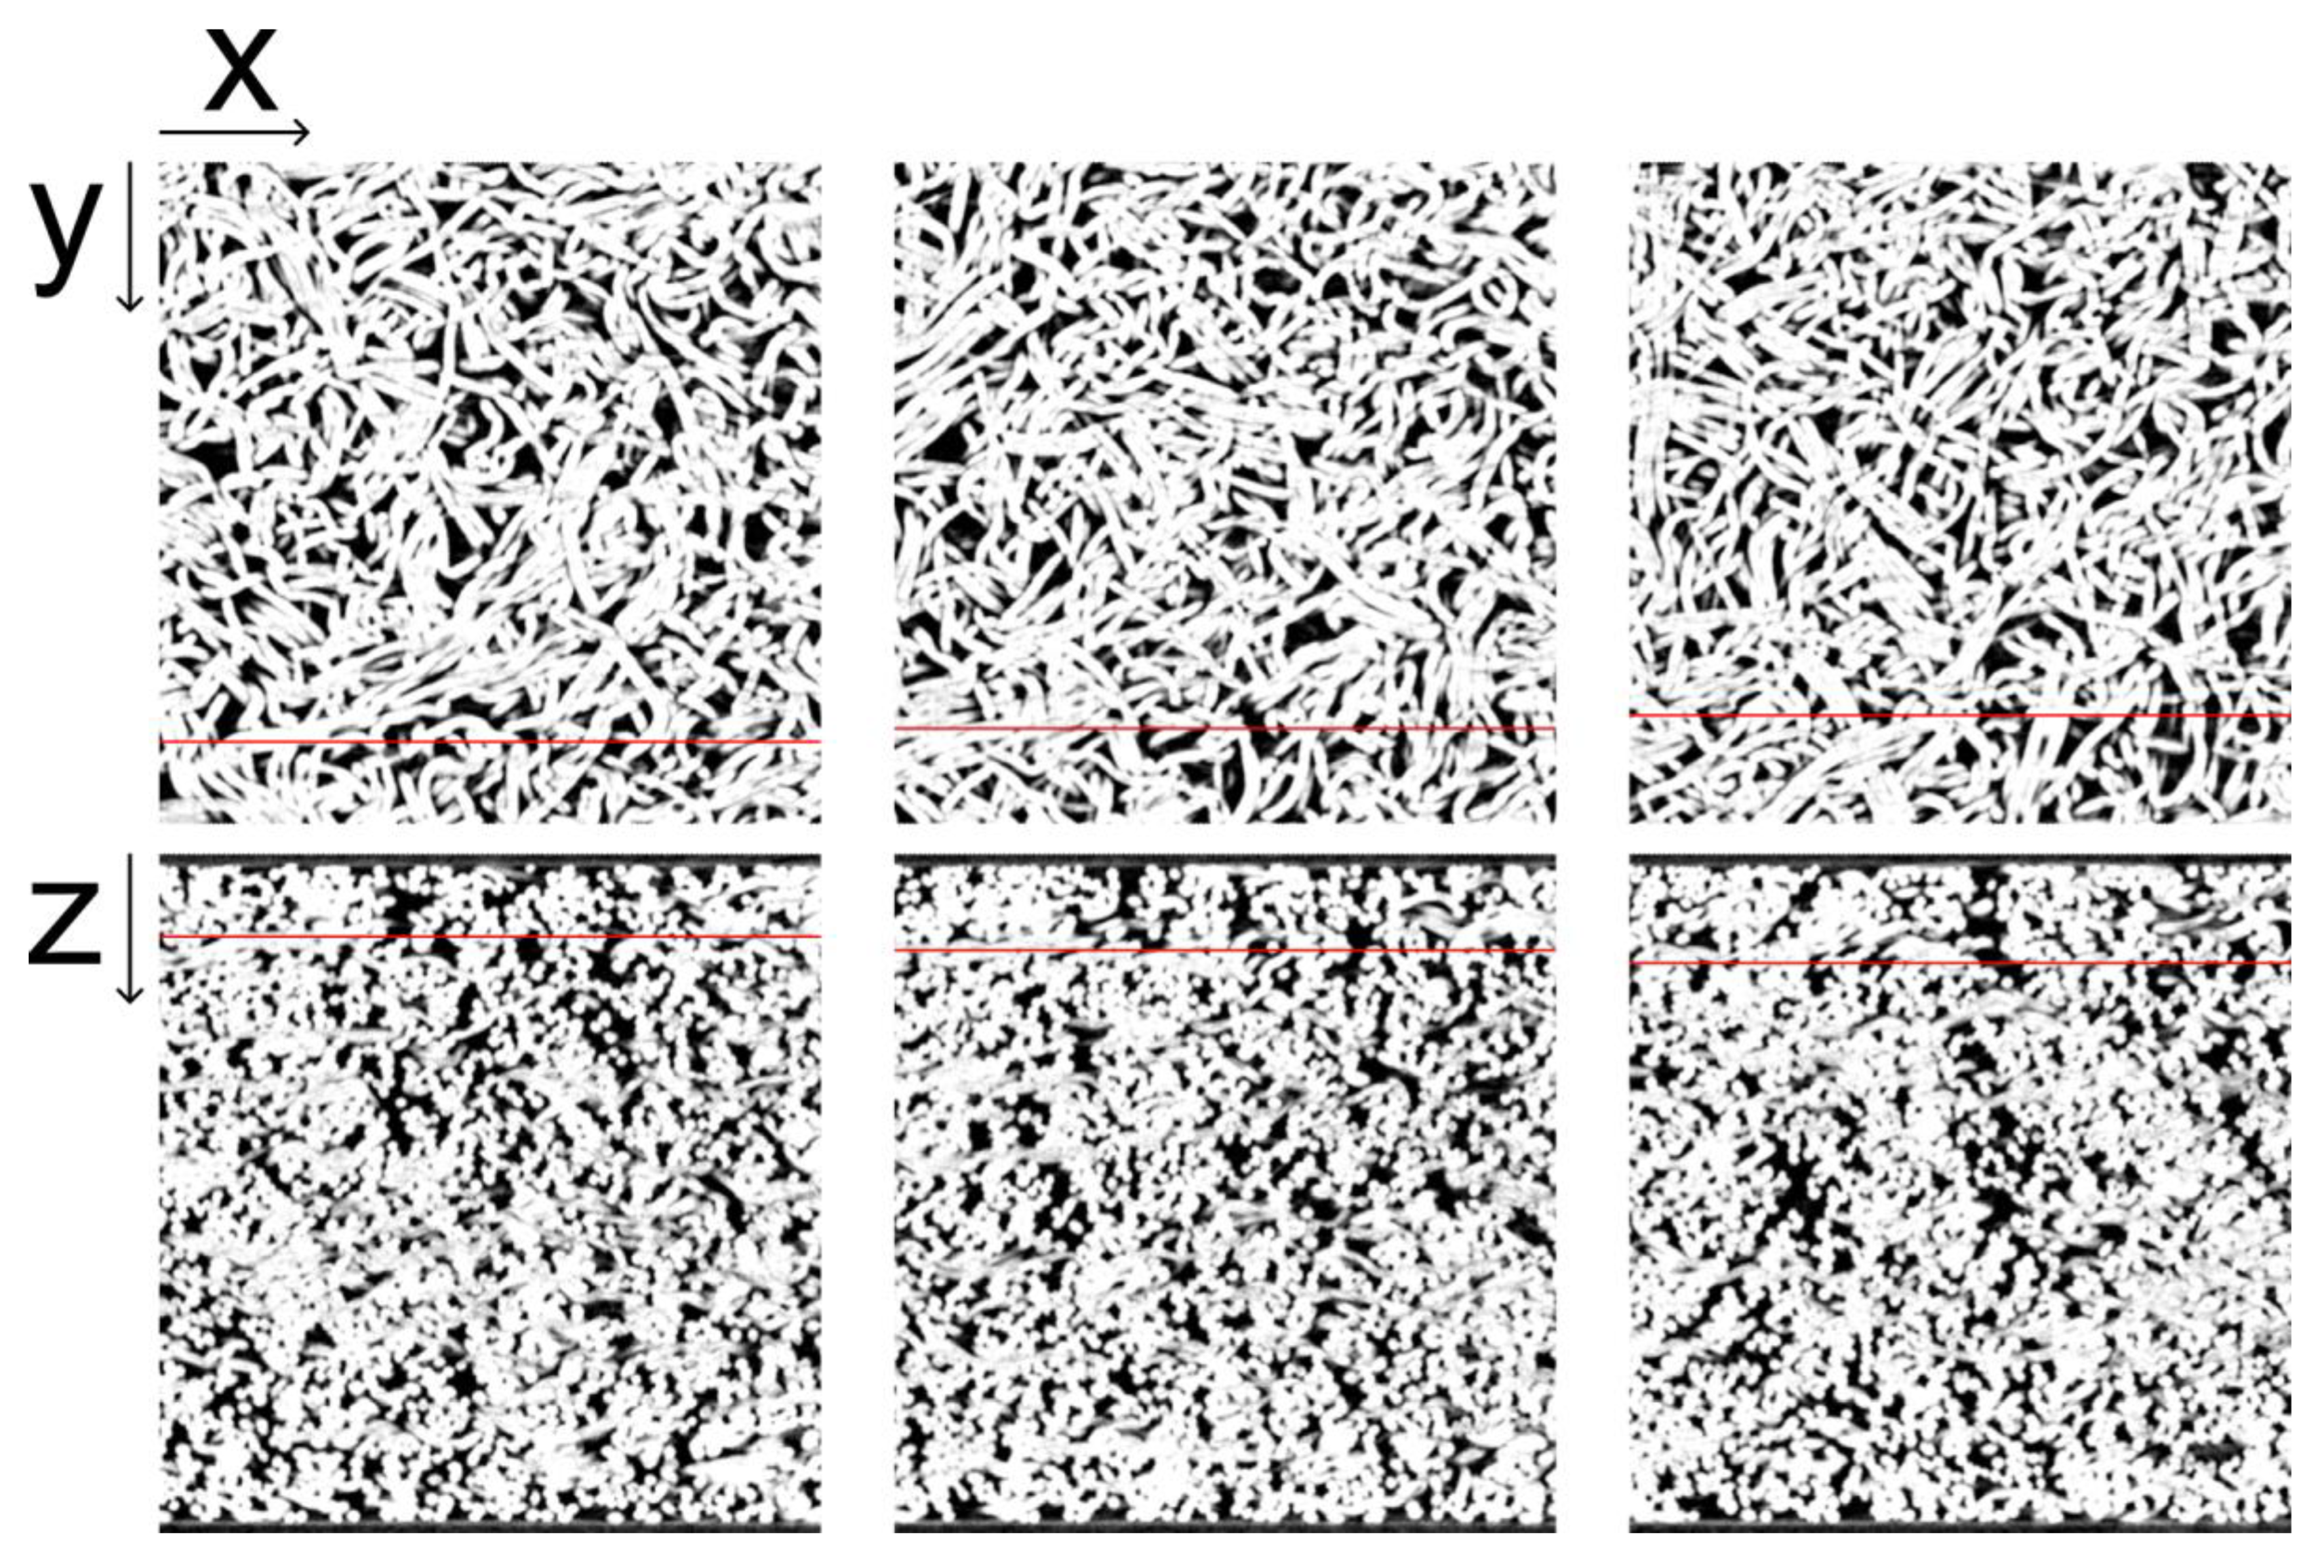
For a more detailed examination, the cross-sections perpendicular to the z-axis and y-axis are shown in
Figure 7,
Figure 8 and
Figure 9 for 8-ply to 16-ply samples. The horizontal axis represents the x-axis in each figure, and the vertical axis indicates the y-axis in the upper figure and the z-axis in the lower figure. The lower figure depicts the cross-section cut along the red line of the upper figure, and the upper figure depicts the cross-section cut along the red line of the lower figure. The left, center, and right figures show the cross-section shifted by 10 µm. From the scanning electron microscope images (
Figure 4), it seems that there were more fibers than the calculated results because the information in the depth direction was missing. However, from the X-ray CT slice image in the xy-plane, it is clearly shown that the voids match the porosity. This is a limitation of the scanning electron microscope as it is a two-dimensional measurement method. The slice images in
Figure 7,
Figure 8 and
Figure 9 clearly show that the fibers are present along the xy-plane, although they appear to move slightly up and down along the z-axis. In addition, the adhesion points (intersections between upper and lower fibers) along the z-axis increased as the number of laminated sheets increased. The slice image in the xz-plane shows that there were many unglued free fibers in the 8-layer product, whereas there were almost no free fibers in the 16-layer product.
The aspect ratio of the permeation in the fiber-spreading direction to the fabric-lamination direction was 2.73 for the 80-ply laminated CAPC porous material with a porosity of 0.63. As shown in the cross-section of a large porosity material (
Figure 7), this can be interpreted as little fiber being bonded between the top and bottom when porosity is large, where permeation is more likely to spread in the lateral direction along the fiber. This can be interpreted as reflecting the lateral spread of permeation along the fibers when porosity is large. However, the aspect ratio decreased to 2.33 for the 160-ply laminated CAPC porous material with a porosity of 0.25. In the cross-section of the small porosity state (
Figure 9), considerable fiber bonding was observed, which can cause a decrease in the aspect ratio of the permeation or a decrease in the anisotropy because the permeation fluid on one fiber surface is more likely to travel to the surface of another overlapping fiber.
The results of the evaluation of the anisotropy of permeation obtained in this study will provide essential data for designing filters and drug-loaded tablets using CAPC porous materials in future studies.
4. Conclusions
The permeation behavior of dye solutions in carbon dioxide-assisted polymer compression (CAPC) porous materials consisting of poly(ethylene terephthalate) with an average fiber diameter of 8 μm was analyzed. The anisotropy of the permeation behavior in CAPC porous materials was evaluated using the aspect ratio of the dye solution permeation of the fiber-spread direction via the fabric-lamination direction. Cross-sectional images were obtained using X-ray computed tomography. The results and interpretations of the experiments can be summarized as follows:
The aspect ratio of the permeation of the porous material with a porosity of 0.63 was 2.73, while the aspect ratio of the porous material with a porosity of 0.25 decreased to 2.33.
The aspect ratio decreased monotonically with decreasing porosity, indicating that the decrease in porosity reduced the anisotropy of permeation.
The hypothesis that an increase in the number of oriented fibers per unit volume could increase the anisotropy is denied.
Cross-sectional images of samples with high porosity showed less fiber-to-fiber bonding, and the number of fiber bonding points increased with decreasing porosity.
Since permeation of the dye solution occurs along the fiber surface, it is interpreted that more bonded fibers promote permeation between the upper and lower fiber surfaces, resulting in less anisotropy of permeation.
Thus, the objective of this paper, to quantitatively evaluate the anisotropy of permeation and to understand the phenomenon by linking it to the structure of the sample, has been achieved.
In this research, experiments were conducted using limited conditions of dye solution permeation with a slow injection rate to emphasize the anisotropy of the structure and examine it. However, for the actual design of the component, the permeation rate and the amount of permeation are also essential factors to consider. Functional components, such as filters and tablets, are important industrial components. Therefore, structural anisotropy is an essential property for the design of filters and drug-loading tablets using CAPC porous materials in future studies.


