
The Use of Domain-Specific Languages for Visual Analytics: A Systematic Literature Review


Abstract
1. Introduction
2. Background and Related Works
2.1. Information Visualization and Visual Analytics
2.2. Domain-Specific Languages
2.3. Domain-Specific Languages and Visual Analytics
2.4. Related Systematic Reviews
3. Materials and Methods
3.1. Overview
3.2. Planning the Review
3.2.1. Goals of the SLR
3.2.2. Search Strategy
Research Questions
- How are DSLs being used for VA system design? By answering this question, one can understand how DSLs can be used to assist with VA system design and decide on the DSL type while designing a similar system.
- What are the application domains that DSLs have been used for? Answering this question helps identify the goals of using DSLs by discussing their usage in different application areas.
- What are the benefits and limitations of using DSLs for VA? Answering this question facilitates choosing the best DSL for a particular VA system design.
Search String
Inclusion and Exclusion Criteria
- The study must use a DSL for visualization, and the focus should be on information visualization, not simulation, animation, 3D, or scientific visualization. This is to prevent collecting information from those areas that may not be applicable for information visualization. However, we have not excluded any study based on this criterion in the first round of title and abstract reading and it took place only during the full-text relevancy checking.
- The language of the study must be English.
- The paper must be peer-reviewed.
- The study must be accessible in full text.
Choice of Databases
- Association for Computing Machinery Digital Library (ACM DL)
- Institute of Electrical and Electronics Engineers Xplore (IEEE Xplore)
- Elsevier ScienceDirect (ScienceDirect)
- Springer Link (SpringerLink)
- Wiley Online Library (Wiley OL)
3.3. Conducting the Review
- Locating the relevant research
- Selecting the relevant studies
- Verifying the quality of studies
- Extracting data based on research questions
- Synthesis of the results and reporting
3.4. Study Quality Assurance
3.5. Limitations and Threats to Validity
3.5.1. Construct Validity
3.5.2. Internal Validity
3.5.3. External Validity
3.5.4. Conclusion Validity
3.5.5. This SLR vs. Others
4. Results
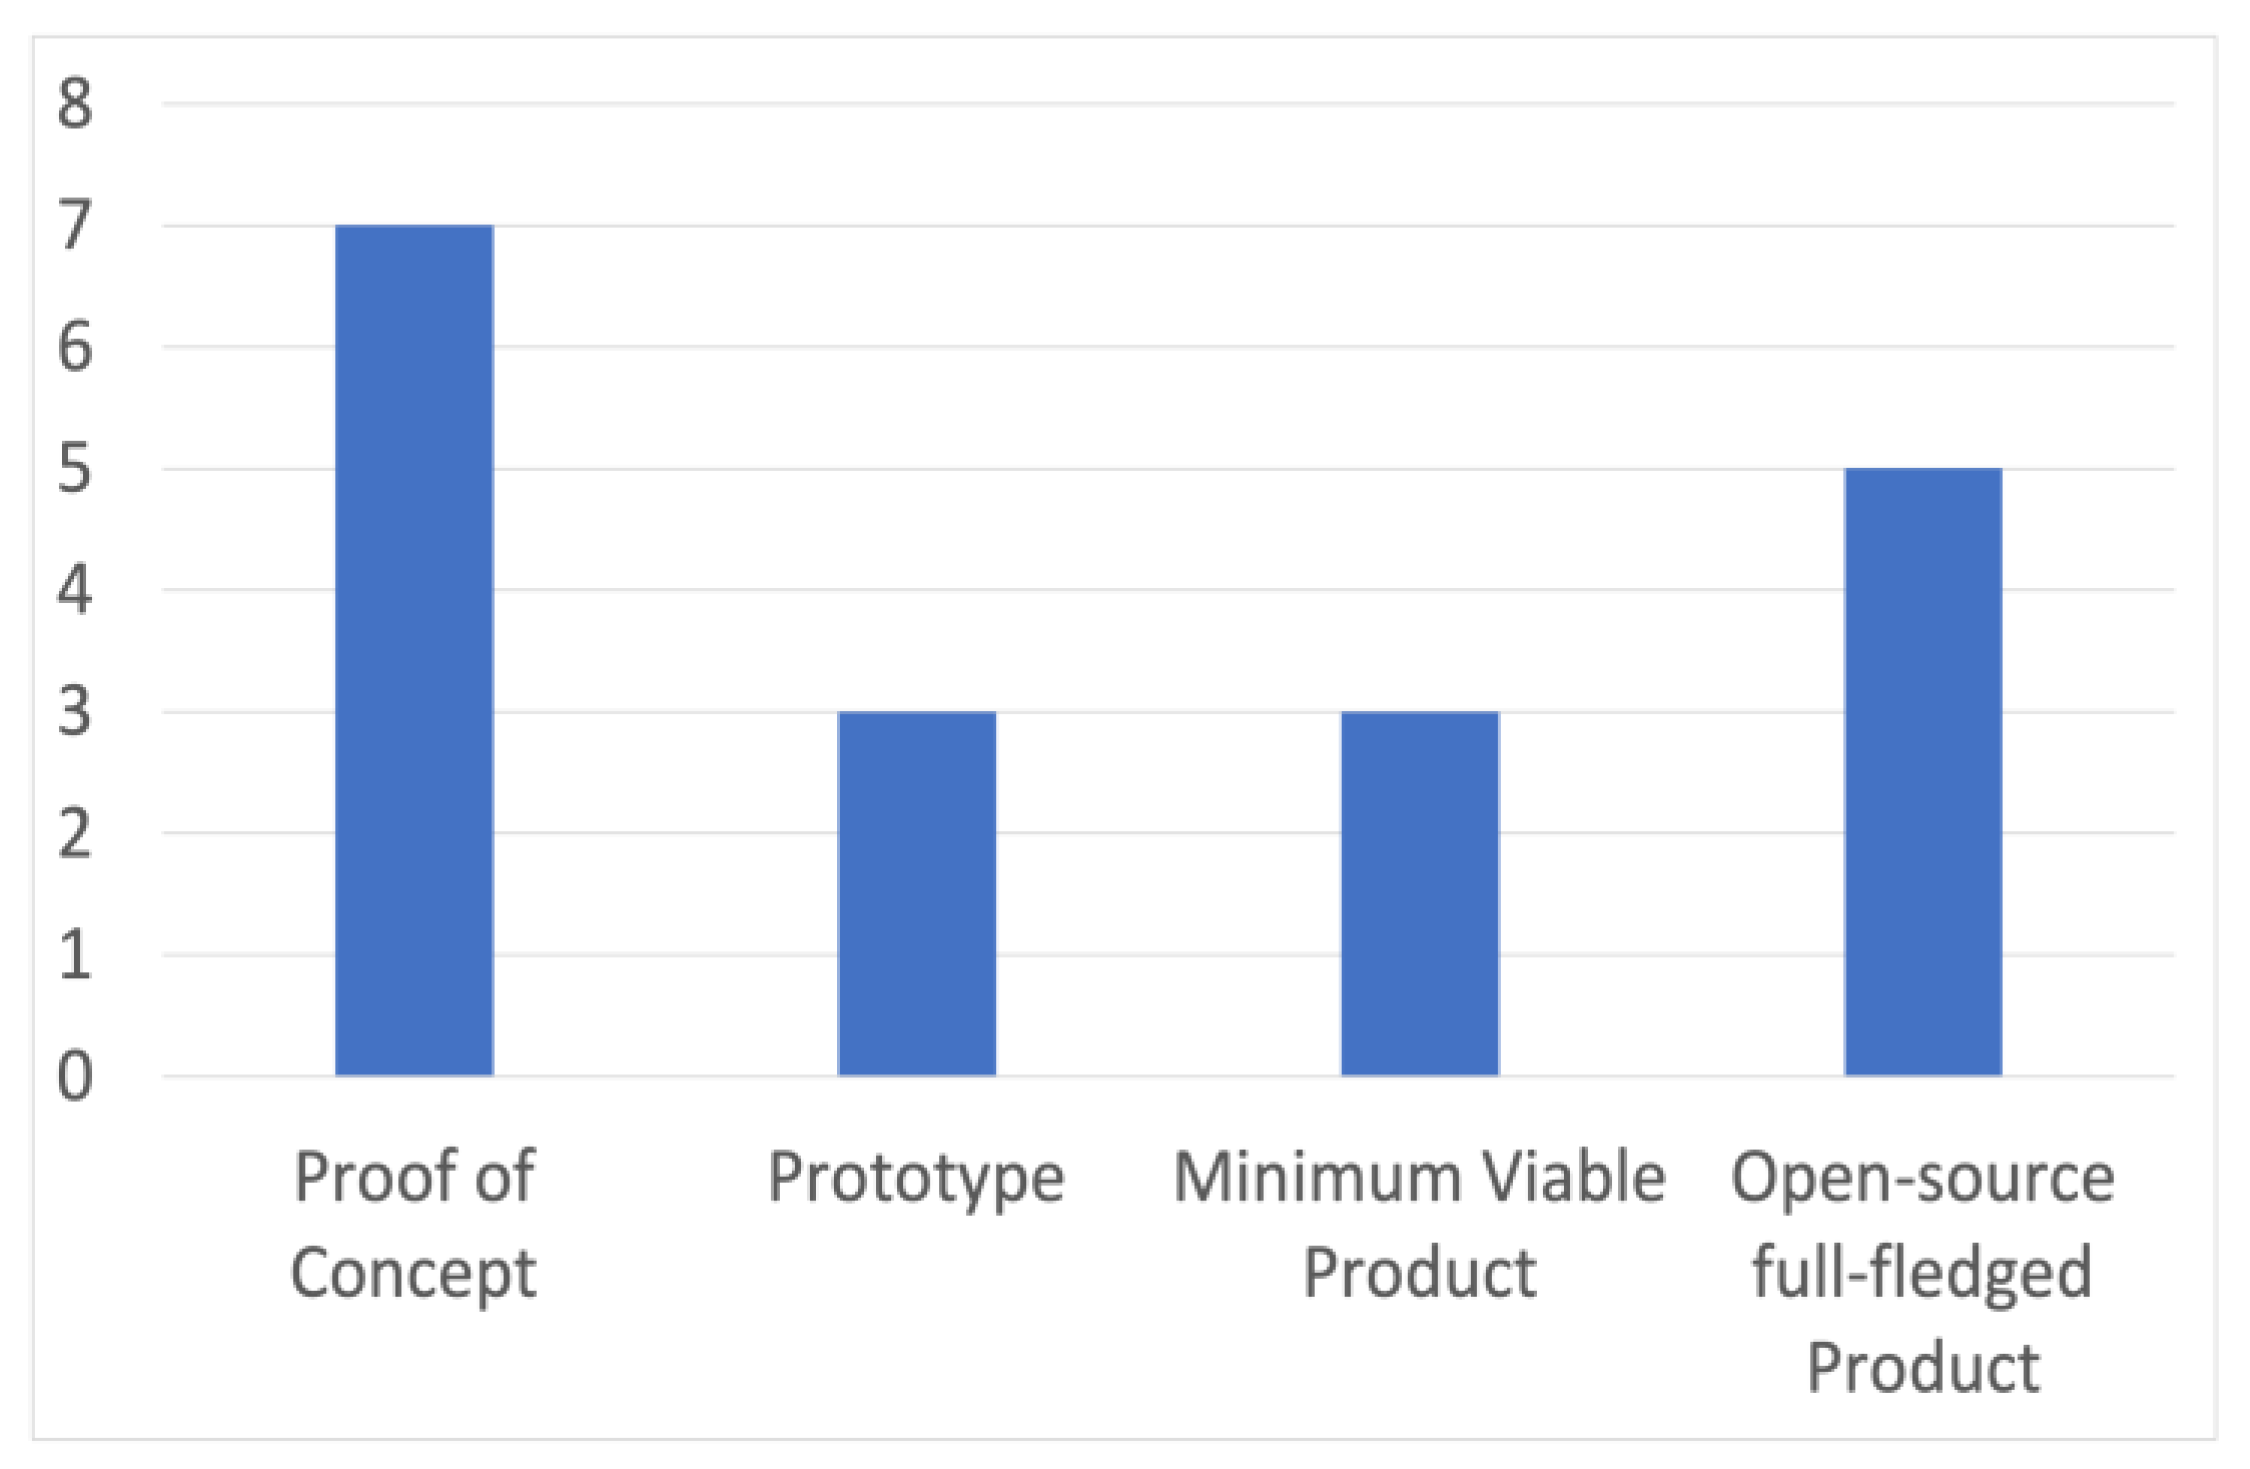
4.1. Demographics
- Proof of Concept (PoC): PoC is more of a research prototype that aims at demonstrating the feasibility of an idea and verifying certain concepts or theories.
- Prototype: Prototype is a way of presenting the design of a product to stakeholders and prospective users in order to showcase the functionality.
- Minimum Viable Product (MVP): MVP is a releasable version of a product that contains the most significant function and features to exhibit usability.
- Open-source full-fledged product: Open-source full-fledged product is a freely accessible finished product that is ready to be used.
4.2. Taxonomy of DSL Types
4.2.1. Domain-Specific Modeling Language (DSML)
4.2.2. Domain-Specific Programming Language (DSPL)
4.2.3. Domain-Specific Specification Language (DSSL)
5. Descriptive Synthesis and Discussion
5.1. Types of DSLs (RQ1)
5.2. Goals of Using DSLs (RQ2)
5.3. Benefits and Limitations of Different DSLs (RQ3)
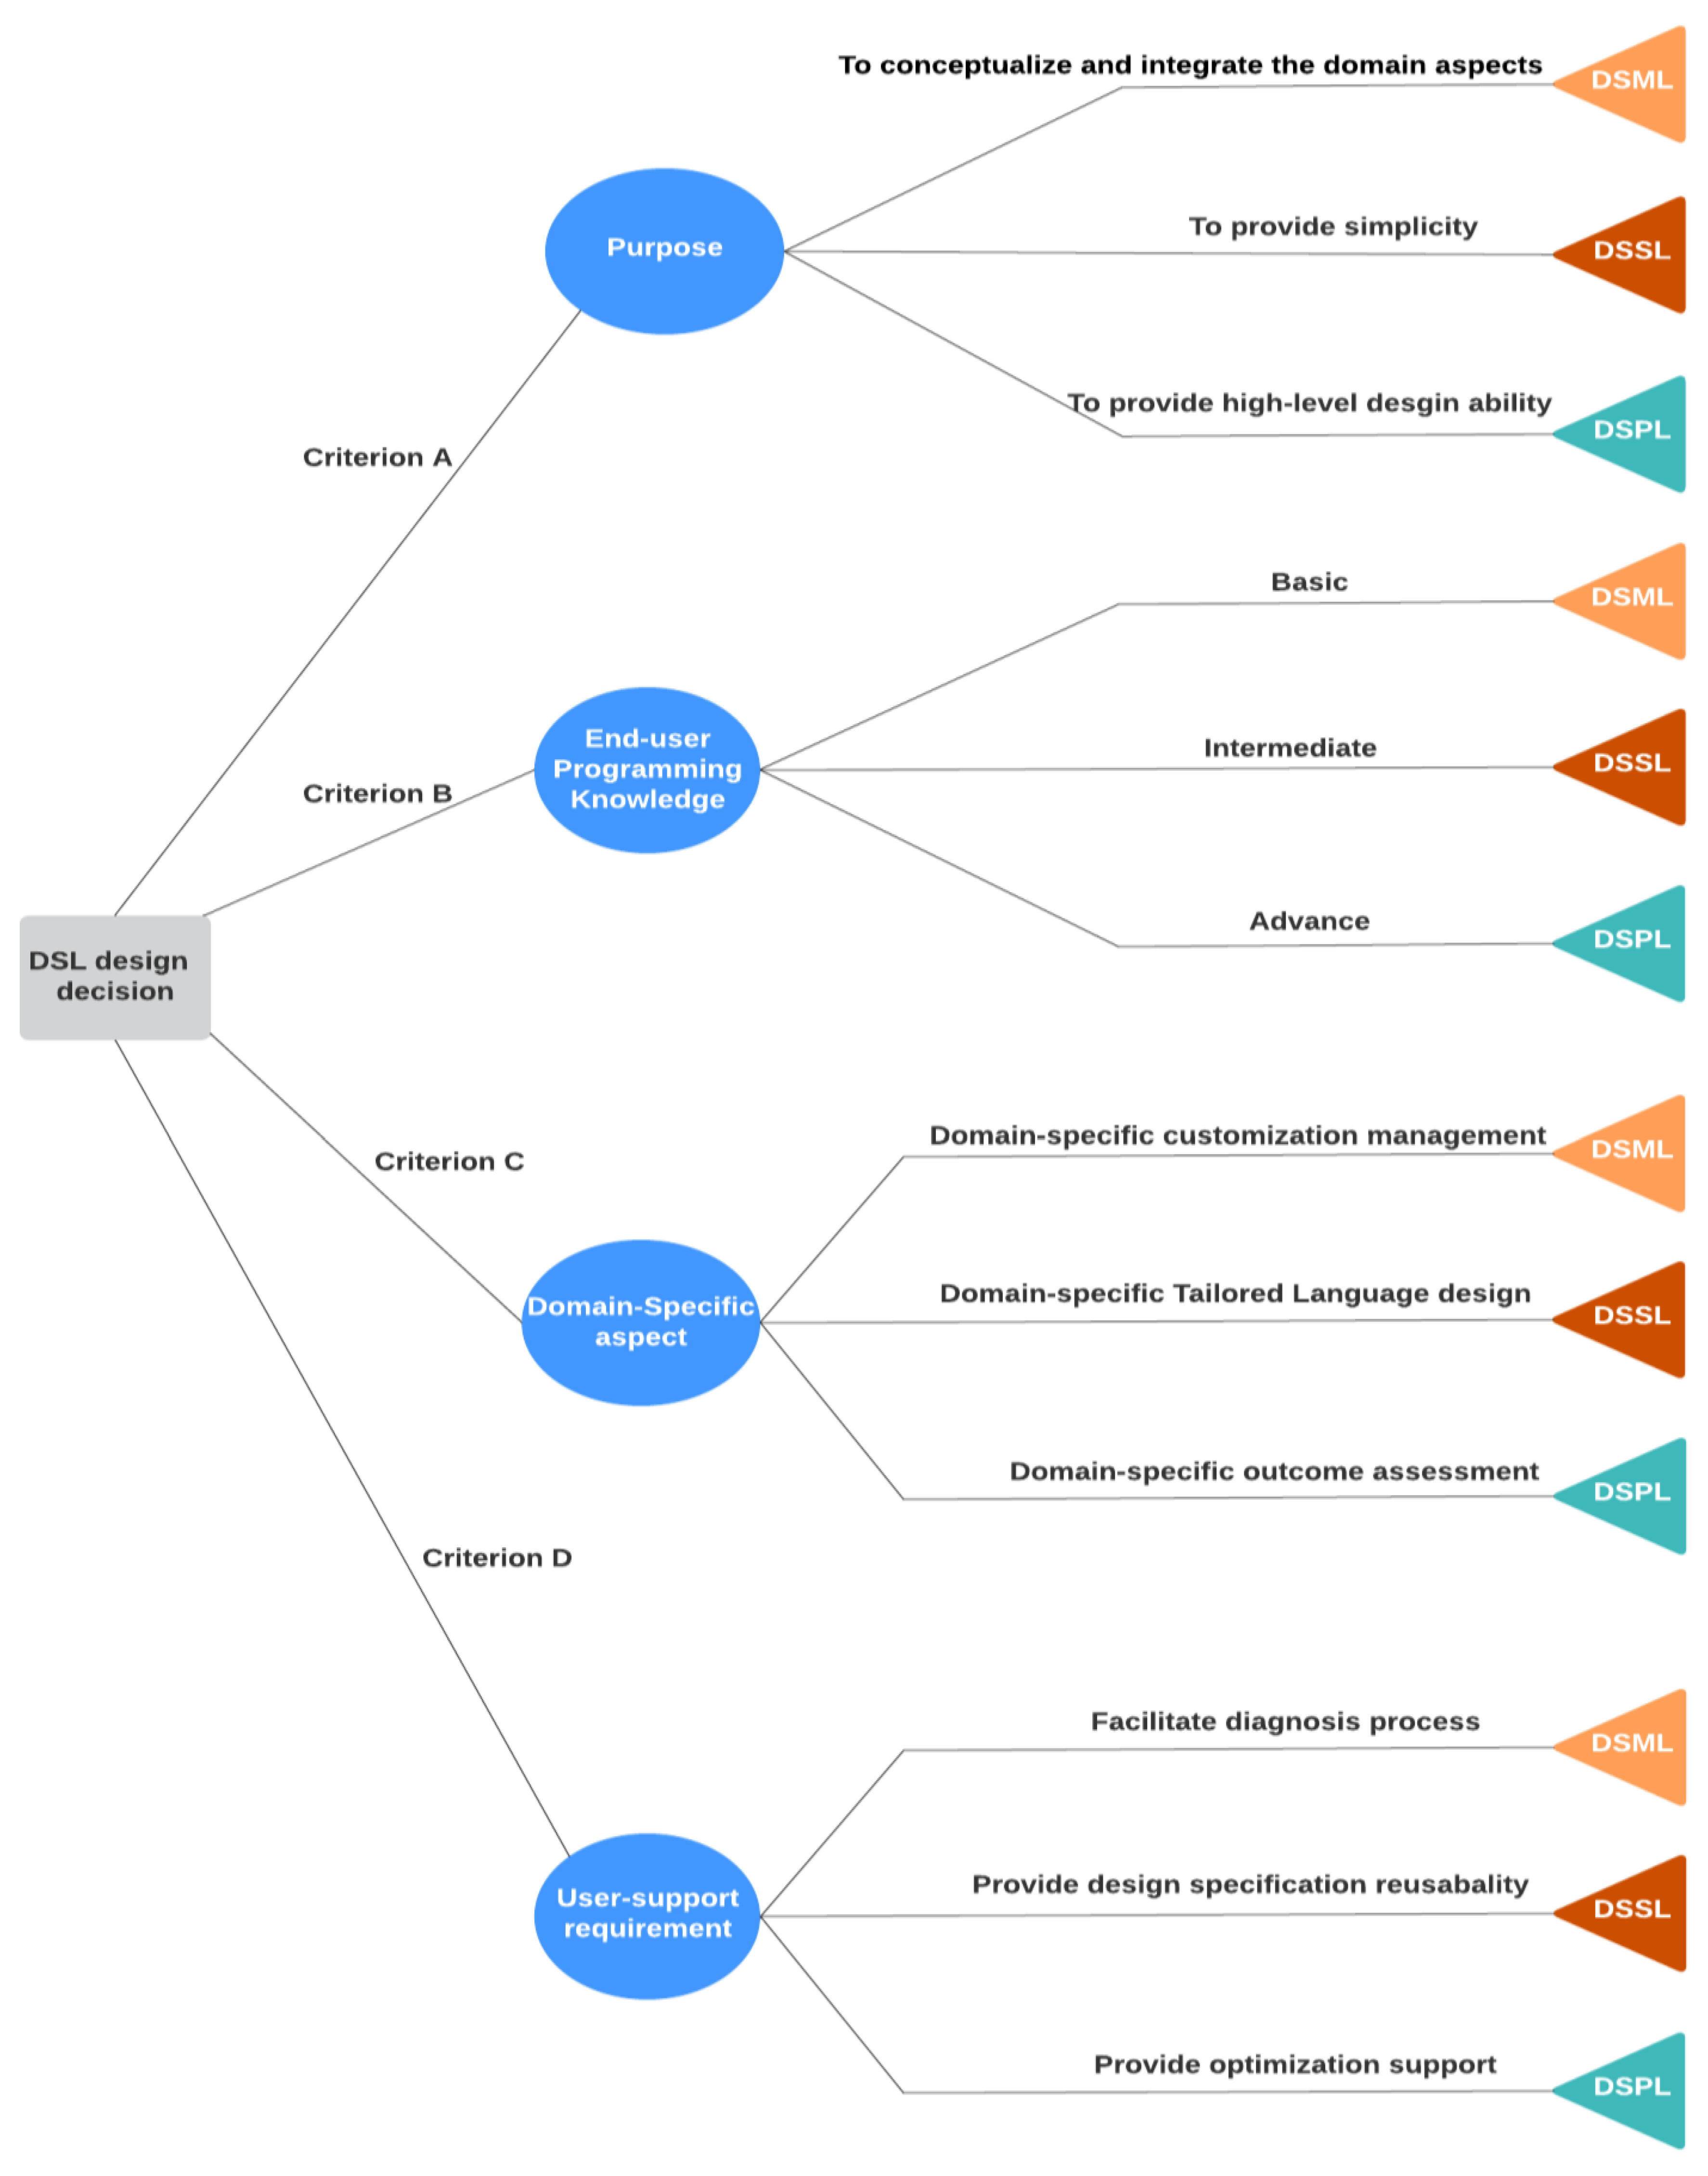
- Criterion A guides the decision-maker to choose the suitable DSL based on their purpose. Practitioners can decide on the type of DSL based on the main purpose that the DSL aims to serve. For example, if the purpose of creating a DSL is to provide high-level design ability to the VA developers, a DSPL would be the best fit.
- Criterion B is when the programming skills level of the VA developers is the main concern of the decision-maker. For instance, if the end-user is a solely a domain expert without any programming knowledge, a DSML where users interact with the language by means of a textual or graphical interface would be the best choice.
- Criterion C is when integrating a domain aspect into the VA design is the main motivation behind the creation of a DSL. For example, if one wants to provide the ability to customize the VA system based on the domain needs, the suitable DSL type would be DSML.
- Criterion D is when the user support requirement is the main motivation for creating the DSL, such as the case where the user needs design specification reusability. That is, when the VA developer wants to reuse a design specification repeatedly for different VA activities where DSSL is the best choice, whereas DSML supports the users’ requirement for handling diagnosis VA tasks.

6. Conclusions and Future Works
Author Contributions
Funding
Informed Consent Statement
Data Availability Statement
Conflicts of Interest
Appendix A

| ID# | Ref. No. | RQ1: DSL Type | RQ2: DSL Domain (Target) | RQ2: Domain Elements (Concepts) | Modeling or Language | Version | Benefits |
|---|---|---|---|---|---|---|---|
| 1 | [22] | DSML | Software project management | Widgets: concerns, name, library | Feature model from SPL using Familiar, Metamodel, Xtext | Prototype | Abstraction of domain concepts and variable user support. |
| 2 | [35] | DSML | Analyze employability in academia through dashboards | Functions, layouts, data | Feature model from SPL and Python processes XML configuration file on jinja2 code templates | Proof of Concept | Domain-specific customization management made possible. |
| 3 | [25] | DSML | Smart city visualization dashboard generation | Dashboard, visualizer, position, social media, map, charts, data source. | EMF (Ecore) implemented metamodel based on OMG MOF and Graphical DSL using Sirius | Minimum Viable Product | Closer language to the end user, abstraction of domain concepts. |
| 4 | [27] | DSML | Sensor data visualization dashboard | Data (what am I visualizing?), visualization type (how do I visualize?), spatial and temporal layout (where and when do I visualize it?) | DSML, metamodel, and feature model, Familiar code to model AmChart Library | Proof of Concept | No implementation knowledge is required; no library bound, high level of abstraction, and reusability of visualization. |
| 5 | [36] | DSML | What-if analysis for the bus transit system | Scenario-based simulation | Model-Integrated computing, TextX, SUMO Simulator | Proof of Concept | Provides the ability to generate what-if scenarios. |
| 6 | [12] | DSPL | Variational visualization | Composition of visualization into larger visualizations Allowing visualization to be transformed between Cartesian and polar coordinate systems | Choice calculus embedded in Purescript | Proof of Concept | Provides high-level design abilities for visualization such as an ability to group functionality into different layers. |
| 7 | [37] | DSPL | Incremental visualization using transformations | Layered abstraction: mark, primitive, visual parameter; Chart composition and layout, Functor, Monad | Functional programming idioms and type classes, Haskel-embedded | Proof of Concept | Host language can address some issues such as data handling and rendering, use of a known language by the corresponding user can facilitate visualization generation. |
| 8 | [38] | DSPL | Interactive domain-specific visualization | Marks, panels, built-in mark types, data transformations | JavaScript | Minimum Viable Product | Enable concise visualization definition |
| 9 | [39] | DSPL | Interactive domain-specific visualization | Visualization specification, interaction, animation | Java embedded | Minimum Viable Product | Separating specification from execution, simplifying development, enabling unobtrusive optimization, and supporting retargeting across platforms. |
| 10 | [40] | DSPL | Chart visualization domain-specific | Component, styles, data, and interactions | JSON | Open-source full-fledged product | Allow users to focus on visual design. Ability to design rich built-in interactions. |
| 11 | [41] | DSPL | Generate source code for data visualizations randomly. | - | XML-based syntax, D3 code generator for visualization | Proof of Concept | Language design can be tailored for different purposes, such as faster learning for ML models. |
| 12 | [42] | DSPL | Narrative visualization, storytelling | State-based scenes, visualization parameters, dynamic graphical and textual annotations, and interaction triggers | embedded in JavaScript syntax | Prototype | Enables storytelling without extensive programming, a decoupled implementation of narrative and visualization, and facilitates visualization generation. |
| 13 | [43] | DSPL | Visualization for web | Selection, Operators, Data joins, enter and exit, transitions, event handlers, modules | A JavaScript Library | Open-source full-fledged product | Allow language users to focus on the specifics of their application domain while freeing language developers to optimize processing. |
| 14 | [44] | DSSL | Analytic decisions, Multiverse analysis | Source code: Analysis code, placeholder variables: decision points, blocks: multiple snippets of code, constraints: dependencies between decision points, and code graphs: execution order of code blocks by DAG | Open-source full-fledged product | Ability to assess the output of visualization before making inferences, the sharing portion of the analysis code can be specified only once and be reusable. | |
| 15 | [11] | DSSL | Enterprise system interoperability | Layout, Interactions, Semantic/relationship visualization, hierarchical navigation | IFML implemented in DoME and Agile visualization engine | Prototype | Easy to use, highly abstract, no code writing makes it easier for non-programmers. |
| 16 | [34] | DSSL | Geovisualization | Filter, classification, data format, and visualization specification | External DSL using Google API | Proof of Concept | Reduces efforts of data pre-processing and visualization implementation, abstracts complexities, and less development time. |
| 17 | [45] | DSSL | Visualizing software dependencies using graphs | Nodes as software elements, edges as dependencies, layouts for specific situations of dependencies, global rules to avoid duplications | Pharo and Roassal | Open-source full-fledged product | Small and consistent language, produced visualization may be seen in either the host language framework or a browser. |
| 18 | [46] | DSSL | Interactive visualization | Selection, transformation | Vega JSON | Open-source full-fledged product | Enable search and inference over the space of visualizations, facilitate programmatic generation and retargeting of interactive visualizations |
References
- Khakpour, A.; Colomo-Palacios, R.; Martini, A. Visual Analytics for Decision Support: A Supply Chain Perspective. IEEE Access 2021, 9, 81326–81344. [Google Scholar] [CrossRef]
- Khakpour, A. Information Sharing for Customized Dynamic Visual Analytics: A Framework. CEUR Workshop Proc. 2021, 2906, 89–97. [Google Scholar]
- Nalchigar, S.; Yu, E. Business-driven data analytics: A conceptual modeling framework. Data Knowl. Eng. 2018, 117, 359–372. [Google Scholar] [CrossRef]
- Ltifi, H.; Kolski, C.; Ben Ayed, M. Survey on Visualization and Visual Analytics pipeline-based models: Conceptual aspects, comparative studies and challenges. Comput. Sci. Rev. 2020, 36, 100245. [Google Scholar] [CrossRef]
- Vázquez-Ingelmo, A.; García-Peñalvo, F.J.; Therón, R.; Conde, M. Representing Data Visualization Goals and Tasks through Meta-Modeling to Tailor Information Dashboards. Appl. Sci. 2020, 10, 2306. [Google Scholar] [CrossRef]
- Lam, H.; Tory, M.; Munzner, T. Bridging from Goals to Tasks with Design Study Analysis Reports. IEEE Trans. Vis. Comput. Graph. 2017, 24, 435–445. [Google Scholar] [CrossRef]
- Iung, A.; Carbonell, J.; Marchezan, L.; Rodrigues, E.; Bernardino, M.; Basso, F.P.; Medeiros, B. Systematic mapping study on domain-specific language development tools. Empir. Softw. Eng. 2020, 25, 4205–4249. [Google Scholar] [CrossRef]
- Kandel, S.; Paepcke, A.; Hellerstein, J.M.; Heer, J. Enterprise Data Analysis and Visualization: An Interview Study. IEEE Trans. Vis. Comput. Graph. 2012, 18, 2917–2926. [Google Scholar] [CrossRef]
- Wongsuphasawat, K.; Liu, Y.; Heer, J. Goals, Process, and Challenges of Exploratory Data Analysis: An Interview Study. arXiv 2019, arXiv:1911.00568 [cs]. [Google Scholar]
- Kelly, S.; Tolvanen, J.-P. Domain-Specific Modeling: Enabling Full Code Generation; John Wiley & Sons: Hoboken, NJ, USA, 2008. [Google Scholar]
- Morgan, R.; Grossmann, G.; Stumptner, M. VizDSL: Towards a Graphical Visualisation Language for Enterprise Systems Interoperability. In Proceedings of the 2017 International Symposium on Big Data Visual Analytics (BDVA), Adelaide, Australia, 7–10 November 2017; pp. 1–8. [Google Scholar]
- Smeltzer, K.; Erwig, M. A Domain-Specific Language for Exploratory Data Visualization. In Proceedings of the 17th ACM SIGPLAN International Conference on Generative Programming: Concepts and Experiences, New York, NY, USA, 5 November 2018; Association for Computing Machinery: Boston, MA, USA, 2018; pp. 1–13. [Google Scholar]
- Heer, J.; Card, S.K.; Landay, J.A. Prefuse: A Toolkit for Interactive Information Visualization. In Proceedings of the SIGCHI Conference on Human Factors in Computing Systems; Association for Computing Machinery: New York, NY, USA, 2005; pp. 421–430. [Google Scholar]
- Cook, K.A.; Thomas, J.J. Illuminating the Path: The Research and Development Agenda for Visual Analytics; IEEE Computer Society: Los Alamitos, CA, USA, 2005. [Google Scholar]
- Sedlmair, M.; Meyer, M.; Munzner, T. Design Study Methodology: Reflections from the Trenches and the Stacks. IEEE Trans. Vis. Comput. Graph. 2012, 18, 2431–2440. [Google Scholar] [CrossRef]
- Hevner, A.; Chatterjee, S. Design Science Research in Information Systems. In Design Research in Information Systems: Theory and Practice; Hevner, A., Chatterjee, S., Eds.; Integrated Series in Information Systems; Springer: Boston, MA, USA, 2010; pp. 9–22. ISBN 978-1-4419-5653-8. [Google Scholar]
- Shen, L.; Chen, X.; Liu, R.; Wang, H.; Ji, G. Domain-Specific Language Techniques for Visual Computing: A Comprehensive Study. Arch. Comput. Methods Eng. 2020, 28, 3113–3134. [Google Scholar] [CrossRef]
- Paige, R.F.; Kolovos, D.S.; Polack, F.A. A tutorial on metamodelling for grammar researchers. Sci. Comput. Program. 2014, 96, 396–416. [Google Scholar] [CrossRef]
- van Deursen, A.; Klint, P.; Visser, J. Domain-specific languages: An Annotated Bibliography. ACM SIGPLAN Not. 2000, 35, 26–36. [Google Scholar] [CrossRef]
- Rivera, J.E. On the Semantics of Real-Time Domain Specific Modeling Languages. Ph.D. Thesis, University of Malaga, Málaga, Spain, 2010. [Google Scholar]
- González-Torres, A.; García-Peñalvo, F.J.; Therón-Sánchez, R.; Colomo-Palacios, R. Knowledge discovery in software teams by means of evolutionary visual software analytics. Sci. Comput. Program. 2016, 121, 55–74. [Google Scholar] [CrossRef]
- Logre, I.; Déry-Pinna, A.-M. MDE in Support of Visualization Systems Design: A Multi-Staged Approach Tailored for Multiple Roles. Proc. ACM Hum.-Comput. Interact. 2018, 2, 1–17. [Google Scholar] [CrossRef]
- Alves, Â.P.; Milani, A.M.P.; Manssour, I.H. Visual Analytics System for Energy Data in Smart Cities and Buildings. In Proceedings of the 2020 IEEE International Smart Cities Conference (ISC2), Virtual, 28 September 2020; pp. 1–8. [Google Scholar]
- Pettit, C.; Lieske, S.N.; Jamal, M. CityDash: Visualising a Changing City Using Open Data. In Planning Support Science for Smarter Urban Futures; Geertman, S., Allan, A., Pettit, C., Stillwell, J., Eds.; Lecture Notes in Geoinformation and Cartography; Springer International Publishing: Cham, Switzerland, 2017; pp. 337–353. ISBN 978-3-319-57819-4. [Google Scholar]
- Rojas, E.; Bastidas, V.; Cabrera, C. Cities-Board: A Framework to Automate the Development of Smart Cities Dashboards. IEEE Internet Things J. 2020, 7, 10128–10136. [Google Scholar] [CrossRef]
- Langer, T.; Meisen, T. Visual Analytics for Industrial Sensor Data Analysis. In Proceedings of the 23rd International Conference on Enterprise Information Systems; 26–28 April 2021; SCITEPRESS-Science and Technology Publications: Setúbal, Portugal, 2021; pp. 584–593. [Google Scholar]
- Logre, I.; Mosser, S.; Collet, P.; Riveill, M. Sensor Data Visualisation: A Composition-Based Approach to Support Domain Variability. In Modelling Foundations and Applications; Springer: Berlin/Heidelberg, Germany, 2014; Volume 8569, pp. 101–116. [Google Scholar]
- Kosar, T.; Bohra, S.; Mernik, M. Domain-Specific Languages: A Systematic Mapping Study. Inf. Softw. Technol. 2016, 71, 77–91. [Google Scholar] [CrossRef]
- do Nascimento, L.M.; Viana, D.L.; Neto, P.; Martins, D.; Garcia, V.C.; Meira, S. A Systematic Mapping Study on Domain-Specific Languages. In Proceedings of the Seventh International Conference on Software Engineering Advances (ICSEA 2012), Lisbon, Portugal, 18–23 November 2012; pp. 179–187. [Google Scholar]
- Kitchenham, B. Procedures for Performing Systematic Reviews; Keele University: Keele, UK, 2004; pp. 1–26. [Google Scholar]
- Sánchez-Gordón, M.; Colomo-Palacios, R. Taking the emotional pulse of software engineering—A systematic literature review of empirical studies. Inf. Softw. Technol. 2019, 115, 23–43. [Google Scholar] [CrossRef]
- Wohlin, C.; Runeson, P.; Höst, M.; Ohlsson, M.C.; Regnell, B.; Wesslén, A. Experimentation in Software Engineering; Springer Science & Business Media: Berlin, Germany, 2012. [Google Scholar]
- Ledur, C.L. Gmavis: A Domain-Specific Language for Large-Scale Geospatial Data Visualization Supporting Multi-Core Parallelism; Pontifícia Universidade Católica do Rio Grande do Sul: Porto Alegre, Brazil, 2016. [Google Scholar]
- Ledur, C.; Griebler, D.; Manssour, I.; Fernandes, L.G. A High-Level DSL for Geospatial Visualizations with Multi-Core Parallelism Support. In Proceedings of the 2017 IEEE 41st Annual Computer Software and Applications Conference (COMPSAC), Turin, Italy, 4–8 July 2017; Volume 1, pp. 298–304. [Google Scholar]
- Vázquez-Ingelmo, A.; García-Peñalvo, F.J.; Therón, R. Domain Engineering for Generating Dashboards to Analyze Employment and Employability in the Academic Context. In Proceedings of the Sixth International Conference on Technological Ecosystems for Enhancing Multiculturality, Salamanca, Spain, 24–26 October 2018; Association for Computing Machinery: New York, NY, USA, 2018; pp. 896–901. [Google Scholar]
- Sun, R.; Gui, R.; Neema, H.; Chen, Y.; Ugirumurera, J.; Severino, J.; Pugliese, P.; Laszka, A.; Dubey, A. TRANSIT-GYM: A Simulation and Evaluation Engine for Analysis of Bus Transit Systems. In Proceedings of the 2021 IEEE International Conference on Smart Computing (SMARTCOMP), Irvine, CA, USA, 23–27 August 2021; pp. 69–76. [Google Scholar]
- Smeltzer, K.; Erwig, M.; Metoyer, R. A Transformational Approach to Data Visualization. In Proceedings of the 2014 International Conference on Generative Programming: Concepts and Experiences, Västerås, Sweden, 15–16 September 2014; Association for Computing Machinery: New York, NY, USA, 2014; pp. 53–62. [Google Scholar]
- Bostock, M.; Heer, J. Protovis: A Graphical Toolkit for Visualization. IEEE Trans. Vis. Comput. Graph. 2009, 15, 1121–1128. [Google Scholar] [CrossRef]
- Heer, J.; Bostock, M. Declarative Language Design for Interactive Visualization. IEEE Trans. Vis. Comput. Graph. 2010, 16, 1149–1156. [Google Scholar] [CrossRef]
- Li, D.; Mei, H.; Shen, Y.; Su, S.; Zhang, W.; Wang, J.; Zu, M.; Chen, W. ECharts: A declarative framework for rapid construction of web-based visualization. Vis. Inform. 2018, 2, 136–146. [Google Scholar] [CrossRef]
- Teng, Z.; Fu, Q.; White, J.; Schmidt, D.C. Sketch2Vis: Generating Data Visualizations from Hand-Drawn Sketches with Deep Learning. In Proceedings of the 2021 20th IEEE International Conference on Machine Learning and Applications (ICMLA), Pasadena, CA, USA, 13–16 December 2021; pp. 853–858. [Google Scholar]
- Satyanarayan, A.; Heer, J. Authoring Narrative Visualizations with Ellipsis. Comput. Graph. Forum 2014, 33, 361–370. [Google Scholar] [CrossRef]
- Bostock, M.; Ogievetsky, V.; Heer, J. D³ Data-Driven Documents. IEEE Trans. Vis. Comput. Graph. 2011, 17, 2301–2309. [Google Scholar] [CrossRef] [PubMed]
- Liu, Y.; Kale, A.; Althoff, T.; Heer, J. Boba: Authoring and Visualizing Multiverse Analyses. IEEE Trans. Vis. Comput. Graph. 2020, 27, 1753–1763. [Google Scholar] [CrossRef]
- Bergel, A.; Maass, S.; Ducasse, S.; Girba, T. A Domain-Specific Language for Visualizing Software Dependencies as a Graph. In Proceedings of the 2014 Second IEEE Working Conference on Software Visualization, Victoria, BC, Canada, 29–30 September 2014; pp. 45–49. [Google Scholar]
- Satyanarayan, A.; Moritz, D.; Wongsuphasawat, K.; Heer, J. Vega-Lite: A Grammar of Interactive Graphics. IEEE Trans. Vis. Comput. Graph. 2016, 23, 341–350. [Google Scholar] [CrossRef]


| Type of Information | Research Questions | Extracted Information | Source (ID#) * |
|---|---|---|---|
| Contribution of the study | RQ1 | The type of DSLs | [1]–[18] |
| Context of the study | RQ2 | The application domains DSL used for | [1]–[4], [7]–[10], [12], [13], [15], [16], [18] |
| The outcome of the study | RQ3 | Benefits of the DSL method for VA system | [1]–[3], [6], [8]–[11], [15], [17] |
| Limitations of the study | RQ3 | Limitation of the DSL method for the VA system | [10] |
| Quality Aspect | Question |
|---|---|
| Selection and measurement bias | Are the inferences based on the subject of the study? |
| Validity | Is the methodology of the study scientific and well defined? |
| Generalizability | Whether the study is validated with a suitable test case? |
| Action | 1st Round (Title and Abstract Relevancy) | 2nd Round (Full-Text Relevancy) | 3rd Round (Backward-Snowballing) | 4th Round (Short and Duplicate Report Exclusion) | Final Review | |
|---|---|---|---|---|---|---|
| Database | ||||||
| ACM DL | 573 | 7 | 6 | 7 | 5 | |
| IEEEXplore | 997 | 34 | 12 | 14 | 11 | |
| ScienceDirect | 989 | 6 | 2 | 2 | 1 | |
| SpringerLink | 632 | 14 | 1 | 1 | 0 | |
| Wiley OL | 211 | 3 | 1 | 1 | 1 | |
| Total | 3402 | 64 | 22 | 25 | 18 | |
Disclaimer/Publisher’s Note: The statements, opinions and data contained in all publications are solely those of the individual author(s) and contributor(s) and not of MDPI and/or the editor(s). MDPI and/or the editor(s) disclaim responsibility for any injury to people or property resulting from any ideas, methods, instructions or products referred to in the content. |
© 2023 by the authors. Licensee MDPI, Basel, Switzerland. This article is an open access article distributed under the terms and conditions of the Creative Commons Attribution (CC BY) license (https://creativecommons.org/licenses/by/4.0/).
Share and Cite
Khakpour, A.; Colomo-Palacios, R.; Martini, A.; Sánchez-Gordón, M. The Use of Domain-Specific Languages for Visual Analytics: A Systematic Literature Review. Technologies 2023, 11, 37. https://doi.org/10.3390/technologies11020037
Khakpour A, Colomo-Palacios R, Martini A, Sánchez-Gordón M. The Use of Domain-Specific Languages for Visual Analytics: A Systematic Literature Review. Technologies. 2023; 11(2):37. https://doi.org/10.3390/technologies11020037
Chicago/Turabian StyleKhakpour, Alireza, Ricardo Colomo-Palacios, Antonio Martini, and Mary Sánchez-Gordón. 2023. "The Use of Domain-Specific Languages for Visual Analytics: A Systematic Literature Review" Technologies 11, no. 2: 37. https://doi.org/10.3390/technologies11020037
APA StyleKhakpour, A., Colomo-Palacios, R., Martini, A., & Sánchez-Gordón, M. (2023). The Use of Domain-Specific Languages for Visual Analytics: A Systematic Literature Review. Technologies, 11(2), 37. https://doi.org/10.3390/technologies11020037