Article

Data Model Design to Support Data-Driven IT Governance Implementation

1
Department of Mechanical and Aerospace Engineering, Sapienza University of Rome, Via Eudossiana, 18, 00184 Rome, Italy
2
FSTechnology, Piazza della Croce Rossa, 1, 00161 Rome, Italy
*
Author to whom correspondence should be addressed.
Technologies 2022, 10(5), 106; https://doi.org/10.3390/technologies10050106
Submission received: 31 August 2022 / Revised: 2 October 2022 / Accepted: 4 October 2022 / Published: 8 October 2022

Abstract

:
Organizations must quickly adapt their processes to understand the dynamic nature of modern business environments. As highlighted in the literature, centralized governance supports decision-making and performance measurement processes in technology companies. For this reason, a reliable decision-making system with an integrated data model that enables the rapid collection and transformation of data stored in heterogeneous and different sources is needed. Therefore, this paper proposes the design of a data model to implement data-driven governance through a literature review of adopted approaches. The lack of a standardized procedure and a disconnection between theoretical frameworks and practical application has emerged. This paper documented the suggested approach following these steps: (i) mapping of monitoring requirements to the data structure, (ii) documentation of ER diagram design, and (iii) reporting dashboards used for monitoring and reporting. The paper helped fill the gaps highlighted in the literature by supporting the design and development of a DWH data model coupled with a BI system. The application prototype shows benefits for top management, particularly those responsible for governance and operations, especially for risk monitoring, audit compliance, communication, knowledge sharing on strategic areas of the company, and identification and implementation of performance improvements and optimizations.

1. Introduction

In any organization, in order to achieve the best results, performance management must involve people at all levels of management. Performance management is one of the standard mechanisms for improving alignment between business unit/customer management and personnel [1].
In particular, performance management has been recognized as a crucial mechanism in information technology, although the literature is scarce in this field [2]. Information technology (IT) companies and high-tech companies belong to the category of technology companies (also known as tech companies). They provide technology products or services, such as electronics-based technology products, including activities related to digital electronics, software, and Internet-related services (e.g., e-commerce services; examples of tech company are Apple Inc., Samsung, Alphabet Inc., Meta, Intel, Microsoft, and Alibaba) [3]. In this dynamic business environment, the IT structure supports the flexible and effective use of technology systems and products to grow the business and improve cost efficiency. Therefore, centralized governance is needed to guide, coordinate, and support the business. IT governance has also been recognized as a structure that specifies decision rights and an accountability framework to encourage desirable behaviors [4]. Additionally, it is critical in providing strategic direction to ensure that goals are met, risks are properly managed, and company resources are used appropriately [5]. Researchers put their efforts into investigating IT governance, methods, techniques, and tools to support decision making and align IT with business strategies and different frameworks. The Calder–Moir IT Governance Framework (Figure 1) was designed to help organizations by using these overlapping frameworks and standards and deploying the best-practice guide contained in ISO/IEC 38500. Calder argued that none of the international standards provide comprehensive guidance and that most standards have overlapping issues; therefore, he proposed the Calder–Moir IT Governance Framework [6]. The result is a series of proposals and plans that describe the characteristics of the business and IT, the expected performance, the changes needed to achieve that performance, and the resource implications [7].
As outlined in the literature and by the Information Technology Governance Institute (ITGI), the domains of IT governance are IT strategic alignment, IT value delivery, IT risk management, IT resource management, and IT performance monitoring [8,9,10]. IT delivery value is enabled by IT strategic alignment with the business. Risk management is driven by embedding accountability in the enterprise; it needs to be supported by reliable measures to verify the results achieved (Figure 2).
The performance measurement domain has been considered as one of the most important for increasing the organization’s capabilities and the IT governance maturity [11]. Therefore, the implementation of an enterprise performance measuring system is an integral part of effective IT governance [12]. However, literature highlights a gap between theoretical frameworks and practices and states that, although hard governance (structures, procedures) attracts the attention of many, soft governance (behaviour, collaboration) could be crucial in bridging the gap [13,14,15,16]. Therefore, this research aimed to investigate the soft governance practices and contribute to designing a decisional support system to implement data-driven governance. The literature scouting outlined limitations in the implementation of governance practices. As such, the proposed approach intends to help bridge this gap. Starting from the previewed research work, it extends the area of monitoring, overcoming the main limitation by structuring a data model that includes not only project information but also data sources from other organizations, providing comprehensive and organized reporting, as a key element in guiding organizations in such an ever-changing environment [17]. Therefore, the research proposes a solution that enables information sharing as one of the missions of governance in organizations and facilitates monitoring of the identified critical governance area, overcoming the current limitations in governance [18]:
  • siloed information management;
  • non-standardized data extraction; and
  • lack of report development techniques.
The proposed repository data model can support online analytical processing (OLAP) and make available the information needed for decision making, providing flexibility and autonomy to users in data analysis and reporting.
The proposed model was then tested on a case-study, FSTechnology, which is part of the Italian Ferrovie dello Stato Group. It is an Italian rail transportation company with about 83,000 employees. It has declared its intention to invest EUR 58 billion, EUR 6 billion of which is earmarked for innovation and technology, as stated in its 2019–2023 strategic plan. FSTechnology was born in 2019 and is a services company dedicated to technology and innovation initiatives in support of the parent group. It is a multi-sourcing integration company, and its market extends to rail, freight, infrastructure, bus, and services.
Therefore, it helped support the main needs for data-driven governance-monitoring by linking IT performance measurement with data-driven solutions. The main results obtained attested to the bridging of the gap that emerged. Its managerial implications have led to (i) the availability of critical information across the enterprise; (ii) a centralized visualization by which to monitor processes and implement process improvements; (iii) compliance verification activities; (iv) management support in data reporting (e.g., rapid and reliable reporting of critical information to the advisory board or to customers); (v) increased digitization through automation of daily manual tasks in updating data; (vi) improved contract and subcontract monitoring and formalization of new ones; (vii) optimization of financial area monitoring; (viii) scalability that enables rapid customization of reporting at any organizational level; and (ix) the ability to further integrate unstructured data from operations.
The remainder of the paper is organized as follows. Section 2 describes the state-of-the-art decision support system for data-driven governance and the data model of a data warehouse (DWH) coupled with a BI as one of the DSS systems. Section 3 outlines the methodology applied to design the data model and a description of the ER diagram, highlighting the main results, along with the BI reporting system developed for analysis. Section 4 reviews strengths and weaknesses of the proposed solution and managerial implications discussing the main obtained results, and finally, Section 5 summarizes the main contributions and limitations of this work, documenting the potential for future research.

2. Background—Literature Review

2.1. Performance Measurement

Performance measurement has been recognized as the key element in bringing value to the business through IT and increasing the level of IT maturity [19,20]. In addition, a CIO’s role is to attest to where the business is and show the business intelligence dashboards representing the state of the organization and the metrics identified (e.g., showing the total cost of ownership (TCO) and service level performance) toward the use of business intelligence (BI) [21,22]. Therefore, the performance measurement domain helps the organization make an effective decision structure, especially regarding IT principles, infrastructure management, and investments [23]. This holds especially true in governance, wherein the focus on decisional problems is growing, pushing toward data-driven decision making [24]. The means of value creation has shifted from tangible to intangible assets, and the latter cannot be measured by using traditional financial measures. The first method proposed for organizations’ performance measurement is the balance scorecard (BSC). It has four measurement perspectives: customer focus, process efficiency, and ability to learn and grow. Each perspective is designed to answer the question about how the organization operates. As such, organizations consider intangible items (e.g., level of customer satisfaction, streamlining of internal functions, creation of operational efficiencies, and developing staff skills). This allows long-term strategic goals to be linked with short-term actions through a single, more complete view of business operations. However, setting clear goals and measures is still a challenge and requires cooperation among different levels of governance within the company. Thus, BSC should include cause-and-effect relationships, which are difficult to implement [25]. Others have proposed the use of critical success factors (CSF) and key performance indicators (KPI) to monitor performance. Nowadays, the importance of data leads organizations to adopt business intelligence and analytics to uncover hidden information and accelerate organizational performance and innovation [26,27]. A performance measurement system (PMS) is defined as a system for assessing organizational performance in qualitative and quantitative terms through financial and non-financial indicators. The evaluated data are essential for making strategic decisions [28,29]. IT governance standards (proposed by ISO), repositories of best-practices and recommendations (e.g., ITIL, COBIT), methods (e.g., BSC) and models (e.g., capability maturity model integration (CMMI)), are widely used to reduce the complexity of decision making. However, the lack of a standardized measurement method leads to poor data consistency and practical implementation of performance monitoring [30]. Some studies have suggested that understanding the governance process, along with monitoring IT performance, is critical to the effective implementation of IT governance. Therefore, relational mechanisms, also known as the communication approach, along with knowledge sharing are effective supports in disseminating IT governance principles, policies, and decision outcomes to stakeholders [31]. Knowledge sharing is the provision of information and know-how to support the other person in collaborating to solve the problems, implement policies or procedures, or develop ideas [32]. A knowledge-sharing strategy has been recognized as a fundamental part of organizational strategy, as it enables adequate response to business needs and, consequently, the implementation of a long-term strategy [33].
Therefore, this study analysed the supporting methods and tools in performance measurement. Although the gap between IT and management may increase with this implementation, it is crucial to bridge the gap between a performance management system, business intelligence, and analytics, which must be integrated with each other [34]. The data warehouse (DWH) is a key element of a BI system, supporting data integration, storage, processing, analysis, and reporting [22].
Finally, such systems have been recognized as crucial company assets in several fields, such as: in the area of security incident analysis, where alerts and events from different Internet security sources are stored in a single data warehouse [35], or in the field of Earth observation, wherein the concept of a multidimensional data model has been used [36]. Other fields of application include health care, wherein a unified data framework has been proposed with the aim of simplifying the health information system infrastructure [37], and in manufacturing to improve the quality of productivity [38,39].

2.2. Decision Support System for a Data-Driven Governance Background

Since ancient times, the intelligence of decision-making has been recognized as crucial. Despite the amount of research in decision making, it still remains one of the biggest challenges [40]. Since the 1960s the topic of decision making has attracted the attention of academics and practitioners, when organisations implemented transaction-processing systems for analysing operations. Nevertheless, there is a gap in using analytics to their advantage. Later, decision support was combined with computers, which led to decision support systems (DSS) and executive support systems (ESS) [40]. In the 1990s, organizations began to realize the importance of a business intelligence, following the development of data warehousing [41,42], and online analytical processing (OLAP) [43]. Next, the complexity of data coming from different sources requires data integration and identification of KPIs to extract relevant information to support decision makers. The digitalization of decision making belongs to the governance domains along with performance measures (Figure 2); as such, decision support systems are information systems designed to enable these activities. Decision support systems refer to a field of research that includes the design and study of DSS application, clustered in five components [44,45,46]:
  • Model driven;
  • Data driven;
  • Communication driven;
  • Document driven; and
  • Knowledge driven.
One of the most popular DSS tools is the balance score card (BSC), which integrates financial and non-financial indicators, as mentioned in Section 2.1. Later, the two creators (Kaplan and Norton) extended the tool to the strategy map (SM) [47] (both represented in the Business Strategy quadrant by Calder in Figure 1). The SM provides a cause-and-effect relationship among indicators. Others proposed activity-based costing/management or performance PRISM as a DSS system [47]. However, they require a great deal of human activity to implement. Digitalization allows one to collect a large amount of data, which companies use to develop strategies and make decisions. The development of IT enables these systems not only to reason about knowledge and provide detailed financial information, but also to predict future measures. They can be used to measure enterprise performance, to support decision makers in rapid evaluations of measured values and to predict future measures. Later, they were called retrieval-only DSS, executive information systems, OLAP systems and BI. A BI system is a data-driven DSS that provides support in querying a historical database and reports [44]. The greatest capability of data-driven DSS occurred in the early 1990s with the introduction of OLAP. The key element in the success of a data-driven DSS is ease of use and quick access to a large amount of accurate and organized multidimensional data [46].
DSSs are usually classified into three groups to support the identification of the most suitable one for the purpose [48]:
  • Passive: This group does not suggest any decision but helps decision makers in the decision-making process; it is common in field operations in the organization.
  • Active: This group recommends decisions and gives advice to the decision makers. It requires the active participation of managers or leaders in organizations to define gaps in processes or improvements in the organization.
  • Cooperative: This is a framework designed for making decisions on behalf of the decision makers. These proposals are then fine-tuned and validated by decision makers.
In summary, a data-driven DSS represents a support in governance providing insights and analytics to estimate impacts of the different policy options [49]. It is, thus, a necessary IT tool for a technology company, to support strategic and operational decisions [50] and to enable activities of data-driven governance.

2.3. Data Model for DWH Coupled with a BI System for Data-Driven Governance

To adequately address the design of a data model, a literature review was conducted with the goal of finding the optimal solution for designing a data warehouse data model for BI purposes as a support for analysing and reporting crucial business information in a data-driven governance context. Both the development and management of a BI system have emerged as critical activities, in light of the demonstrated effectiveness of a business intelligence technology along with the data warehouse for decision-making process support [51,52].
The term business intelligence was coined in 1958 by Luhn and defined as: “the ability to apprehend the interrelationships of presented facts in such a way as to guide action towards a desired goal” [53]. This tool can transform data into information and, through human analysis, into knowledge [54].
The main question that a BI can answer is:
  • What is happening now and why?
    In contrast, business analytics can answer the question:
  • What will probably happen in the future?
    BI refers to immediate answer and the central elements are [50]:
  • real-time data warehousing;
  • detection of exceptions and anomalies;
  • automatic learning and refining;
  • seamless workflow; and
  • data mining.
The BI system gathers data from a variety of sources, and the main differences between BI and big data are highlighted below [55] in Table 1:
The types of data come from the following sources:
  • Unstructured: e.g., conversations, graphics, images, and movies.
  • Structured: e.g., data coming from OLAP, data warehouse (DWH), data marts (DM), enterprise information system (EIS) or enterprise resource planning (ERP).
In summary, BI has been widely used to describe the process of gathering, analysing, and transforming large amounts of data into information for decision makers [40]. Although the use of big data is highly promoted today, standard relational databases are still essential [56]. The purpose of BI performance monitoring and control of an organization is to support many users; it should not be directed at solving a single business problem, but should support a group of users in different business decisions [57]. Therefore, difficulties occur both when an information cube (data warehouse) must support all levels of business, and when a single group of data must feed several BI tools, resulting in the loss of performance. When implementing a BI system, a trade-off between a bottom-up and top-down approach must be considered. Another key aspect is that the system must be connected and adhere to the processes of the organization to convey correct information. For this reason, the criticality of the data model design in developing a BI system emerges. Finally, business intelligence and analytics frameworks enable linking different business elements (organizational rules, KPIs, authorizations, and visualizations).
The data warehouse for BI purposes must ensure that data is available in the right form for analytical processing activities, such as OLAP, queries, reporting, and other decision support applications [58]. In addition, the design is highly dependent on both data sources and user needs [59]. Bill Inmon defined the DWH as follows: “A warehouse is a subject-oriented, integrated, time variant and non-volatile collection of data in support of management’s decision-making process”. Ralph Kimball defined it as follows: “A warehouse is a copy of transaction data specifically structured for query and analysis”. A data warehouse is a large repository that collects data from internal databases, such as operational data, and databases outside the organization. Its main characteristics are that it is topic-driven, its data is stored in a single source, and that it is time varying and not volatile [41,60]. In summary, operational databases are different from data warehouses, so user queries have no impact on these systems. Furthermore, the integration of BI and DWH enables an organizational operational platform for decision making, ensuring the security of data access [51,61]. Maryska et al. proposed a DWH architecture based on a traditional BI solution, with the aim of integrating it into the enterprise architecture of any organization to support the implementation of cost allocation, profitability, and management within the analytics task performed [62]. Researchers propose using data integration and business analytics techniques to define a data governance model that measures data quality [5]. Although the design of DWH along with BI systems is a well-established practice, the literature on IT governance application is still poor.
To prepare a data warehouse for BI purposes, the data collected must be cleaned, integrated, and transformed. Integration includes such operations as identifying and resolving data conflicts and removing redundancies. At this stage, different types of data are stored while maintaining the same format throughout the extract transform load (ETL) process [60]. In an integrated architecture, the ETL layer enables improvements in data quality and consistency and the flow of information between systems [51]. Data quality has been classified into four dimensions: intrinsic, contextual, representational, and accessibility [63,64]. The repository containing the data can range from spreadsheet to mainframe systems, after data modelling a crucial part of ensuring data quality is ETL, which is a key component of the DWH. Therefore, proper design of this process is necessary for data integrity and quality improvement, as it refreshes the DWH with updated and added data in source systems since the last extraction [65]. Extraction and transformation are the same in both Kimball’s and Inmon’s approaches, whereas the loading process differs in that clean data are loaded directly into data marts and then into a central DWH. The literature recommends the use of Kimball’s DWH design method in organizations where people operate in different departments/units and information is siloed [66]. Therefore, we adopt Kimball’s approach to develop the model.
The data model typically defines the dataset for an application and supports the development of information systems by providing the definition and format of the data [67]. The literature states that there are no standard methods for implementing the conceptual model [67,68]; hence, the designer must choose the right data model based on the application. In addition, the common and main criteria needed to evaluate a data warehouse design methods are correctness, completeness, minimization, and comprehensibility [69].
To support the designer in obtaining a data warehouse data model, several approaches have been proposed. The main proposed methods, based on operational systems, can be grouped into [70] the structure-based method, known as a data-driven approach, and the process-based approach [22,71]. The former considers that the data sources available in operational systems influence the conceptual and logical design of the data warehouse. However, this approach highlights a lack of guidance in identifying the DWH model, a gap between the design and behavioural aspects of the system and a manual transformation required to obtain the model. The latter is aimed at designing a DWH that can provide the measurement of business performance. Therefore, it requires a deep understanding of business processes and their relationships, identifying the necessary data source. The main advantage is that it incorporates process performance measures into the process activities, giving those performing the process the opportunity to get an accurate picture of the business [72]. In this research, the structured-based approach was chosen, as explained in Section 3. The dimensional model design technique represents data in a standard framework and is based on the following principles: focus on the business, build an appropriate information infrastructure, provide meaningful increments [42]. The dimensional model consists of facts, which represent key tables and dimensions, indicating the details and features. The main model design techniques are [73] as follows:
  • Star Schema: This is a simple model, which the dimension tables are directly related to the fact table. However, this model does not consider the necessary storage space and data normalization.
  • Snowflake Schema: This model allows normalization of dimensions, and hierarchies are separated. This model has better maintenance agility by reducing the number of redundancies.
Other approaches proposed in the literature for modelling a data warehouse are multi-dimensional modelling (MDM) [42] and normalized modelling (data mart) [41]. The former is able to process data quickly and has advanced data warehouse features [50]; it is also used for decision support in BI [74,75]. It consists of fact tables and multi-dimensional tables [76]. Therefore, the MDM mainly addresses business process or transaction, and it is simple to design. The second, on the other hand, is used for data integration and redundancy reduction; often a combination of the two methods is applied to two-tier data model [77]. Researchers proposed the data vault model, which consists of using the many-to-many relationship of all entities at the beginning. This means representing the worst-case scenario at the initial stage, and it is easier to modify the architecture, if a user requirements change [57]. Moreover, another area of investigation is the optimization of a multi-dimensional data model by using a multi-criteria decision-making approach, in order to increase the flexibility of the data model for BI purposes [78]. However, the optimization problem is beyond the scope of this work. In addition, others have defined a multi-dimensional reference models to allow designers to adapt the model of a specific company and facilitate the design and development of a BI system solution [79].

3. Proposed Approach and Results

This section describes the proposed approach used to design and develop the data model and the resulting dashboards to support data-driven governance implementation. The data model of a DWH coupled with a BI system was designed according to the main steps outlined in the literature: (i) requirements analysis; (ii) data source analysis; (iii) data warehouse modelling; ETL process; and (iv) reporting [80,81]. This section describes the proposed approach and the main results obtained in contributing to a data-driven governance implementation.

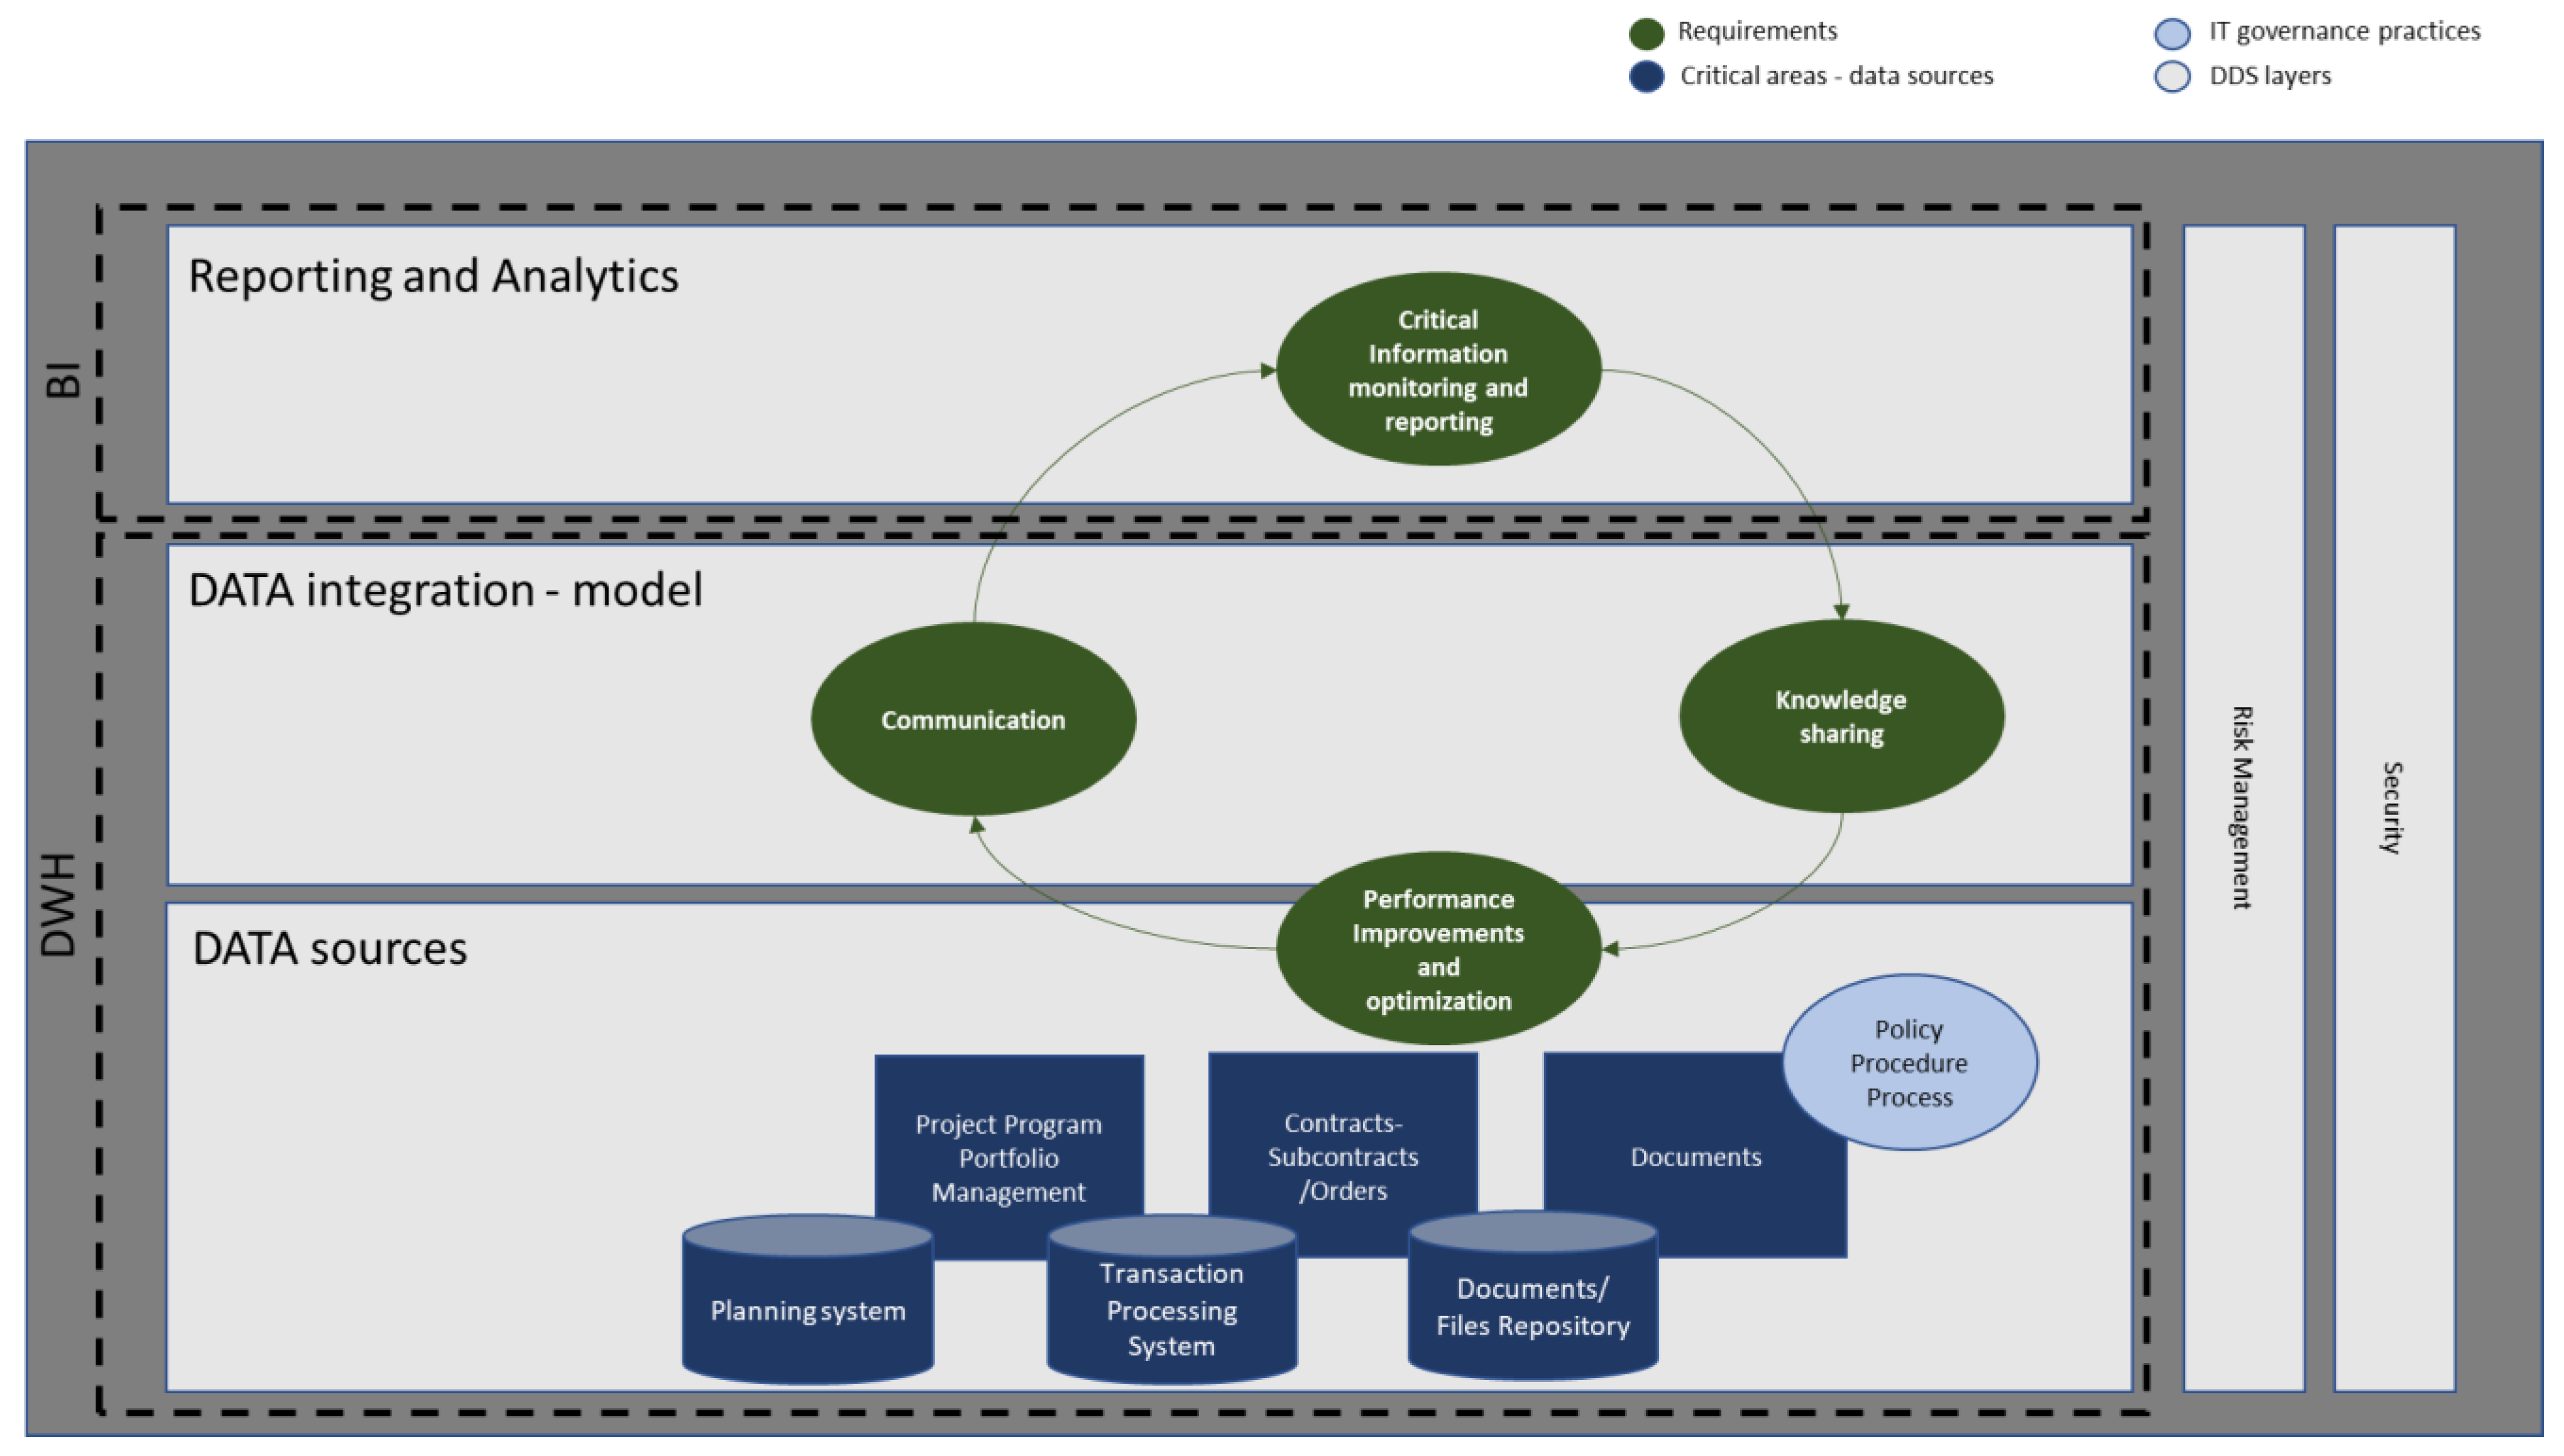
3.1. Requirement Analysis

To adequately address business needs on reporting requirements, the first key step is to define the desires of end users [59,82]. The type of the data-driven decision-support system developed is both passive and active. Therefore, as explained in Section 2.2, it aims to help decision-makers in the decision-making process. Furthermore, the managers of organization have been involved in gap analysis and identification of the eventual process improvements. As such, the tool can suggest decisions and provide guidance to leaders and decision makers.
Therefore, in implementing data-driven governance, the macro functions the system must cover have been classified as [83,84]:
  • monitoring and reporting of critical information;
  • communication;
  • knowledge sharing; and
  • process improvement and optimization.
This classification was made through literature scouting and interviews with managers. To simplify the analysis, the governance needs were mapped and represented on the different DSS layers, as shown in Figure 3.

3.2. Data Sources Analysis

As discussed in Section 2.3, BI data are mostly from internal sources, and big data are mostly external (Table 1). In this research, the goal was to design a data model for a DWH coupled with a BI system to support decision-makers in the organization. Therefore, in this second phase, after defining the requirements, the necessary data sources were mapped. The data sources involved were the organizational transactional system, planning system and repositories, including Excel files and document repositories (e.g., Microsoft SharePoint), in which all company documents (e.g., policy, procedure, guidelines) were stored. At this stage of the work presented, big data were excluded. However, we believe that future developments could include the collection and analysis of big data from the operational area of organization.

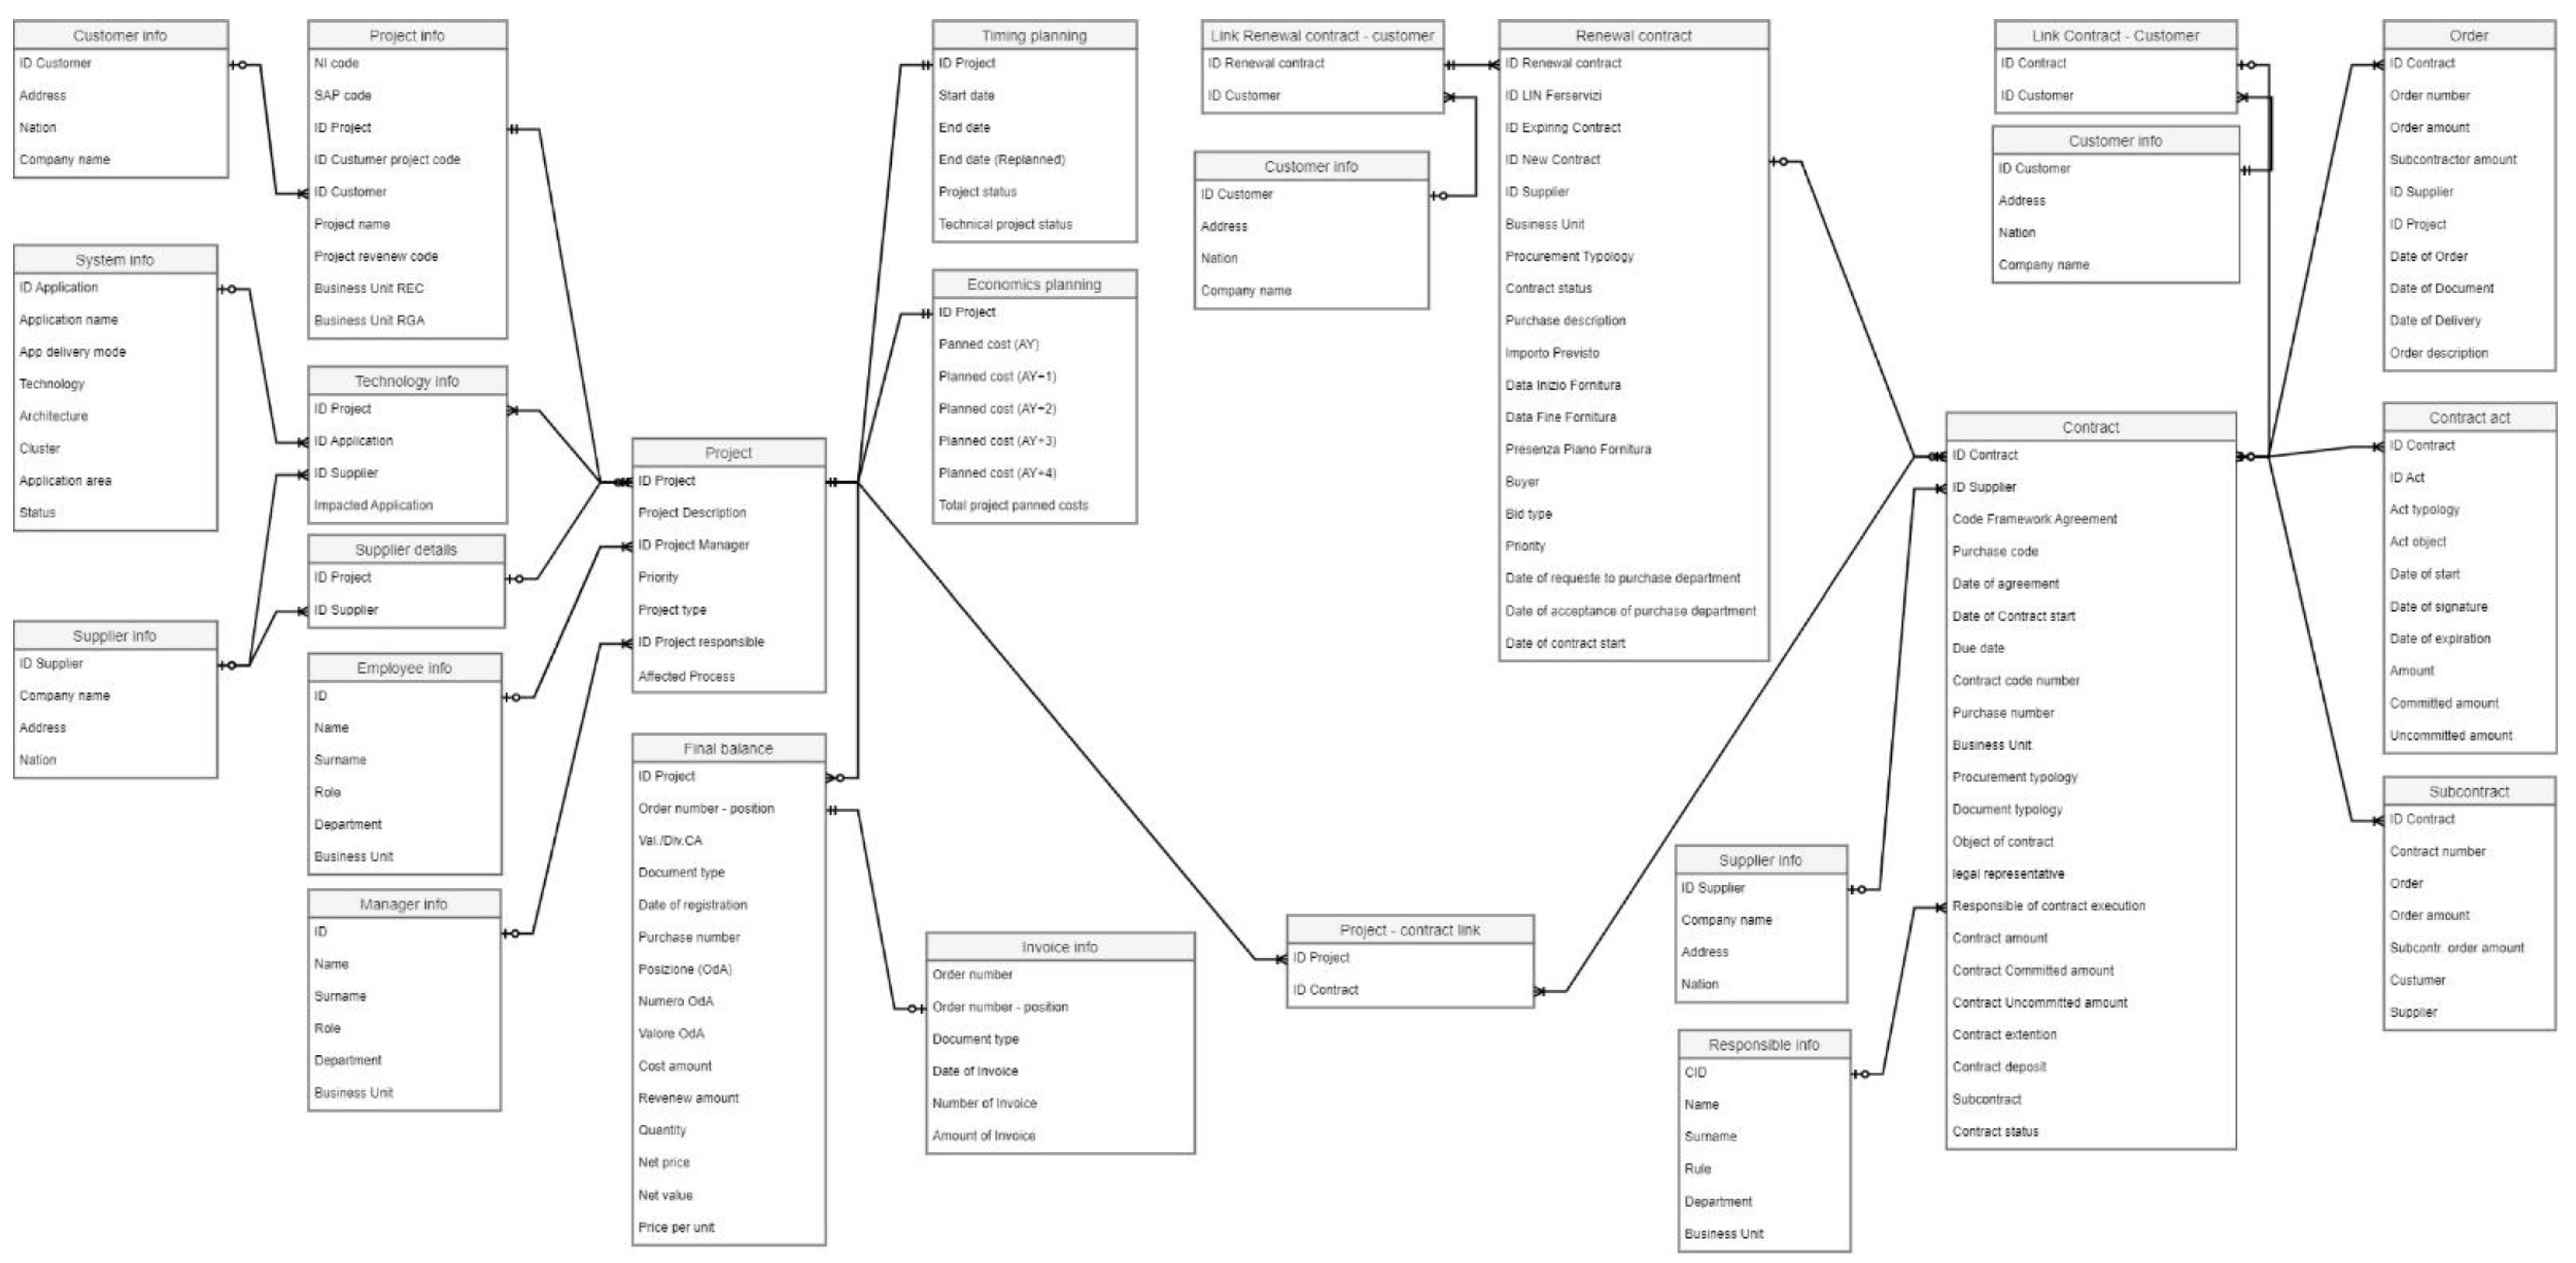
3.3. Data Integration and Data Warehouse Modelling

DWH designers mainly use the entity-relationship (ER) model as the basis for the proposed solution [85]. In this research, we adopted an ER model to represent the data model with the cross-foot notation. The data model, whose architecture is represented in Figure 4, is made up of 25 tables. The model has been built to report the project information (as represented in the tables on the left side of the figure) and the contract information (reported on the right side of the figure). Note that the presented model is intended as a general data architecture to be used for a DWH coupled with a BI. The structure shows the relationships between the elements in tables and their cardinality. The zero cardinality is represented as a circle and the one cardinality as a bar. In addition, the cross-foot’s notation allows us to specify either the mandatory or the optional cardinality. The link between projects information and contract information (table “Project-contract link”) allows us to create reports giving a comprehensive view of the critical information, such as the relationship between the project progress and the new contracts signed or the expiring one. Moreover, including the table “System info”, an overview of the technology context in relation to the ongoing projects can be represented and monitored. It was considered that the projects’ information is updated four time per year and the key is the “ID project”. Meanwhile, the data related to the “Final balance” and the ”Order” tables are collected from the transactional system about six times per year, or when required.

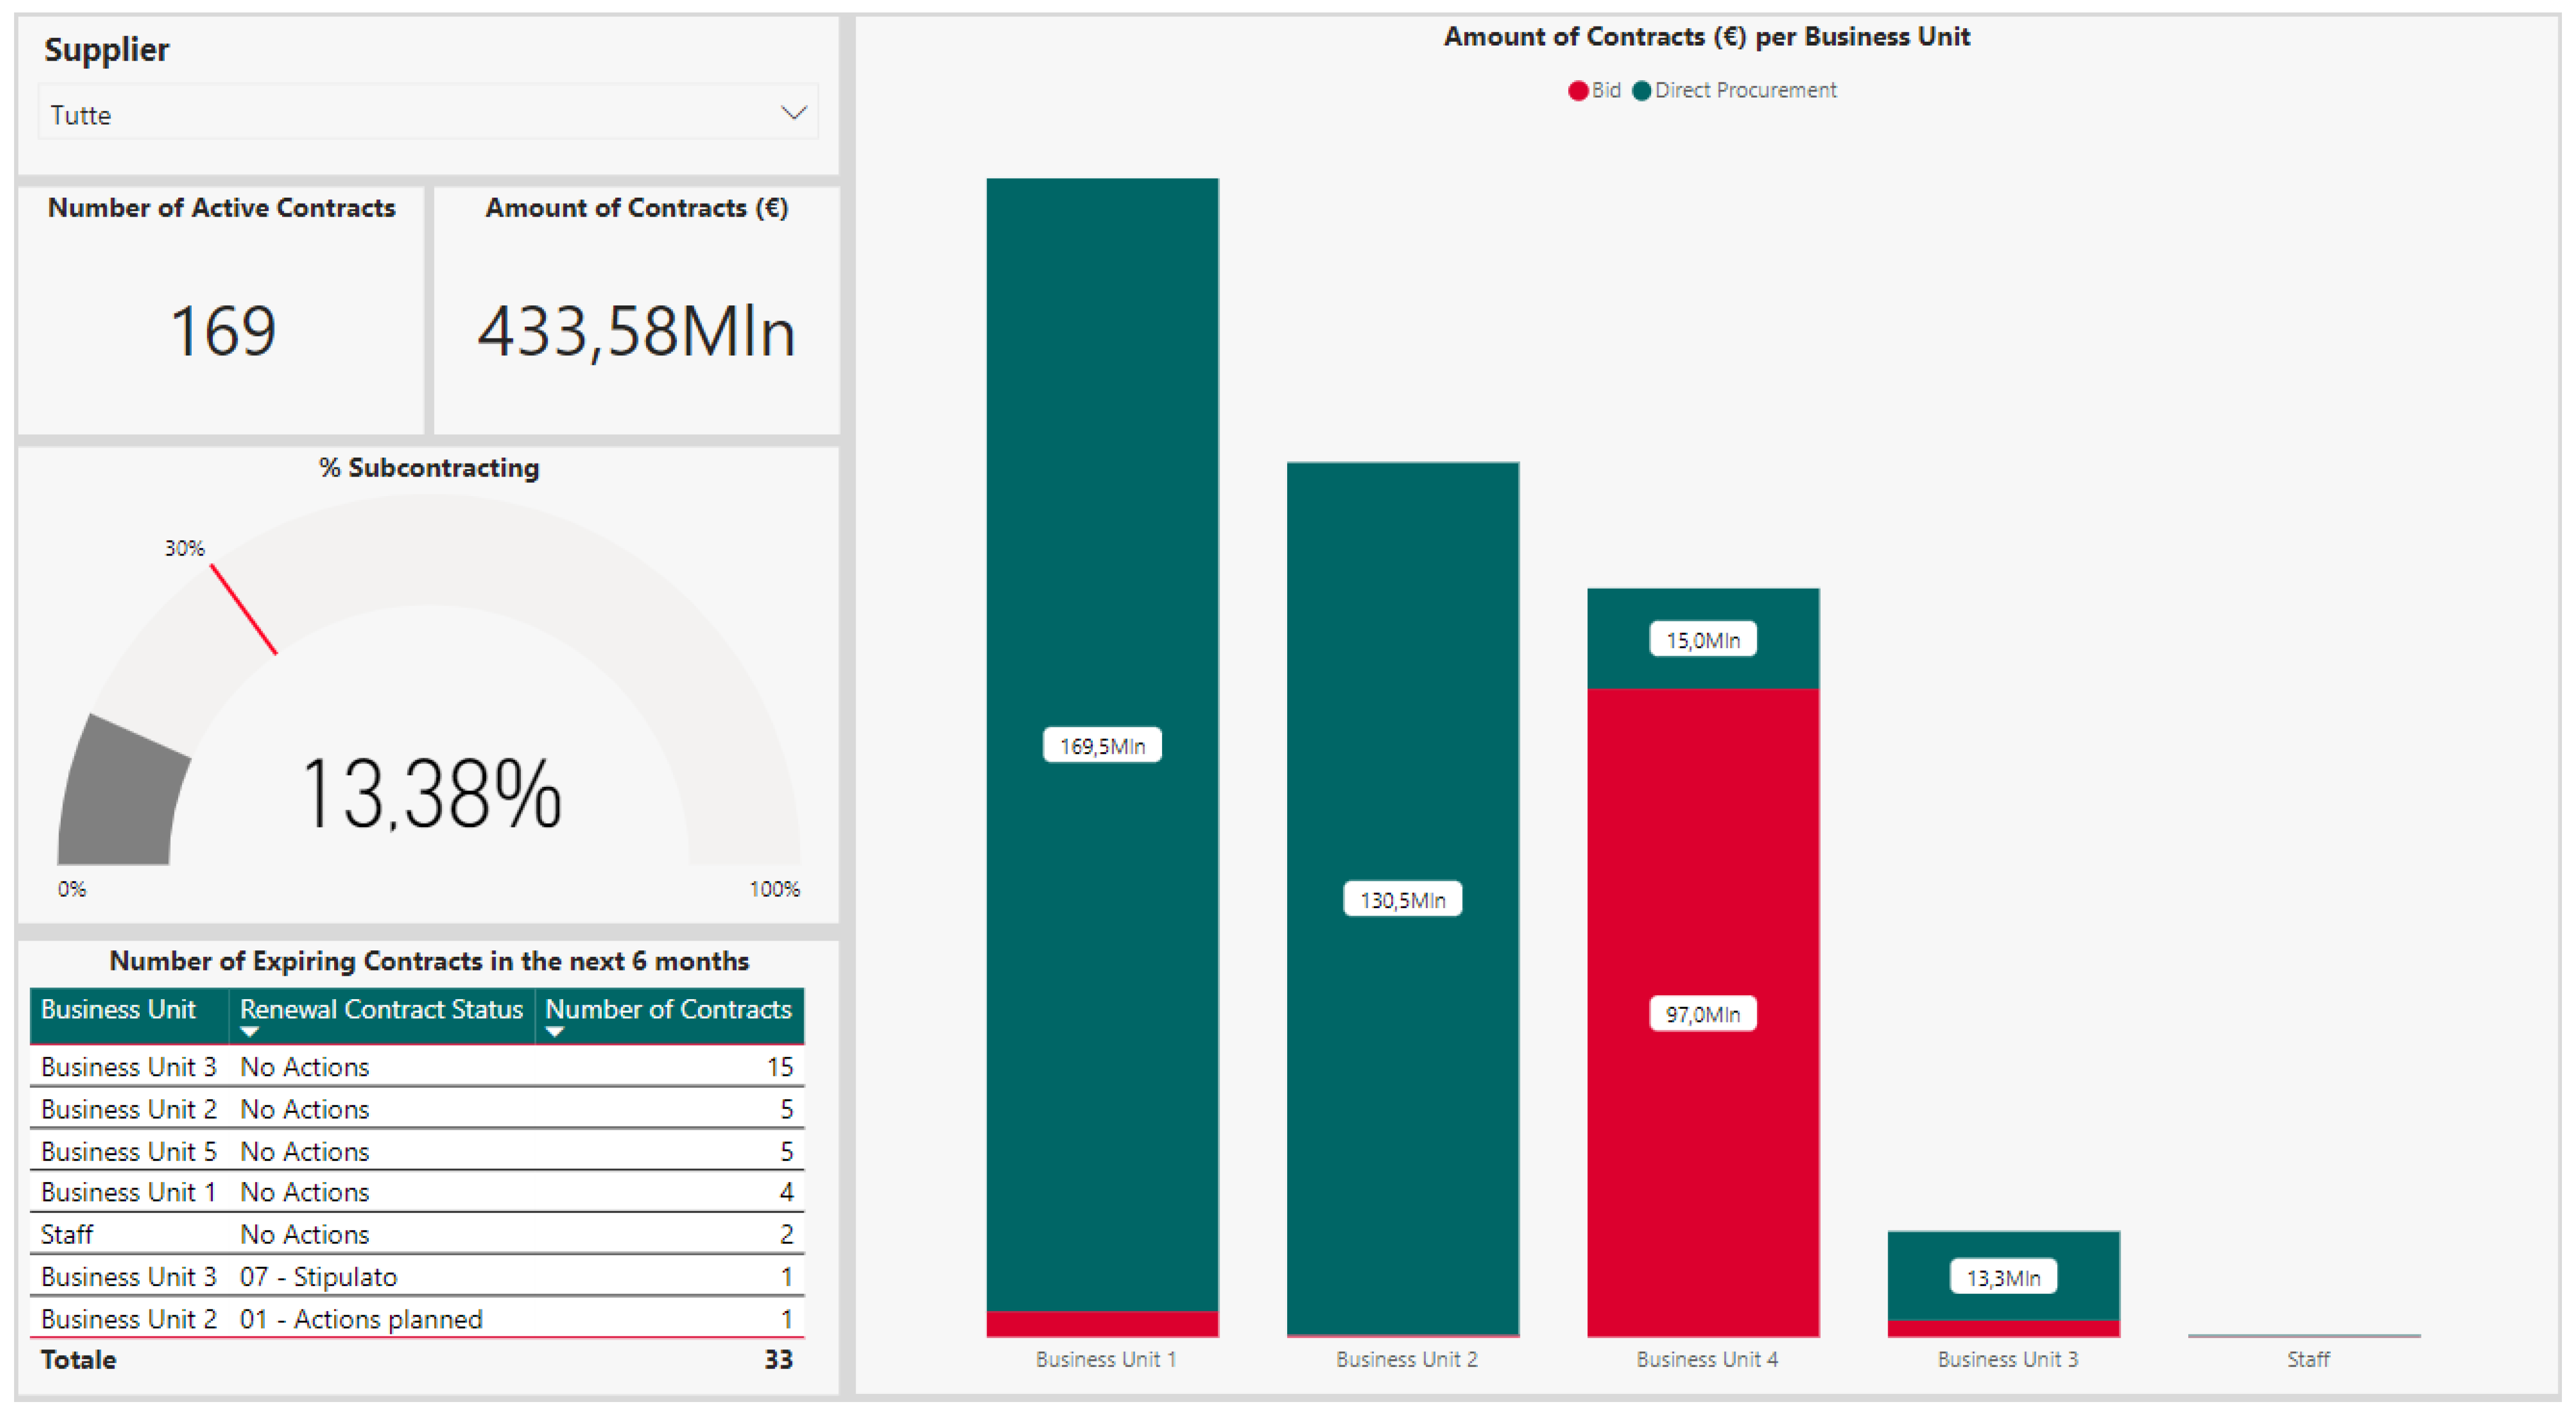
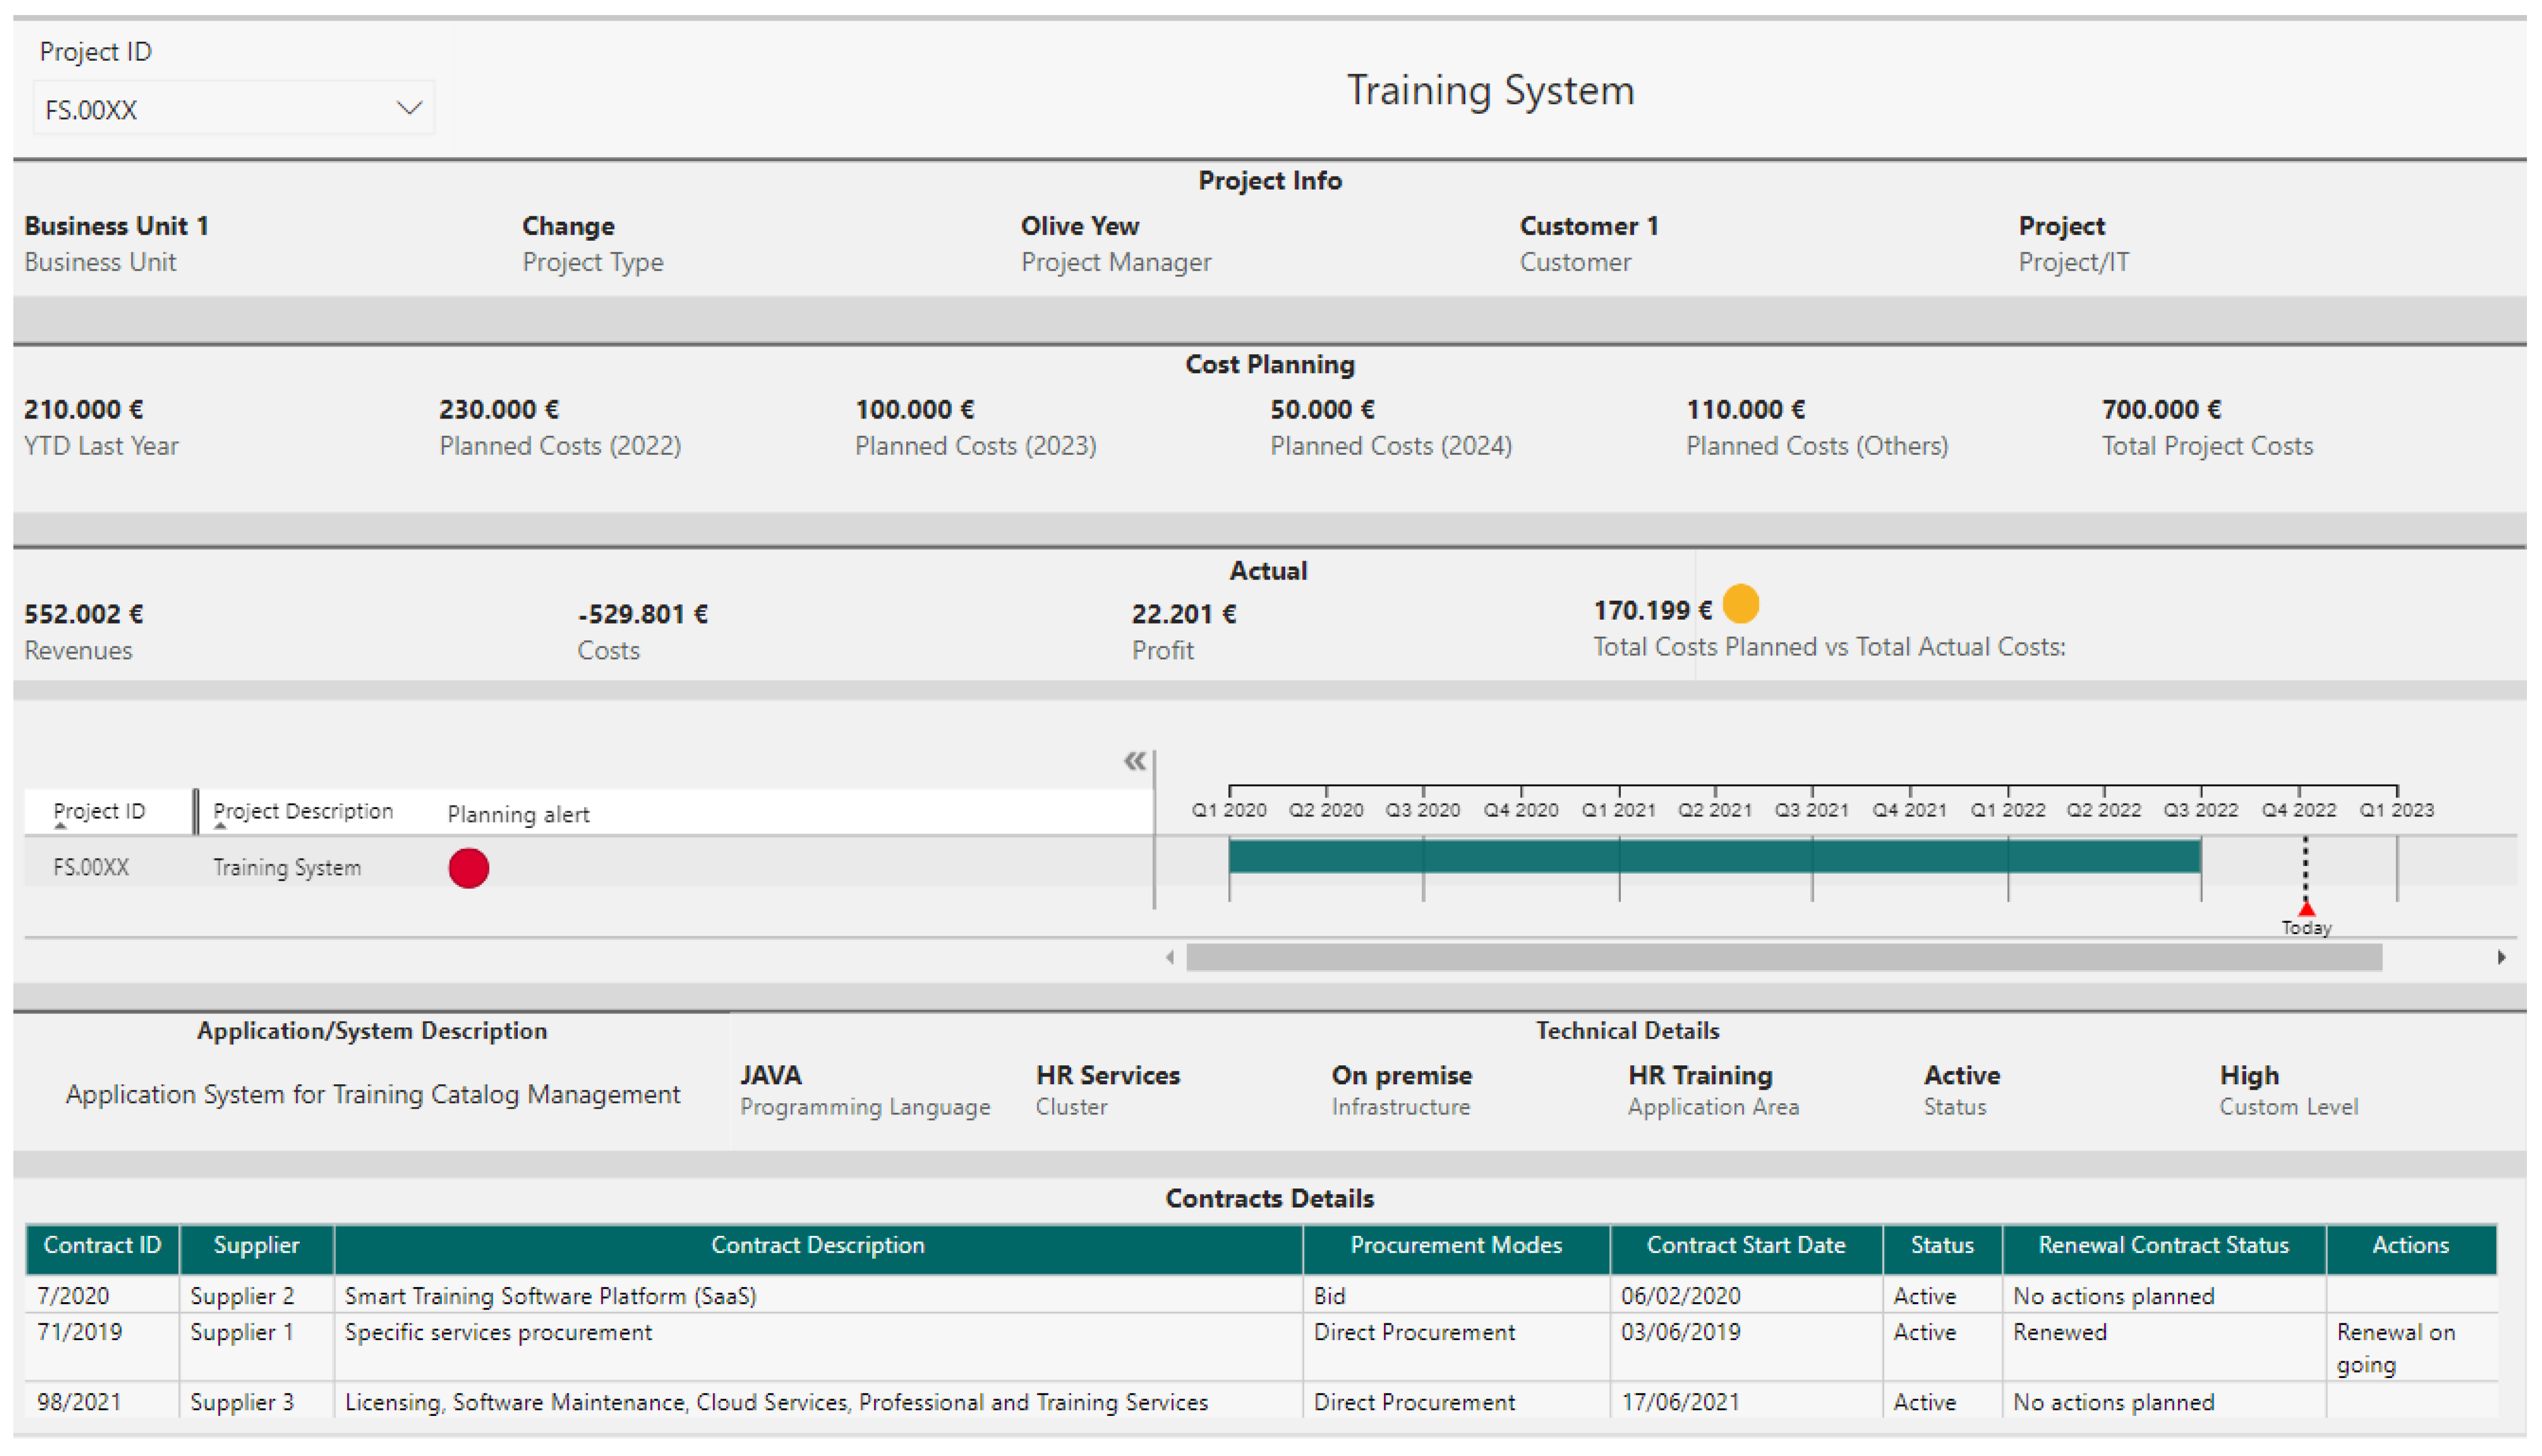
3.4. Reporting and Analytics of Critical Information

Once the data have been organized in the data model represented in Figure 4, the analysis has been performed to support a data-driven governance decision support system. OLAP databases are suitable for efficient data analysis of a large amount of data, especially when multiple measures must be performed [86]. It permits the analyst and the domain experts to go deep into an investigation analysis [87]. Coupling OLAP systems with multidimensional representation of data allows analysts to inspect the data at different granularity; a query language can be used, such as MDX, SQL, or SPARQL, to perform the data querying [88]. In summary, this data structure allows representing both the details of the projects, contracts, and application/system information and to give an overview of the crucial company information.
Once the crucial information to be monitored and the personnel involved in this process were identified, data visualization was implemented. Exemplary reporting is represented in Figure 5 and Figure 6. The first provides an overview of the status of the contracts managed by operations, as a critical monitoring area to be integrated into a comprehensive enterprise performance monitoring system [89]. It informs the CEO, or the person responsible for auditing the organization’s performance, about the type of procurement (tender or direct contract), the number of contracts signed, and the business unit responsible for managing them. It warns of the expiration date of contracts, enabling managers to make quick decisions if a contract reaches its due date or the maximum capacity. The table shows whether an action has already been taken by the operational manager (in the contract renewal status) or needs to be noticed urgently. Similarly, to be compliant with the audit activity, subcontracts need to be monitored. The speedometer graph shows the amount (in euros) of subcontracts compared to the total number of contracts in force. Finally, the labels return a quick overview of current contracts and their total amount. These are examples of the different KPIs that can be displayed with the information organized.
Additionally, this reporting system allows one to drill down on information details, as shown in Figure 6. Project timetables allow the management to monitor all the details of the project and its progress. This visualization also warns about time planning versus actual project status and economic trends. For example, the yellow indicator shows that the actual project costs are almost reaching the maximum total projected cost, attesting that the planned cost of the project may change. This is crucial information for the organization’s spending forecast for the current and next year. Another warning represented (red in the figure) concerns the project’s time plan. If it is out of time, it represents a critical issue, for example, for the organization’s resource allocation. Linking the projects to the contract details (represented in the data model Figure 4 and described in Section 3.3) made it possible to view the current passive contract for project implementation. System/application details are embedded and attest to the technical details of the application or system developed. The service delivery mode (cloud or on premises), the programming languages, the application areas, and the application’s cluster are needed information for both the responsible of the project execution or the program manager to verify the technical details of the project. These technical details are critical to provide an overview of the enterprise architecture, to monitor infrastructure spending costs or the level of technological innovation. The aforementioned information falls within the crucial domain of the governance monitoring [90]. Overall, a dedicated user interface was proposed to highlight the most critical information. In addition, reports were used by the management to indicate implemented actions or future critical actions to be taken. In the domain of a complex business environment, this solution represents a strategic tool to facilitate fast and fact-based decision making.

4. Discussion

As already demonstrated in the previous work [17], approaches for the implementation of a data-driven governance are scarce in the literature, requirements are only partial, and no IT tool is available [91]. In addition to previous work, this proposal extends monitoring and reporting to the entire area of the performance monitoring within the governance’s domain. This work proposes an approach for developing a DWH coupled with a BI system to support centralized, data-driven organizational governance, attesting to it as a strategic business asset for structured analysis and reporting. This is through near real-time dashboarding available in a single location. The difficulties in requirement elicitation and identification are highlighted in the literature [57], especially in defining the need for the implementation of data driven governance. Therefore, this paper supports the design of a data model starting from structured data-driven governance’ requirements, improving the lack of clear criteria.
Moreover, this research demonstrated the ability to access a large amount of accurate and organized multidimensional data to perform rapid and reliable supervising of critical information (e.g., in Figure 5), facilitate knowledge sharing, and be compliant with audit activities, as the crucial elements for a successful data-driven DSS [46]. The needs were defined by combining both the requirements of company managers interviewed and the documented requirements in the literature [92] with the purpose of meeting stakeholder’s needs and current research evidence. Furthermore, companies struggle with siloed and fragmented data in both systems and processes [93]. Therefore, this solution extends to all organizations, and its scalability allows customized reporting at any organizational level; it is based primarily on a common repository that collects data from various organizational data sources, and its analyses were designed for the management. In summary, the system demonstrated the ability to meet the functionality requirements for data-driven governance implementation (Figure 3). That is: (i) performance monitoring and reporting critical information, which allows us to verify the expiring contracts status and the related subcontracts [94], as well as the technical infrastructure [95]; (ii) communication, as it allows us, through visualization, to understand projects and benefit management [96] and demonstrate earned value or show critical KPIs; in addition, the ability for involved staff to drill down into data, product portfolio reports, and contract status increases analytical capacity, and understanding of objectives and KPIs [97], along with the ability to demonstrate compliance with audit rules; (iii) knowledge sharing, the transactional, the planning system and the repository system concur to provide information, enabling knowledge transfer in a centralized place in the company; and (iv) process improvement and optimization, storing the data in one place and the fast data elicitation from multiple business units, which differ widely in terms of products, policies, and customers facilitate governance managers involved in the IT performance monitoring process to check the alignment of the current process with the operational execution of the work. Thus, they quickly identify and close gaps between the documented process and its actualization or eventually process improvement. This overcomes the constraints in governance of siloed information management, unstructured data extraction, and scarce report development techniques [18].
The reporting system is currently in use in the company to ensure dynamic and reliable data analysis by executives, middle-managers, and operators. The proposed approach can be applied in different contexts, following these building steps: (i) starting from the requirements analysis and mapping the needs onto the high-level block schema represented in Figure 3; (ii) identification and mapping the data sources needed to gather the information needed for the performance monitoring process in IT governance domain; (iii) designing the data model to identify the elements and their relationship along with the cardinality; and (iv) finally, the reporting should be tailored to the specific monitoring needs.

5. Conclusions

The current “data revolution” is not new in principle, as data processing has always been fundamental to the practices of public administration and governance. Nevertheless, new digital data technologies have enabled improved quality through data density, granularity, linked data, and machine learning. These improved qualities enable more encompassing monitoring, more sophisticated analyses, and forecasting, and thus, more efficient, and anticipatory government practices. The governance of organizations ultimately chooses whether and which of the competing formulated policies to implement. Therefore, data-driven governance can support these decision processes with insights and simulations based on predictive analytics to estimate impacts of the different policy options [49,98]. Thus, this work demonstrates that a data-driven decision support system is a necessary IT tool for a technology company, to support both operational and strategic decision making [50] and to enable knowledge sharing, communication, and process diagnosis, as a part of a data-driven governance. Nevertheless, the development and implementation of an IT governance framework is critical for modern businesses enterprise [99], along with the digitalization of the involved processes. Therefore, this work adds to the current literature by demonstrating that data-driven decision support systems support the entire decisional process, attesting that a data-driven governance is a key IT element for a technology company [49]. The paper aimed to document that DWH coupled with BI is becoming an increasingly important technology for organizations that operate in dynamic environments, attesting that data-driven governance improves the overall organization in seeking to gain insights from diverse data sources and big data to support decision making [81]. This paper demonstrated the importance of the design and the development of a decision support system for implementing the IT performance monitoring as one of the fourth governance domains (Figure 2) [9]. Key data-driven governance monitoring needs have been analysed, identified, and met with the system. The results of this work showed: (i) awareness of critical information across the enterprise; (ii) a unique point to monitor policies and processes to facilitate process improvements; (iii) support the management in compliance verification activities and in data reporting (e.g., to the advisory board or to customers); (iv) decision-making process digitization through automation of daily manual tasks; (v) improved contract, subcontracts monitoring and early formalization of new one; (vi) optimization of financial area monitoring; (vii) scalability that enables rapid customization of reporting at any organizational level; and (viii) ability to further integrate unstructured data from operations. As such, this research calls for the implementation of data-driven solutions in governance and performance monitoring. It bridges the gap between performance measurement in IT governance and practical implementation. The scope of this research ranges from program and project portfolio, contract, subcontract, and order management as a crucial area of governance to be monitored, to KPI/SLA and accountability management, thus helping to increase the dynamism of the processes under study [100]. Further research is needed to improve the proposed approach, as to make decisions on behalf of decision-makers (belonging to the cooperative DSS category as described in Section 2.2), which then requires further validation by the decision-makers themselves [48]. Furthermore, the data elicitation problems should be improved. As such, recent studies have demonstrated the application of artificial neural networks to reduce the problem of missing data [101] and others have suggested the improvement of data requirement elicitation through a requirements-driven DW design methodology based on the e-pivot table [59]. Moreover, investigations are directed toward the possibility of resource allocation on projects [102] and the inclusion of unstructured data to build a comprehensive decision-making support system [76]. Finally, research in this direction is expected to support decision making through performance monitoring in such ever-changing environments.

Author Contributions

Conceptualization, V.B. and A.R.; methodology, V.B.; software, V.B.; validation, A.R.; formal analysis, V.B.; investigation, V.B.; data curation, V.B.; writing—original draft preparation, V.B.; writing—review and editing, A.R.; visualization V.B., supervision, A.R.; project administration, A.R.; funding acquisition A.R. All authors have read and agreed to the published version of the manuscript.

Funding

This research received no external funding.

Institutional Review Board Statement

Not applicable.

Informed Consent Statement

Not applicable.

Data Availability Statement

The data presented in this study are available within the article.

Acknowledgments

The authors wish to extend their full gratitude to all who assisted in conducting this research. In particular, we thank Lorenzo Sgambellone, who actively and proactively participated to the work in collaboration with FSTechnology.

Conflicts of Interest

The authors declare no conflict of interest.

References

  1. Saetang, S.; Haider, A. CIO and CTO Nexus: Empowering Organizations with IT Governance. In Proceedings of the 2012 PICMET ‘12: Technology Management for Emerging Technologies, Vancouver, BC, Canada, 29 July–2 August 2012; pp. 3681–3691. [Google Scholar]
  2. Herz, T.P.; Hamel, F.; Uebernickel, F.; Brenner, W. IT Governance Mechanisms in Multisourcing—A Business Group Perspective. In Proceedings of the 2012 45th Hawaii International Conference on System Sciences, Maui, HI, USA, 4–7 January 2012; pp. 5033–5042. [Google Scholar] [CrossRef] [Green Version]
  3. Vargas-Hernández, J.G. Uber’s Strategy as a Competitive Business Model of Sharing Economy. In Sharing Economy and the Impact of Collaborative Consumption; IGI Global: Hershey, PA, USA, 2020; p. 19. [Google Scholar]
  4. Alaeddini, M.; Hashemi, S.A. Evaluating the Performance of IT Governance in Service-Oriented Enterprises. Lect. Notes Inf. Syst. Organ. 2019, 30, 323–333. [Google Scholar] [CrossRef]
  5. Barrenechea, O.; Mendieta, A.; Armas, J.; Madrid, J.M. Data Governance Reference Model to Streamline the Supply Chain Process in SMEs. In Proceedings of the 2019 IEEE XXVI International Conference on Electronics, Electrical Engineering and Computing (INTERCON), Lima, Peru, 12–14 August 2019; pp. 8–11. [Google Scholar] [CrossRef]
  6. Theron, H. Koornhof PGJ Bow to the King (IV)? A New Era for IT Governance in South Africa. In In Proceedings of the African Cyber Citizenship Conference 2016 (ACCC2016), Port Elizabeth, South Africa, 31 October–1 November 2016; pp. 161–173. [Google Scholar]
  7. Calder, A. The Calder-Moir It Governance Framework; IT Governance: Ely, UK, 2008.
  8. Miyamoto, M.; Kudo, S. Five Domains of Information Technology Governance in Japanese SMEs; An Empirical Study. In Proceedings of the 2013 International Conference on ICT Convergence (ICTC), Jeju, Korea, 14–16 October 2013; pp. 964–969. [Google Scholar] [CrossRef]
  9. IT Governance Institute. Board Briefing on IT Governance; IT Governance: Ely, UK, 2003.
  10. Lunardi, G.L.; Maçada, A.C.G.; Becker, J.L.; Van Grembergen, W. Antecedents of IT Governance Effectiveness: An Empirical Examination in Brazilian Firms. J. Inf. Syst. 2017, 31, 41–57. [Google Scholar] [CrossRef]
  11. Elagha, H. The Use of Partial Least Squares Path Modeling in IT Governance Discipline. In Proceedings of the 2014 11th International Conference on Information Technology: New Generations, Las Vegas, NV, USA, 7–9 April 2014; pp. 624–626. [Google Scholar] [CrossRef]
  12. Ferguson, C.; Green, P.; Vaswani, R.; Wu, G. Determinants of Effective Information Technology Governance. Int. J. Audit. 2013, 17, 75–99. [Google Scholar] [CrossRef]
  13. Dietz, J.L.G.; Hoogervorst, J.A.P. The Principles of Enterprise Engineering. Lect. Notes Bus. Inf. Process. 2012, 110, 15–30. [Google Scholar] [CrossRef]
  14. Smits, D.; Van Hillegersberg, J. The Continuing Mismatch between IT Governance Maturity Theory and Practice: A New Approach. Procedia Comput. Sci. 2018, 138, 549–560. [Google Scholar] [CrossRef]
  15. Smits, D.; Van Hillegersberg, J. IT Governance Maturity: Developing a Maturity Model Using the Delphi Method. In Proceedings of the 2015 48th Hawaii International Conference on System Science, Kauai, HI, USA, 5–8 January 2015; pp. 4534–4543. [Google Scholar] [CrossRef]
  16. Smits, D.; Van Hillegersberg, J. Evaluation of the Usability of a New ITG Instrument to Measure Hard and Soft Governance Maturity. Int. J. Inf. Syst. Proj. Manag. 2019, 7, 37–58. [Google Scholar] [CrossRef]
  17. Biagi, V.; Patriarca, R.; Di Gravio, G. Business Intelligence for IT Governance of a Technology Company. Data 2022, 7, 2. [Google Scholar] [CrossRef]
  18. Erasmus, W.; Marnewick, C. An IT Governance Framework for IS Portfolio Management. Int. J. Manag. Proj. Bus. 2020, 14, 721–742. [Google Scholar] [CrossRef]
  19. Nan, S.S.; Gilbert, S. Enterprise IT Governance, Business Value and Performance Measurement; IGI Global: Hershey, PA, USA, 2011. [Google Scholar]
  20. Alagha, H. Examining the Relationship between IT Governance Domains, Maturity, Mechanisms, and Performance: An Empirical Study toward a Conceptual Framework. In Proceedings of the 2013 10th International Conference on Information Technology: New Generations, Las Vegas, NV, USA, 15–17 April 2013; pp. 767–772. [Google Scholar] [CrossRef]
  21. Gordon Hunter, M. The Chief Information Officer: A Review of the Role. J. Inf. Inf. Technol. Organ. 2010, 5, 125–143. [Google Scholar] [CrossRef]
  22. Oliveira, E.; Sá, J.; Santos, M.Y. Process-Driven Data Analytics Supported by a Data Warehouse Model. Int. J. Bus. Intell. Data Min. 2017, 12, 383–405. [Google Scholar] [CrossRef]
  23. Joshi, A.; Bollen, L.; Hassink, H. An Empirical Assessment of IT Governance Transparency: Evidence from Commercial Banking. Inf. Syst. Manag. 2013, 30, 116–136. [Google Scholar] [CrossRef]
  24. Rajeshkumar, V.; Anandaraj, S.; Kavinkumar, V.; Elango, K.S. Analysis of Factors Influencing Formwork Material Selection in Construction Buildings. Mater. Today Proc. 2020, 37, 880–885. [Google Scholar] [CrossRef]
  25. Fabac, R. Digital Balanced Scorecard System as a Supporting Strategy for Digital Transformation. Sustainability 2022, 14, 9690. [Google Scholar] [CrossRef]
  26. Jain, S.; Sharma, S. Application of Data Warehouse in Decision Support and Business Intelligence System. In Proceedings of the 2018 Second International Conference on Green Computing and Internet of Things (ICGCIoT), Bangalore, India, 16–18 August 2018; pp. 231–234. [Google Scholar] [CrossRef]
  27. Wixom, B.; Watson, H. The BI-Based Organization. Int. J. Bus. Intell. Res. 2010, 1, 13–28. [Google Scholar] [CrossRef]
  28. Ensslin, S.R.; Rodrigues, K.T.; Junior, L.; Yoshiura, M. Organizational Performance Management and the ‘ Sustainability ’ of the Performance Evaluation System: A View Guided by the Integrative Review Sustainability Organizational Performance Management and the ‘Sustainability’ of the Performance Evaluation S. Sustainability 2022, 14, 11005. [Google Scholar] [CrossRef]
  29. Franco-Santos, M.; Otley, D. Reviewing and Theorizing the Unintended Consequences of Performance Management Systems. Int. J. Manag. Rev. 2018, 20, 696–730. [Google Scholar] [CrossRef]
  30. Hitz, C.; Schwer, K. The Role of It Governance in Digital Operating Models. J. East. Eur. Cent. Asian Res. 2018, 5, 61–79. [Google Scholar] [CrossRef] [Green Version]
  31. Juiz, C.; Gomez, B. Delving Into the IT Governance-Management Communication Interface. Int. J. Digit. Strateg. Gov. Bus. Transform. 2021, 11, 1–37. [Google Scholar] [CrossRef]
  32. Santos, V.; Goldman, A.; de Souza, C.R.B. Fostering Effective Inter-Team Knowledge Sharing in Agile Software Development. Empir. Softw. Eng. 2015, 20, 1006–1051. [Google Scholar] [CrossRef]
  33. Levy, M.; Hadar, I.; Aviv, I. Agile-Based Education for Teaching an Agile Requirements Engineering Methodology for Knowledge Management. Sustainability 2021, 13, 2853. [Google Scholar] [CrossRef]
  34. Abai, N.H.Z.; Yahaya, J.H.; Deraman, A. An Integrated Framework of Business Intelligence and Analytic with Performance Management System: A Conceptual Framework. In Proceedings of the 2015 Science and Information Conference (SAI), London, UK, 28–30 July 2015; pp. 452–456. [Google Scholar] [CrossRef]
  35. Valladares, P.; Fuertes, W.; Tapia, F.; Toulkeridis, T.; Pérez, E. Dimensional Data Model for Early Alerts of Malicious Activities in a CSIRT. Simul. Ser. 2017, 49, 74–81. [Google Scholar] [CrossRef]
  36. Nativi, S.; Mazzetti, P.; Craglia, M. A View-Based Model of Data-Cube to Support Big Earth Data Systems Interoperability. Big Earth Data 2017, 1, 75–99. [Google Scholar] [CrossRef]
  37. Gamal, A.; Barakat, S.; Rezk, A. Integrated Document-Based Electronic Health Records Persistence Framework. Int. J. Adv. Comput. Sci. Appl. 2021, 12, 147–155. [Google Scholar] [CrossRef]
  38. Neuböck, T.; Schrefl, M. Modelling Knowledge about Data Analysis Processes in Manufacturing. IFAC PapersOnLine 2015, 28, 277–282. [Google Scholar] [CrossRef]
  39. Opresnik, D.; Fiasché, M.; Taisch, M.; Hirsch, M. An Evolving Fuzzy Inference System for Extraction of Rule Set for Planning a Product–Service Strategy. Inf. Technol. Manag. 2017, 18, 131–147. [Google Scholar] [CrossRef]
  40. Shollo, A. Using Business Intelligence in IT Governance Decision Making. IFIP Adv. Inf. Commun. Technol. 2011, 366, 3–15. [Google Scholar] [CrossRef] [Green Version]
  41. Inmon, W.H. Building the Data Warehouse. Commun. ACM 2005, 41, 52–60. [Google Scholar]
  42. Kimball, R.; Ross, M. The Data Warehouse Toolkit; John Wiley & Sons: Chichester, UK, 2002. [Google Scholar]
  43. Scholl, M.H.; Mansmann, S.; Golfarelli, M.; Rizzi, S. Visual Online Analytical Processing (OLAP). In Encyclopedia of Database Systems; Springer: New York, NY, USA, 2018; pp. 4517–4527. [Google Scholar]
  44. Felsberger, A.; Oberegger, B.; Reiner, G. A Review of Decision Support Systems for Manufacturing Systems. CEUR Workshop Proc. 2017, 1793, 8. [Google Scholar]
  45. Psarommatis, F.; Kiritsis, D. A Hybrid Decision Support System for Automating Decision Making in the Event of Defects in the Era of Zero Defect Manufacturing. J. Ind. Inf. Integr. 2022, 26, 100263. [Google Scholar] [CrossRef]
  46. Abdullah, M.; Bahurmuz, N.; Alnajim, R.; Alshingiti, Z. Decision Making Using Document Driven Decision Support Systems. Int. J. Data Sci. 2020, 5, 168. [Google Scholar] [CrossRef]
  47. Pirnay, L. Data-Driven Strategy Maps: A Hybrid Approach to Strategic and Performance Management Combining Hard Data and Experts’ Knowledge. CEUR Workshop Proc. 2021, 2906, 59–68. [Google Scholar]
  48. Alowaigl, A.A.; Al-Shqeerat, K.H.; Hadwan, M. A Multi-Criteria Assessment of Decision Support Systems in Educational Environments. Indones. J. Electr. Eng. Comput. Sci. 2021, 22, 985. [Google Scholar] [CrossRef]
  49. Pohancenik, A. Predictive Analytics and AI in Governance: Data-Driven Government in a Free Society-Artificial Intelligence, Big Data and Algorithmic Decision-Making in Government from a Liberal Perspective; NEOS Lab: Viena, Austria, 2019; ISBN 9783200065550. [Google Scholar]
  50. Zulkepli, F.S.; Ibrahim, R.; Bakri, A.; Zakaria, N.H.; Hamed, H.N.A.; Khalid, H.; Maarof, M.A. A Multi-Dimensional Database Model for Research Performance Analysis. ARPN J. Eng. Appl. Sci. 2015, 10, 17923–17929. [Google Scholar]
  51. Ul Hassan, C.A.; Irfan, R.; Shah, M.A. Integrated Architecture of Data Warehouse with Business Intelligence Technologies. In Proceedings of the 2018 24th International Conference on Automation and Computing (ICAC), Newcastle Upon Tyne, UK, 6–7 September 2018; pp. 6–7. [Google Scholar] [CrossRef]
  52. Janković, S.; Mladenović, S.; Mladenović, D.; Vesković, S.; Glavić, D. Schema on Read Modeling Approach as a Basis of Big Data Analytics Integration in EIS. Enterp. Inf. Syst. 2018, 12, 1180–1201. [Google Scholar] [CrossRef]
  53. Luhn, H.P. A Business Intelligence System. IBM J. Res. Dev. 1958, 2, 314–319. [Google Scholar] [CrossRef] [Green Version]
  54. Bank, M. Using Business Intelligence Capabilities to Improve the Quality of Decision-Making: A Case Study Of. Int. J. Econ. Manag. Eng. 2019, 13, 147–158. [Google Scholar]
  55. Pedersen, T.B. Managing Big Multidimensional Data; Aalborg University: Aalborg, Denmark, 2013; pp. 3–6. [Google Scholar]
  56. Němec, R. Assessment of Query Execution Performance Using Selected Business Intelligence Tools and Experimental Agile Oriented Data Modeling Approach. In Proceedings of the 2015 Federated Conference on Computer Science and Information Systems (FedCSIS), Lodz, Poland, 13–16 September 2015; Volume 5, pp. 1327–1333. [Google Scholar] [CrossRef] [Green Version]
  57. Goede, R. Sustainable Business Intelligence Systems: Modelling for the Future. Syst. Res. Behav. Sci. 2021, 38, 685–695. [Google Scholar] [CrossRef]
  58. Nakhal, A.A.J.; Patriarca, R.; Di Gravio, G.; Antonioni, G.; Paltrinieri, N. Investigating Occupational and Operational Industrial Safety Data through Business Intelligence and Machine Learning. J. Loss Prev. Process Ind. 2021, 73, 104608. [Google Scholar] [CrossRef]
  59. Bimonte, S.; Antonelli, L.; Rizzi, S. Requirements-Driven Data Warehouse Design Based on Enhanced Pivot Tables. Requir. Eng. 2021, 26, 43–65. [Google Scholar] [CrossRef]
  60. Tanphet, S.; Wanchai, P. Applying Business Intelligence Technology for Equipment Maintenance and Repair Plan of Telecommunications Services Provider. In Proceedings of the 2018 20th International Conference on Advanced Communication Technology (ICACT), Chuncheon, Korea, 11–14 February 2018; pp. 448–453. [Google Scholar] [CrossRef]
  61. Singh, R.P.; Singh, K. Design and Research of Data Analysis System for Student Education Improvement (Case Study: Student Progression System in University). In Proceedings of the 2016 International Conference on Micro-Electronics and Telecommunication Engineering (ICMETE), Ghaziabad, India, 22–23 September 2016; pp. 508–512. [Google Scholar] [CrossRef]
  62. Maryska, M.; Doucek, P. Reference Model of Cost Allocation and Profitability for Efficient Management of Corporate ICT. Procedia Econ. Financ. 2015, 23, 1009–1016. [Google Scholar] [CrossRef] [Green Version]
  63. Souibgui, M.; Atigui, F.; Zammali, S.; Cherfi, S.; Yahia, S. Ben Data Quality in ETL Process: A Preliminary Study. Procedia Comput. Sci. 2019, 159, 676–687. [Google Scholar] [CrossRef]
  64. Huaman, E. Steps to Knowledge Graphs Quality Assessment. arXiv 2022, arXiv:2208.07779. [Google Scholar]
  65. Dhaouadi, A.; Bousselmi, K.; Gammoudi, M.M.; Monnet, S.; Hammoudi, S. Data Warehousing Process Modeling from Classical Approaches to New Trends: Main Features and Comparisons. Data 2022, 7, 113. [Google Scholar] [CrossRef]
  66. Moscoso-Zea, O.; Andres-Sampedro; Luján-Mora, S. Datawarehouse Design for Educational Data Mining. In Proceedings of the 2016 15th International Conference on Information Technology Based Higher Education and Training (ITHET), Istanbul, Turkey, 8–10 September 2016. [Google Scholar] [CrossRef]
  67. Palanisamy, A.M.; Nataraj, R.V.; Sangeetha, S.; Sountharrajan, S. Virtual DataStack for Application Domains: Concepts, Challenges and Generation Techniques. In Proceedings of the 2020 3rd International Conference on Intelligent Sustainable Systems (ICISS), Thoothukudi, India, 3–5 December 2020; pp. 1314–1318. [Google Scholar] [CrossRef]
  68. Macedo, H.D.; Oliveira, J.N. A Linear Algebra Approach to OLAP. Form. Asp. Comput. 2015, 27, 283–307. [Google Scholar] [CrossRef] [Green Version]
  69. Takács, V.L.; Bubnó, K.; Ráthonyi, G.G.; Bába, É.B.; Szilágyi, R. Data Warehouse Hybrid Modeling Methodology. Data Sci. J. 2020, 19, 1–23. [Google Scholar] [CrossRef]
  70. Santos, M.Y.; Oliveira e Sá, J. A Data Warehouse Model for Business Processes Data Analytics. In Proceedings of the International Conference on Computational Science and Its Applications, Beijing, China, 4–7 July 2016; Springer: Berlin/Heidelberg, Germany, 2016; pp. 241–256. [Google Scholar]
  71. Kassem, G.; Turowski, K. Matching of Business Data in a Generic Business Process Warehousing. In Proceedings of the 2018 International Conference on Computational Science and Computational Intelligence (CSCI), Las Vegas, NV, USA, 12–14 December 2018; pp. 284–289. [Google Scholar] [CrossRef]
  72. Sturm, A. Supporting Business Process Analysis via Data Warehousing Arnon. J. Softw. Evol. Process 2012, 24, 303–319. [Google Scholar] [CrossRef]
  73. Borges, V.A.; Nogueira, B.M.; Barbosa, E.F. A Multidimensional Data Model for the Analysis of Learning Management Systems under Different Perspectives. In Proceedings of the 2016 IEEE Frontiers in Education Conference (FIE), Erie, PA, USA, 12–15 October 2016. [Google Scholar] [CrossRef]
  74. Tyrychtr, J.; Brožek, J.; Vostrovský, V. Multidimensional Modelling from Open Data for Precision Agriculture. Lect. Notes Bus. Inf. Process. 2015, 231, 141–152. [Google Scholar] [CrossRef]
  75. Nešetřil, K.; Šembera, J.; Nešetřil, K.; Šembera, J.; Intelligence, B.; Information, G. Business Intelligence and Geographic Information System for Hydrogeology. In Proceedings of the International Symposium on Environmental Software Systems, Wageningen, The Netherlands, 5–7 February 2018. [Google Scholar]
  76. Patel, J. An Effective and Scalable Data Modeling for Enterprise Big Data Platform. In Proceedings of the 2019 IEEE International Conference on Big Data (Big Data), Los Angeles, CA, USA, 9–12 December 2019; pp. 2691–2697. [Google Scholar] [CrossRef]
  77. Höpken, W.; Fuchs, M.; Keil, D.; Lexhagen, M. Business Intelligence for Cross-Process Knowledge Extraction at Tourism Destinations. Inf. Technol. Tour. 2015, 15, 101–130. [Google Scholar] [CrossRef]
  78. Korelič, I.; Mirchevska, V.; Rajkovič, V.; Kljajić Borštnar, M.; Gams, M. Multiple-Criteria Approach to Optimisation of Multidimensional Data Models. Informatica 2015, 26, 283–312. [Google Scholar] [CrossRef]
  79. Schuetz, C.G.; Neumayr, B.; Schrefl, M.; Neuböck, T. Reference Modeling for Data Analysis: The BIRD Approach. Int. J. Coop. Inf. Syst. 2016, 25, 1–46. [Google Scholar] [CrossRef] [Green Version]
  80. Amin, M.M.; Sutrisman, A.; Dwitayanti, Y. Development of Star-Schema Model for Lecturer Performance in Research Activities. Int. J. Adv. Comput. Sci. Appl. 2021, 12, 74–80. [Google Scholar] [CrossRef]
  81. Moscoso-Zea, O.; Paredes-Gualtor, J.; Luján-Mora, S. A Holistic View of Data Warehousing in Education. IEEE Access 2018, 6, 64659–64673. [Google Scholar] [CrossRef]
  82. Muntean, M.; Dănăiaţă, D.; Hurbean, L.; Jude, C. A Business Intelligence & Analytics Framework for Clean and Affordable Energy Data Analysis. Sustainability 2021, 13, 638. [Google Scholar] [CrossRef]
  83. Muszyńska, K.; Marx, S. Communication Management Practices in International Projects in Polish and German Higher Education Institutions. Procedia Comput. Sci. 2019, 164, 329–336. [Google Scholar] [CrossRef]
  84. Levstek, A.; Pucihar, A.; Hovelja, T. Towards an Adaptive Strategic IT Governance Model for SMEs. J. Theor. Appl. Electron. Commer. Res. 2022, 17, 230–252. [Google Scholar] [CrossRef]
  85. Huesemann, B.; Lechtenboerger, J.; Vossen, G. Conceptual Data Warehouse Design. Data Wareh. Syst. 2014, 2000, 89–119. [Google Scholar] [CrossRef]
  86. Snider, D.; Morgan, J.D.; Schwartz, M.; Adkison, A.; Baptiste, D.J. An Online Analytical Processing Database for Environmental Water Quality Analytics. In Proceedings of the SoutheastCon 2018, St. Petersburg, FL, USA, 19–22 April 2018; pp. 18–22. [Google Scholar] [CrossRef]
  87. Schütz, C.; Schausberger, S.; Kovacic, I.; Schrefl, M. Semantic OLAP Patterns: Elements of Reusable Business Analytics. In Proceedings of the OTM Confederated International Conferences “On the Move to Meaningful Internet Systems”, Rhodes, Greece, 23–27 October 2017. [Google Scholar]
  88. Hilal, M.; Schuetz, C.G.; Schrefl, M. Using Superimposed Multidimensional Schemas and OLAP Patterns for RDF Data Analysis. Open Comput. Sci. 2018, 8, 18–37. [Google Scholar] [CrossRef]
  89. Chen, Y.; Wang, M.; Li, L. A Framework for the Contract Management System in Cloud-Based ERP for SMEs in the Construction Industry. In Proceedings of the International Conference on Construction and Real Estate Management 2019, Lyon, France, 2–4 August 2019; pp. 1–11. [Google Scholar] [CrossRef]
  90. Veneberg, R.K.M.; Iacob, M.E.; Sinderen, M.J.V.; Bodenstaff, L. Enterprise Architecture Intelligence: Combining Enterprise Architecture and Operational Data. In Proceedings of the 2014 IEEE 18th International Enterprise Distributed Object Computing Conference, Ulm, Germany, 1–5 September 2014; pp. 22–31. [Google Scholar] [CrossRef]
  91. Volden, G.H. Assessing Public Projects’ Value for Money: An Empirical Study of the Usefulness of Cost-Benefit Analyses in Decision-Making. Proj. Manag. J. 2018, 917–925. [Google Scholar] [CrossRef]
  92. Sefair, J.A.; Méndez, C.Y.; Babat, O.; Medaglia, A.L.; Zuluaga, L.F. Linear Solution Schemes for Mean-SemiVariance Project Portfolio Selection Problems: An Application in the Oil and Gas Industry. Omega 2017, 68, 39–48. [Google Scholar] [CrossRef]
  93. Hannila, H.; Kuula, S.; Harkonen, J.; Haapasalo, H. Digitalisation of a Company Decision-Making System: A Concept for Data-Driven and Fact-Based Product Portfolio Management. J. Decis. Syst. 2020, 31, 258–279. [Google Scholar] [CrossRef]
  94. Bhimani, A.; Broedel Lopes, A.; de Aquino, A.C.B. Measurement Costs and Control in Outsourcing Relationships. Int. J. Manag. Financ. Account. 2017, 8, 296–318. [Google Scholar] [CrossRef]
  95. Dumitriu, D.; Popescu, M.A.-M. Enterprise Architecture Framework Design in IT Management. Procedia Manuf. 2020, 46, 932–940. [Google Scholar] [CrossRef]
  96. Baker, M.; Bourne, M. A Governance Framework for the Idea-to-Launch Process: Development and Application of a Governance Framework for New Product Development. Res. Technol. Manag. 2014, 57, 42–48. [Google Scholar] [CrossRef]
  97. Tolonen, A.; Shahmarichatghieh, M.; Harkonen, J.; Haapasalo, H. Product Portfolio Management—Targets and Key Performance Indicators for Product Portfolio Renewal over Life Cycle. Int. J. Prod. Econ. 2015, 170, 468–477. [Google Scholar] [CrossRef] [Green Version]
  98. Chugh, R.; Grandhi, S. Why Business Intelligence? Int. J. E Entrepreneursh. Innov. 2013, 4, 1–14. [Google Scholar] [CrossRef] [Green Version]
  99. Pajić, A.; Pantelić, O.; Stanojević, B. Representing IT Performance Management as Metamodel. Int. J. Comput. Commun. Control 2014, 9, 758–767. [Google Scholar] [CrossRef]
  100. Yigitbasioglu, O.M. Drivers of Management Accounting Adaptability: The Agility Lens. J. Account. Organ. Chang. 2017, 13, 262–281. [Google Scholar] [CrossRef]
  101. Izonin, I.; Tkachenko, R.; Verhun, V.; Zub, K. An Approach towards Missing Data Management Using Improved GRNN-SGTM Ensemble Method. Eng. Sci. Technol. Int. J. 2021, 24, 749–759. [Google Scholar] [CrossRef]
  102. Shen, X.; Guo, Y.; Li, A. Cooperative Coevolution with an Improved Resource Allocation for Large-Scale Multi-Objective Software Project Scheduling. Appl. Soft Comput. 2020, 88, 106059. [Google Scholar] [CrossRef]
Figure 1. IT governance framework. The upper half covers the processes that determine directions, make plans and decisions, and establish constraints. The lower half covers processes that manage capabilities or develop new ones and use them to deliver products/services. Once the business strategies (red in figure), governance regimes, risk assessment, and controls have been developed (yellow in figure), IT works with the business to develop architectures and deliver plans based on those requirements (green in figure). The three layers into which the framework is divided, respectively, indicate the key issue for the board to consider (internal level), the executive management responsibilities (middle layer) and the issue related to IT practitioners (external layer) [7].
Technologies 10 00106 g001
Figure 2. IT governance framework. The five areas of governance. The system follows the five areas driven by the stakeholders needs. The two outcomes (IT delivery and risk management) and three drivers (IT strategic alignment, resource management, and performance measurement) [9].
Technologies 10 00106 g002
Figure 3. Data-driven governance framework for a performance monitoring domain. In grey are represented the DSS layers and in blue are the main data sources. The requirements in green have been mapped on the DSS layers.
Technologies 10 00106 g003
Figure 4. ER diagram data model design using the crow’s foot notation. The open-source software used for the model design was draw.io (tables’ elements name were manipulated and de-identified in order not to reveal the intellectual property of the units involved).
Technologies 10 00106 g004
Figure 5. Contracts monitoring overview (quantitative data were manipulated and contracts‘ details de-identified in order not to reveal the intellectual property of the units involved). The percentage of subcontracting (30%) is the average value; by selecting the supplier and business unit this value will change according to agreed maximum subcontracting amount.
Technologies 10 00106 g005
Figure 6. Project sheet (quantitative data were manipulated and the project’s details de-identified in order not to reveal the intellectual property of the units involved). These data are crucial information for managers, who report to the responsible or for the manager accountable to the customer about the project’s progress.
Technologies 10 00106 g006
Table 1. Main differences between BI and big data.
BIBig Data
Data SourcesMostly internalMostly external
Data TypesMostly structuredUnstructured
HistoryEssentialLess relevant
UsersManagers/ControllerData scientist
PrecisionExact resultsApproximate results
PrivacyNot criticalCritical
Control over data Almost full controlLittle or no control
Publisher’s Note: MDPI stays neutral with regard to jurisdictional claims in published maps and institutional affiliations.

