1. Introduction
At the end of 2019, the novel coronavirus began spreading among people, resulting in a pandemic crisis. COVID-19 is the name of the 2019-nCoV illness. According to current evidence, it spreads through speaking, coughing, or breathing at a close range of nearly one meter [
1].
The 2019-nCoV virus infects the lungs of a specific person, so we commonly use computed tomography images of the lungs to check how this virus infected them. Computed tomography scan analysis can be divided into three categories: classification, object detection, and semantic segmentation. The first tactic, CT scan classification, yields a binary result of 0 or 1, indicating whether the patient has COVID-19. In the event of a positive detection, the second technique generates bounding boxes that identify the symptomatic areas. In the third example, the symptomatic areas in each CT scan slice are detected at the pixel level. In [
1], they proposed a deep-learning semantic segmentation approach to annotate symptomatic lung areas for COVID-19 patients using computed tomography images.
Authors are motivated by the success story of image segmentation architectures [
2,
3,
4]; they have studied how these architectures are used to improve the performance of the segmentation process.
Using chest X-ray images for COVID-19 detection can be a viable and efficient alternative or auxiliary strategy for the identification and control of the COVID-19 disease when compared with other types of testing. If the necessary resources are available, a reverse transcription–polymerase chain reaction (RT-PCR) test, for example, takes about 48 h to complete. We will be able to detect COVID-19 early if we develop a reliable approach that uses chest X-ray. Wrong medication and diagnosis can cause other severe problems, and that is why correct diagnosis of lung X-ray is needed.
The contribution of this paper could be stated as a review of various image segmentation techniques and the implementation and result analysis of five specific image segmentation techniques, i.e., UNet, ResUNet, SegNet, FCN, and ResUNet++, by comparing these techniques based on various performance metrics.
1.1. Background
Effective diagnostic strategies for COVID-19 patients are now in great demand. One of the most successful strategies for diseased tree trimming is predicting the problem [
5]. The number of people infected with SARS-CoV-2 is currently increasing. Thus, a trusted automated system to identify the infected part of the lungs through X-ray is needed. It is simple to build a deep-learning system that acts in real time as a person. Ref. [
6] studied brain tumor image segmentation and used UNet and SegNet to achieve excellent accuracy. Many deep-learning algorithms are currently being utilized to detect sickness early on. In [
7], designing a lung carcinoma screening tool based on DL structures was carried out to reduce the false-positive rate in low-dose CT scan lung carcinoma screening. Moreover, in [
8], existing deep neural network frameworks were compared for breast cancer image segmentation, and a new framework was also introduced. The liver, brain, kidneys, bones, tissues, and other biological parts were subjected to picture segmentation algorithms.
In [
9], researchers implemented a so-called fully connected convolutional layer, and in [
5], they extended the architecture of FCCNs to the next level. Many deep-learning researchers devised an algorithm to classify data into COVID-19 positive or negative and multiclass classification (COVID-19, pulmonary inflammation, NO data, NO data). In [
1], the FCN and UNet algorithms were tested on computed tomography images, and they were found pretty accurate. Their algorithms performed well in terms of accuracy and precision but not in terms of recall.
In [
10], researchers proposed the dense UNet network and compared it with the multiresolution U-Net (multi-ResUNet) and conventional UNet networks on three separate datasets. The testing results reveal that the dense UNet network outperforms the multi-ResUNet and conventional UNet networks by a wide margin.
In [
11], researchers presented the UNet and ResUNet architectures in this study on landslide detection. Employing openly accessible Sentinel-2 data and digital elevation mode (DEM) demonstrated the usefulness of these systems in landslide detection.
In [
12], using edge detection and morphological approaches, the authors developed a lung segmentation architecture. The Euler number approach is used to enhance edge detection. The morphological approach is then employed to improve the lung edge to create the lung region’s final output.
The goal of the ML architectures is to achieve high performance. There is always potential to improve the current architectures.
1.2. Our Work
We proposed utilizing a convolutional neural network architecture for lung segmentation from chest X-ray pictures in this research study. UNet, ResUNet, FCN, SegNet, and ResUNet++ are the architectures that we presented. We analyzed these two designs and attempted to discover the best solution for chest X-ray image segmentation using GPU training.
This proposed ResUNet++ architecture takes advantage of the ASPP layer, attention block, residual block, squeeze block, and excitation block and gives us better results.
2. Methodology
We compared image segmentation methods such as UNet, ResUNet, FCN, SegNet, and ResUNet++. We thoroughly examined these models and calculated their accuracy, dice loss, and recall. We examined these three structures using X-ray images of the chest and attempted to determine whether one architecture was superior to the other.
2.1. Dataset
The X-ray pictures for this dataset came from the Department of Health and Human Services’ TB control program in Montgomery County, MD, USA. This dataset contains 138 X-ray images, out of which 80 are in the normal category, and the remaining data are in the tuberculosis infection category. All the pictures are in DICOM format and have been de-identified. Among the oddities in the collection are effusions and militaristic motifs [
13].
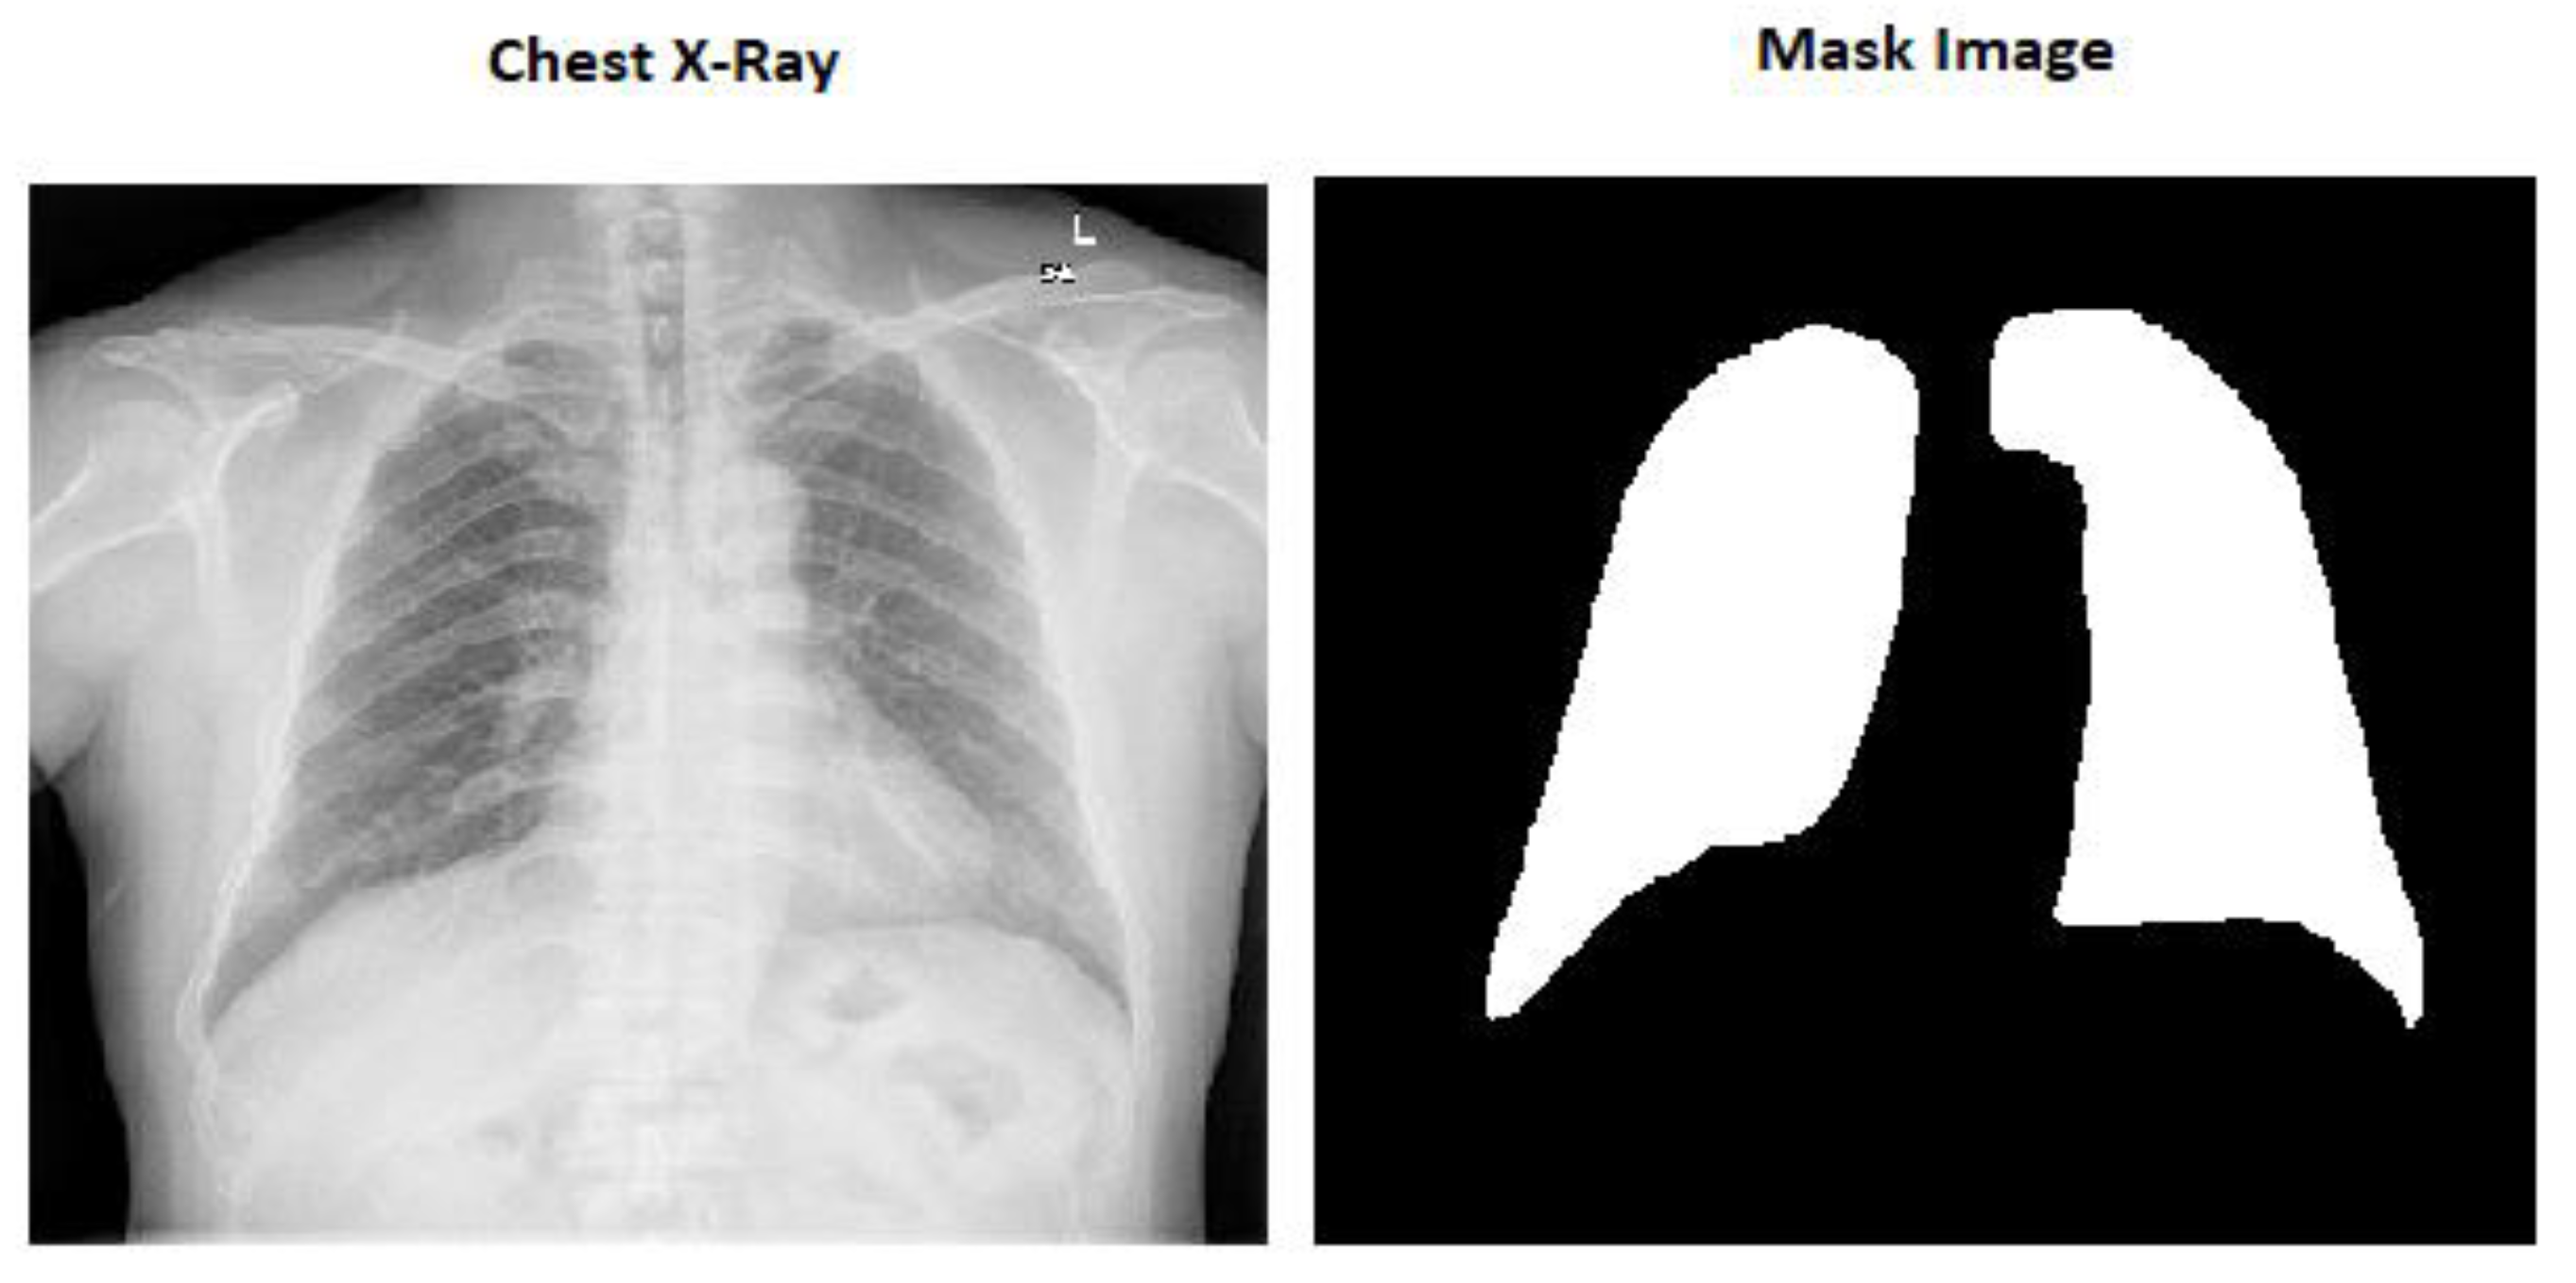
The mask pictures are included in all the chest X-ray images in the dataset. There are 800 chest X-ray pictures and 704 mask images in all.
2.2. Preprocessing
All the images in the dataset are in different shapes, so it will throw an error while passing the images through the CNN architecture. We made all the photos into (256 and 256) forms to solve this problem.
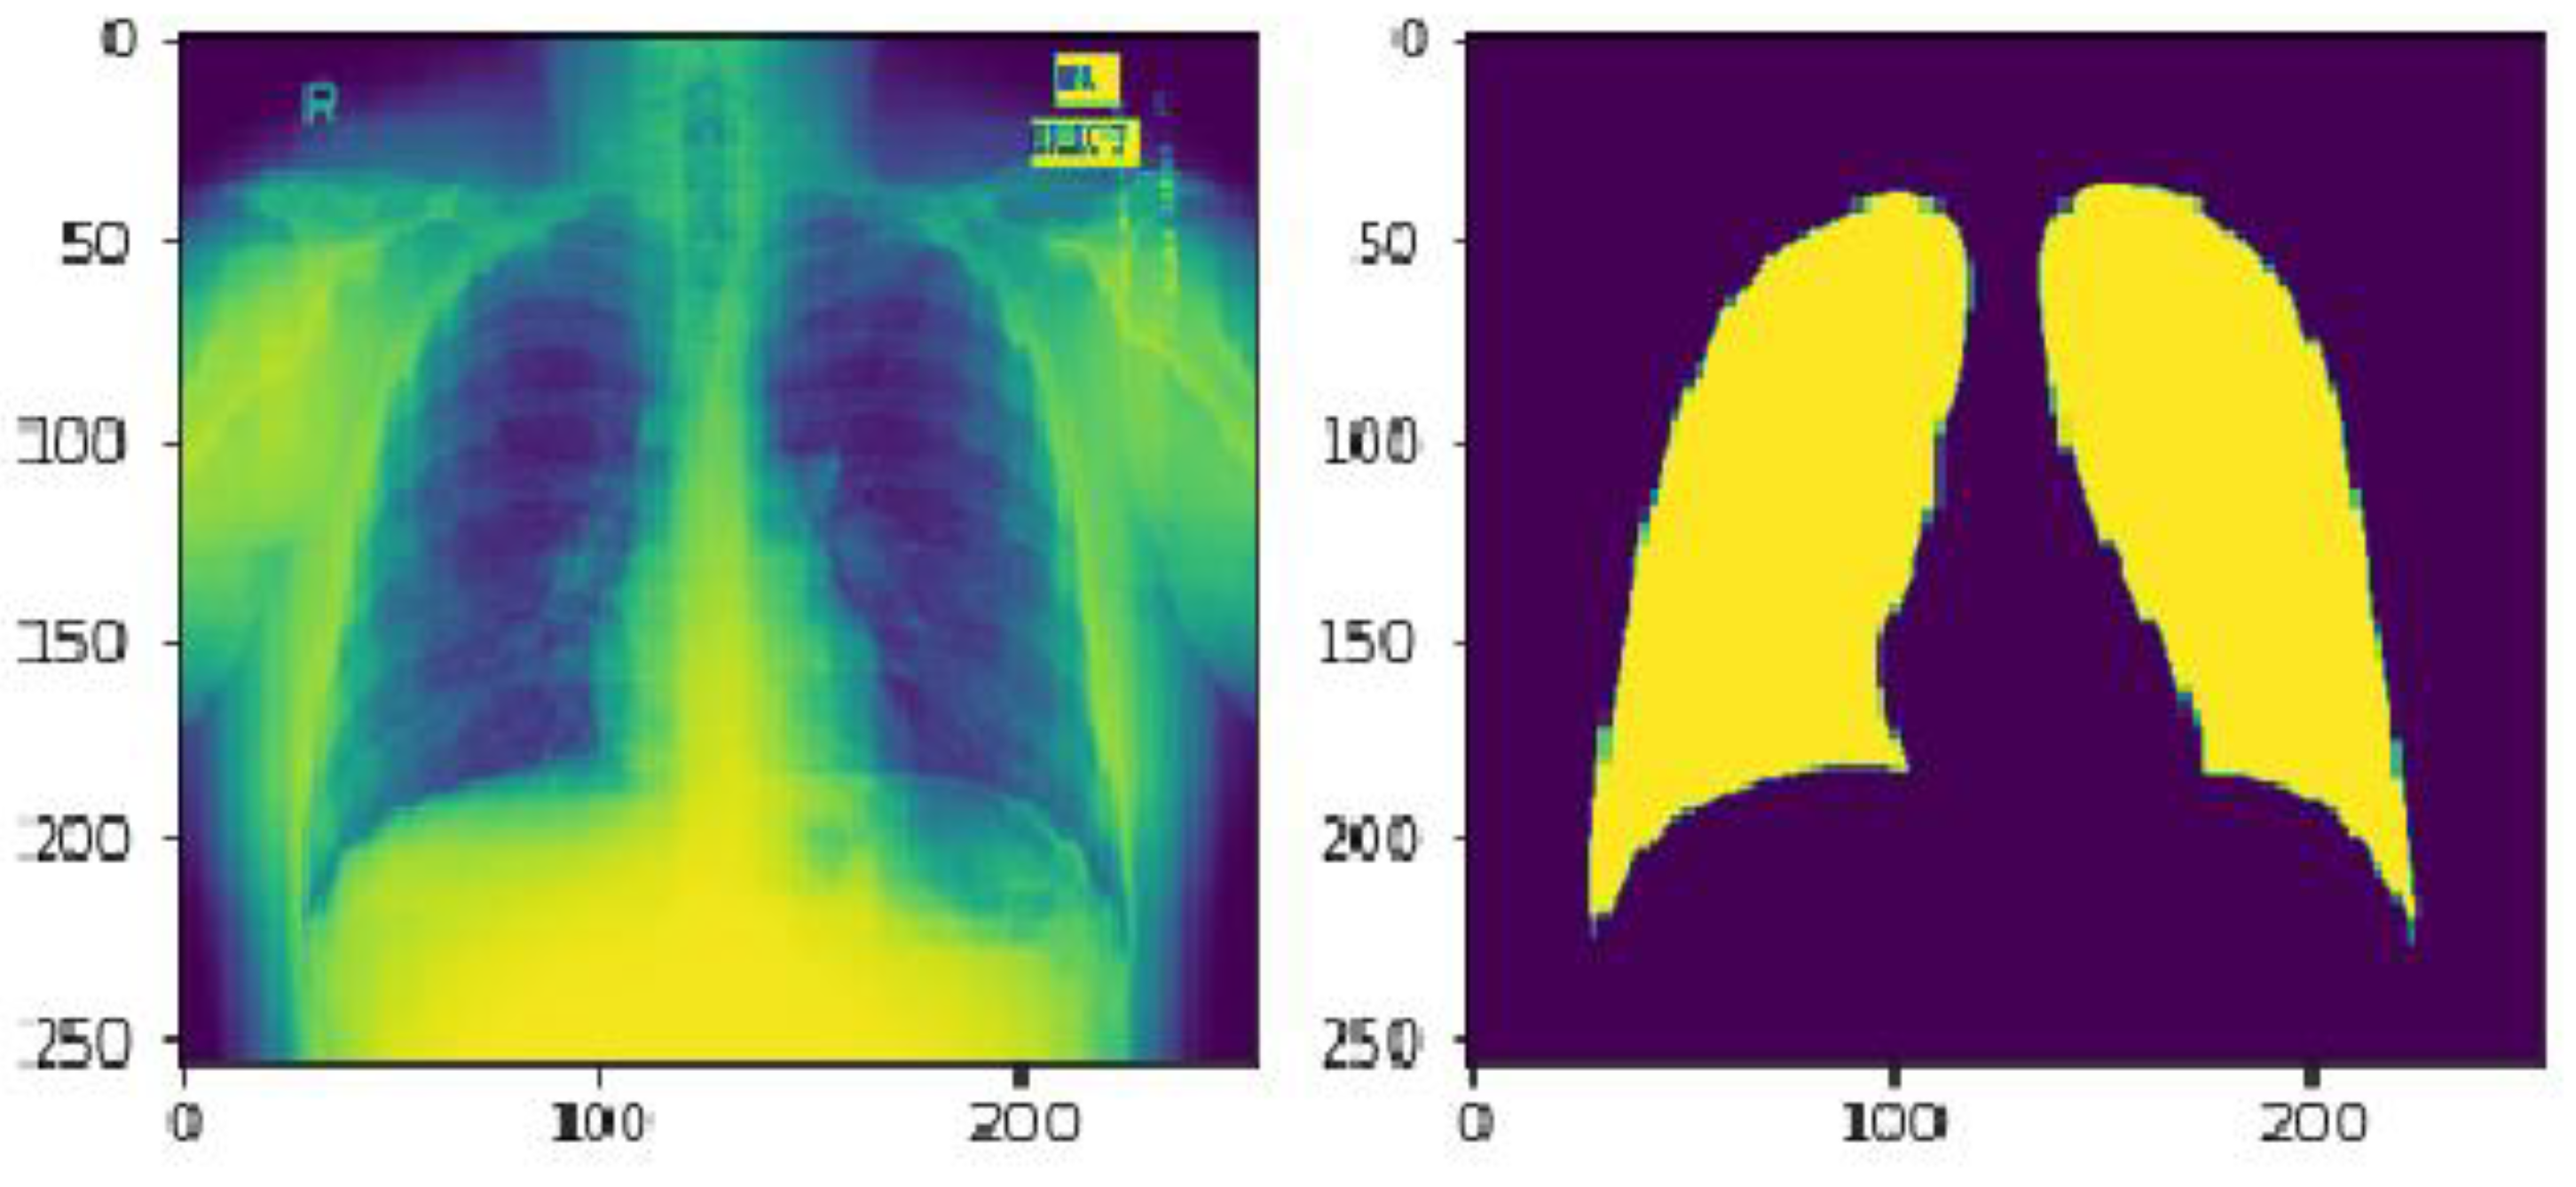
Because all these photographs were in RGB format, we converted them into gray scale to save time. It implies that the we modified the shape of the photographs from (256 × 256 × 3) to (256 × 256 × 1).
Here in
Figure 1 we can see the image size is (256 × 256 × 3) which is the actual size of the image and
Figure 2 is the modified image which is (256 × 256 × 1).
2.3. Segmentation Models
There are various segmentation models available for medical image processing such as DeepLab v1, ResUNet, UNet, UNet++, V-Net, SegNet, etc. In this research, we chose five segmentation algorithms—UNet, ResUNet, SegNet, FCN and ResUNet++—considering that their features such as UNet show highly accurate results in a wide area of biomedical images. It has become the gold standard for biomedical image segmentation [
14]; in the ResNet architecture, a residual block allows more accessible network training [
15], and the researcher preferred UNet based on residual unit semantic segmentation because it works with very few samples and provides better performance for the segmentation task [
16]; the ResUNet++ architecture takes advantage of the residual block, ASPP layer, squeeze block, excitation, block and attention block, and this model works well with a small number of images [
17].
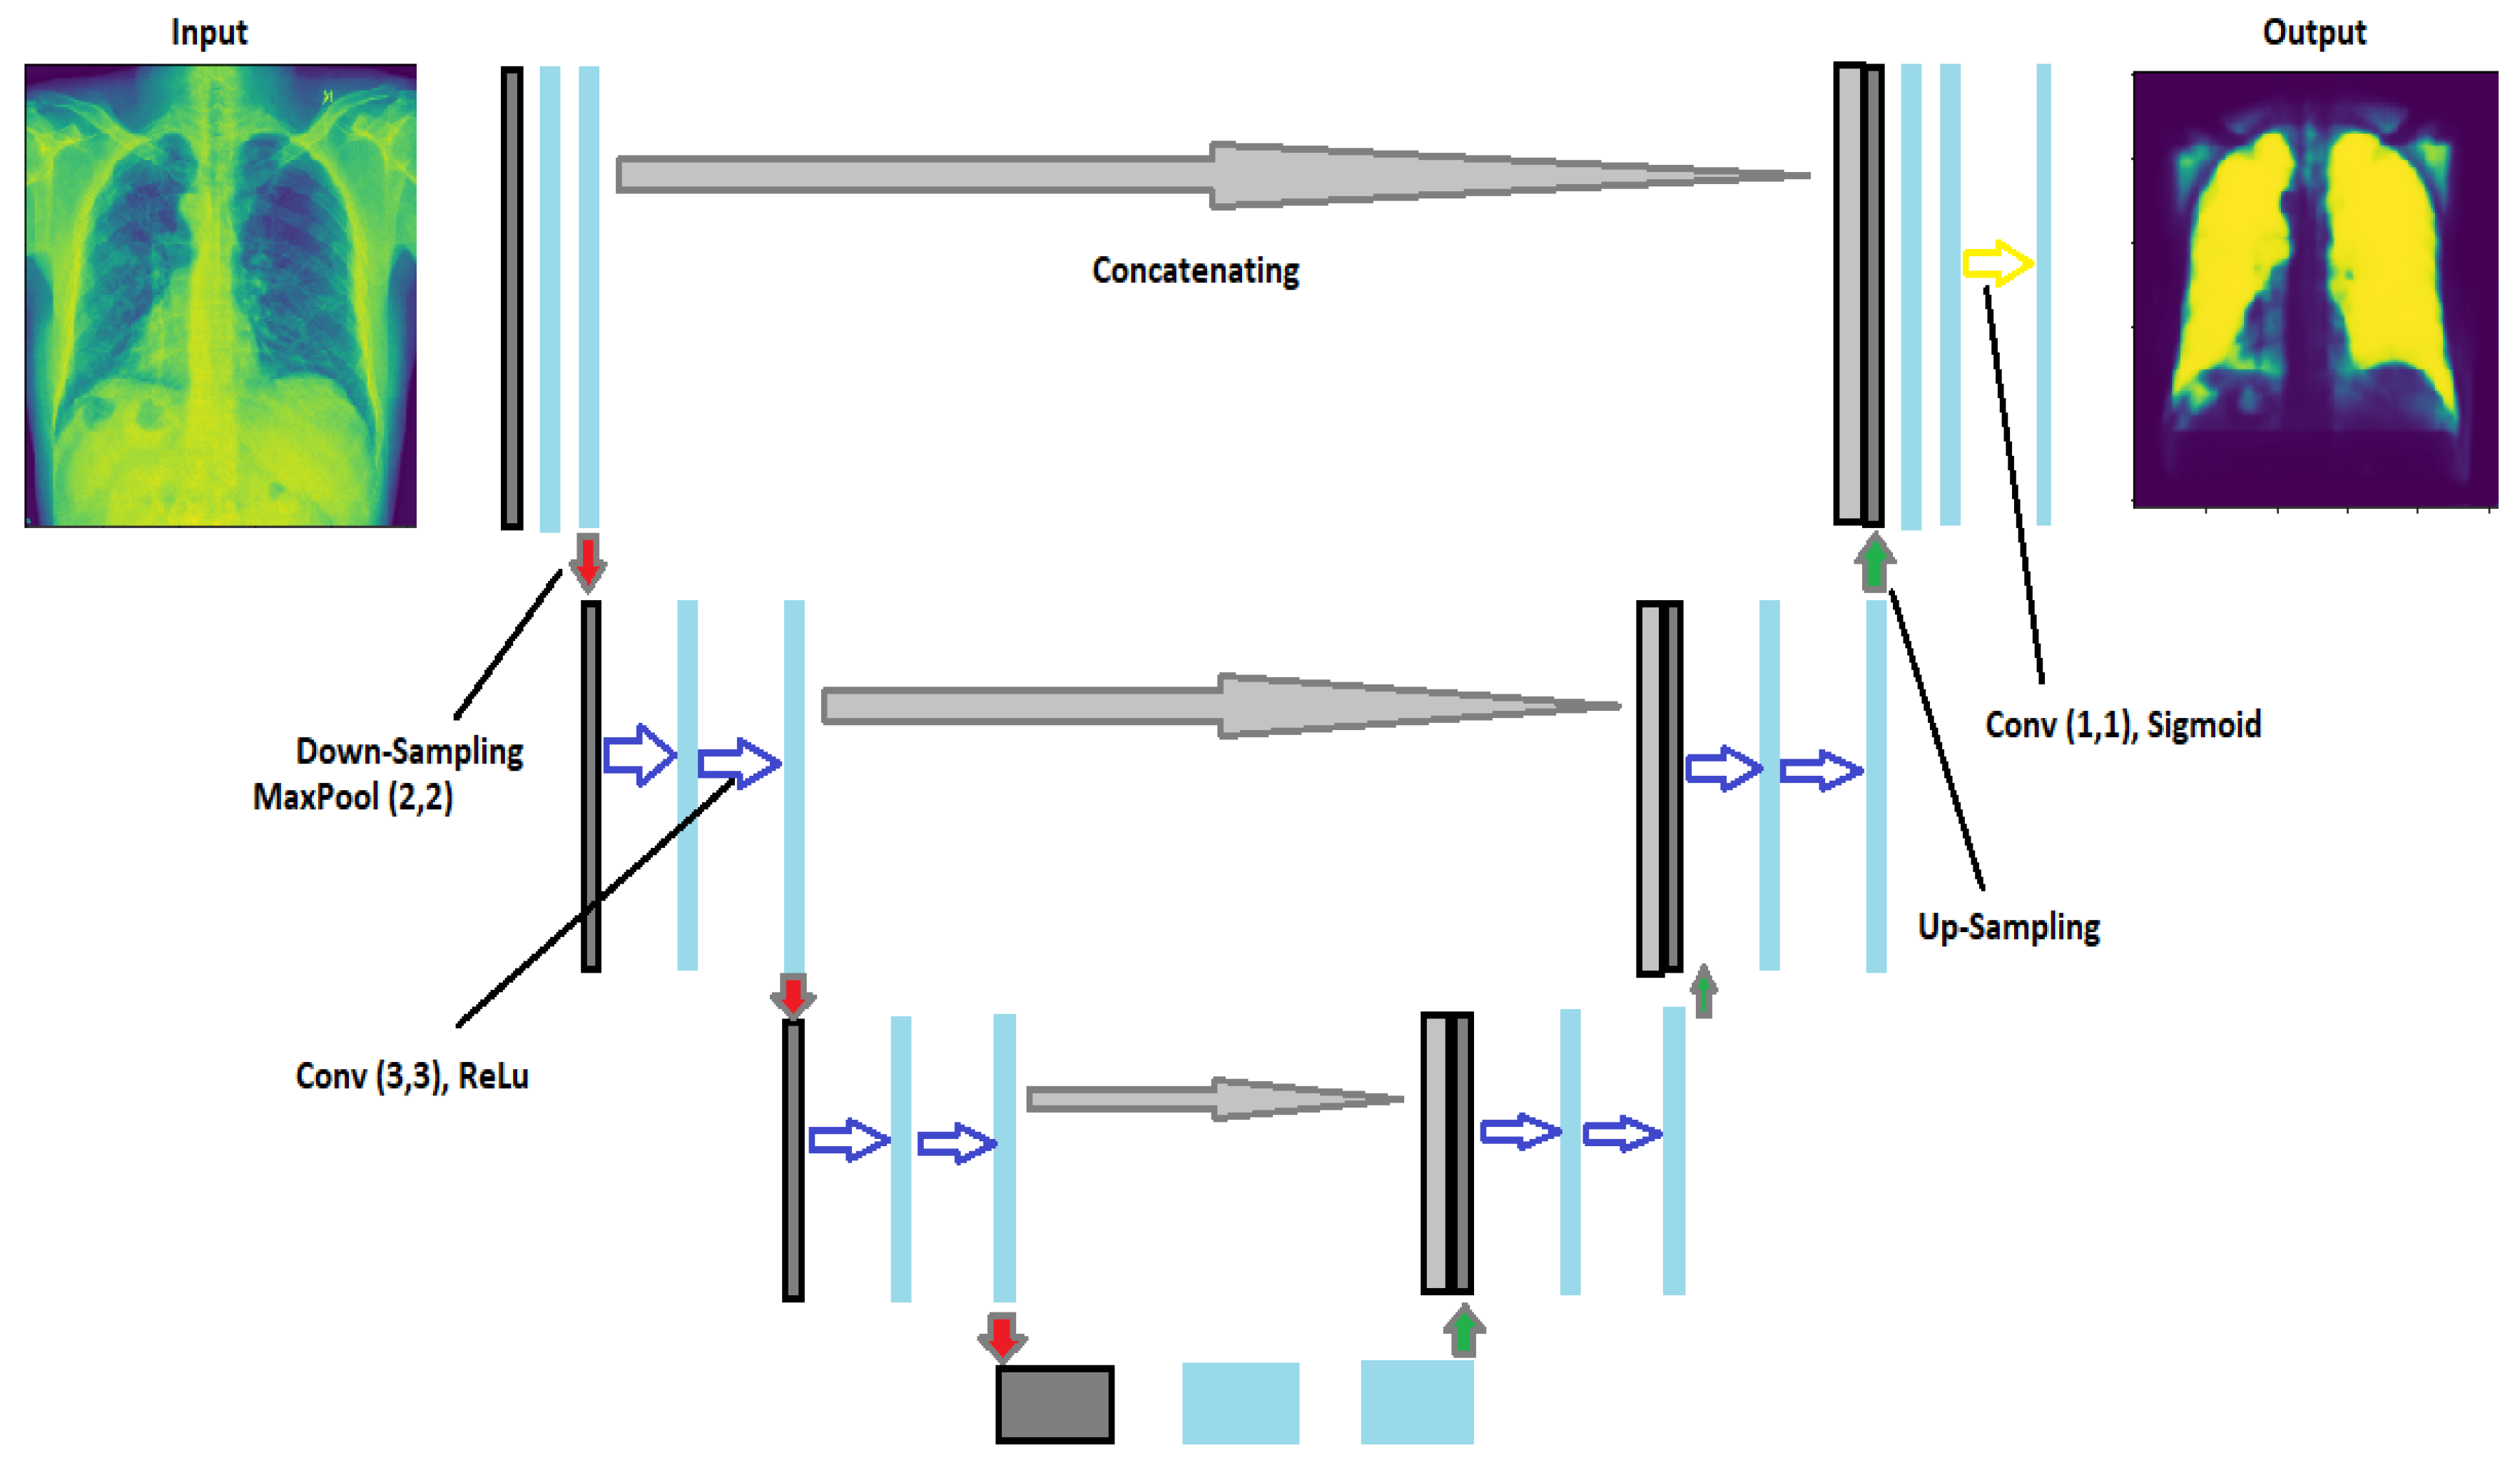
2.3.1. UNet
The UNet architecture is based on the fully convolutional network and aims to improve medical imaging segmentation outcomes. It is in the shape of a U. There are two pathways in the UNet: one for encoding and one for decoding [
18], both of which are remarkably similar. They obtain the same shape in the UNet as the output that we entered as the input. There are three indispensable structures in UNet: (1) scale down, (2) bottleneck, and (3) scale up. In autoencoders, the neural network’s encoder squeezes the input into a latent space representation, and the decoder derives the output from the squeezed or encoded representation. However, unlike traditional encoder–decoder arrangements, the two portions are not dissociated in this case. Skip connections are accustomed to moving fine-grained data from low-level analysis paths to a synthesis path’s high-level layers. This information is needed to create correct fine-grained reconstructions.
Figure 3 shows the architecture of UNet. In this architecture, we have implemented two convolutional layers of kernel_size = (3 × 3) followed by a MaxPool layer of size (2 × 2) for the contraction until they obtain the image’s form (32 × 32). After that, they started upsampling the image to transpose the layer and concatenate the transpose layer and the corresponding feature map. In addition, for the output, we used (1 × 1) as the kernel_size of the convolutional layer. Because the activation function of the final network layer is sigmoid, the network training procedure employs the cross-entropy cost function [
19].
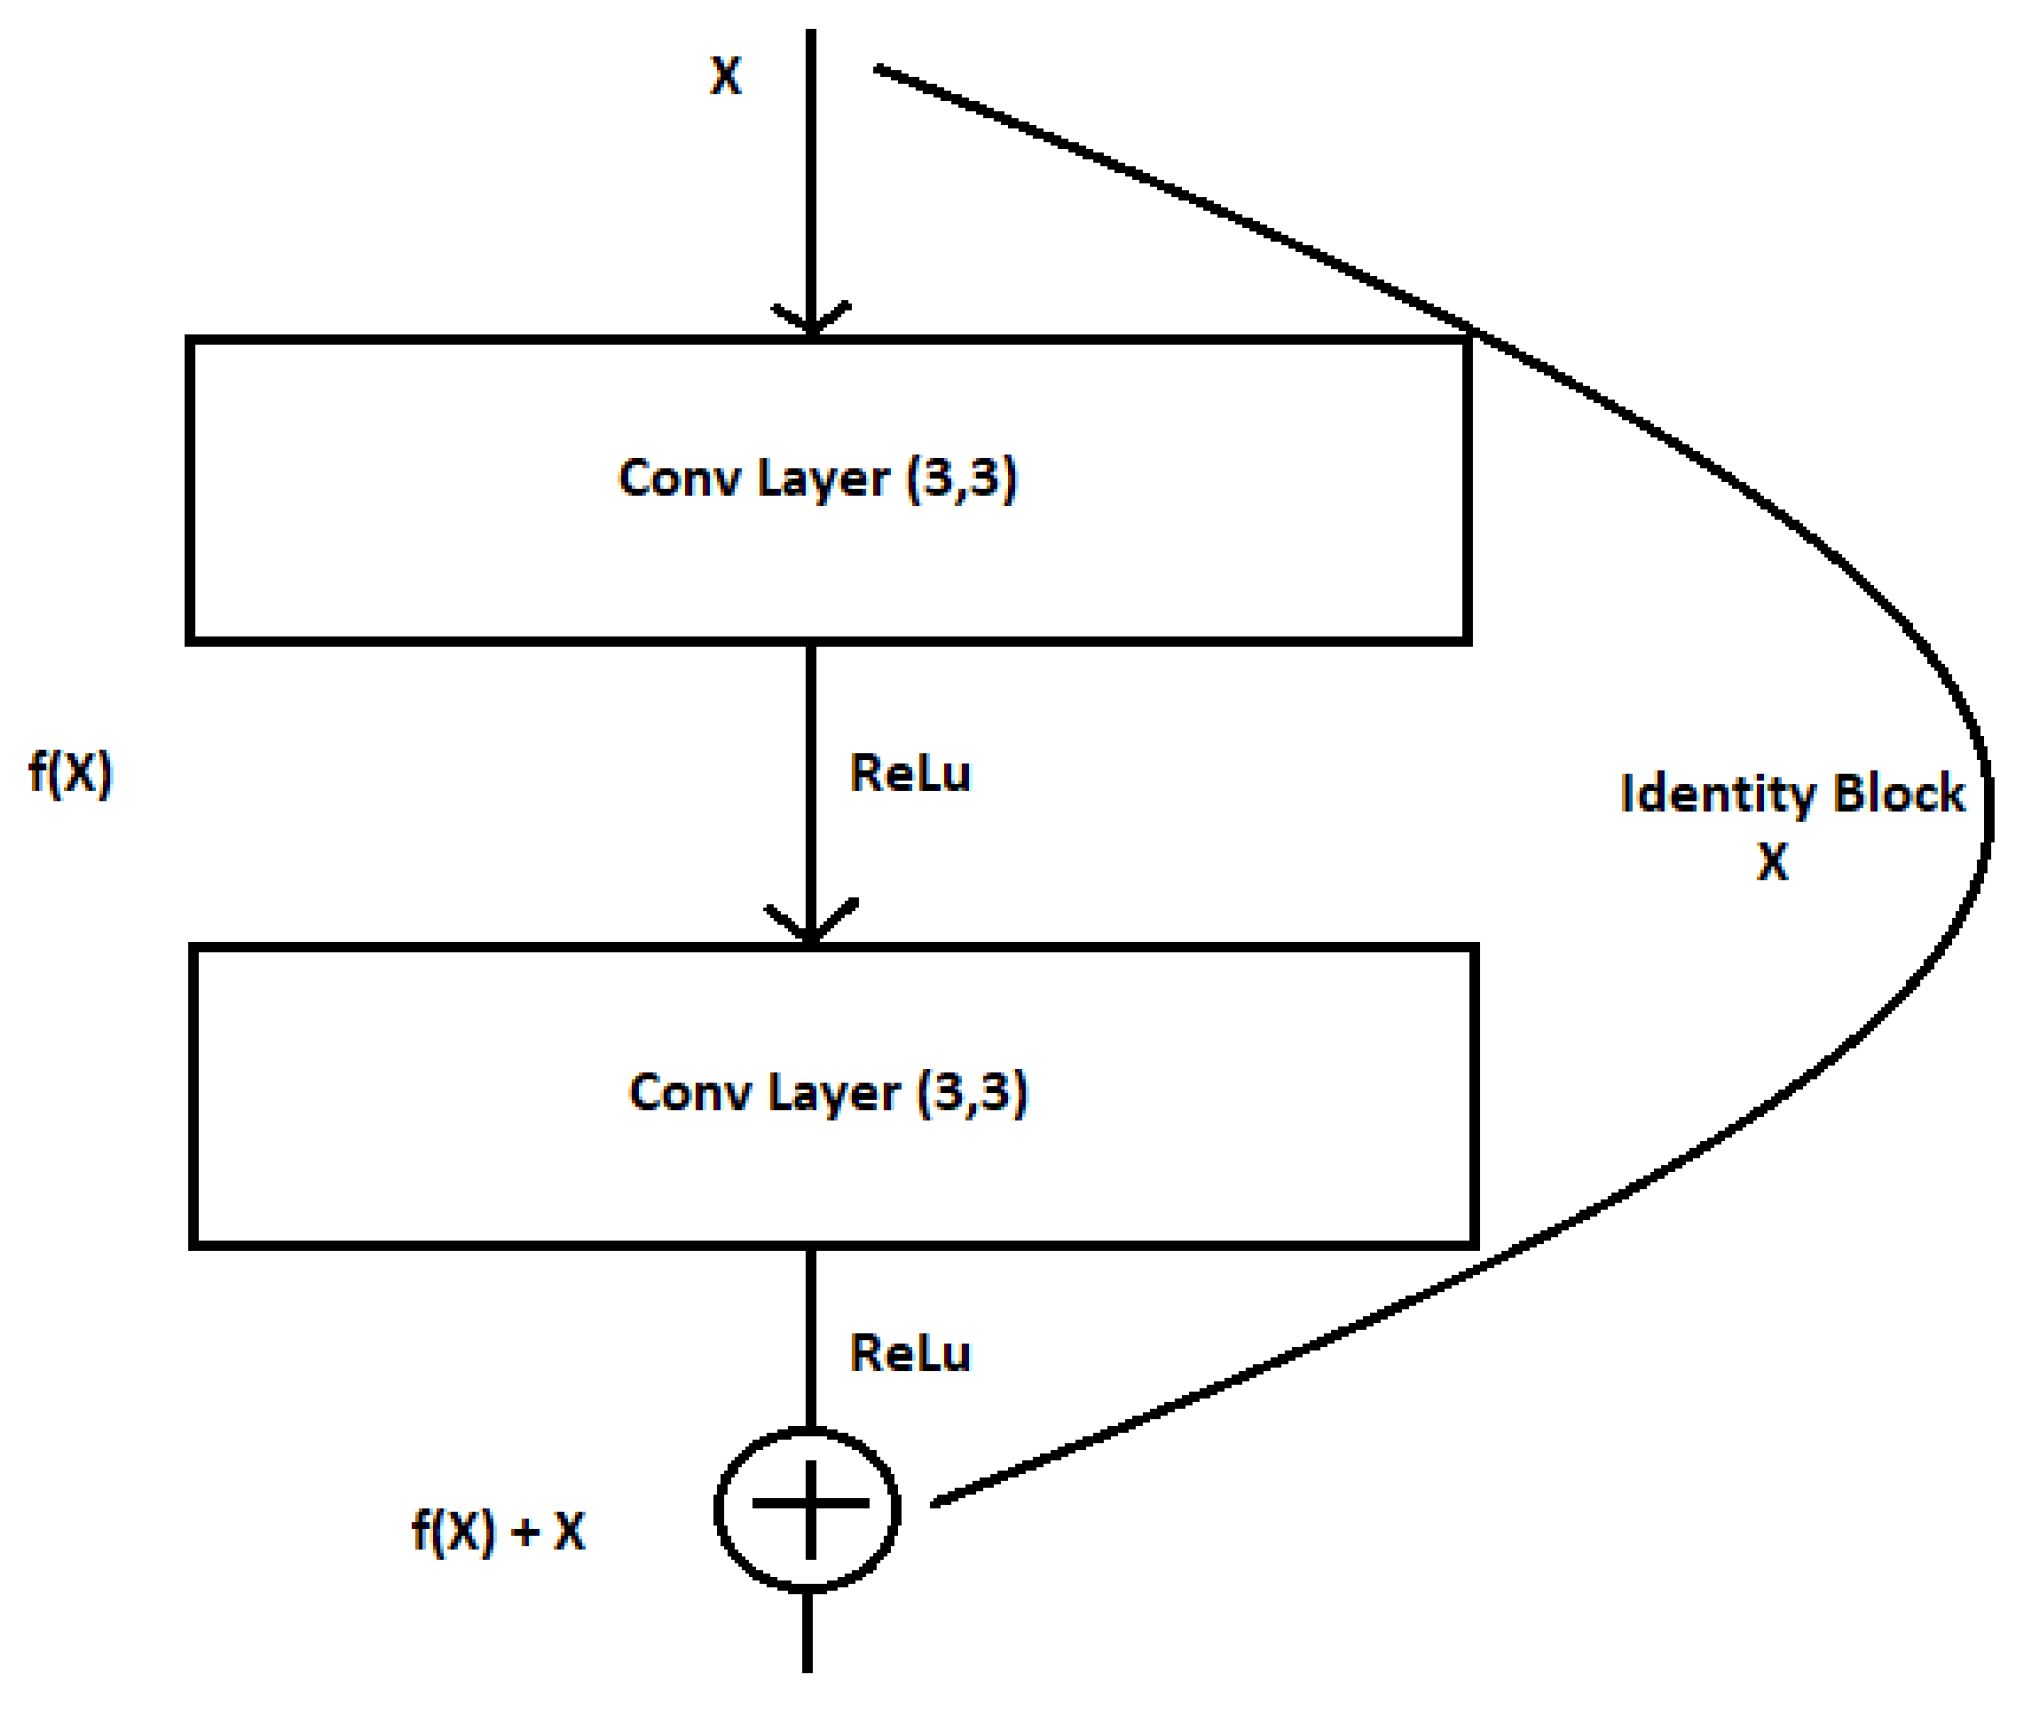
2.3.2. ResUNet
We have proposed the ResUNet architecture based on the advantages of the ResNet and UNet architectures. The ResUNet architecture is a hybrid of the ResNet and UNet technologies. They have applied the residual block of the ResNet architecture into the UNet architecture. The convolutional layer, pooling layer, and residual unit have all been tweaked. Before fusing the feature map of the downsampling layer, a residual unit was introduced after two convolutional layers to recover the feature space and an upsampling layer from accommodating the segmentation of complicated lung structures.
The residual block has no meaning, without the skip association. Here, in
Figure 4, X denotes the input of the convolutional layer, and, therefore, f(X) denotes the training from the two convolutional layers; rather than permitting layers to be told of the underlying mapping, we let the network to match the residual mapping rather than the victimization H(x) because in the initial mapping, we use F(x): = H(x) − x, which provides H(x): = F(x) + x.
In ref. [
11], a stacked sequence of residual units is used to explain the architecture of a residual neural block, with a single residual unit being defined as
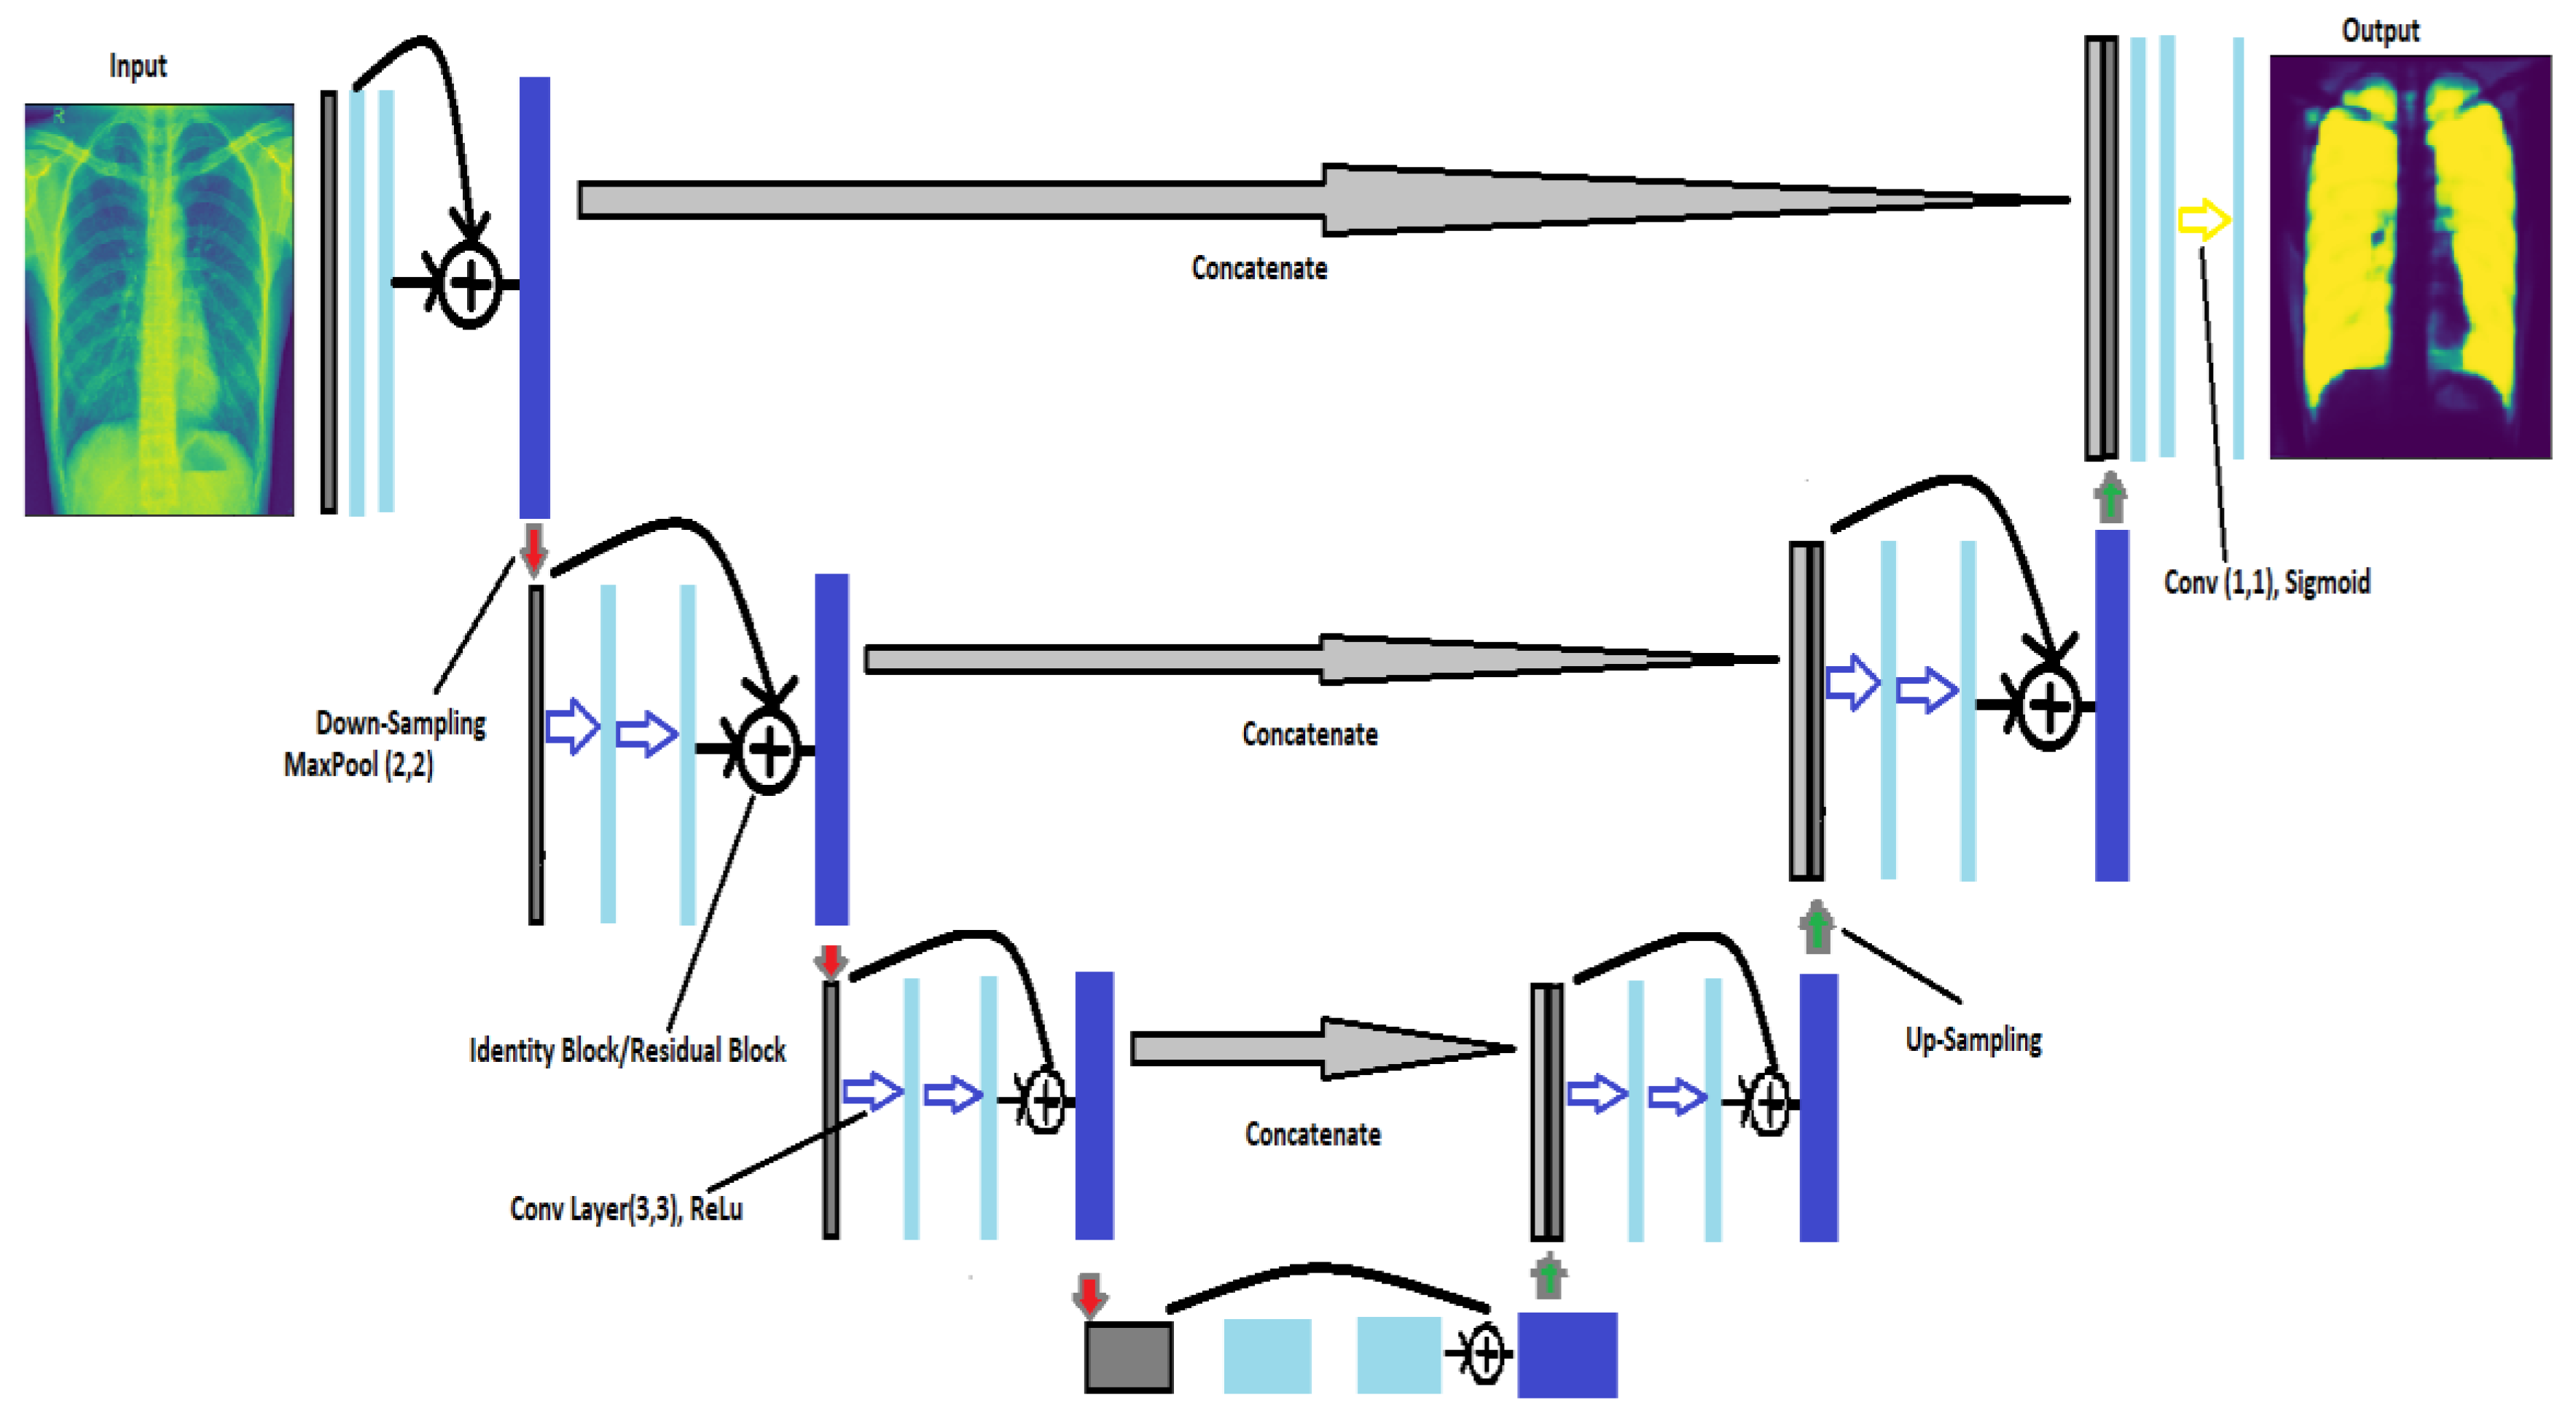
We can see the architecture of ResUNet in
Figure 5. The ResUNet architecture enhances learning efficiency and even mitigates vanishing gradient issues. ResUNet lacks the 2 × 2 max-pooling layer and instead obtains the downsampling with a convolution stride of 2. Before each convolutional layer, a batch normalization (BN) process is added. The identity mapping h(x
i) adds a block’s input to its output in the end.
In [
11], ResUNet led to higher performance in the majority of the cases on Sentinel-2 data.
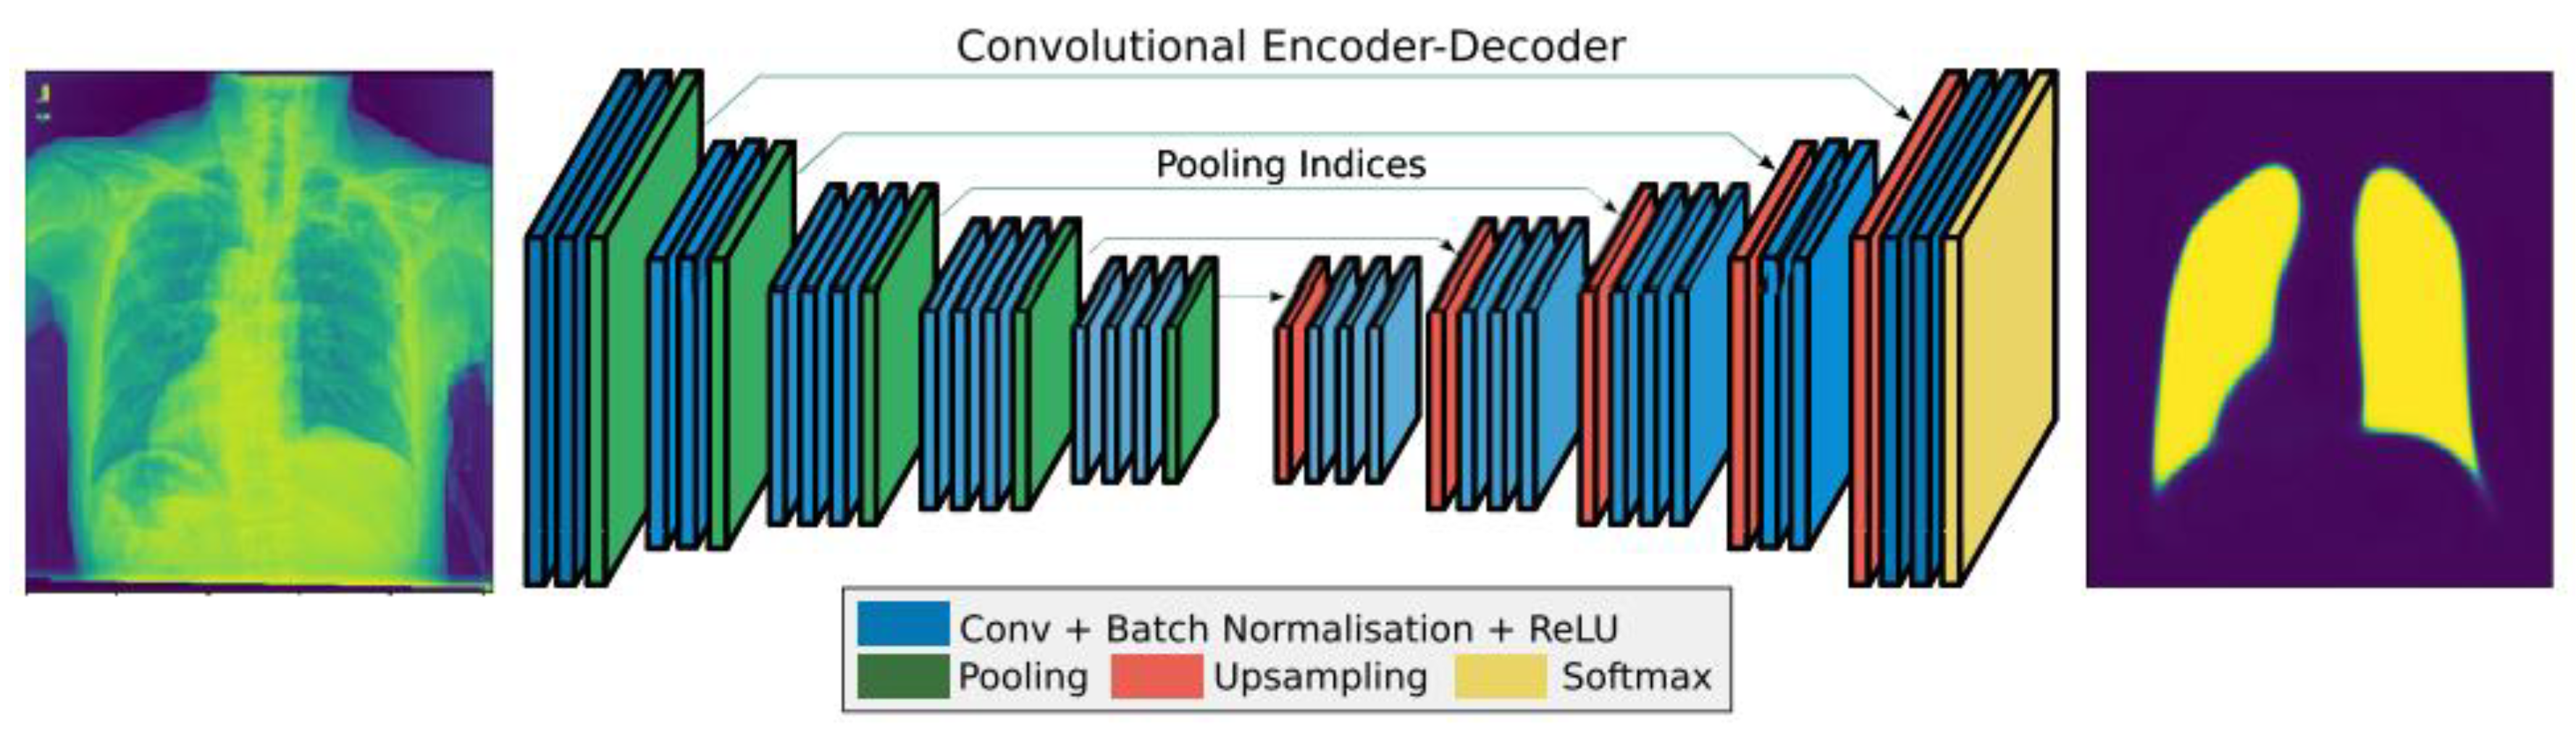
2.3.3. SegNet
SegNet is a system that is intended to be effective in semantically segmenting images at the pixel level. It comprehends how various classes are spatially related [
20]. SegNet’s encoder network and VGG16’s convolutional layers have the same topological structure [
18,
21]. By removing the fully linked layers from VGG16, the authors in [
18] greatly reduced the size and complexity of the SegNet encoder network. The decoder network, which consists of a hierarchy of decoders with one for each encoder, is the main part of SegNet.
As shown in
Figure 6, SegNet consists of an encoder network, matching decoder network, and pixel-wise classification layer at the bottom. The decoder network contains 13 levels since there is a matching decoder layer for each encoder layer.
Convolution is performed between an encoder block and a filter to create a collection of feature maps. Translation invariance is attained using the 13 max-pooling convolutional layers that are not fully linked. When used with subsampling, it results in pixels controlling massive input feature maps.
Decoder filter banks are convolved with upsampled feature maps in decoder blocks using maxpooling indices that have been learned from the associated encoder feature map to create a dense feature map. Following this, the classifier categorizes each pixel and outputs a channel probability picture.
2.3.4. FCN
In [
9], the authors showed that without additional equipment, a fully convolutional network (FCN) trained end-to-end and pixels-to-pixels on semantic segmentation outperforms the state of the art. In the FCN, enabling the implementation of localization and skip connections restores the precise spatial information lost during the downsampling.
We can see the architecture of FCN in
Figure 7. In this architecture, a three-dimensional array of size h × w × d, with h and w being spatial dimensions and d being the feature or channel dimension, makes up each layer of data in a convnet. The picture that has color channels and pixels with a size of h × w is the first layer. These functions produce the outputs y
ij by writing x
ij for the data vector at position (i,j) in a specific layer and y
ij for the subsequent layer [
9].
where s is the stride or subsampling factor, f
ks specifies the layer type, and k is known as the kernel size.
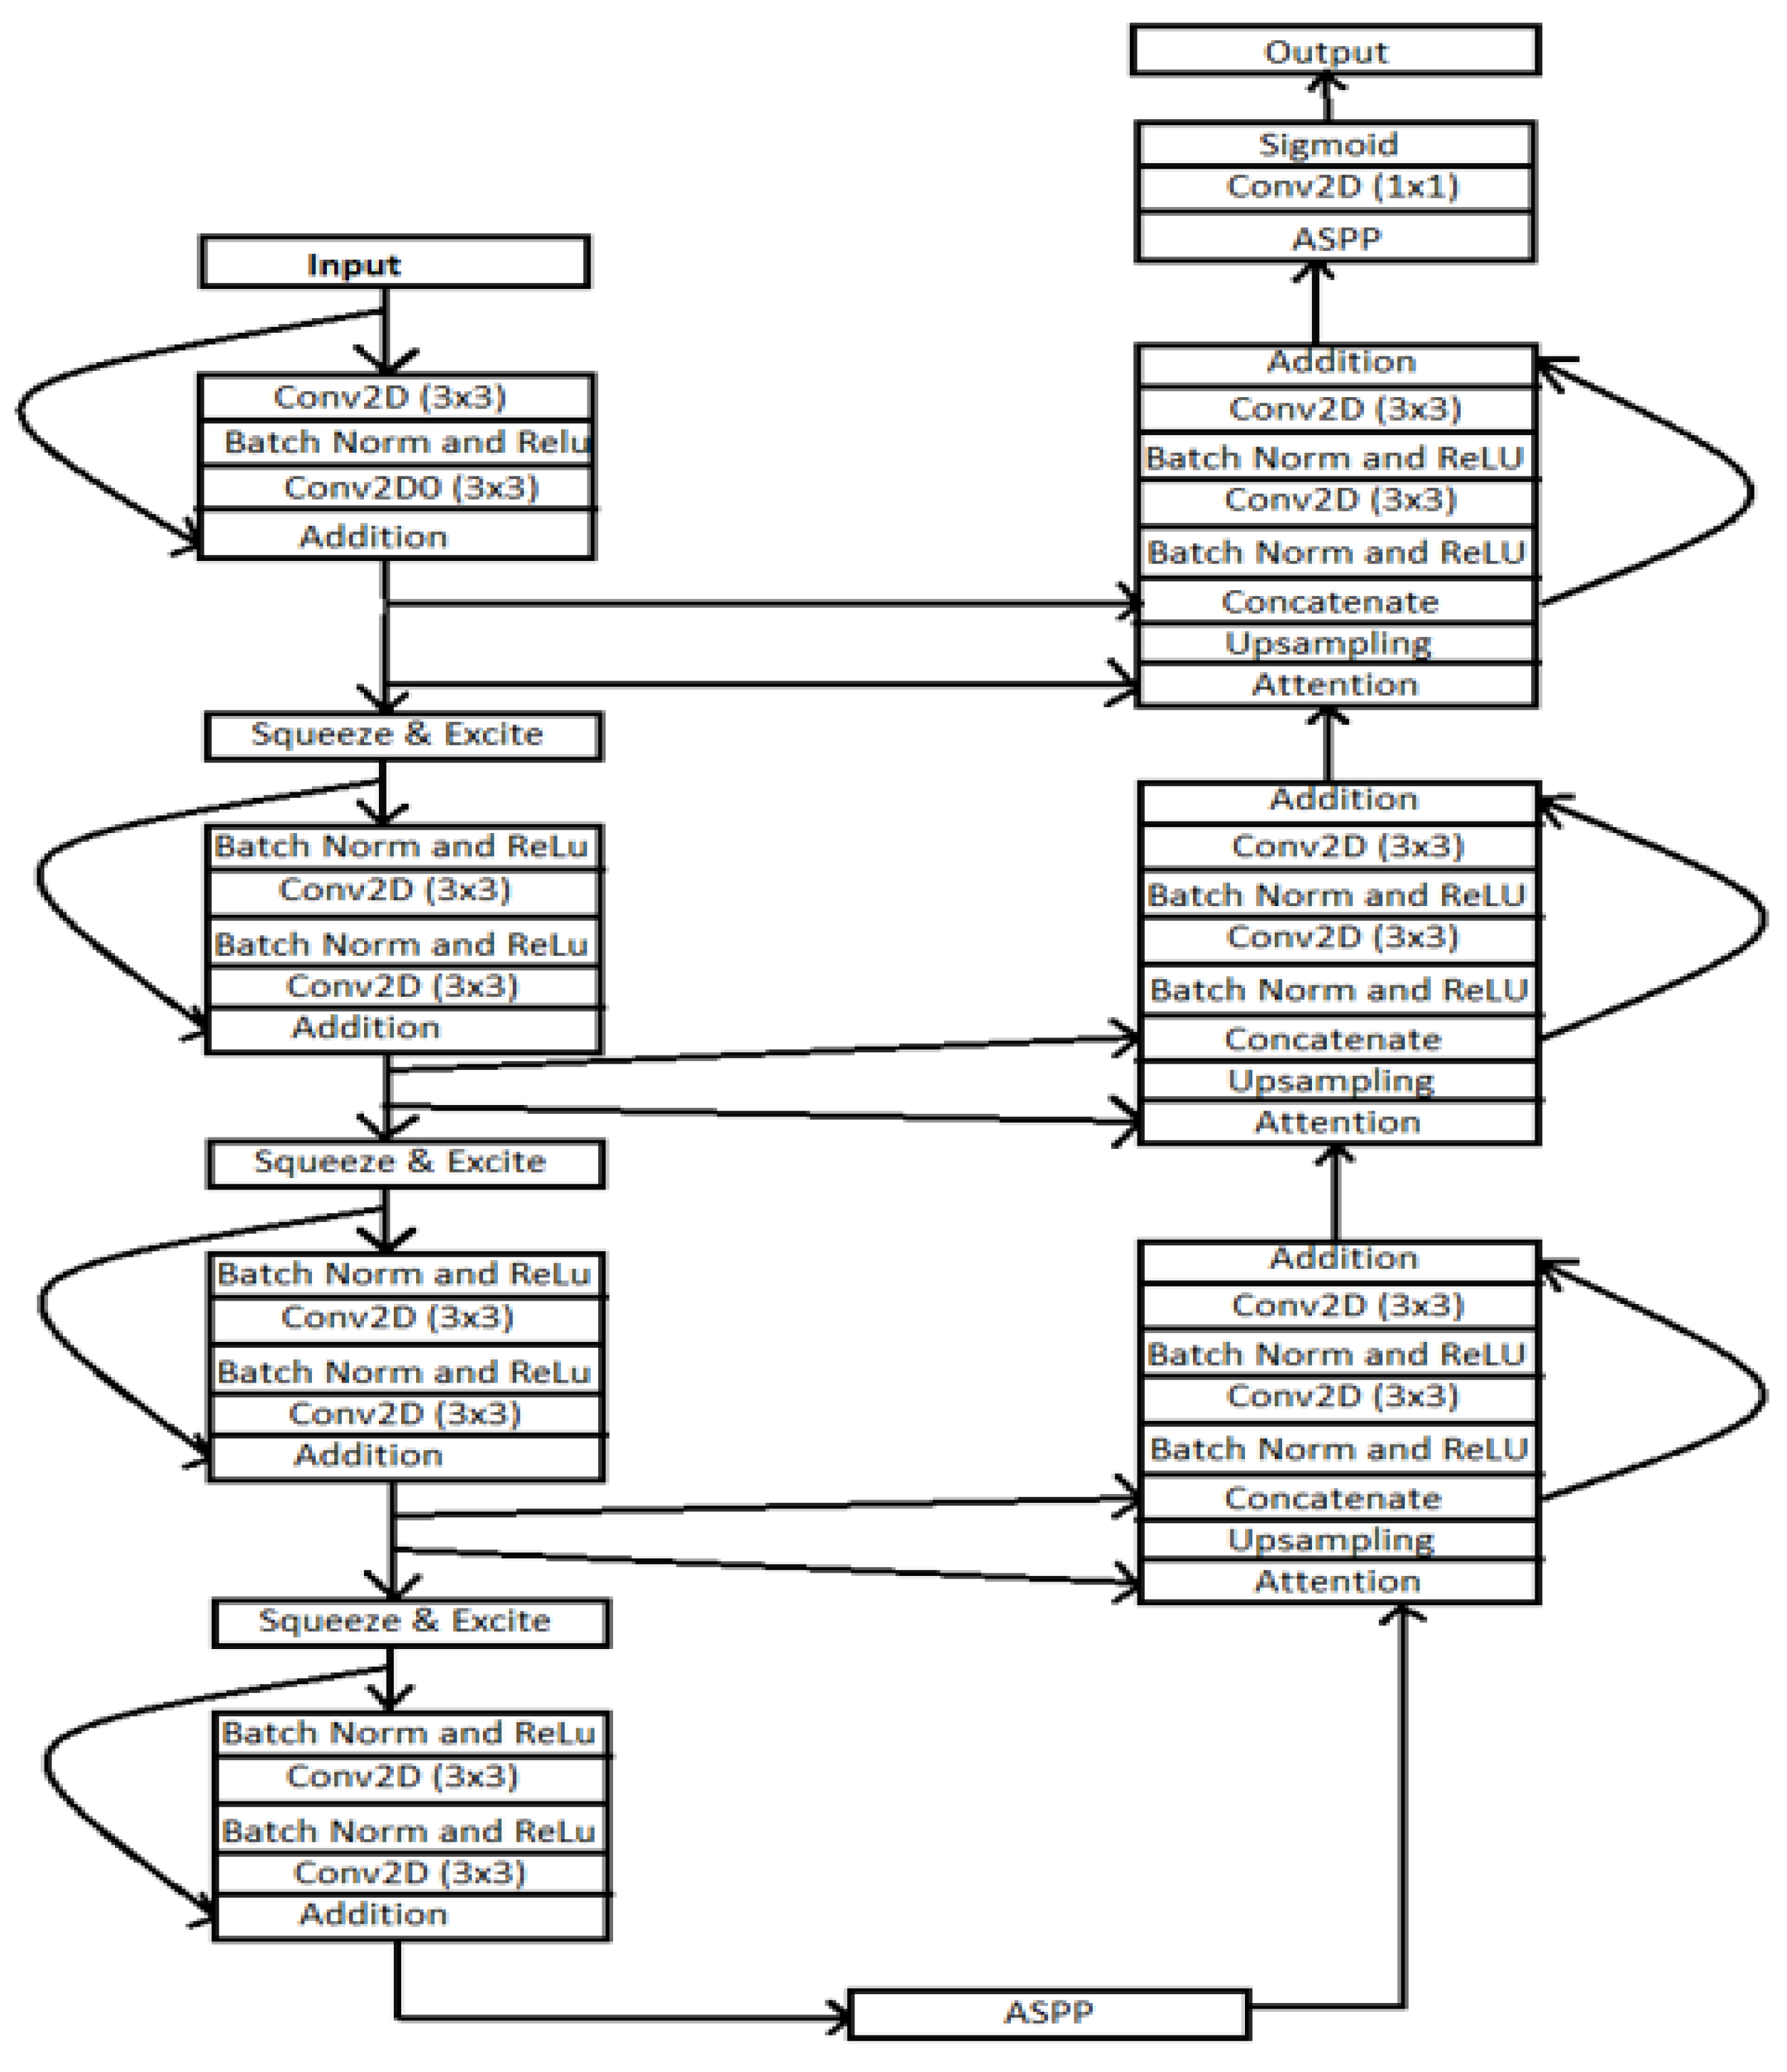
2.3.5. ResUNet++
In ResUNet++, residual networks are used to benefit the architecture [
4,
20,
21,
22] and the UNet architecture [
3]. As shown in
Figure 8 architecture consists of the residual network, excitation block, ASPP block, attention block, squeeze block, and excitation block. The architecture combines the ReLU activation function, convolutional layer, and batch normalization layer.
In the architecture, there are two main parts: UNet is the contracting path, and the second is the expanding path, which helps recover the original resolution similar to [
22]. The encoder part consists of two 3 × 3 convolutional layers in this architecture. Each Conv layer includes the batch normalization layer and ReLU activation function. The output of the encoder block passed through the squeeze-and-excitation block. The ASPP functions as a link, allowing the filter’s field of vision to be expanded to cover a larger environment.
Similarly, residual units are present in the decoding route. The attention block, which comes before each unit, boosts the efficiency of feature maps. Following that, the feature maps from the lower level are the nearest neighbor upsampled, and the feature maps from their associated encoding route are concatenated. Here we discussed each layer of the ResUNet++ architecture.
Residual block: [
23] showed consistent improvement using the residual block rather than the traditional CNN architecture. The network can learn residuals with a variable adequate number of processing steps before adding them back into the residual stream with this architecture. The deep residual unit makes the profound network simple to train. The skip connection within the networks aids in information propagation without degradation, enhancing the design of the neural network by lowering the parameters while continuing to improve the performance on the semantic segmentation task. Here we have used ResUNet as our backbone architecture because of these advantages [
2,
20].
Atrous spatial pyramidal pooling (ASPP): in [
20,
24,
25], the contextual information is gathered at several scales in ASPP, and the input feature map is fused using many parallel atrous convolutions with varied rates. The ASPP layer acts as a bridge between the encoder and decoder blocks in this architecture
The ASPP layer captures the information at various scales. Controlling the field of view via atrous convolution enables the precise capture of multiscale details. In our suggested design, ASPP serves as a link between the encoder and decoder. The ASPP layer gave promising results on various segmentation methods. Therefore, the authors proposed the ASPP layer in this architecture.
Squeeze and excitation layer: after each residual block, we have employed the squeeze and excitation layer in the encoding component of the design. The authors in [
26] developed the squeeze and excitation layer to increase the quality of representations produced by a network by explicitly modeling the interdependencies between the channels of its convolutional features.
The equation for the squeeze layer is
Zc = Fsq(uc) = [
26]; the authors proposed the squeeze of global spatial information into a channel descriptor. This is achieved by using global average pooling to generate channel-wise statistics.
The equation for the excitation layer is
s = Fex(z,W) = . Here, δ denotes the ReLU activation function [
27]. The authors [
23] proposed the above equation to aggregate the information from the squeeze layer. They followed it with Equation to fully capture the channel-wise dependencies.
3. Result and Analysis
This research paper compared three architectures: ResUNet++ with UNet and ResUNet, as all three architectures are preferred for semantic segmentation tasks. We have tried different sets of hyperparameters (i.e., learning rate, number of epochs, optimizer, batch size, and filter size) to optimize UNet, ResUNet, and ResUNet++ architectures.
From the above results, we can say that the loss in the ResUNet++ architecture is minimum compared with those in the ResUNet and UNet architectures, and the ResUNet++ architecture has a higher dice coefficient than those of the other two architectures. This section compares the performance of the models employed in this study. We trained three segmentation models on the Shenzhen and Montgomery datasets and obtained the following results: loss, precision, sensitivity, specificity, recall, precision, mean_iou, and dice coefficient.
Table 1,
Table 2,
Table 3,
Table 4 and
Table 5 display the ResUNet++, ResUNet, UNet, SegNet and FCN findings. The suggested model has the most excellent dice coefficient, mean_iou, recall, and competitive accuracy for the dataset, as shown in
Table 1,
Table 2,
Table 3,
Table 4 and
Table 5. The maximum sensitivity, specificity, and recall are reached.
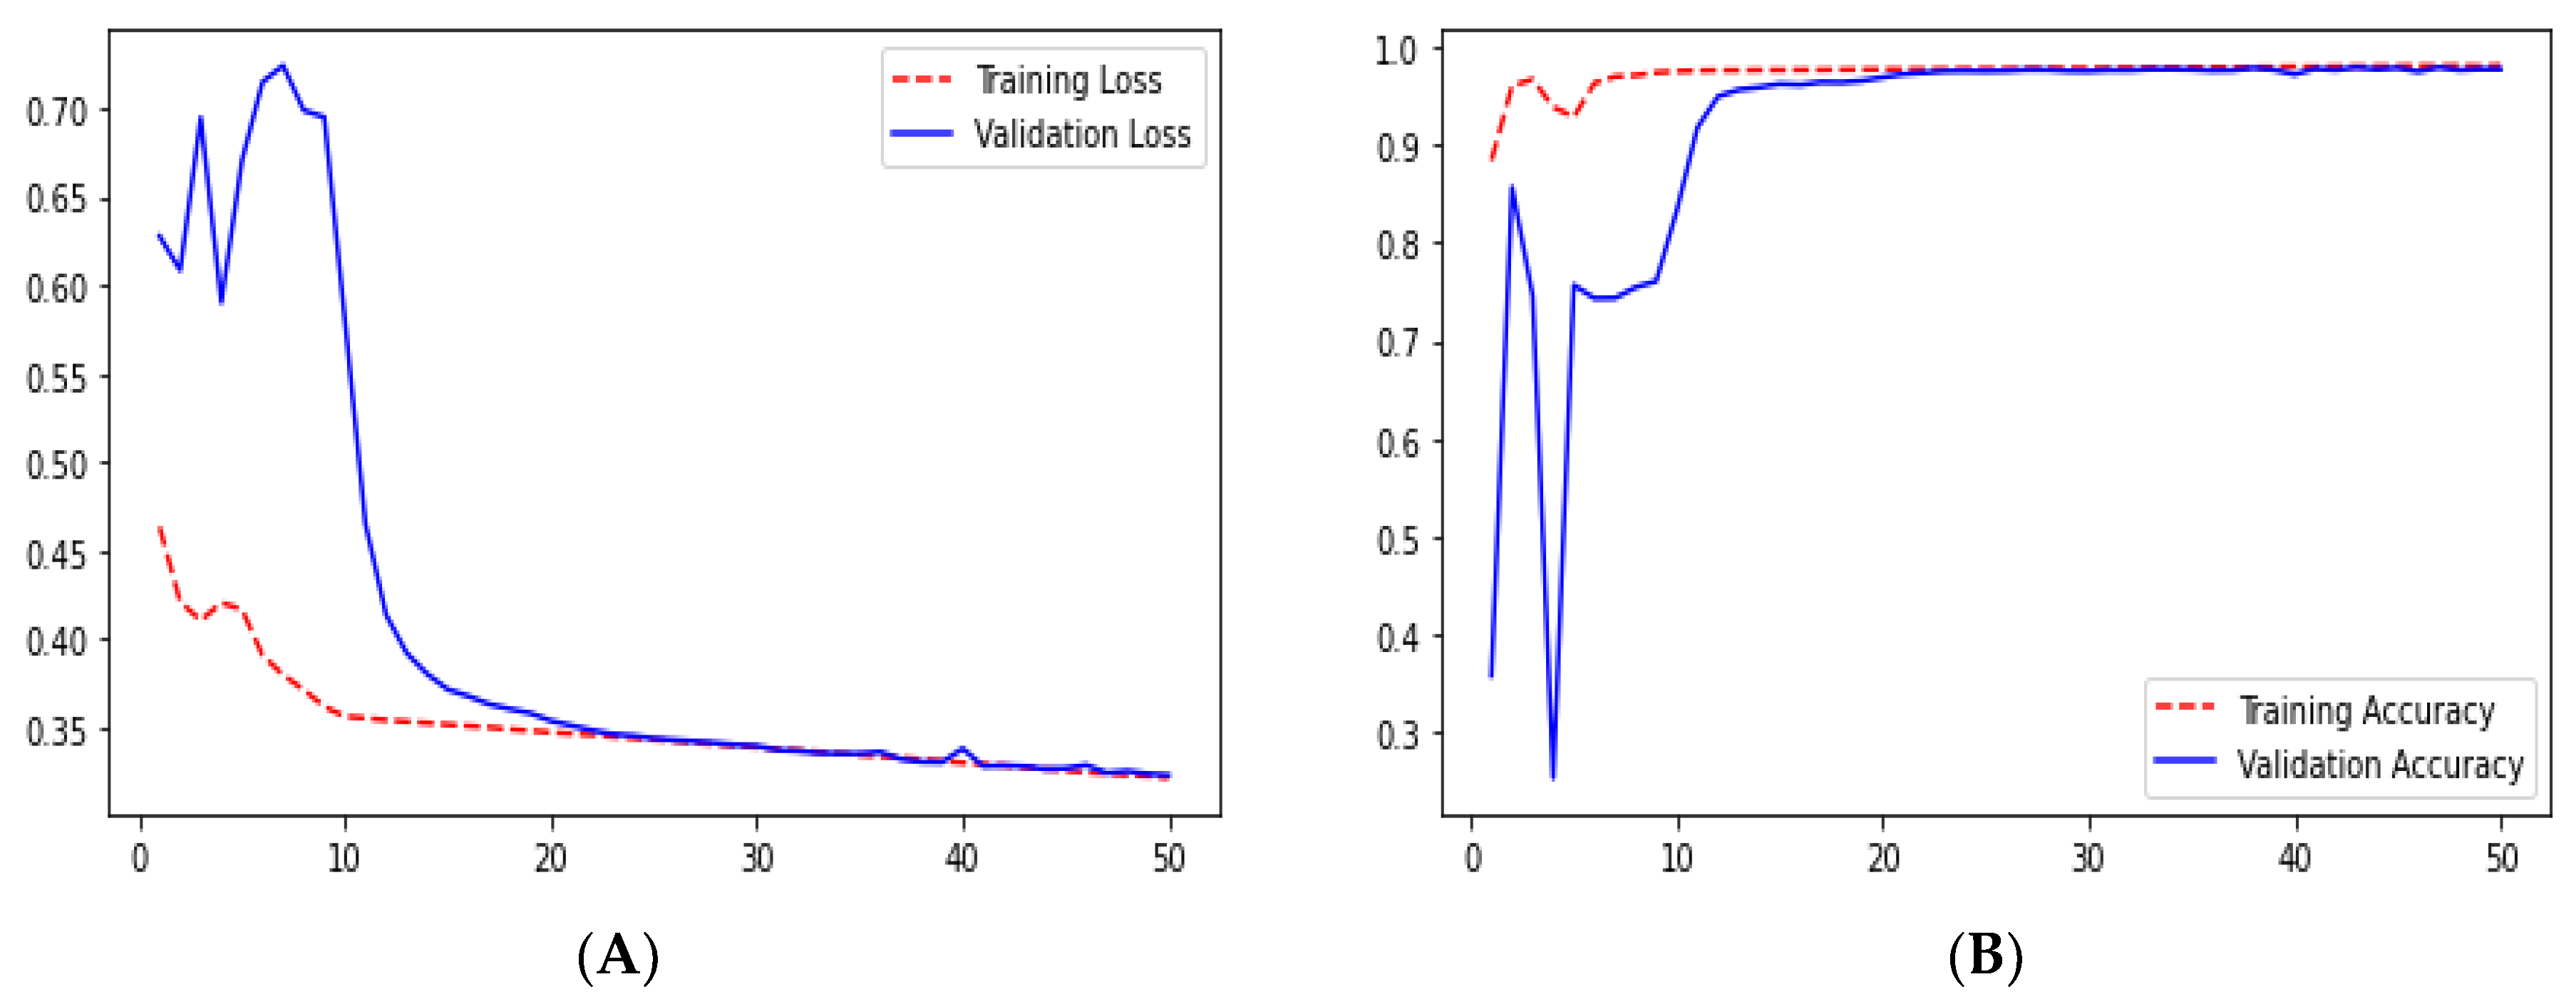
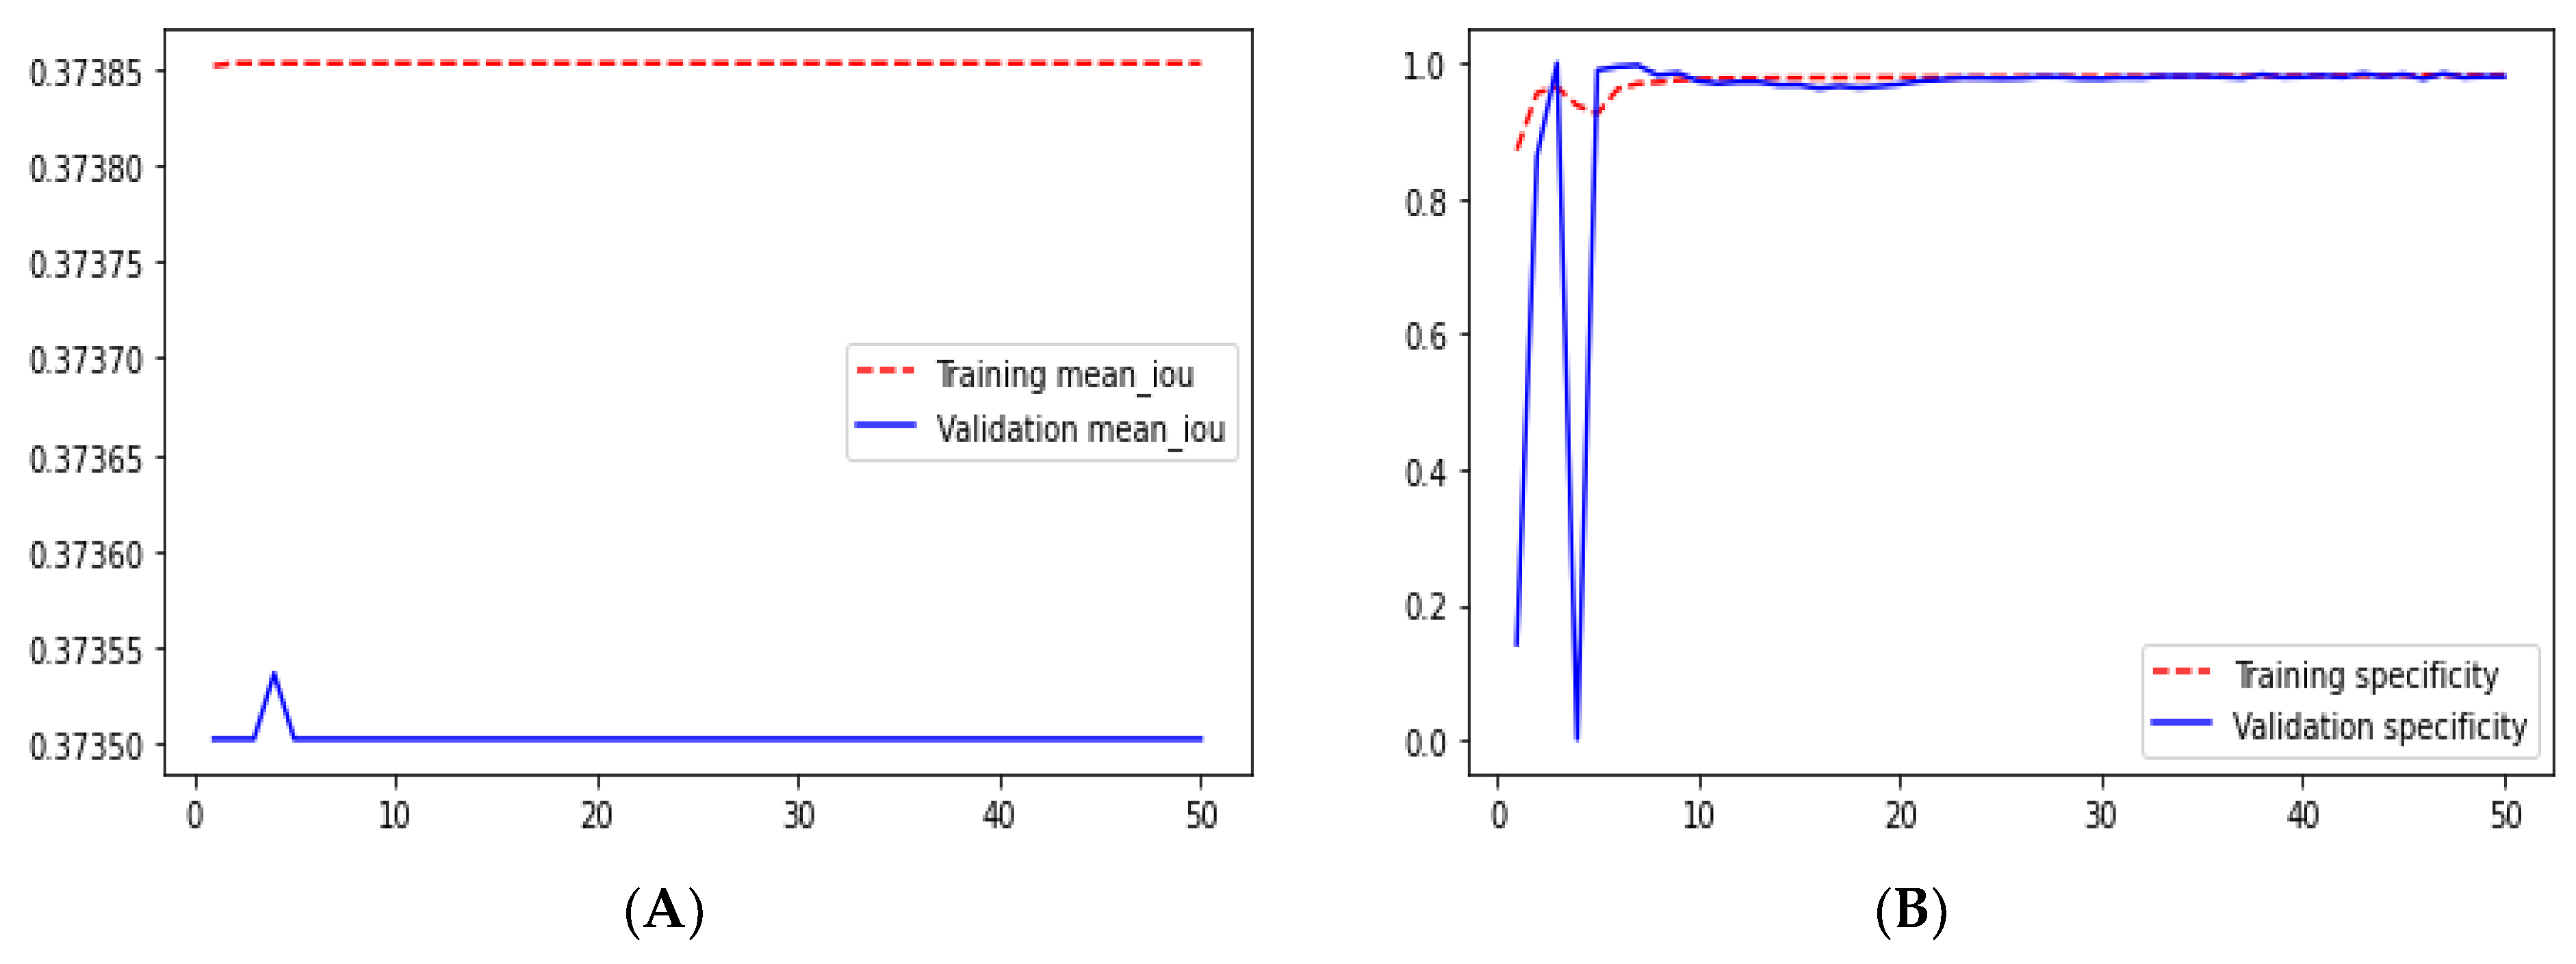
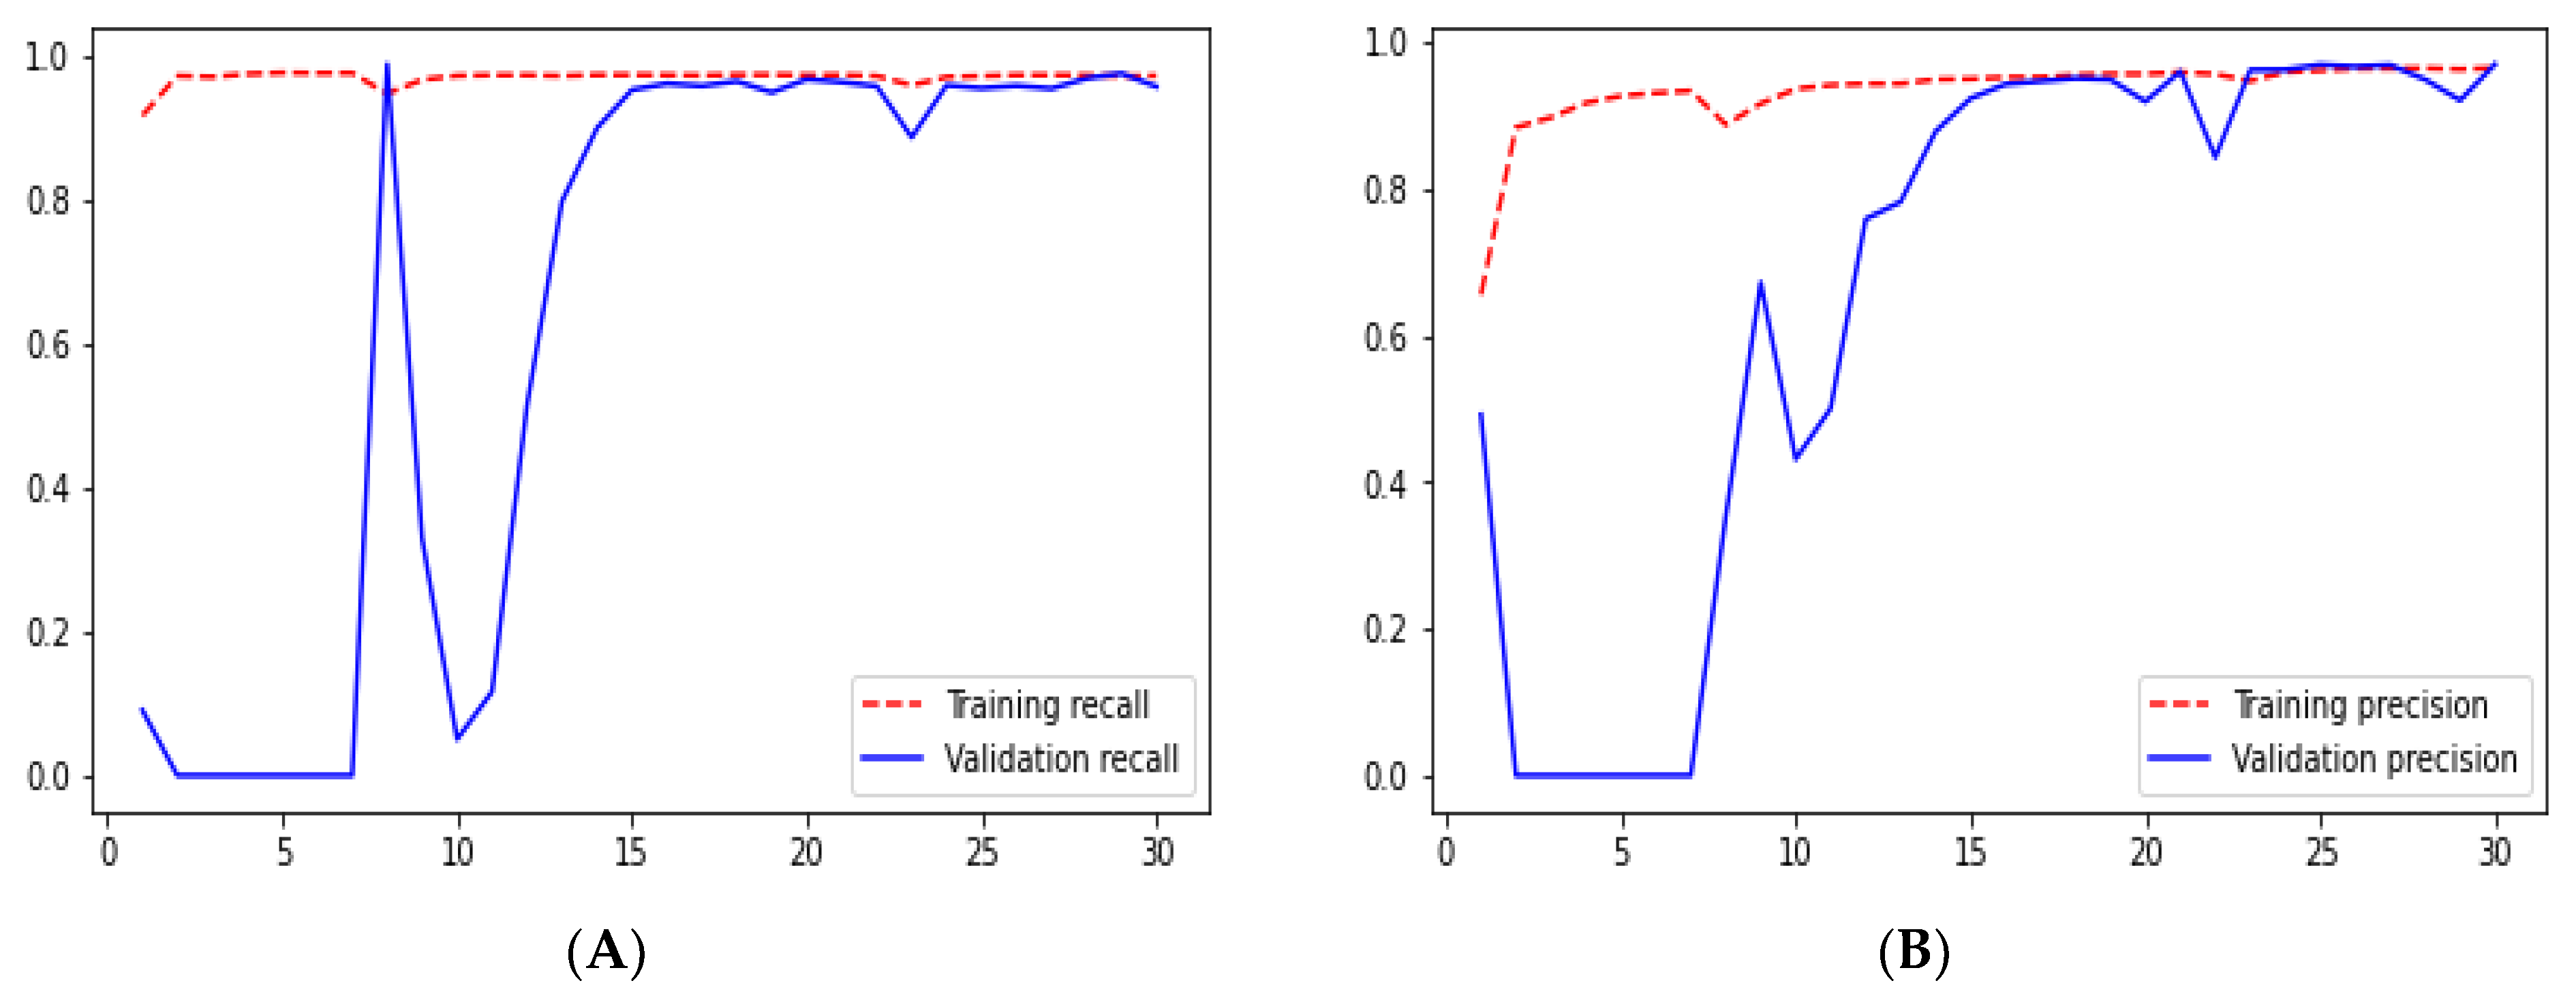
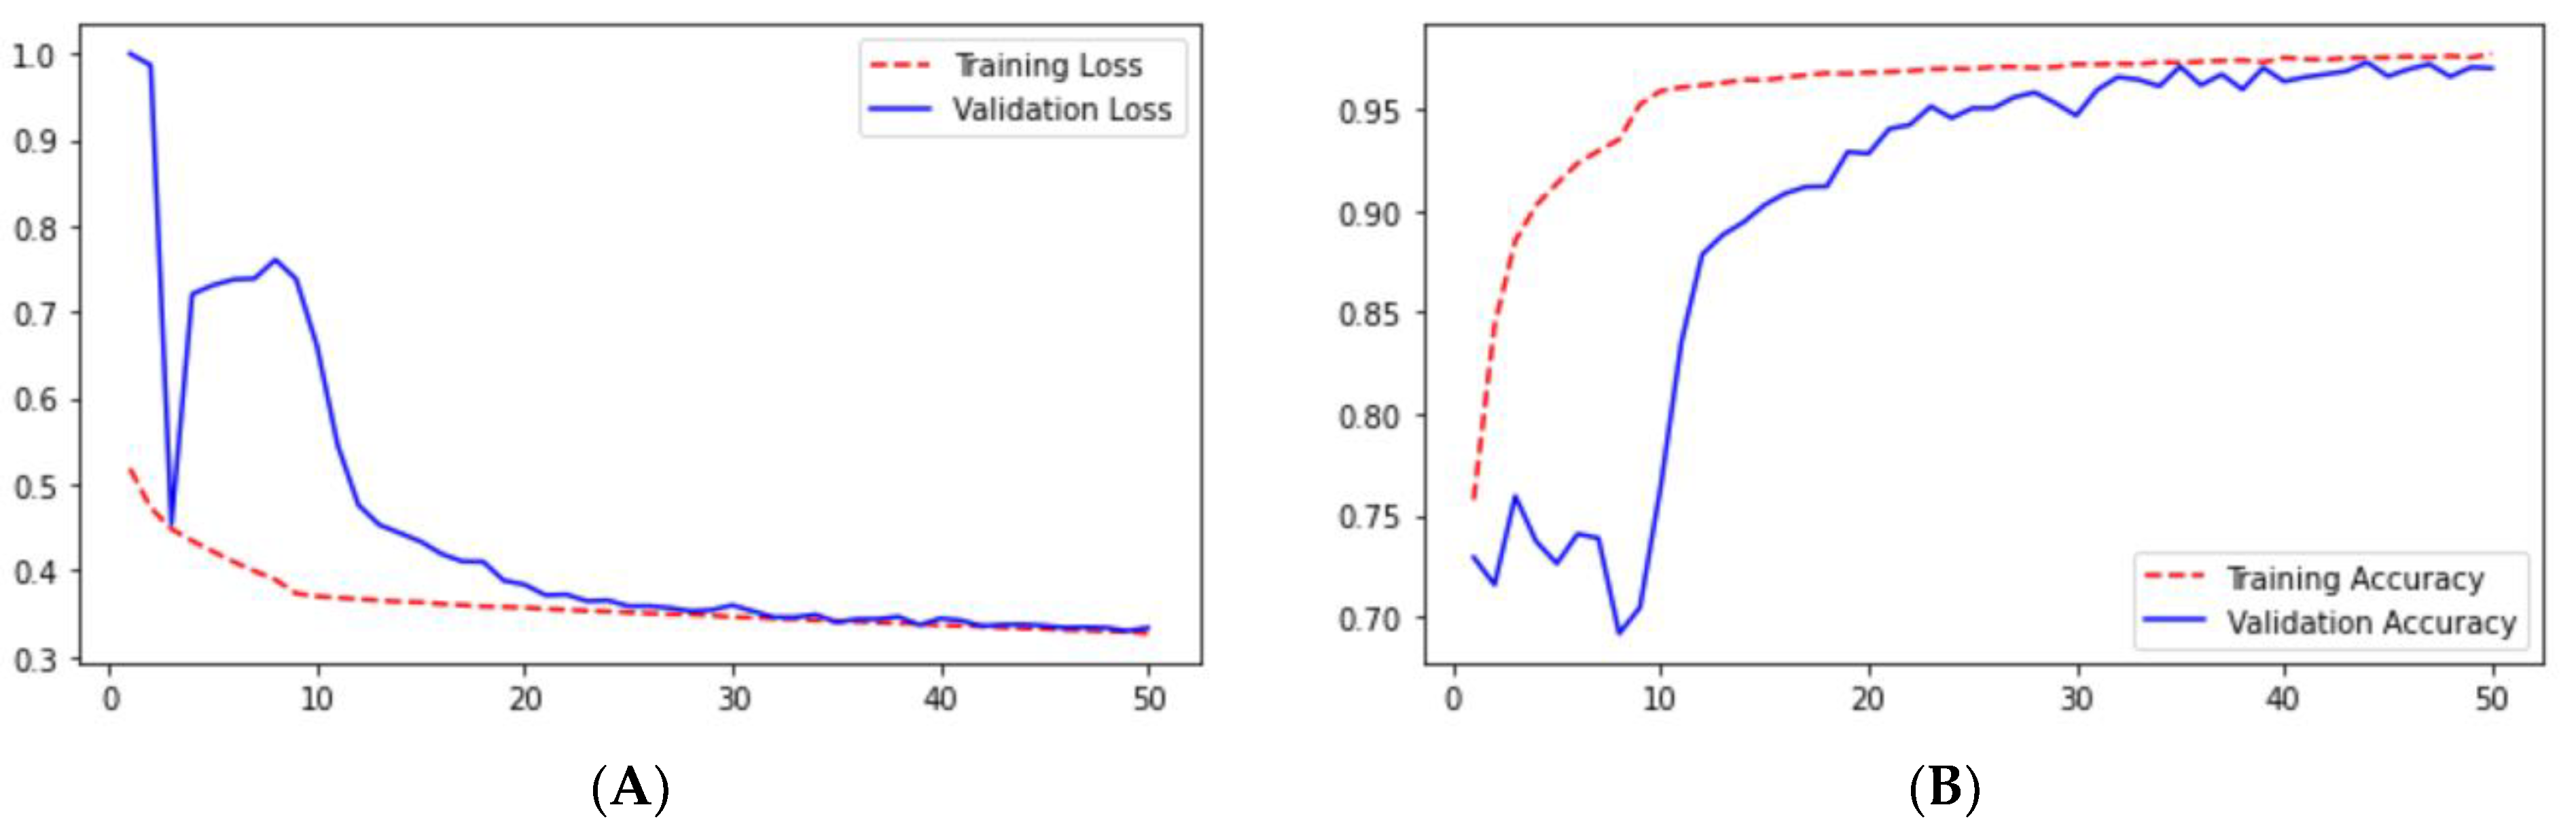
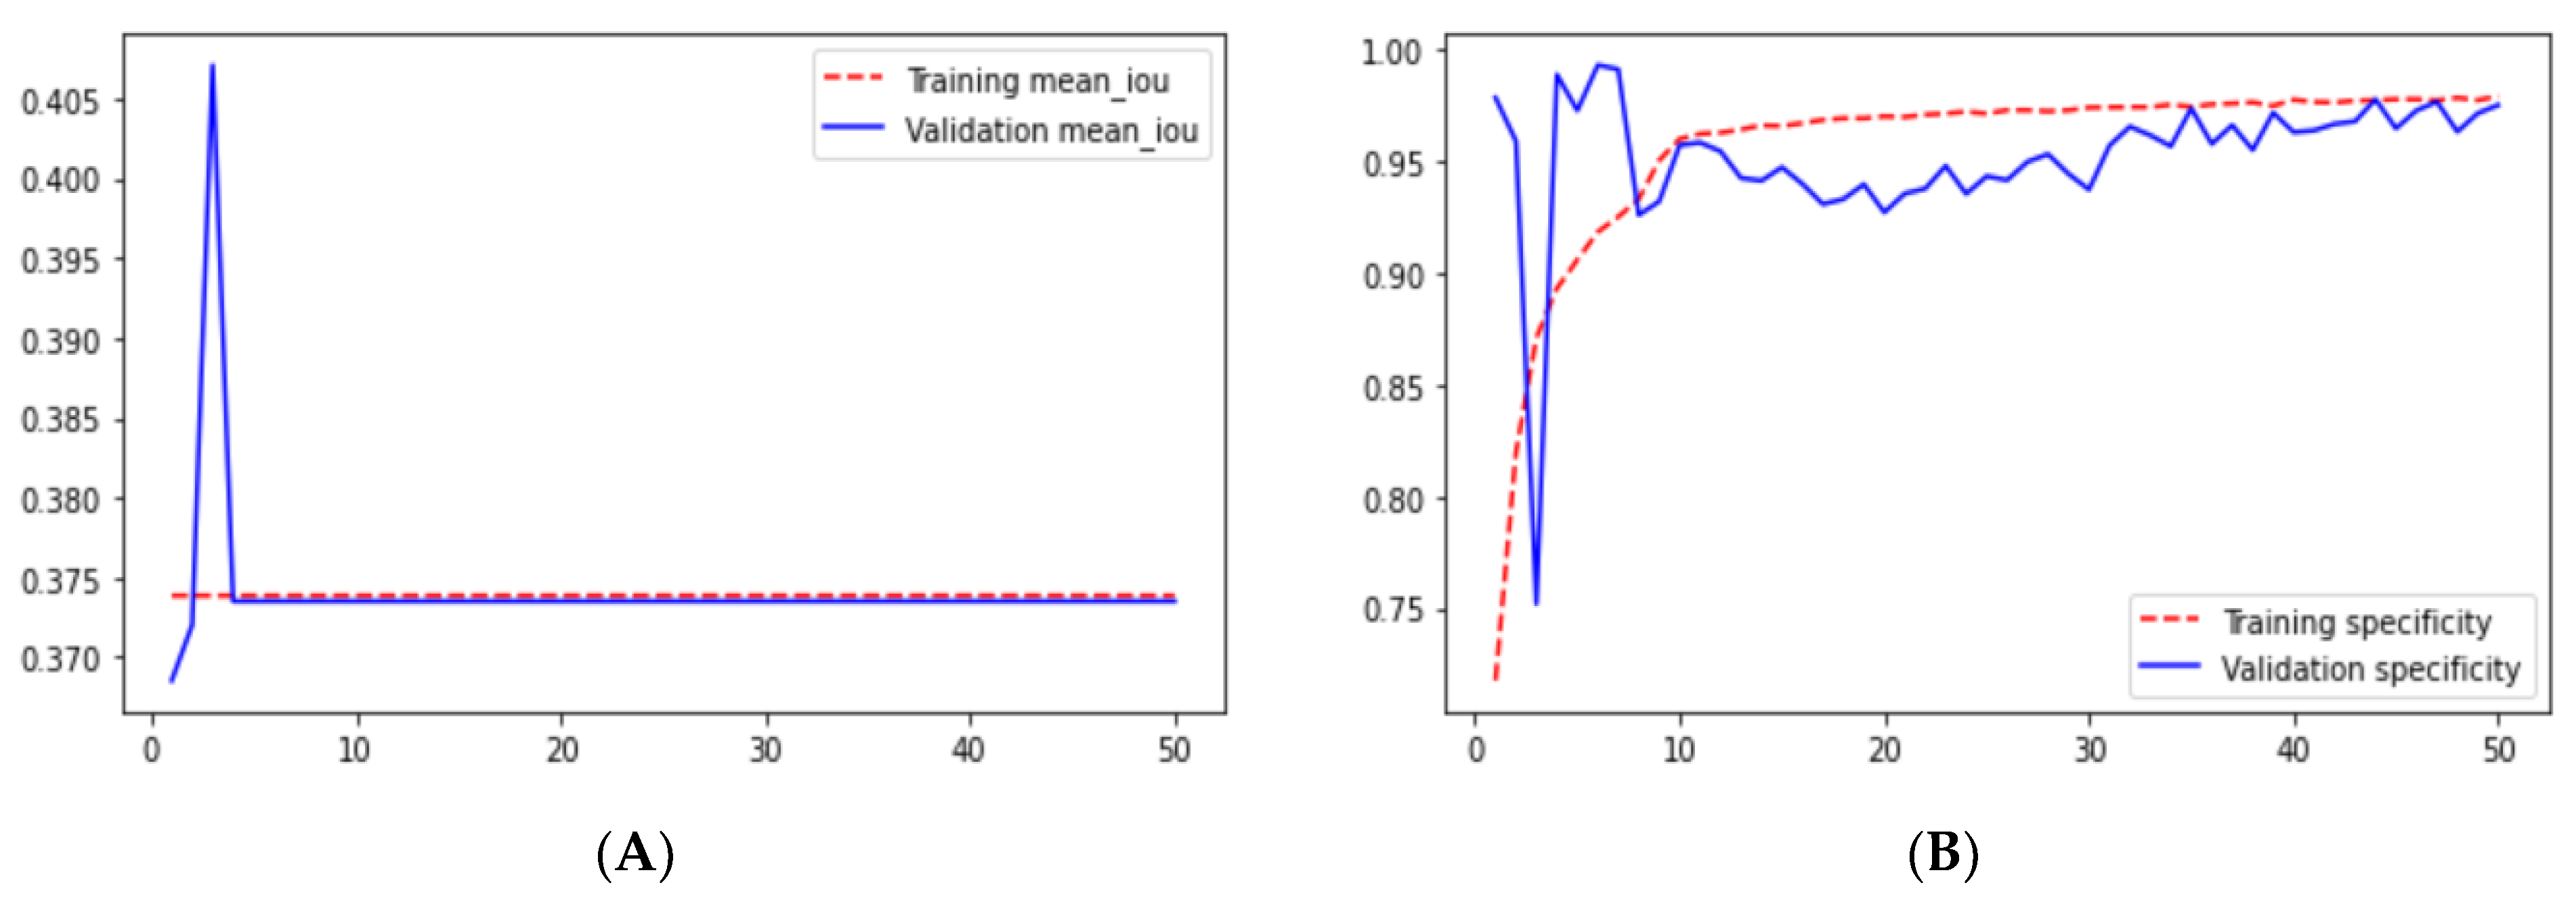
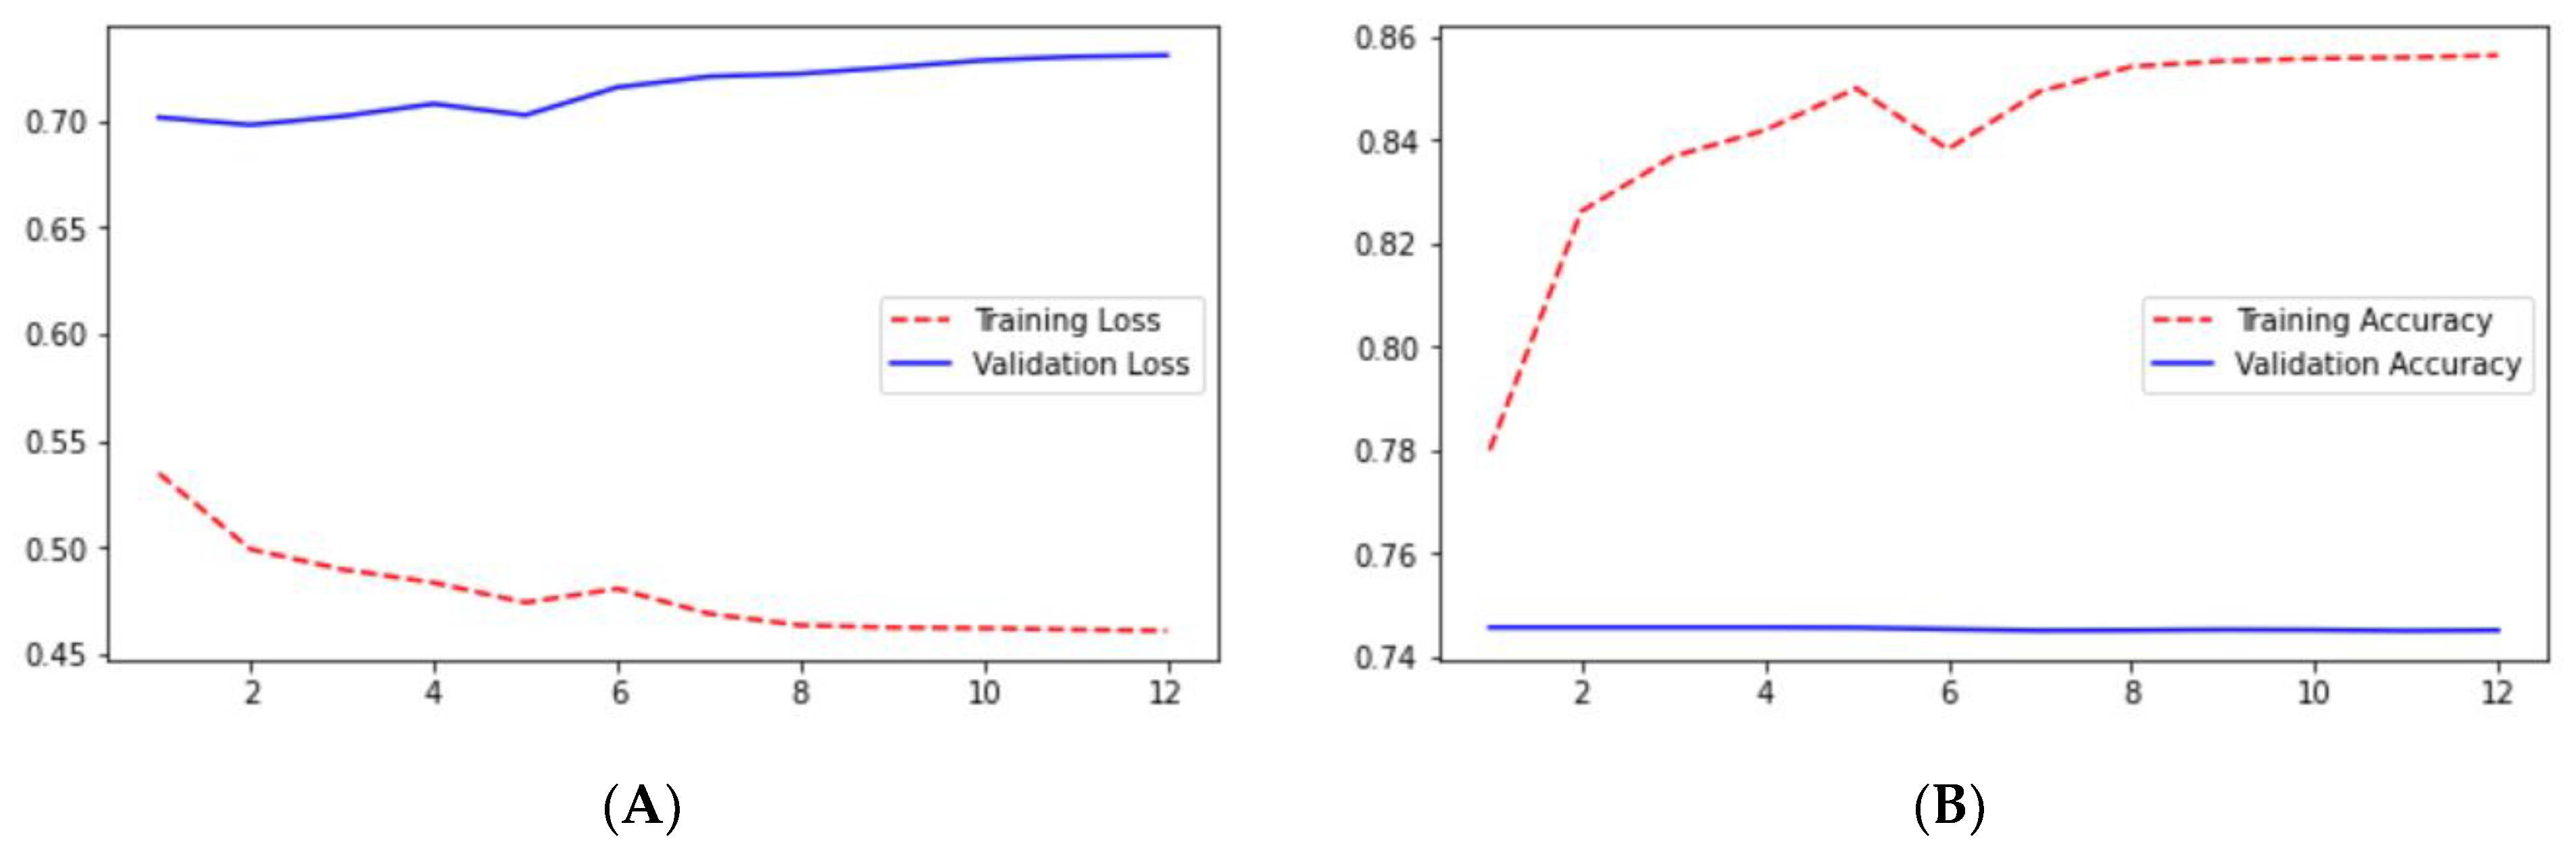
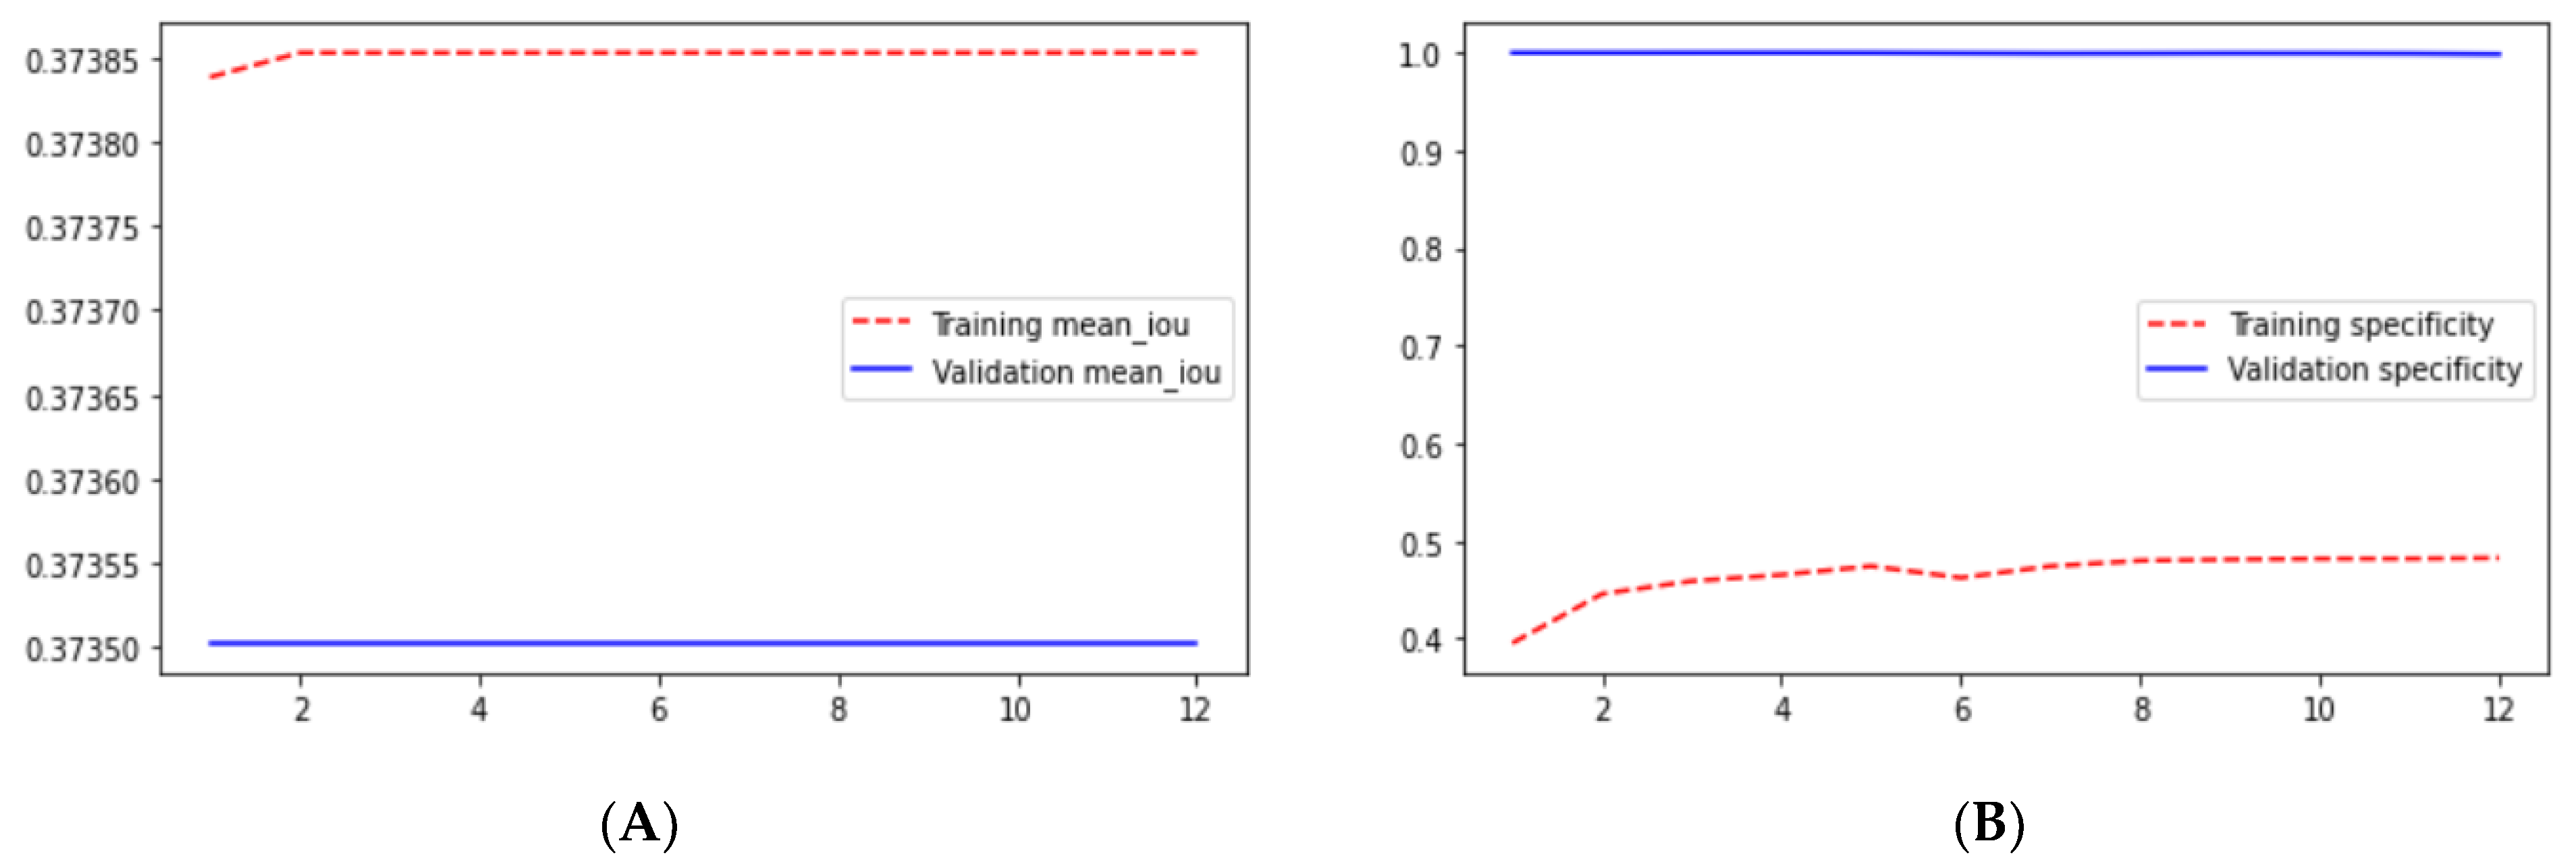
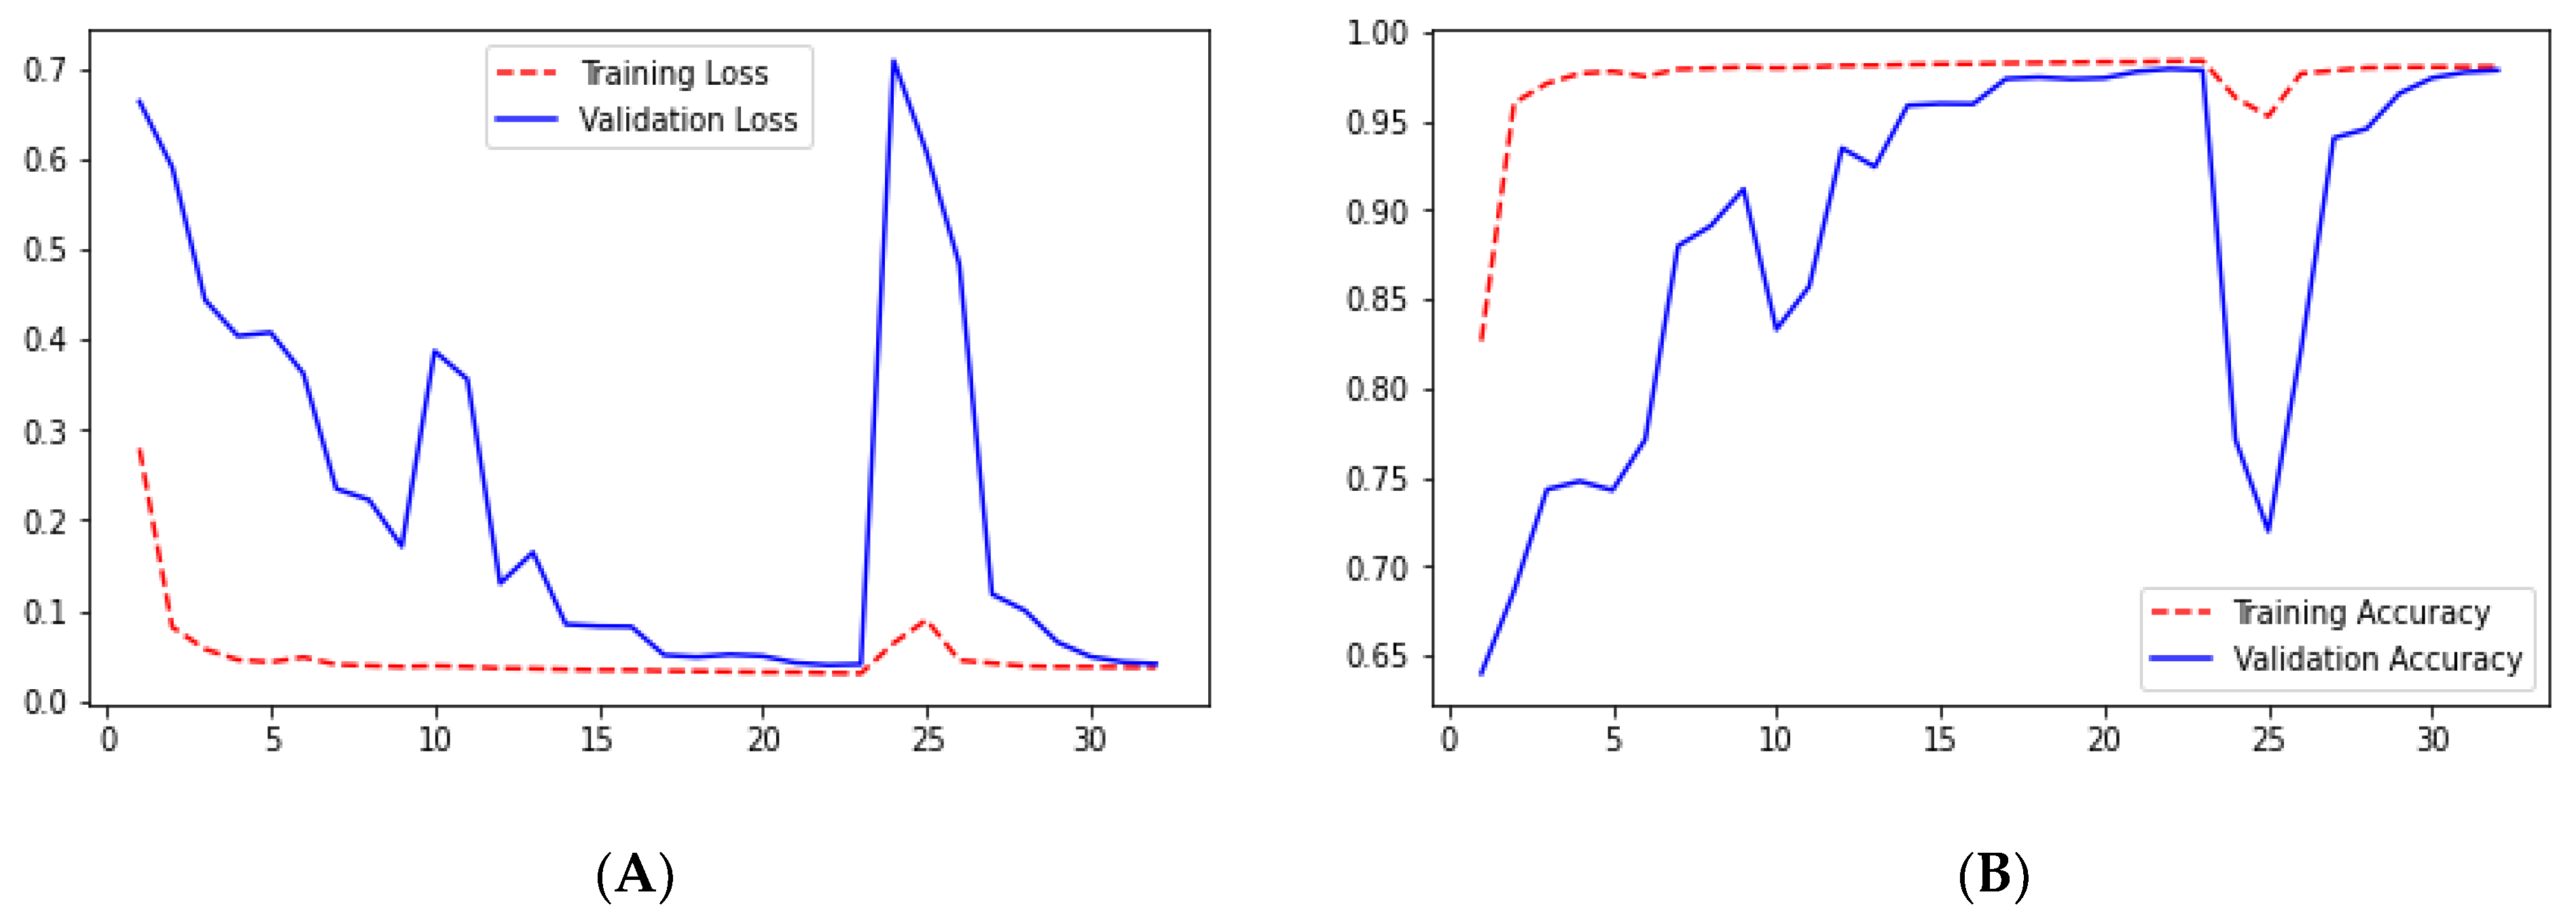
Loss adequately predicts how well the model performs and forecasts the model error. As you can see in the picture, loss decreases and accuracy increases per epoch. Looking at the mean_iou, we can see that it is constant through the epochs for the UNet and ResNet models but increases in the ResUNet++ model; it is also higher in the ResUNet++ model than in the other two models.
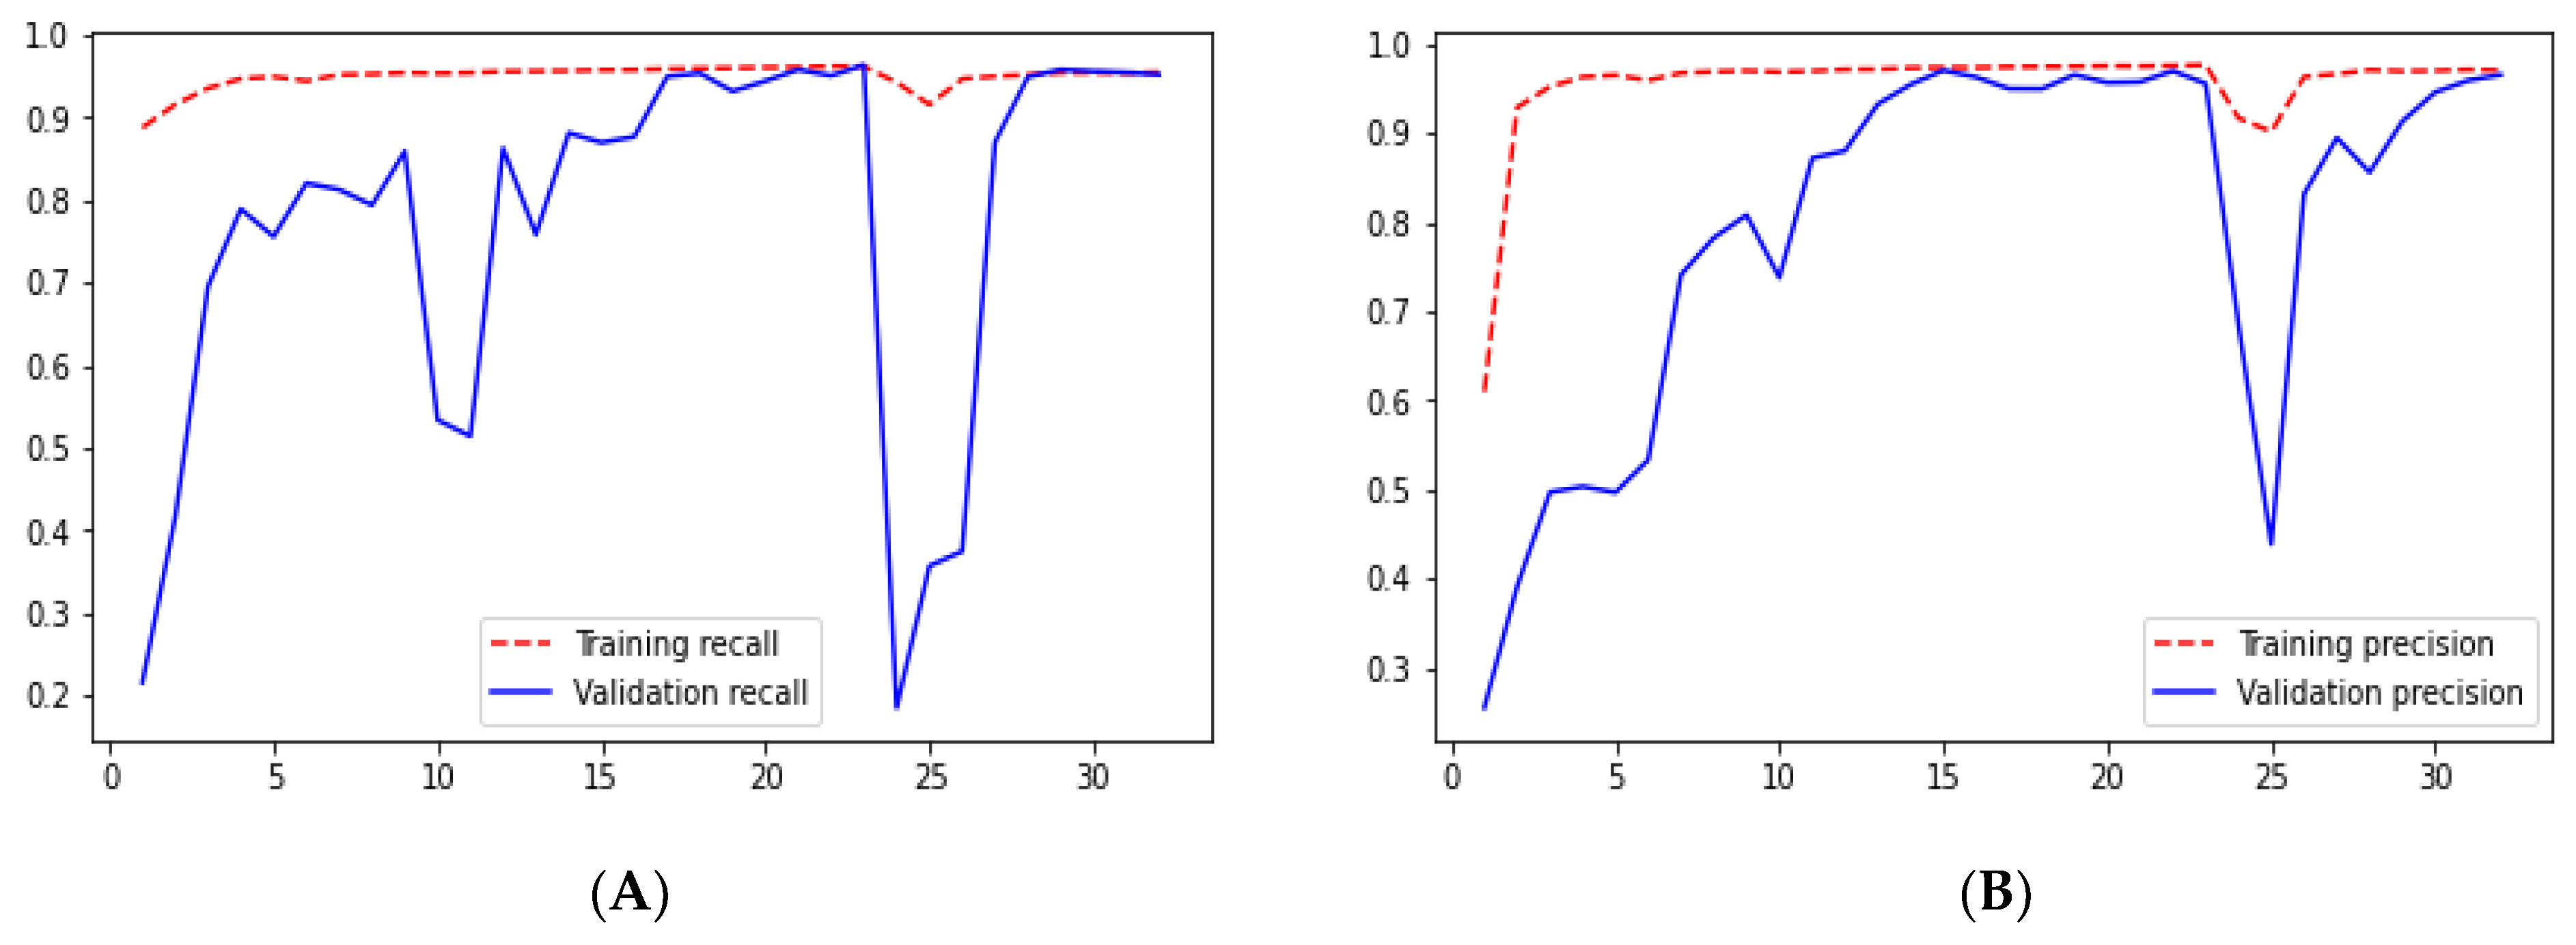
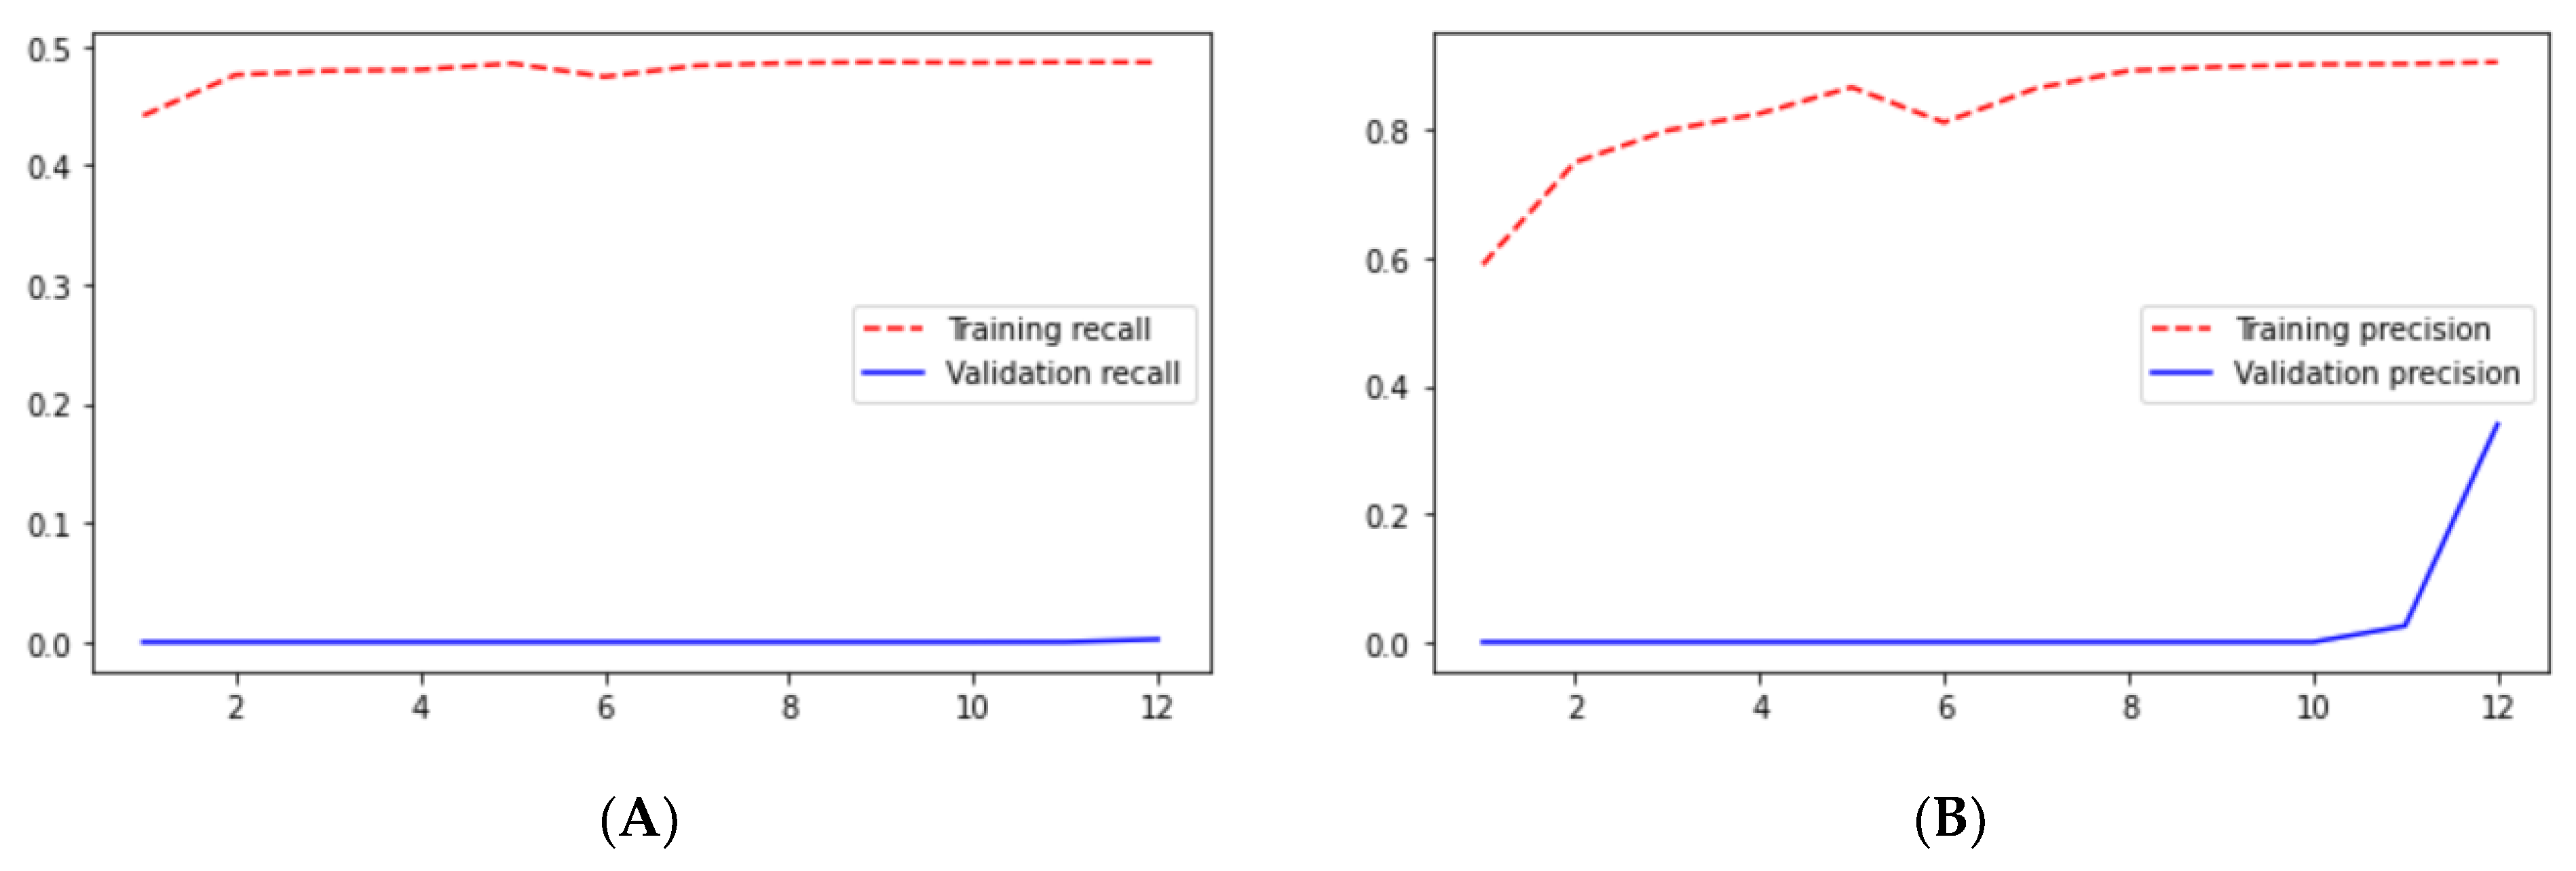
From
Figure 9,
Figure 10,
Figure 11,
Figure 12,
Figure 13,
Figure 14,
Figure 15,
Figure 16,
Figure 17,
Figure 18,
Figure 19,
Figure 20,
Figure 21,
Figure 22 and
Figure 23 we can see the comparative graphs of models results on training data and validation data of various matrics like Accuracy, Loss, Precision, Recall, mean_iou and specificity.
4. Discussion
We used a variety of loss functions to train the model, including binary loss and dice loss. The ResUNet++ model was shown to have a higher dice coefficient value. With all other loss functions except the dice coefficient loss function, mean_iou was much lower. Based on our empirical research, we chose the dice coefficient loss function. We also discovered that the number of filters, batch size, optimizer, and loss function all impacted the outcome.
The test dataset is used to assess the overall performance after using the training dataset and modifying the hyperparameters to improve the performance on the validation set. According to the results listed in the tables above, they range from 1 to 5.
Ground truth is measured by sensitivity. We can see from
Table 1 that the sensitivity and accuracy from
Figure 9B are almost similar for the validation dataset. UNet gave good accuracy compared with FCN and SegNet.
In UNet, loss is decreasing and accuracy is increasing per epoch on the validation dataset. This can be seen from
Figure 9A,B. It shows that UNet is doing a good job for image segmentation.
We can say that the ResUNet architecture performed well compared with the UNet architecture. In the ResUNet architecture, sensitivity, recall, and precision matrix are slightly higher than those in the UNet architecture. However, we can see that the loss and accuracy from
Figure 11A,B for ResUNet for starting a few epoch validation metrics are unstable, but as the epoch increases, the stability increases.
When comparing SegNet and the FCN based only on the results, it was shown that SegNet performed better than the FCN, but if we compared them with the remaining architectures, both poorly performed. If we see the results of the FCN, the loss is 0.7308 for the validation dataset, which is very poor and we cannot consider it for medical image segmentation.
Checking the results of ResUNet++ for the validation dataset, we can see that it gave good results for each metric. The validation loss for this architecture is 0.0412, which is the smallest among the architectures we studied. Moreover, it also gave the highest accuracy as we can see from
Figure 20B. Sensitivity and recall are almost the same for the validation dataset, 0.9545 and 0.9524, respectively, which are less than those in the UNet architecture.
5. Conclusions
Segmentation divides the image into multiple sets of pixels and focuses on the essential features of images. It helps doctors to concentrate on the infected region of the body part. Using the segmentation algorithm in the image classification will increase the accuracy of the model, and it will try to focus on the specific region. Existing literature survey papers implemented various image segmentation algorithms for biomedical images, tree segmentation, and many more. However, as per our knowledge, no one implemented the ResUNet++ architecture on lung segmentation. Residual units, squeeze and excitation units, ASPP, and attention units are all used in the proposed design. From three architecture designs, the ResUNet++ design outperforms the state-of-the-art UNet and ResUNet architectures in terms of delivering semantically correct predictions, according to the comparative study of various metrics.
According to a comprehensive assessment utilizing various datasets, the ResUNet++ design outperforms the state-of-the-art UNet and ResUNet architectures in delivering semantically correct predictions. The proposed method for accomplishing the generalizability aim architecture might serve as a good starting point for additional research. Toward developing a therapeutically effective technique, our model might benefit from postprocessing approaches to improve segmentation results even further.
6. Future Scope
We believe that the model’s performance may be enhanced further by expanding the dataset size and adding enhancement approaches and some postprocessing stages. We believe that ResUNet++’s applicability should not be confined to biomedical image segmentation but should be extended to natural picture segmentation and other pixel-wise classification tasks that require more comprehensive validations. Based on our expertise and experience, we have optimized the code as much as feasible. However, more optimizations may be possible, which might affect the designs’ outcomes. We only ran the code on a Tesla K80 system, and the photos were shrunk, which may have resulted in some information being lost. Furthermore, ResUNet++ employs more parameters, lengthening the training process.


