
Research on a Vehicle Recognition Method Based on Radar and Camera Information Fusion

Abstract
:1. Introduction
2. Radar and Camera Information Fusion
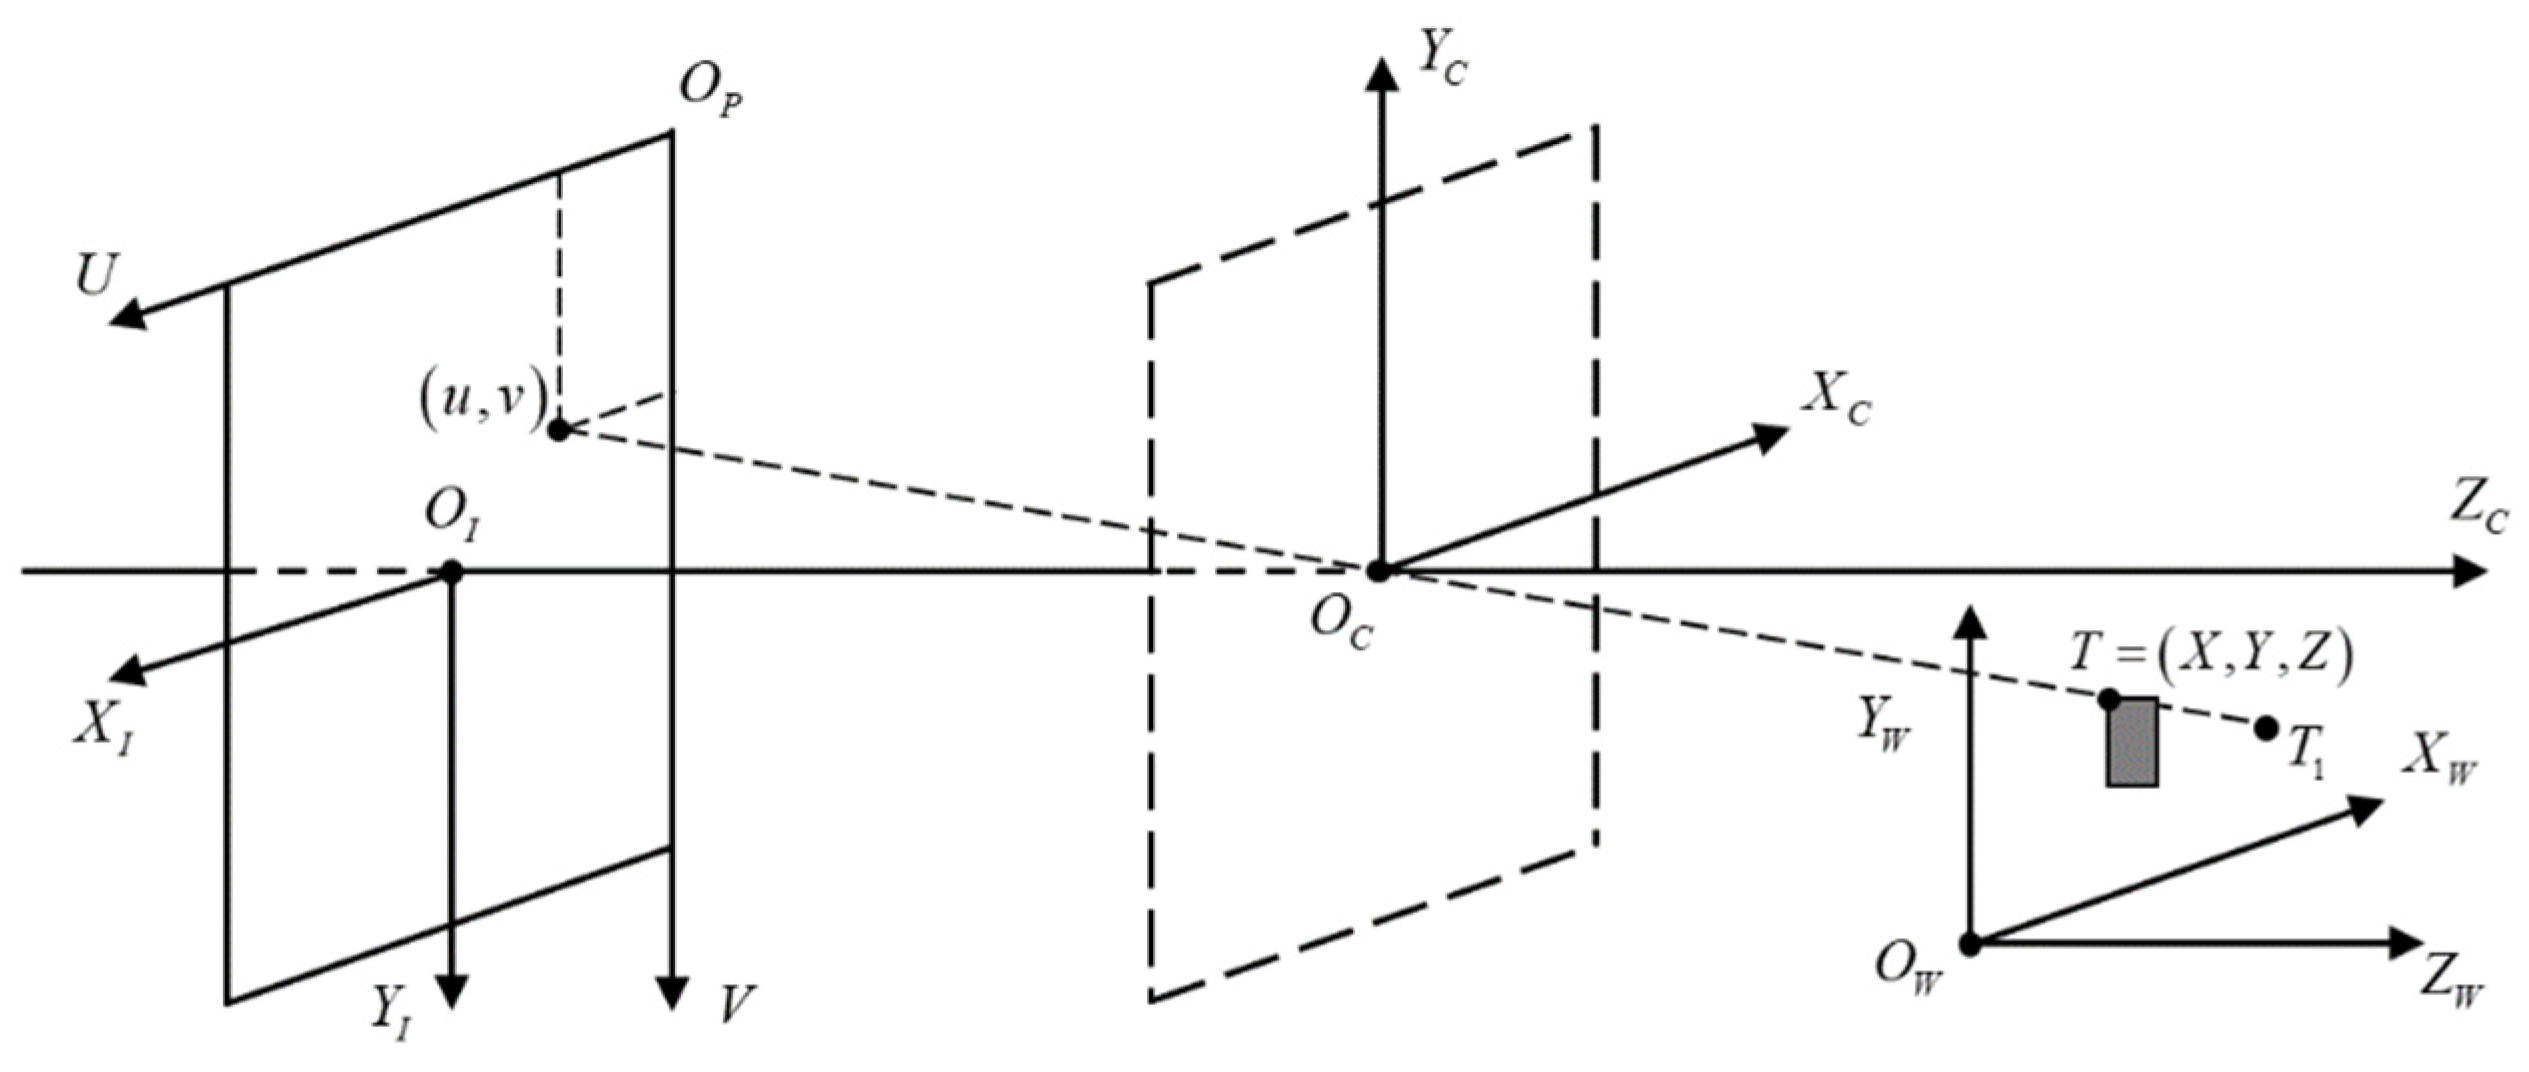
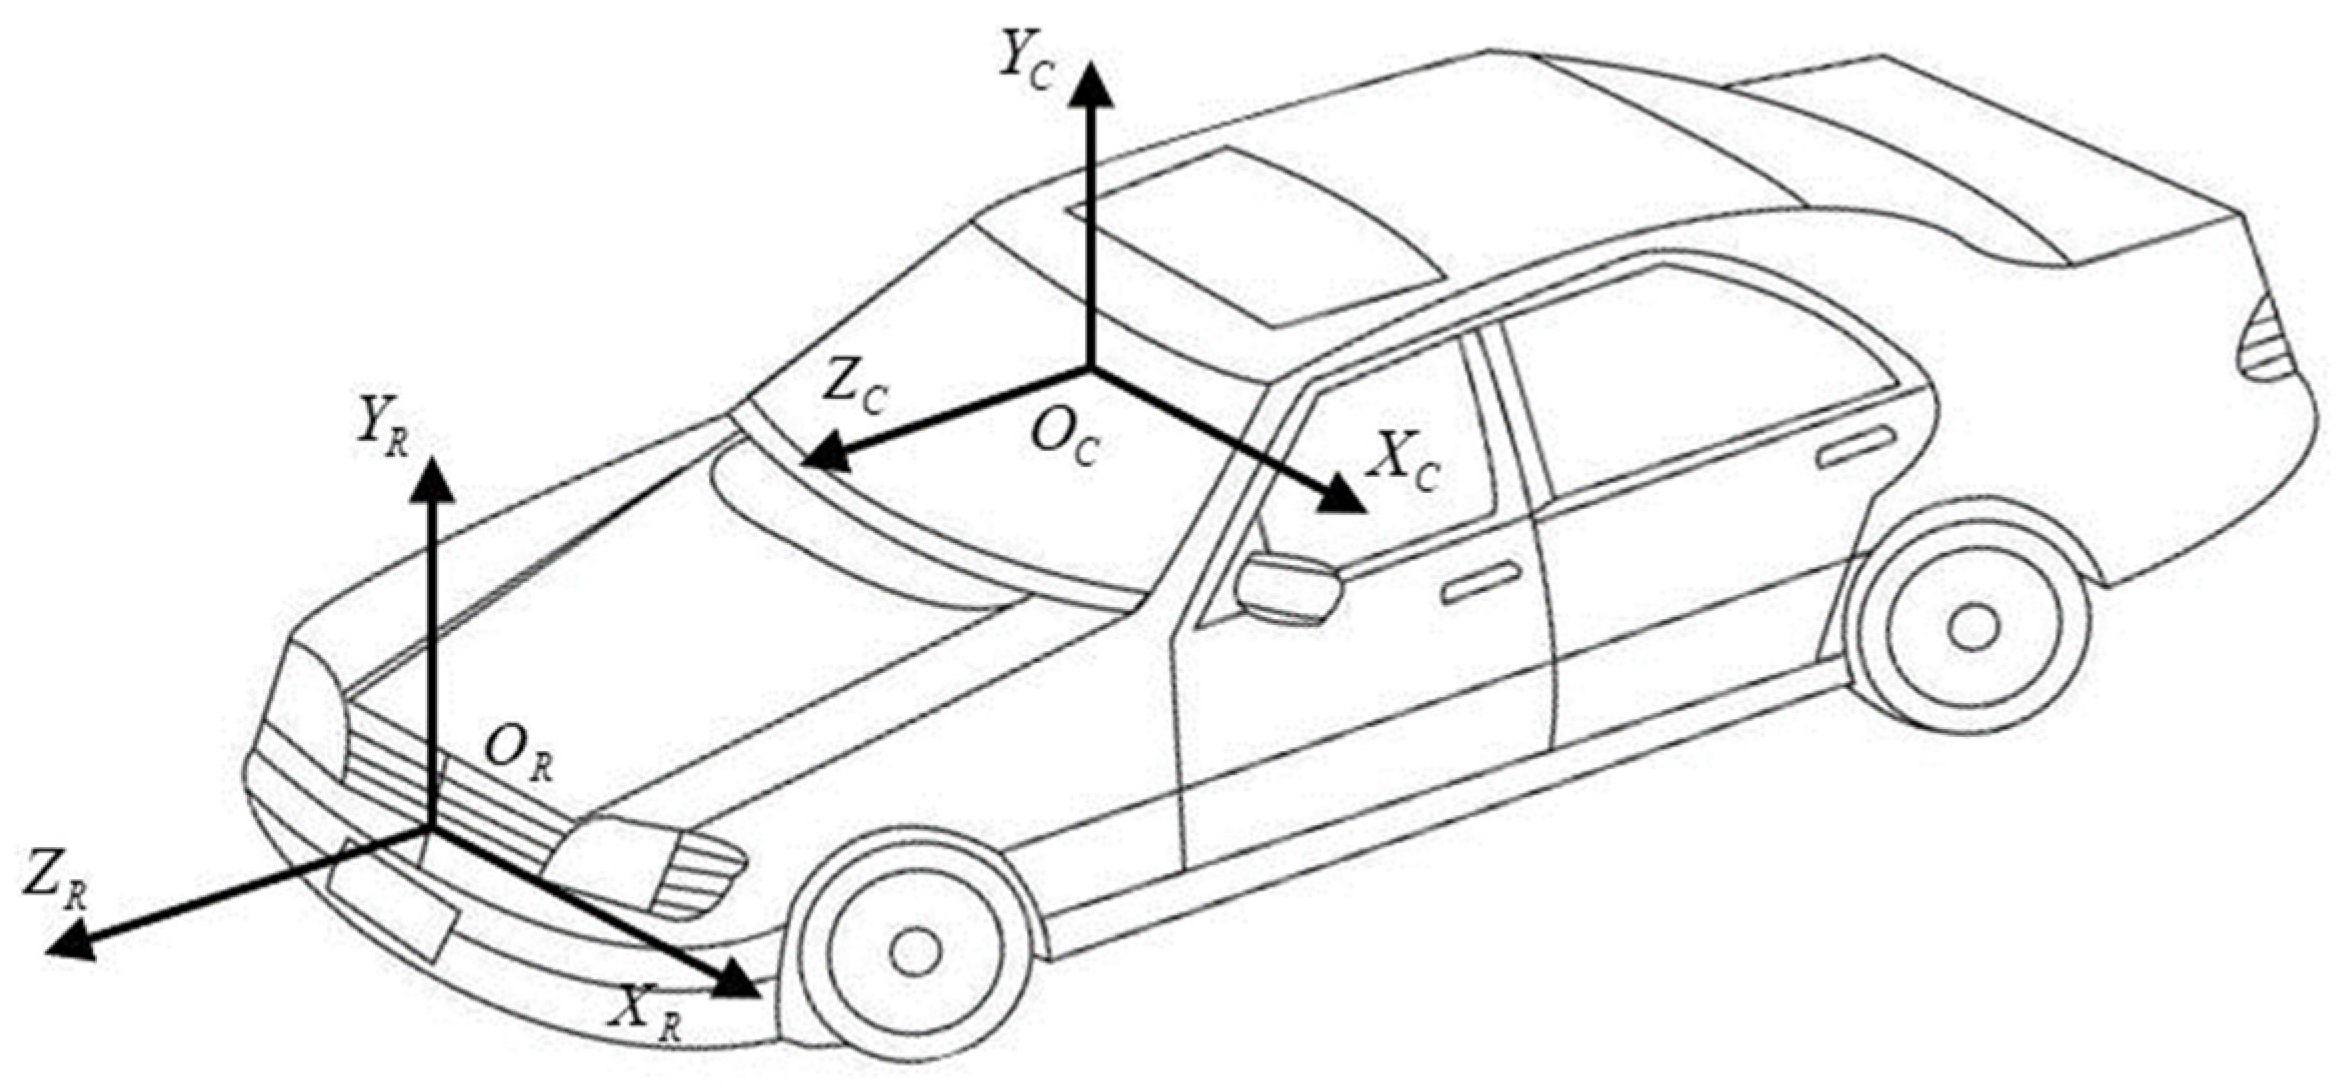
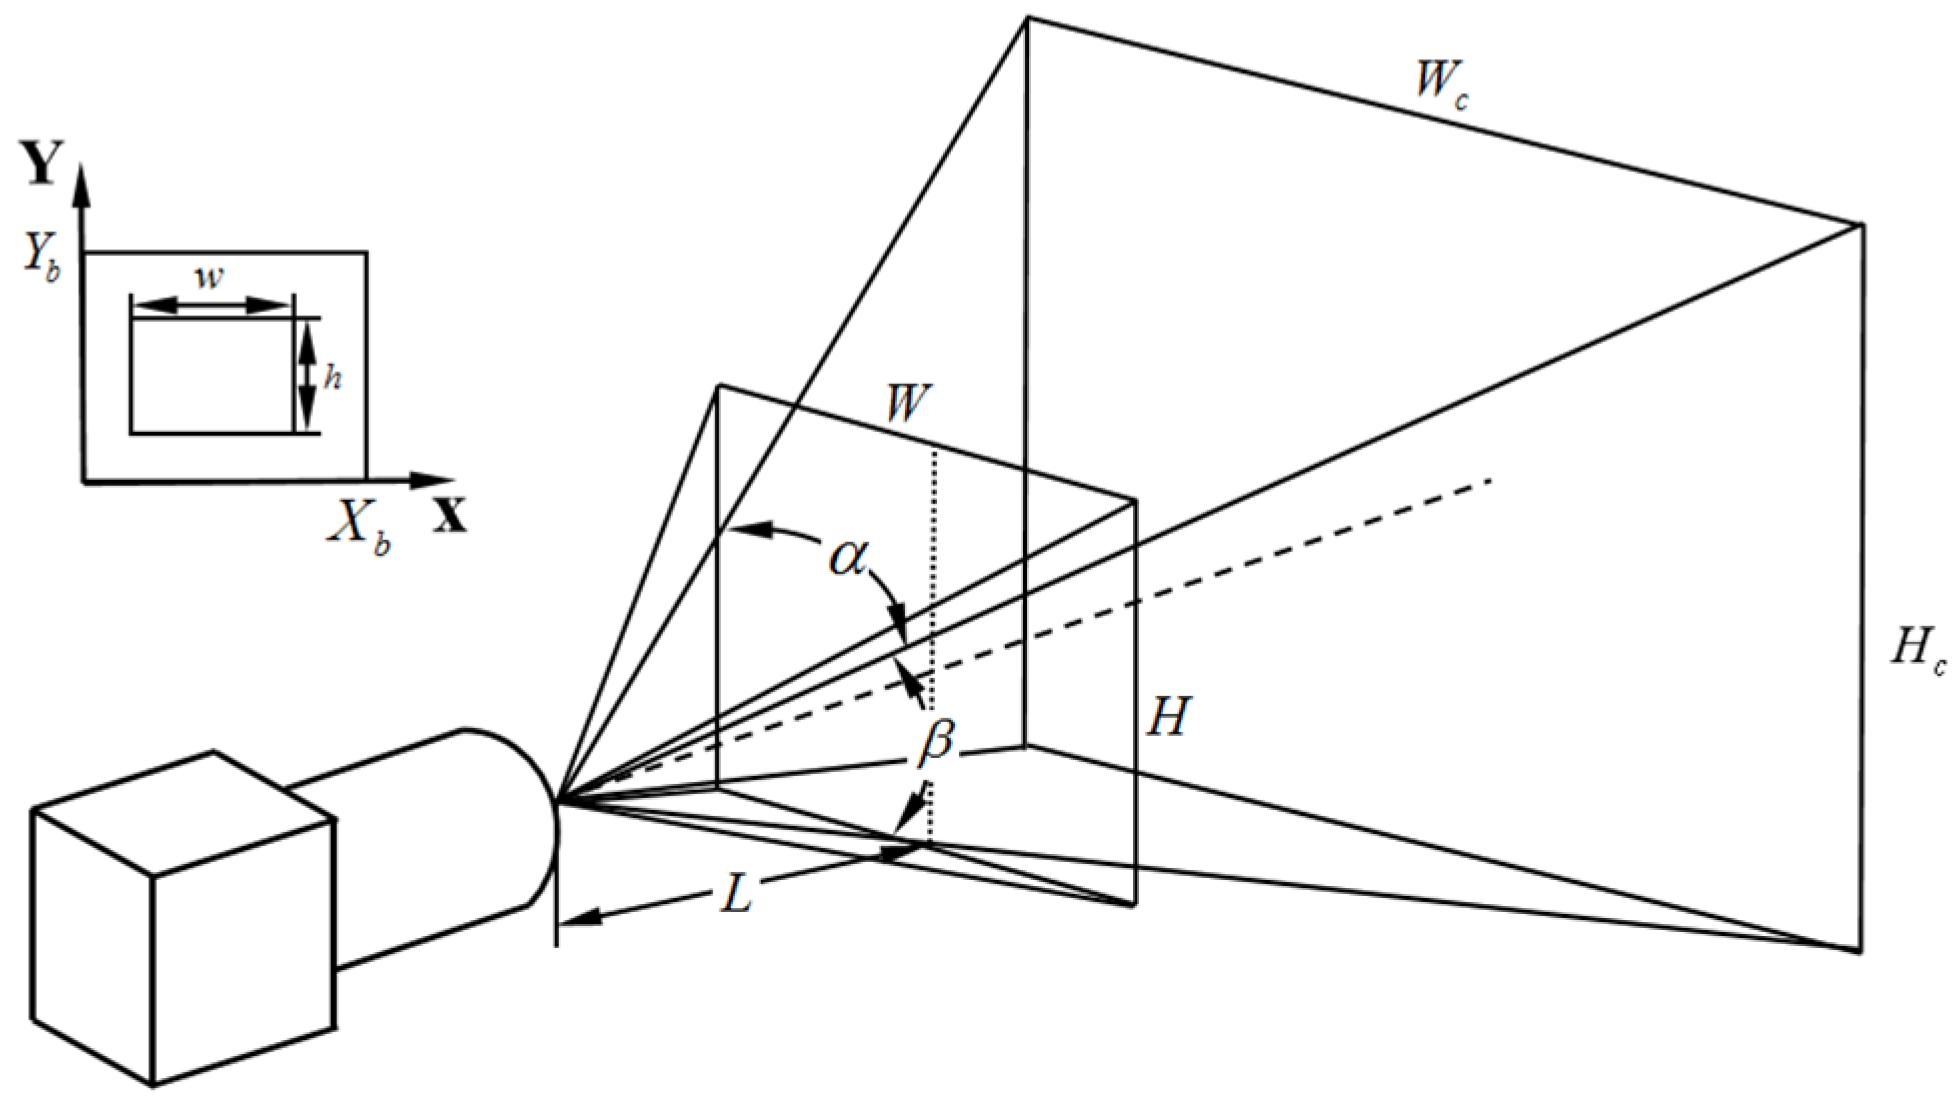
2.1. Coordinate Fusion of Sensors
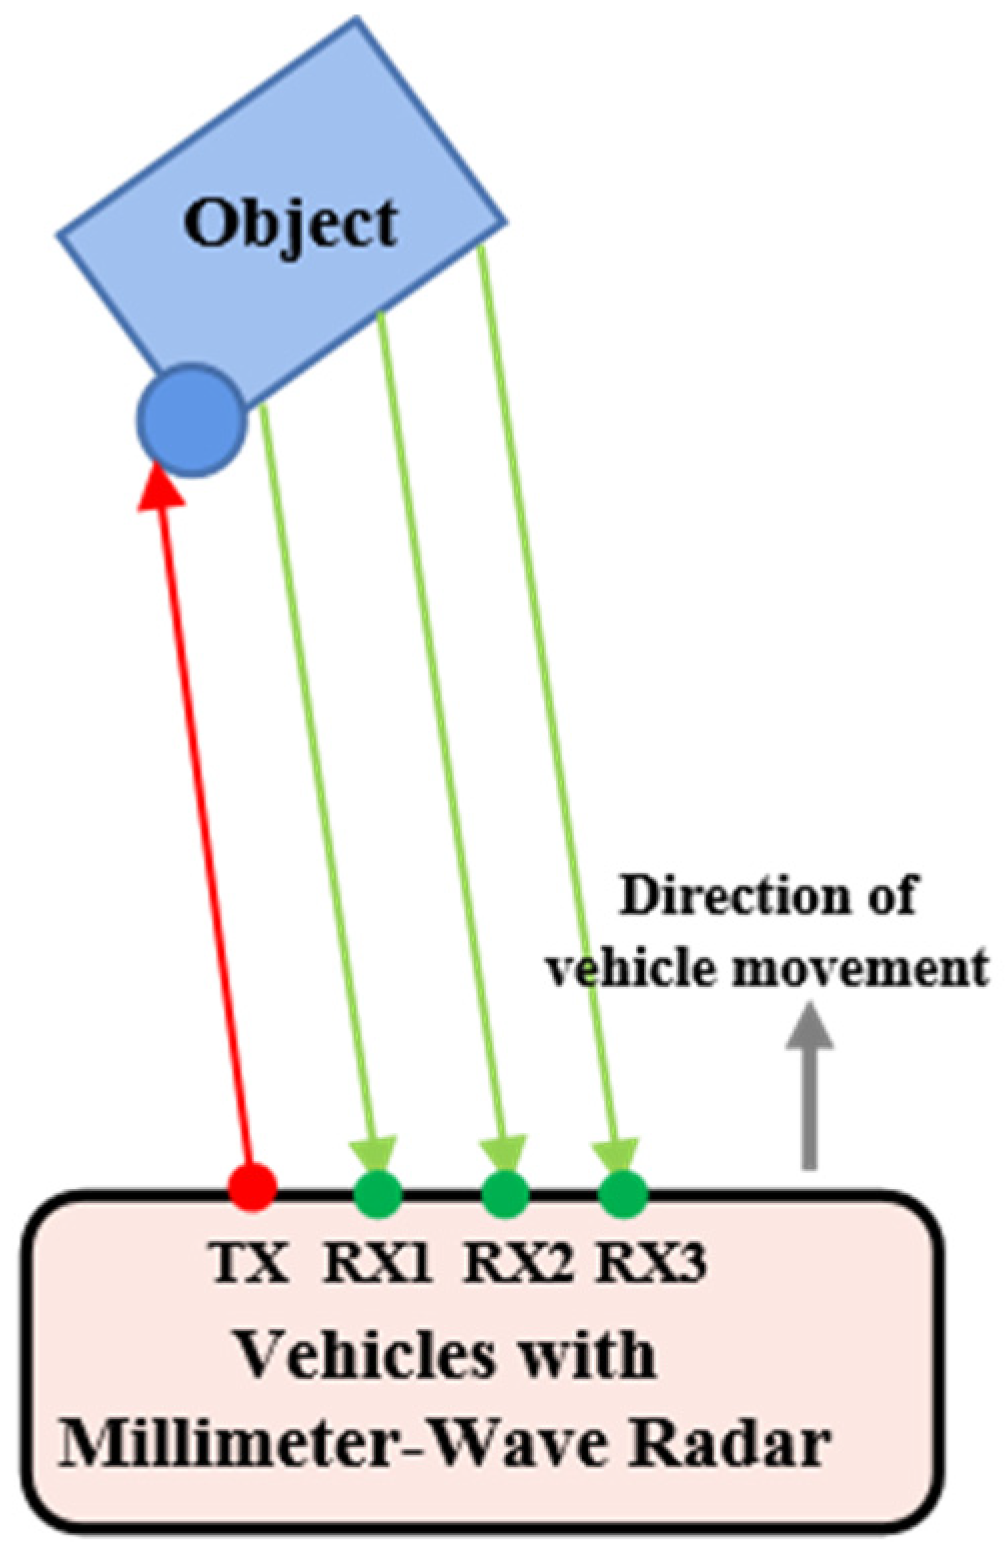
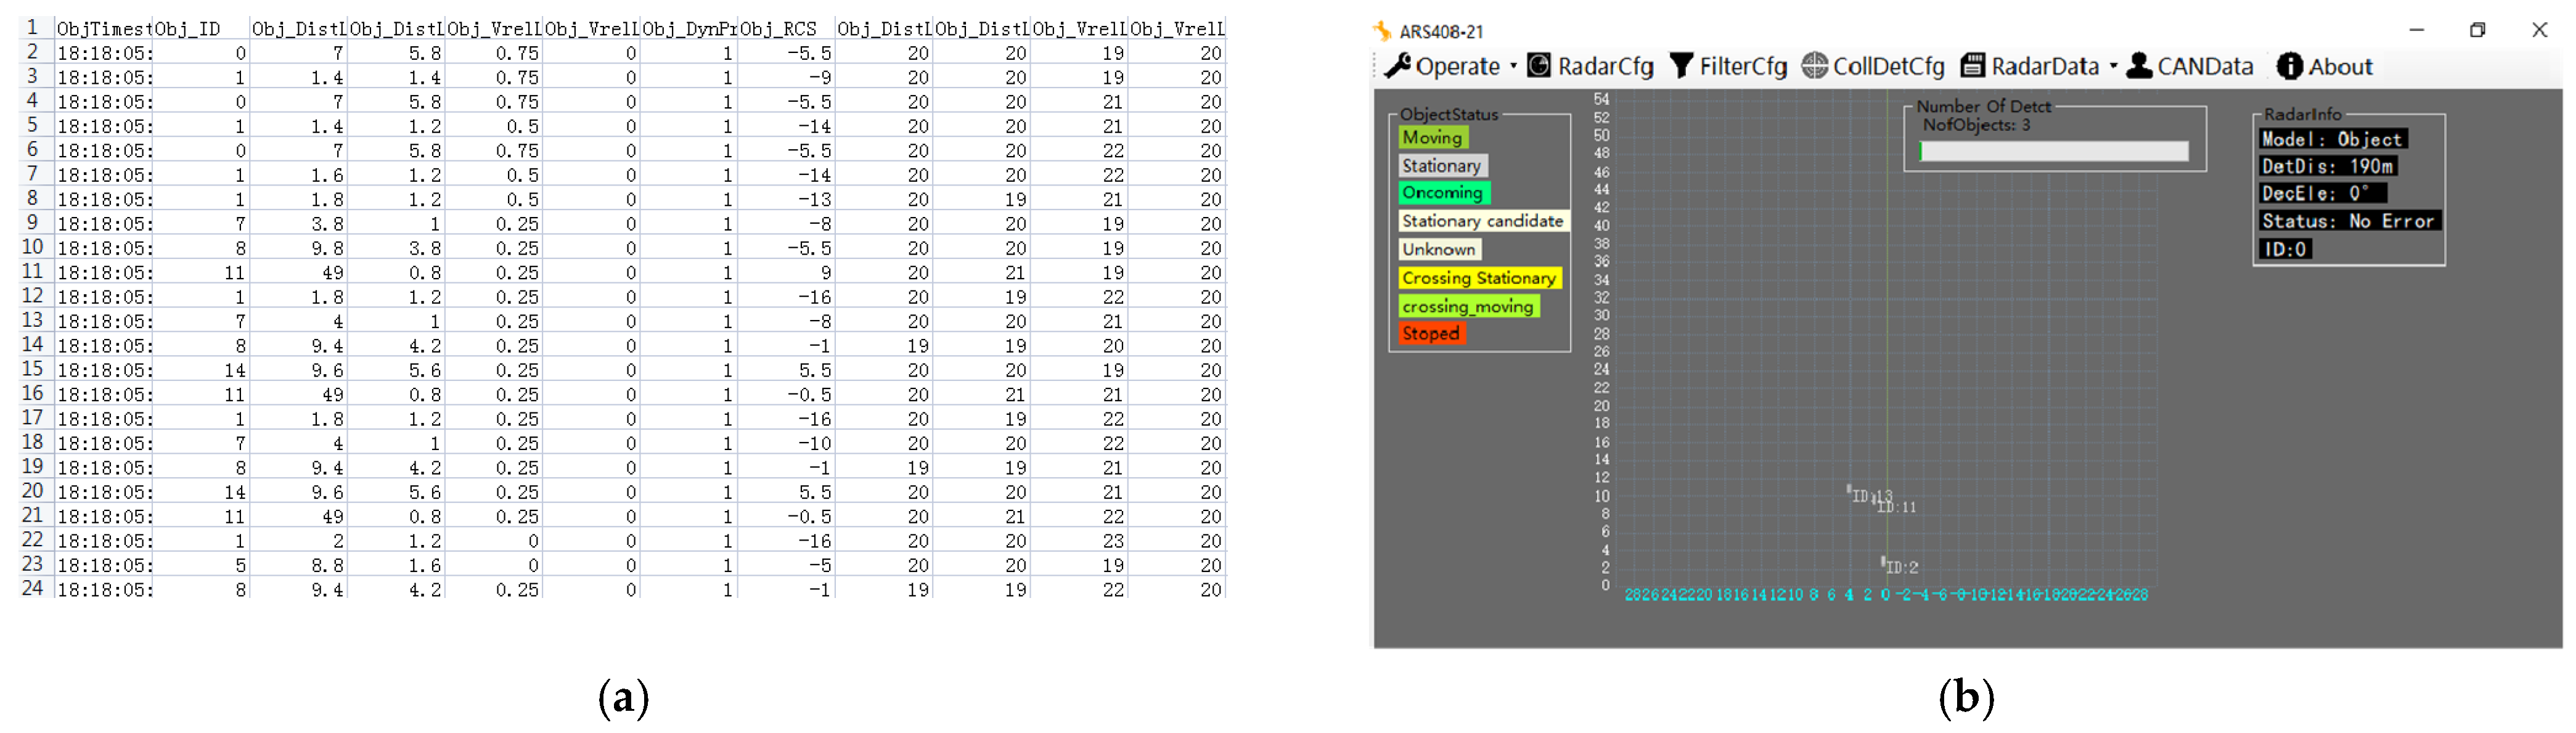
2.2. Acquisition of Millimeter-Wave Radar Region of Interest
3. Feature-Based Vehicle Recognition
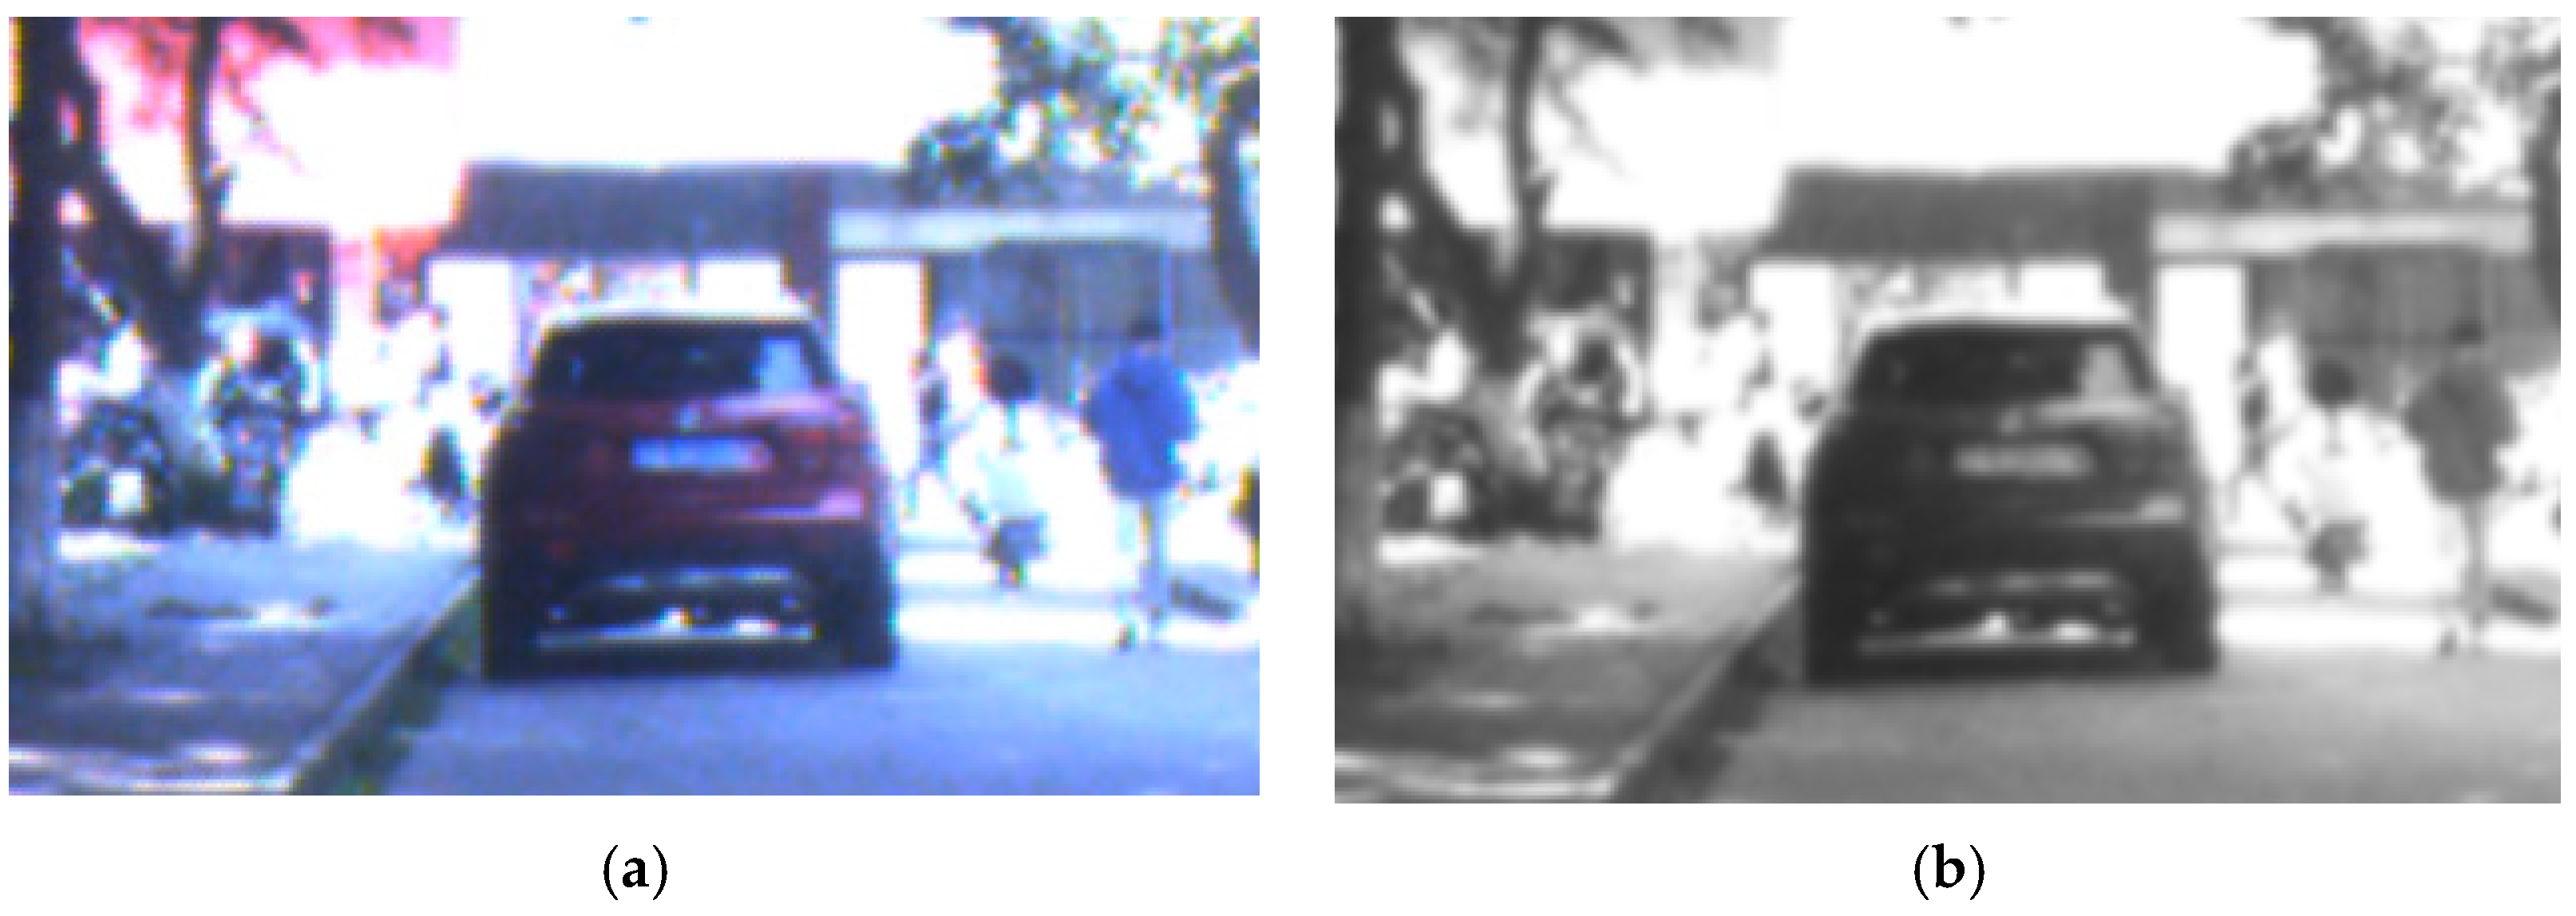
3.1. Image Preprocessing
3.2. Operator-Based Edge Detection
- (1)
- Define the Sobel convolution factor, as shown in Formula (4). The operator includes two groups of 3 × 3 matrices, representing the vertical and horizontal directions, respectively:
- (2)
- Use the Sobel convolution factor to perform the convolution of the image [11] so the gray gradient approximation , in the two directions can be obtained. The pixel gradient size is calculated by Formula (5):
- (3)
- The gradient direction can be calculated according to Formula (6):
- (4)
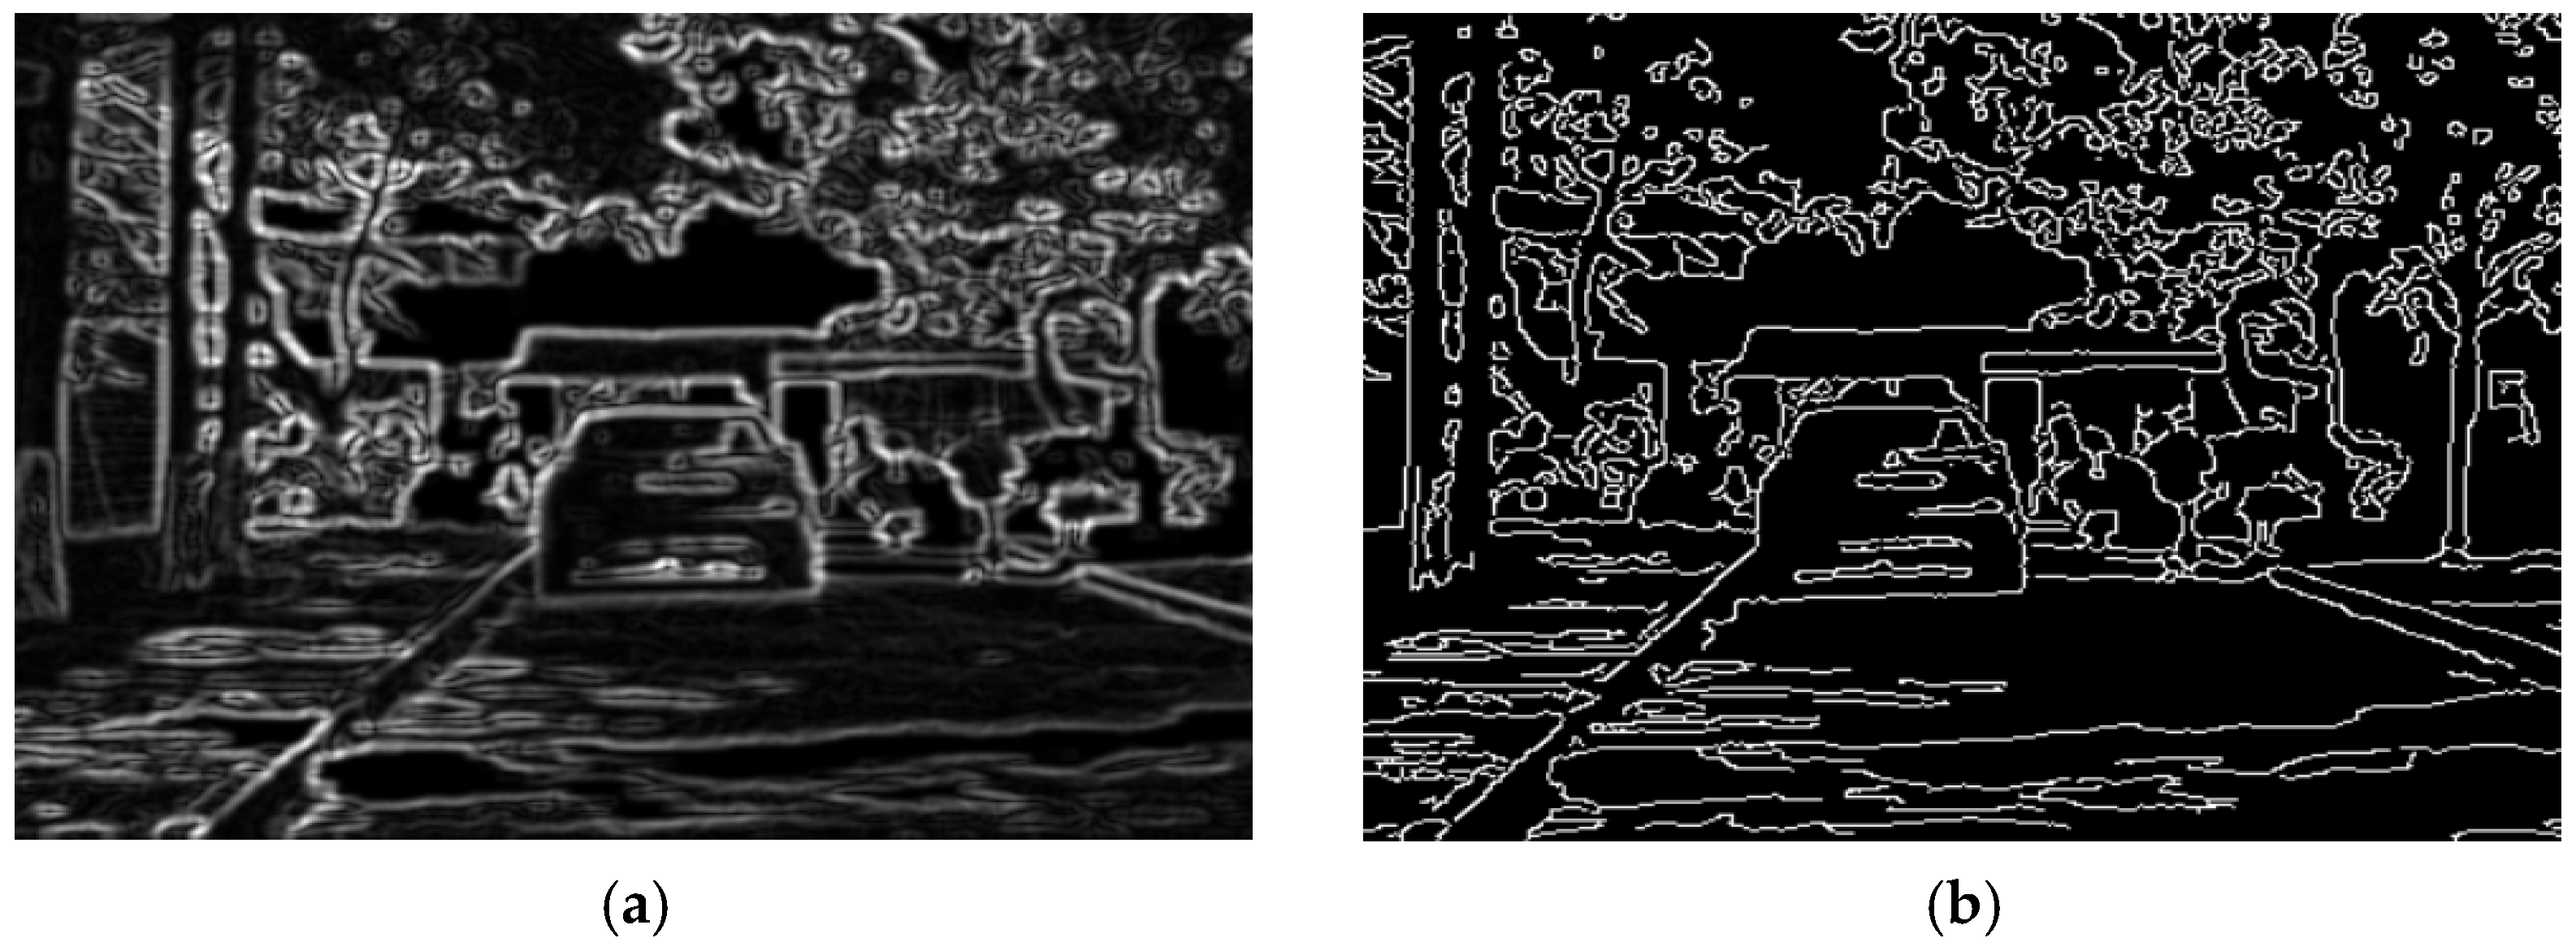
- After calculating and , according to the structural characteristics of the driving scene, the maximum pixel gradient size is set to 0.5, the minimum pixel gradient size is set to 0 as the threshold, and the pixels located at the edge are extracted. Figure 10a shows the edge detection result using the Sobel operator. It can be seen that a significant vehicle contour curve can be plotted.
3.3. Vehicle Contour Line Fitting
4. Vehicle Symmetry Detection
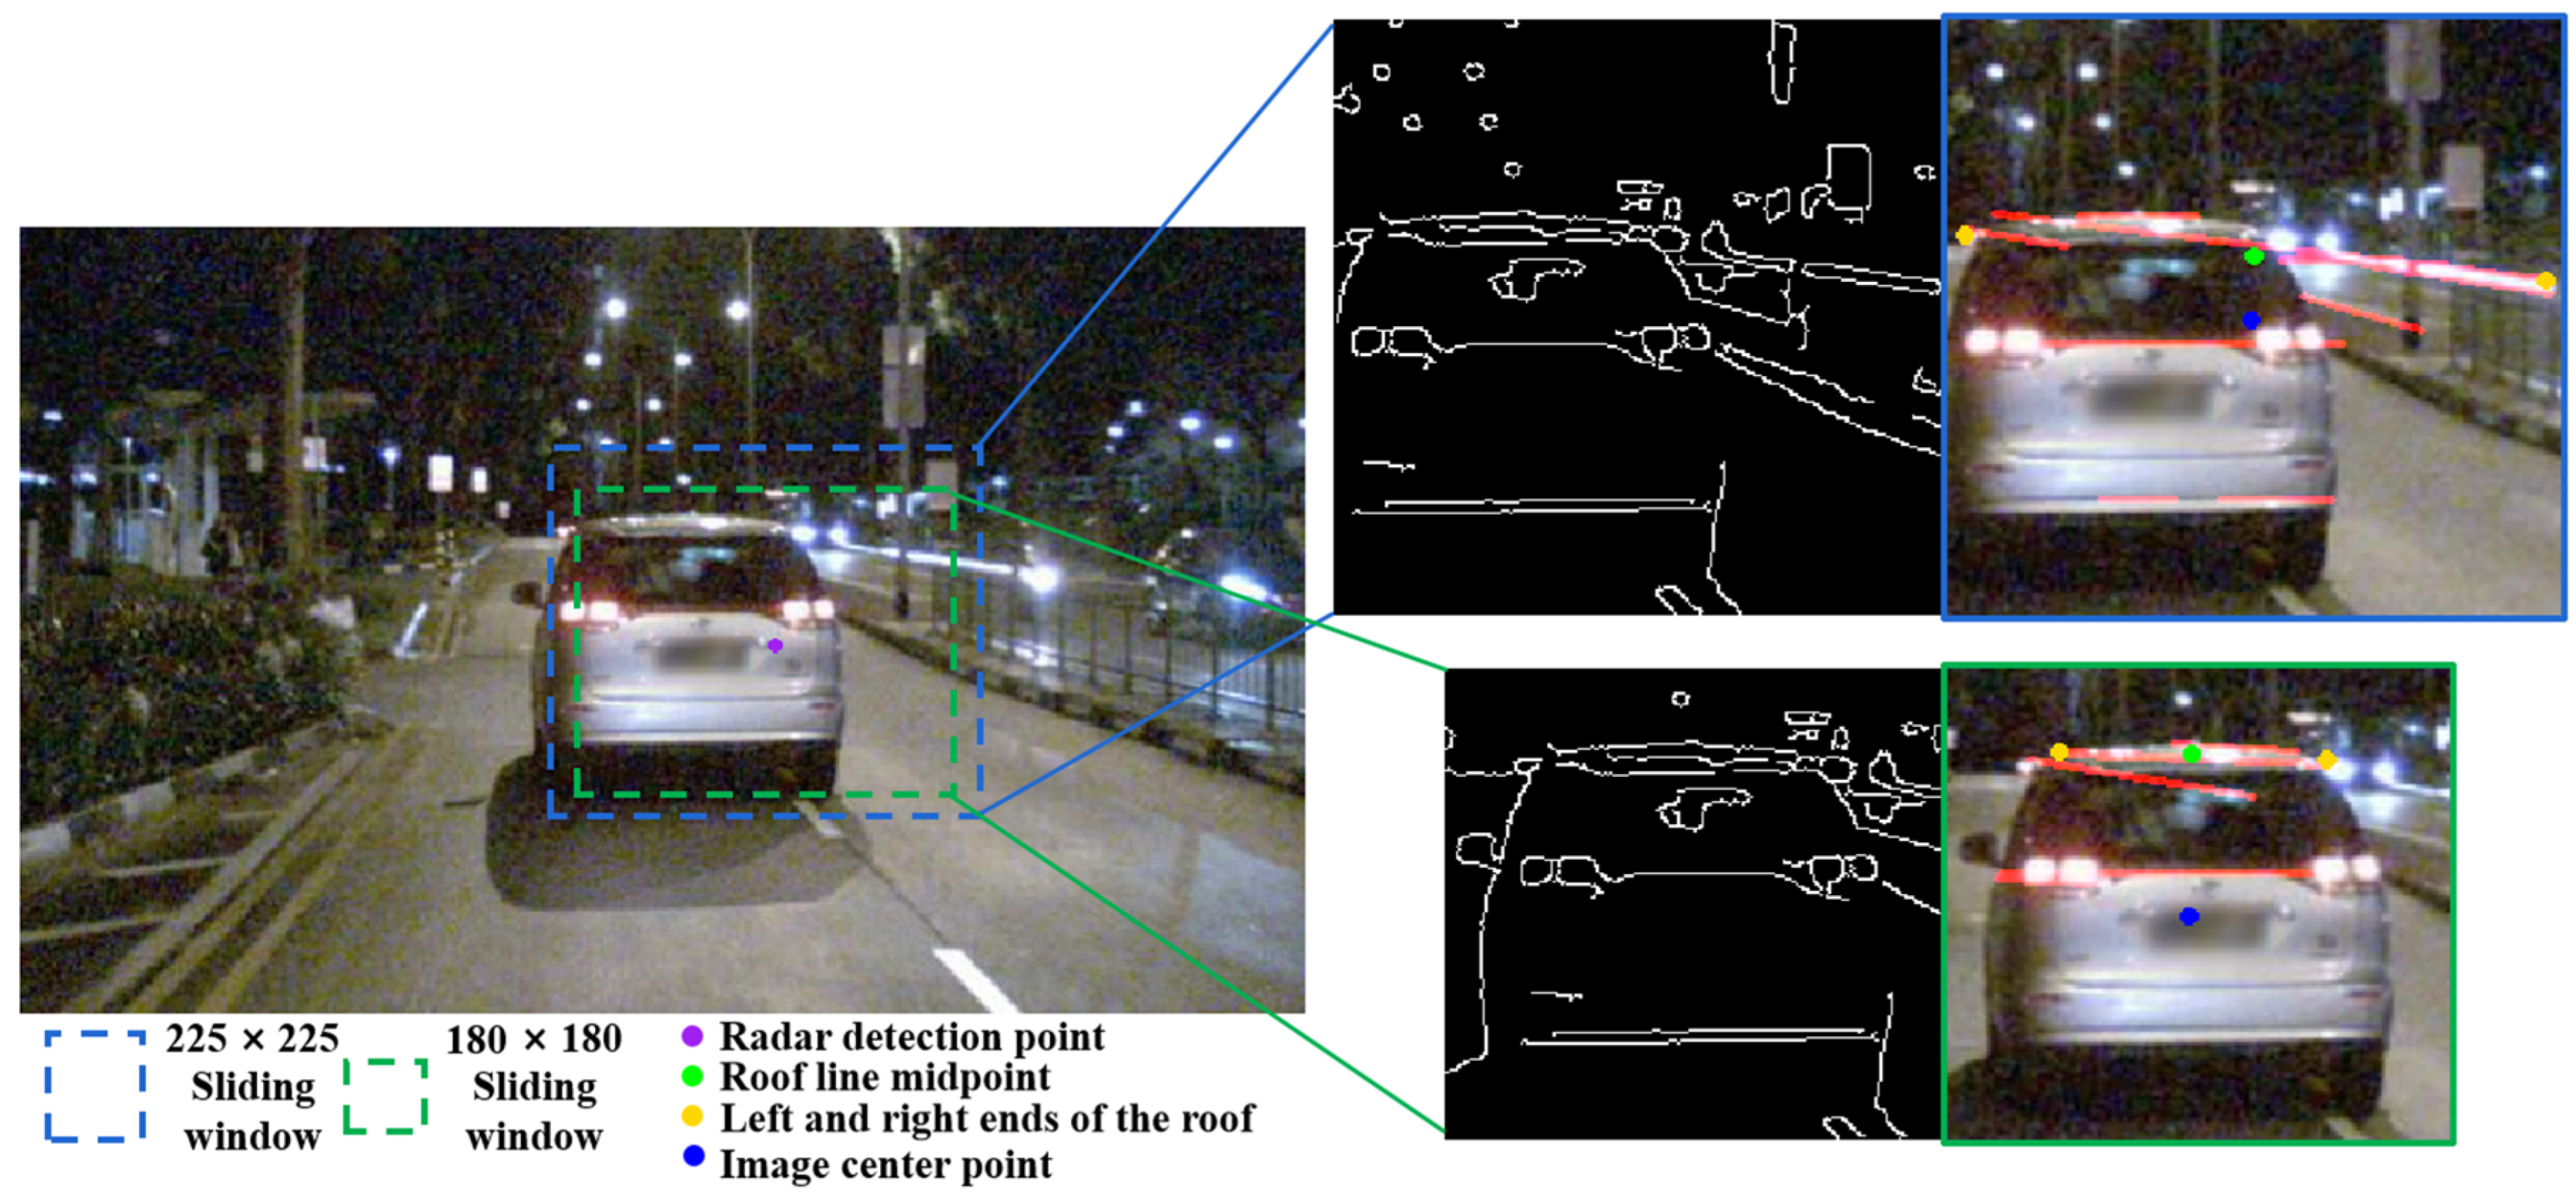
4.1. Sliding Window Detection
4.2. Vehicle Symmetry Analysis
5. Experimental Results
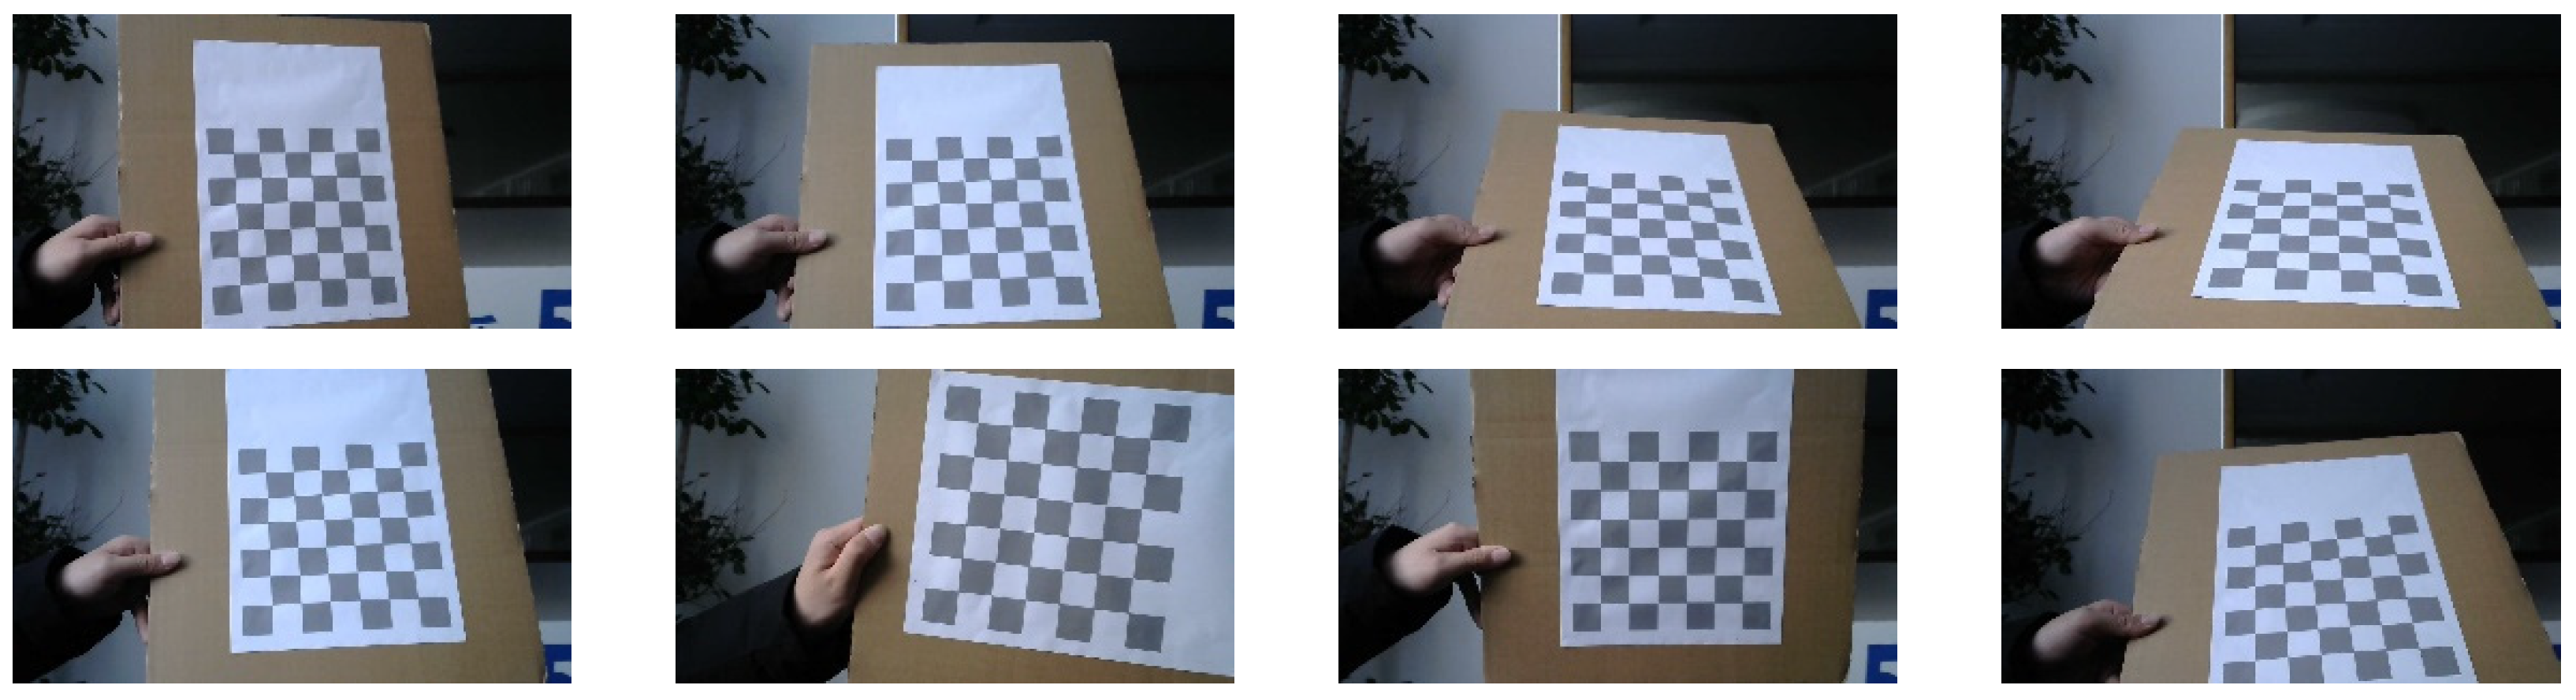
5.1. Internal and External Parameter Calibration
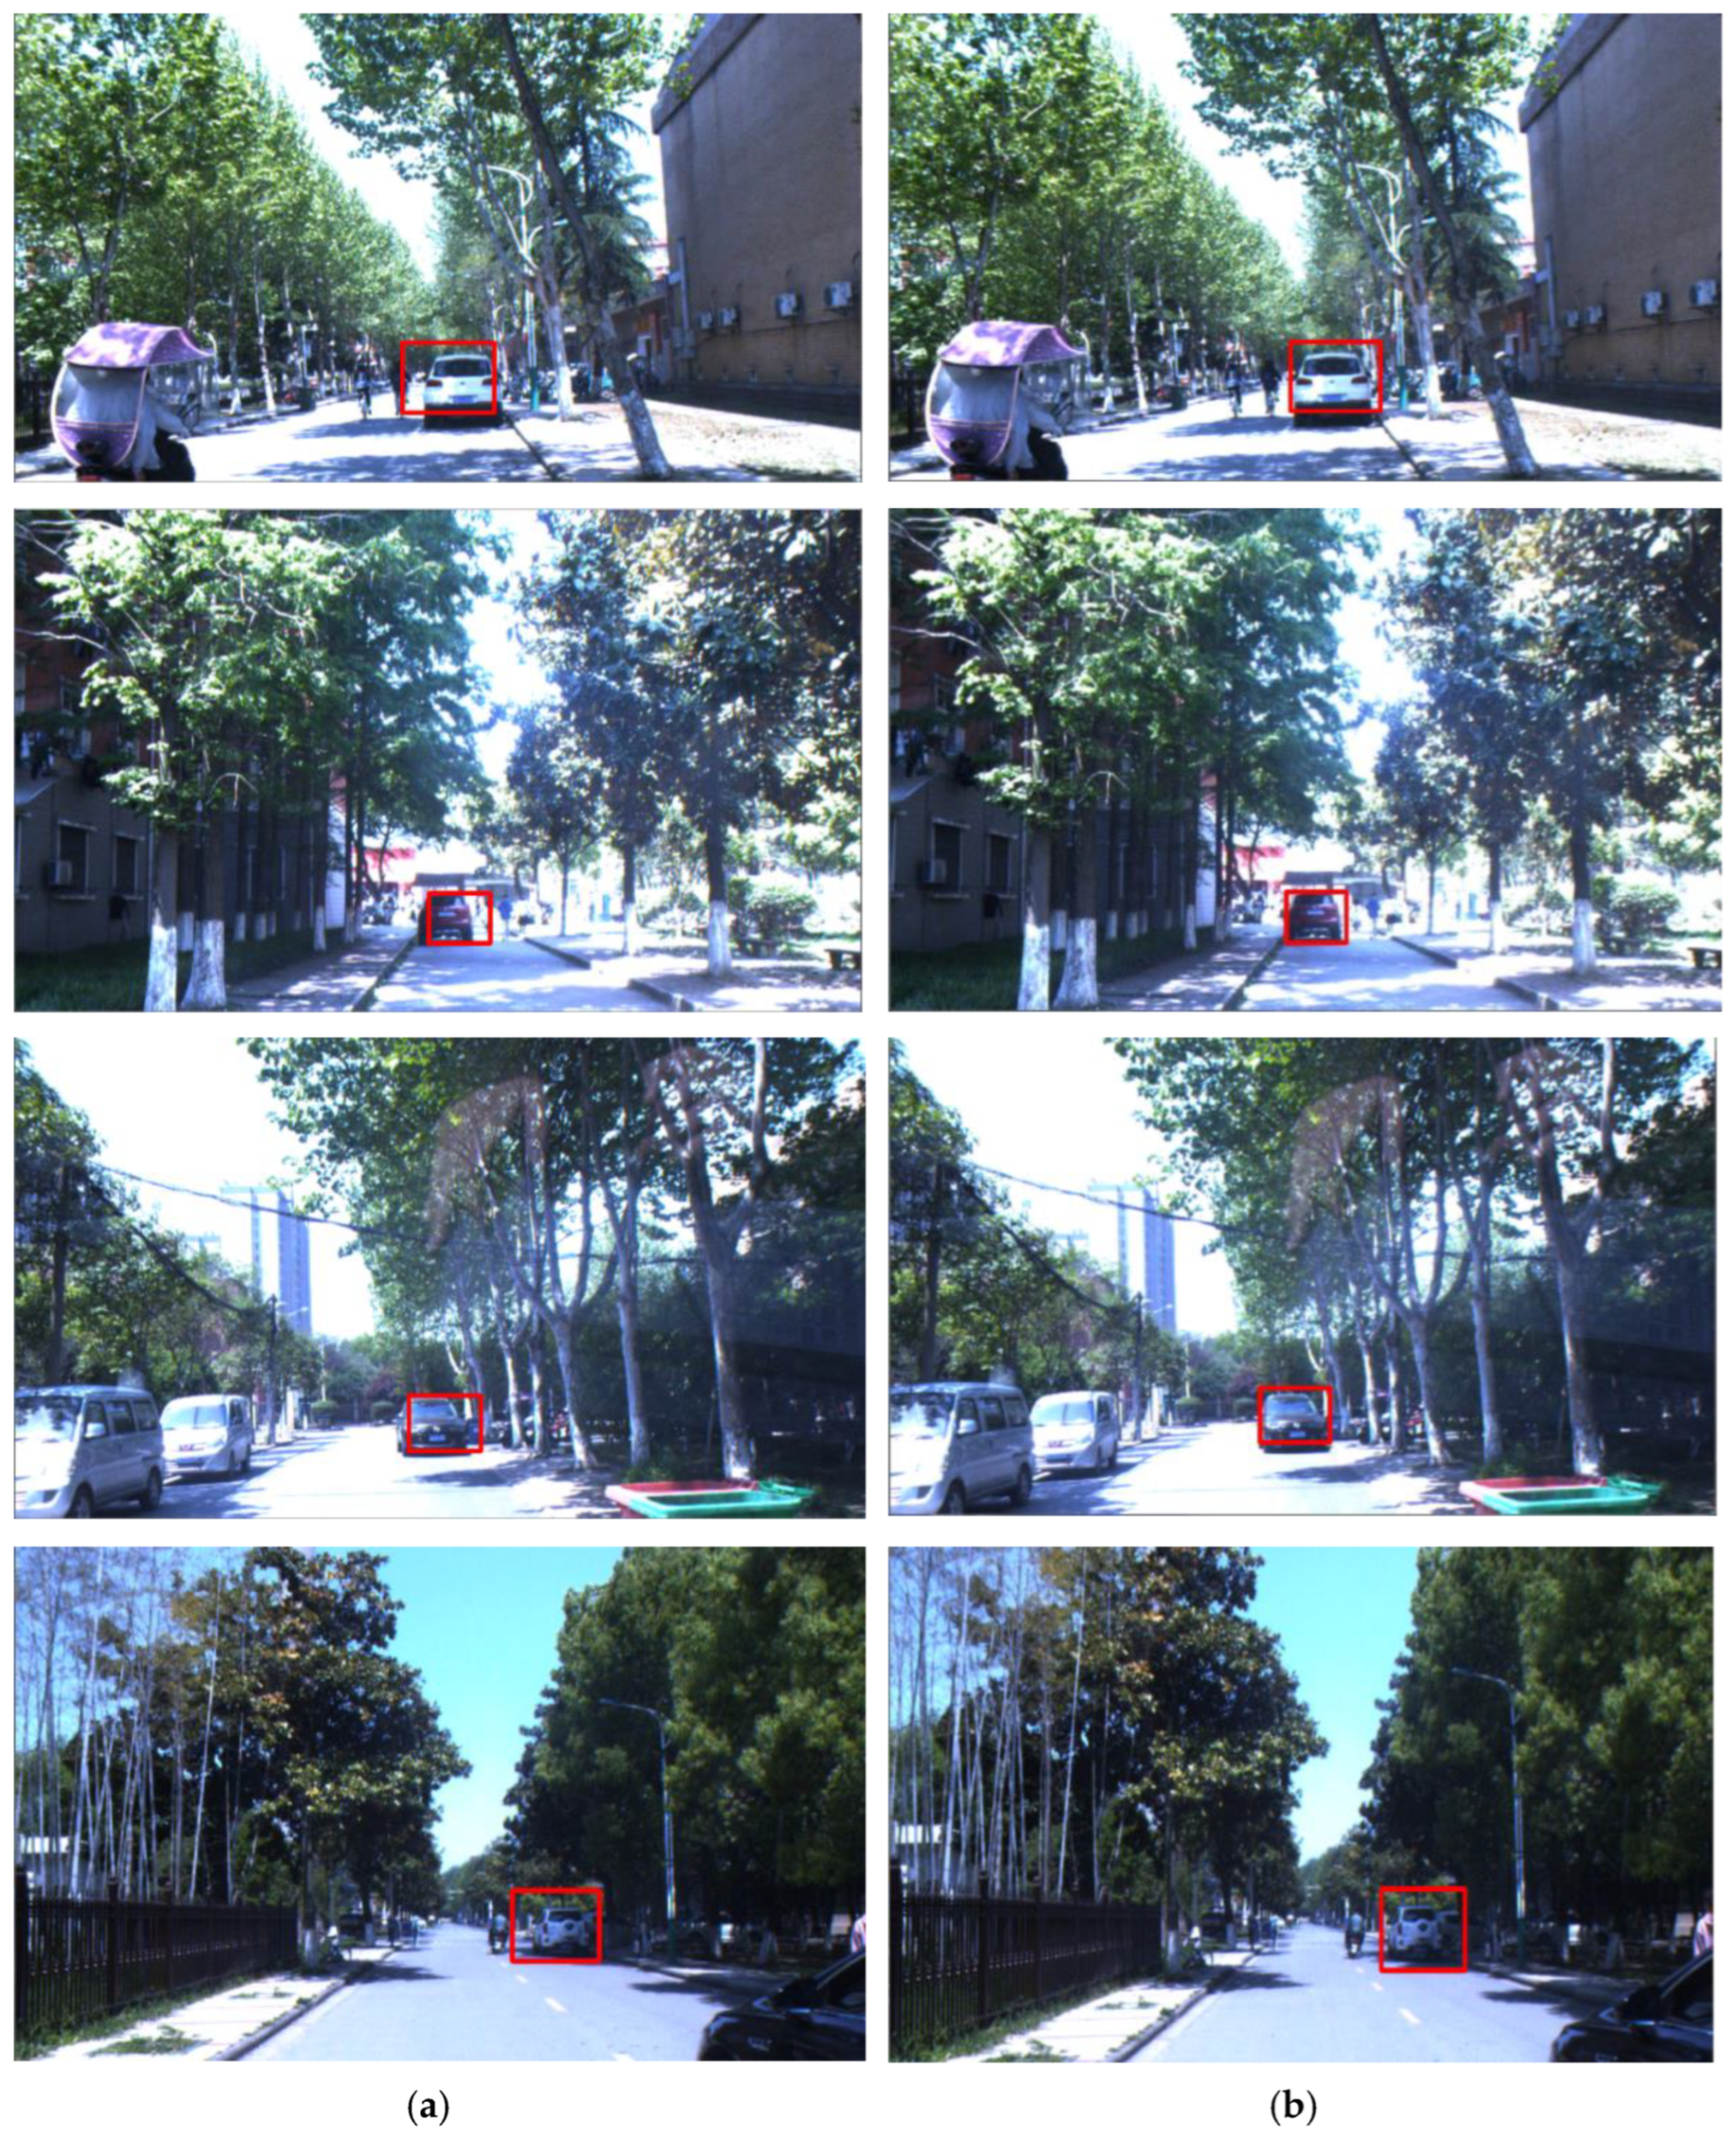
5.2. Real Vehicle Experiment and Visualization
5.3. Experimental Results’ Analysis
6. Conclusions
- (1)
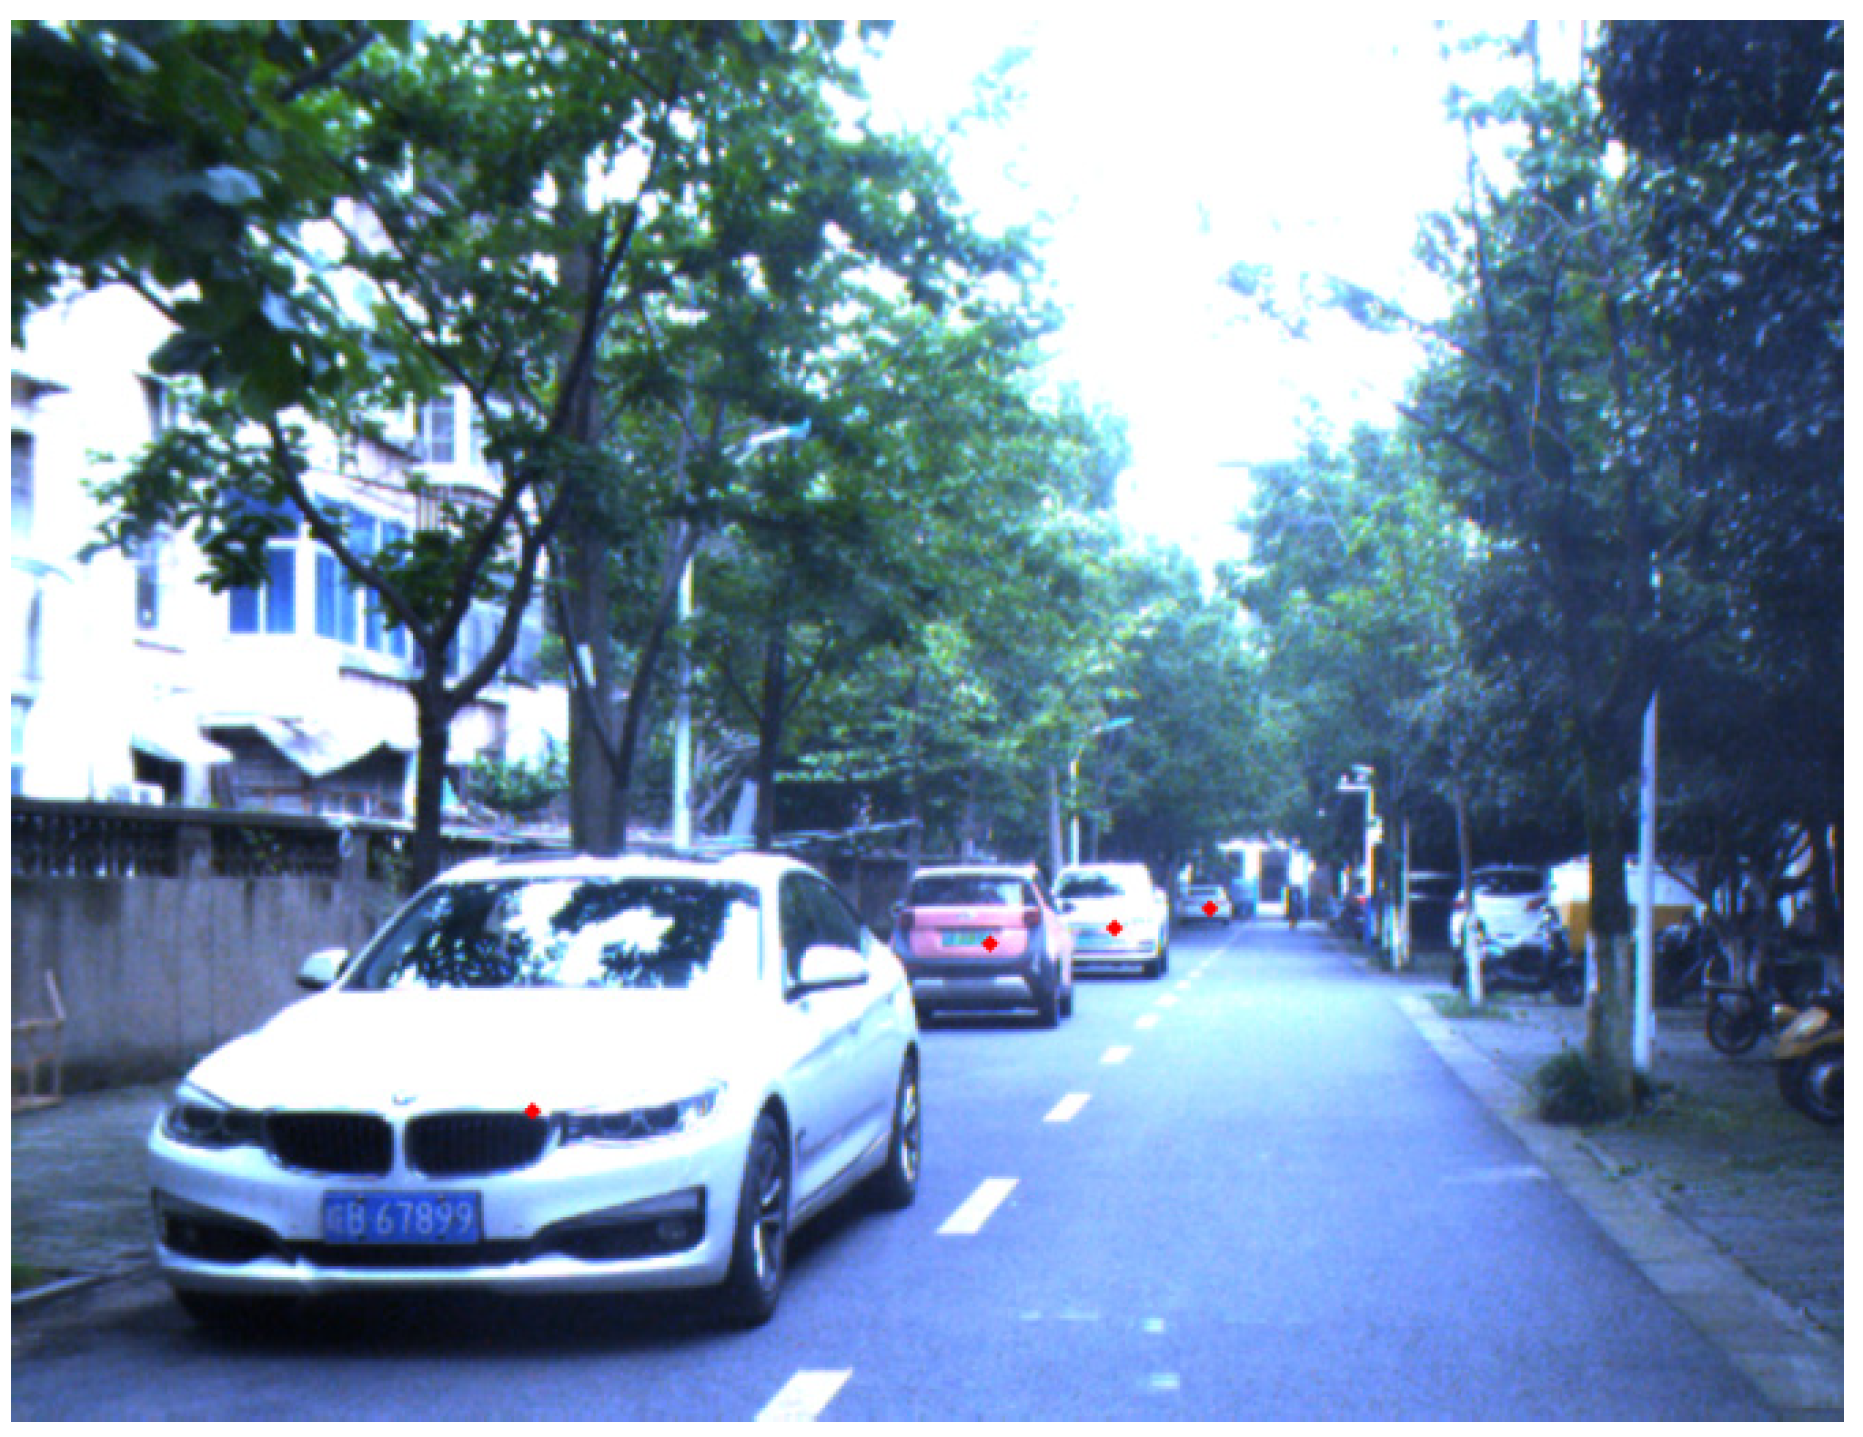
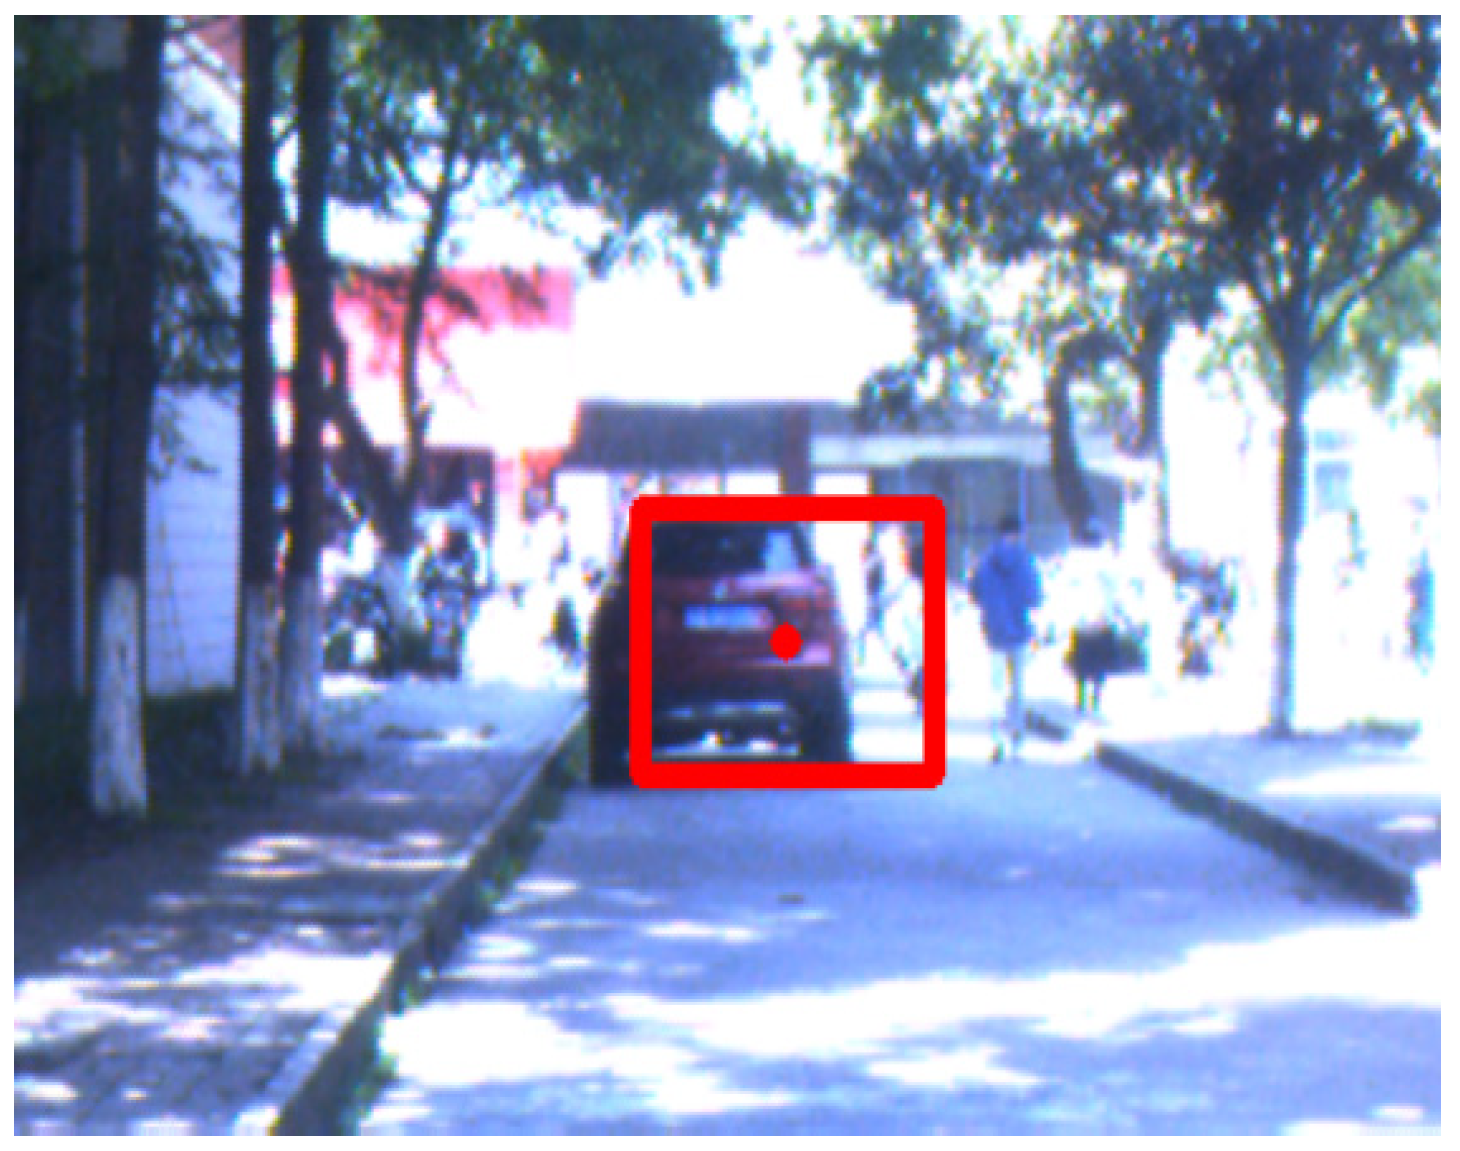
- The algorithm first uses the camera’s extrinsic and intrinsic parameters to realize the spatial fusion of the radar and the image, then projects the vehicle-recognition target point onto the camera image. Next, it further uses image smoothing, Canny edge detection, and probabilistic Hough transform to fit the roof contour line. Finally, a sliding window and symmetry function are established to detect the symmetry of vehicles in the region of interest, and in that way, we dynamically find the optimal recognition region;
- (2)
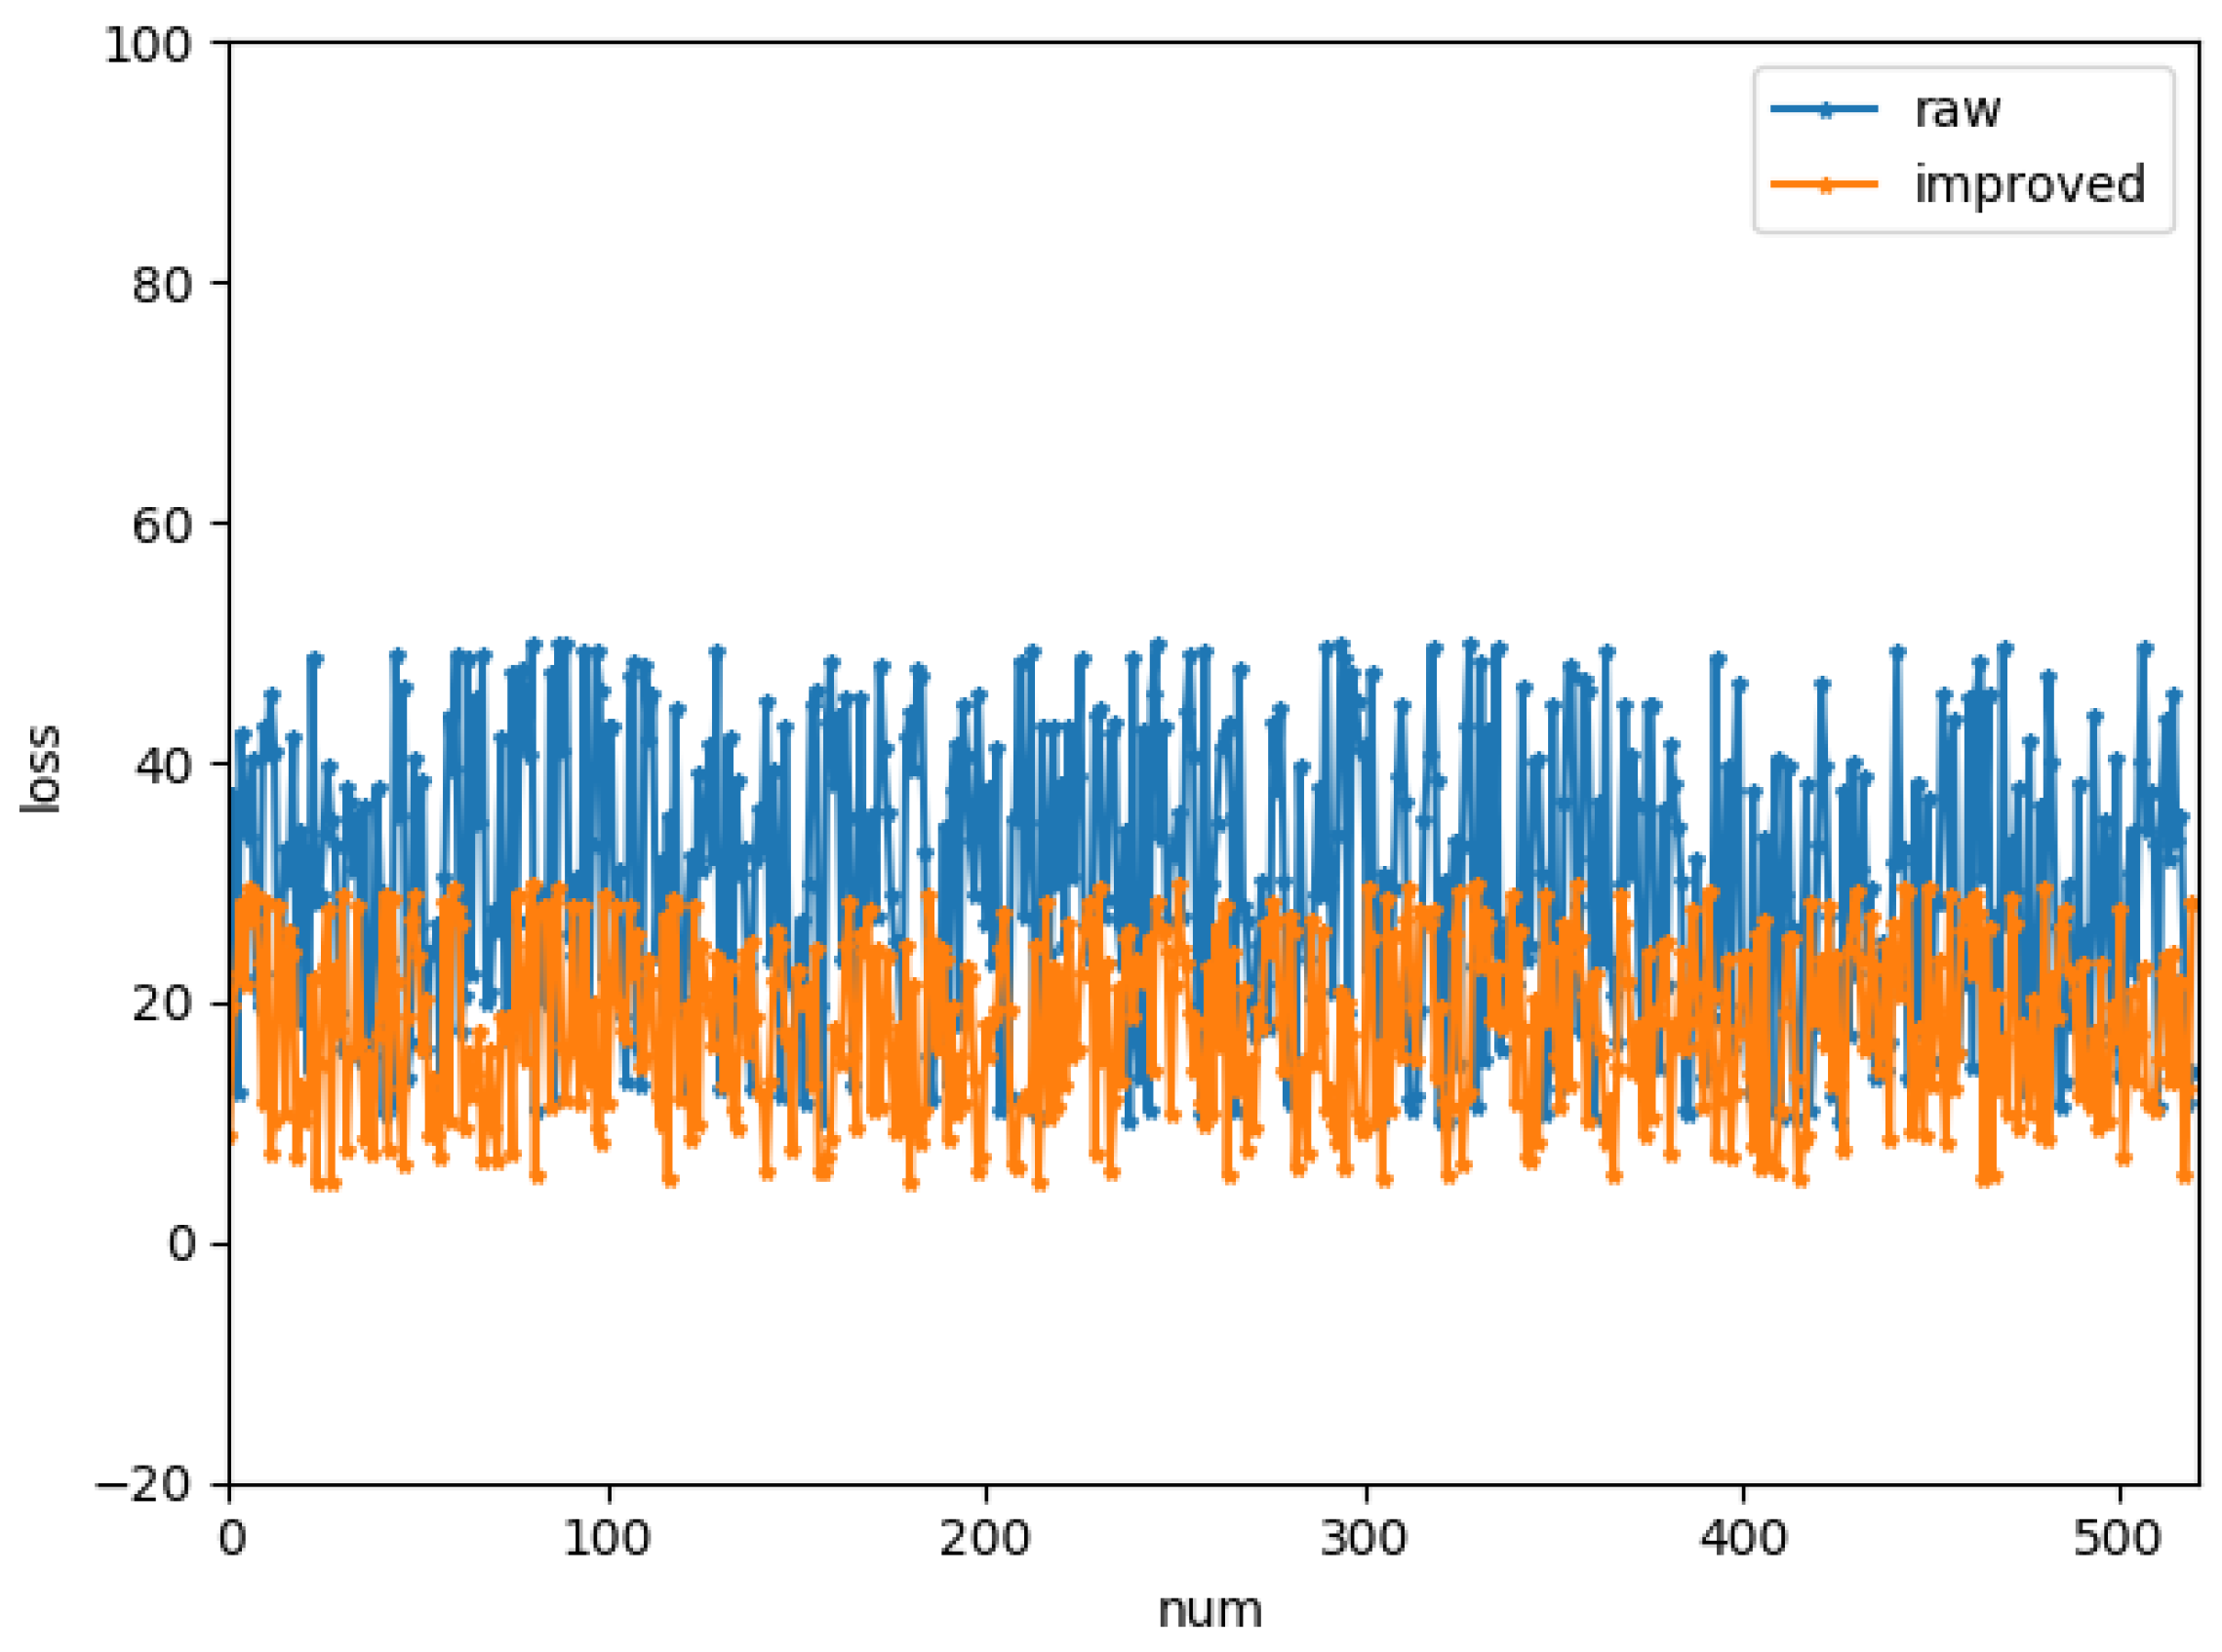
- The experimental results show that the algorithm has better accuracy and a faster processing speed; the mean square error of the algorithm is reduced by 13.4 and the single-frame detection time is reduced to 28 ms, which can meet real-time requirements in low-computing-power scenarios. In the end, we analyzed the influence of the size of the sliding window on the detection performance under different illuminations, and determined that the optimal, small 18 × 18 window can effectively reduce the interference of background pixels;
- (3)
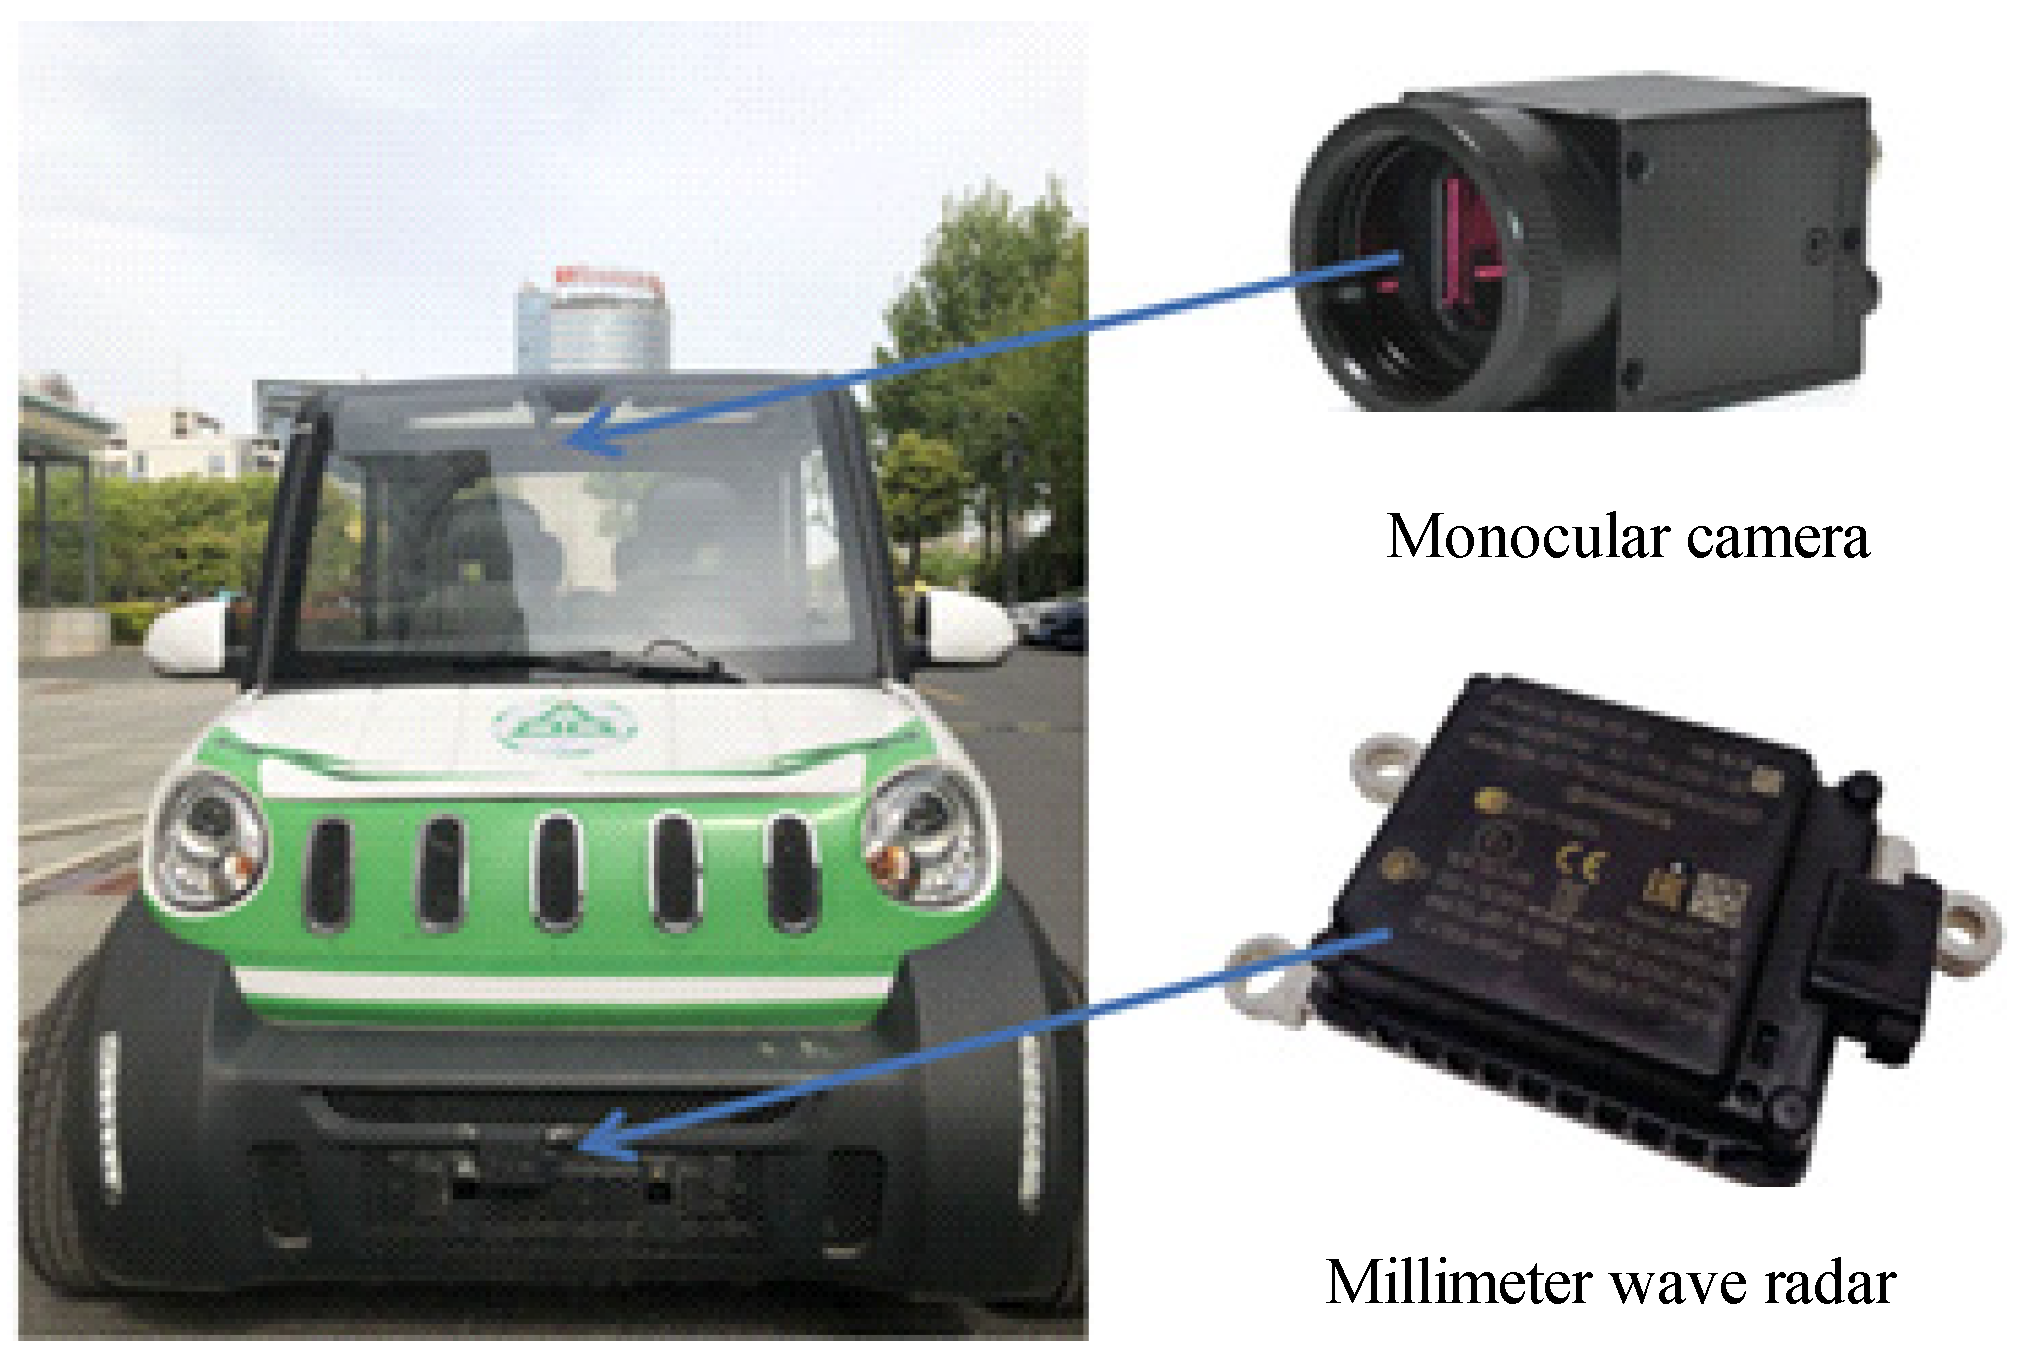
- In this paper, only the fusion of a monocular industrial camera and millimeter-wave radar was attempted. In the future, we will consider using more types of sensors to extend this approach to the fusion of time-of-flight cameras and infrared cameras.
Author Contributions
Funding
Institutional Review Board Statement
Informed Consent Statement
Data Availability Statement
Conflicts of Interest
References
- Teoh, S.S.; Bräunl, T. Symmetry-based monocular vehicle detection system. Mach. Vis. Appl. 2012, 23, 831–842. [Google Scholar] [CrossRef]
- Satzoda, R.K.; Trivedi, M.M. Multipart Vehicle Detection Using Symmetry-Derived Analysis and Active Learning. IEEE Trans. Intell. Transp. Syst. 2016, 17, 926–937. [Google Scholar] [CrossRef]
- Mingchi, F.; Xiaoqian, G.; Huizong, F.; Bowang, S. Research on the Fusion Method for Vehicle Shape-position Based on Binocular Camera and Lidar. In Proceedings of the 2021 6th International Symposium on Computer and Information Processing Technology, ISCIPT 2021, Changsha, China, 11–13 June 2021; pp. 419–423. [Google Scholar]
- Parvin, S.; Islam, M.E.; Rozario, L.J. Nighttime Vehicle Detection Methods Based on Headlight Feature: A Review. IAENG Int. J. Comput. Sci. 2022, 49, 79–93. [Google Scholar]
- Sun, B.; Li, W.; Liu, H.; Yan, J.; Gao, S.; Feng, P. Obstacle detection of intelligent vehicle based on fusion of lidar and machine vision. Eng. Lett. 2021, 29, 722–730. [Google Scholar]
- Hu, Y.; Liu, F.; Wei, Z.; Zhao, L. Vehicle Tracking of Information Fusion for Millimeter-wave Radar and Vision Sensor. Zhongguo Jixie Gongcheng/China Mech. Eng. 2021, 32, 2181–2188. (In Chinese) [Google Scholar]
- Wang, X.; Xu, L.; Sun, H.; Xin, J.; Zheng, N. On-Road Vehicle Detection and Tracking Using MMW Radar and Monovision Fusion. IEEE Trans. Intell. Transp. Syst. 2016, 17, 2075–2084. [Google Scholar] [CrossRef]
- Han, S.; Wang, X.; Xu, L.; Sun, H.; Zheng, N. Frontal object perception for Intelligent Vehicles based on radar and camera fusion. In Proceedings of the 35th Chinese Control Conference (CCC), Chengdu, China, 27–29 July 2016; Volume 2016, pp. 4003–4008. [Google Scholar] [CrossRef]
- Jiang, Q.; Zhang, L.; Meng, D. Target detection algorithm based on MMW radar and camera fusion. In Proceedings of the 2019 IEEE Intelligent Transportation Systems Conference, ITSC 2019, Auckland, New Zealand, 27–30 October 2019; pp. 1–6. [Google Scholar]
- Li, L. An improved image processing algorithms of sobel edge detection and functional verification. Bol. Tec./Tech. Bull. 2017, 55, 359–366. [Google Scholar]
- Arslan, E.; Orman, Z.; Arik, S. Feature extraction of objects in moving images and implementation of the purification algorithm on the CNN Universal Machine. Int. J. Circuits Syst. Signal Process. 2011, 5, 488–495. [Google Scholar]
- Rahman, M.A.; Amin, M.F.I.; Hamada, M. Edge detection technique by histogram processing with canny edge detector. In Proceedings of the 3rd IEEE International Conference on Knowledge Innovation and Invention 2020, ICKII 2020, Kaohsiung, Taiwan, 21–23 August 2020; pp. 128–131. [Google Scholar]
- Zou, Y.; Zhang, J.; Upadhyay, M.; Sun, S.; Jiang, T. Automatic Image Thresholding Based on Shannon Entropy Difference and Dynamic Synergic Entropy. IEEE Access 2020, 8, 171218–171239. [Google Scholar] [CrossRef]
- Manoharan, K.; Daniel, P. Image processing-based framework for continuous lane recognition in mountainous roads for driver assistance system. J. Electron. Imaging 2017, 26, 063011. [Google Scholar] [CrossRef]
- Zhou, S.; Zhi, X.; Lin, F.; Ning, H.; Jiang, L.; Wu, N. Research on Vehicle Detection and Tracking Algorithm Based on Onboard Video Images. Tongji Daxue Xuebao/J. Tongji Univ. 2019, 47, 191–198. (In Chinese) [Google Scholar]
- Zhao, W.; Li, B.; Shan, Y.; Xu, H. Vehicle Detection and Tracking Based on Fusion of Millimeter Wave Radar and Monocular Vision. Wuhan Daxue Xuebao (Xinxi Kexue Ban)/Geomat. Inf. Sci. Wuhan Univ. 2019, 44, 1832–1840. (In Chinese) [Google Scholar]


| Calibration Parameters | |
|---|---|
| camera’s internal parameters | |
| rotation matrix | |
| translation matrix | |
Publisher’s Note: MDPI stays neutral with regard to jurisdictional claims in published maps and institutional affiliations. |
© 2022 by the authors. Licensee MDPI, Basel, Switzerland. This article is an open access article distributed under the terms and conditions of the Creative Commons Attribution (CC BY) license (https://creativecommons.org/licenses/by/4.0/).
Share and Cite
Ding, F.; Wang, B.; Zhang, Q.; Wang, A. Research on a Vehicle Recognition Method Based on Radar and Camera Information Fusion. Technologies 2022, 10, 97. https://doi.org/10.3390/technologies10040097
Ding F, Wang B, Zhang Q, Wang A. Research on a Vehicle Recognition Method Based on Radar and Camera Information Fusion. Technologies. 2022; 10(4):97. https://doi.org/10.3390/technologies10040097
Chicago/Turabian StyleDing, Fang, Bo Wang, Qianbin Zhang, and Aiguo Wang. 2022. "Research on a Vehicle Recognition Method Based on Radar and Camera Information Fusion" Technologies 10, no. 4: 97. https://doi.org/10.3390/technologies10040097
APA StyleDing, F., Wang, B., Zhang, Q., & Wang, A. (2022). Research on a Vehicle Recognition Method Based on Radar and Camera Information Fusion. Technologies, 10(4), 97. https://doi.org/10.3390/technologies10040097