Article

Information Disclosure in China’s Rising Securitization Market

Faculty of Law, University of Macau, Macau, China
*
Author to whom correspondence should be addressed.
Int. J. Financial Stud. 2021, 9(4), 66; https://doi.org/10.3390/ijfs9040066
Submission received: 16 September 2021 / Revised: 14 November 2021 / Accepted: 19 November 2021 / Published: 1 December 2021
(This article belongs to the Special Issue The Financial Industry 4.0 Part 2)

Abstract

:
E-commerce and FinTech are currently booming in China. The growing consumer market is accompanied by internet finance, by which consumers can easily borrow money from financial institutions online. As a result, the growing risks of financial institutions are of concern to the government and regulatory bodies. Consequently, the securitization market in China is seeing rapid growth that could affect financial stability. Applying FinTech and emerging technologies in securitization might be an effective way to protect against these risks. This paper studies the question of whether China needs a higher standard of information transparency in order to protect against its risks against the background of digital transformation. We analyzed the determinants of securitization in the Chinese banking sector, relying on data on banks for two periods: pre-2017Q4 and post-2017Q4. The main findings of the paper demonstrate that the application of FinTech in China’s banking industry resulted in less information asymmetry. The risk exposure was the most significant determinant in general. Higher risk exposures increased securitization transaction volumes, which reflects securitization with adverse selection problems between the originator and investors. Liquidity and profitability, as important determinants indicating the moral hazard problem, also affected securitization pre-2017Q4, but liquidity and profitability were found to be unimportant determinants after the application of FinTech (the post-2017Q4 period). Moreover, this study finds that the effects of the adverse selection and moral hazard problems varied in different types of banks. Overall, our findings suggest that the Chinese securitization market needs a higher standard of information transparency.

1. Introduction

E-commerce and FinTech are currently booming in China. The growing consumer market is accompanied by internet finance, by which consumers can easily borrow money from financial institutions through online platforms. As a result, the growing risks of the financial institutions are of concern to the government and regulatory bodies. Consequently, the securitization market in China has grown rapidly in recent years. Securitization in China has experienced a great increase since 2014, and it is now the second-largest securitization market in the world (Hogan Lovells 2019). The main reason for this rapid growth is the simultaneous release by the China Banking Regulatory Commission (CBRC) and the China Securities Regulatory Commission (CSRC) of documents to implement a reform that replaced the approval system for asset securitization with a filing system (Tang et al. 2017). Due to financial disintermediation and the need for central banks to establish interest rate corridors, commercial banks are increasingly enriching their asset allocation choices, which also influence the investment in securities (Huang et al. 2019). In 2019, the total volume of ABS issued in China reached USD340 billion, marking a 16.69% increase compared with 2018. The total outstanding volume of ABS by the end of 2019 stood at USD566 billion, a 27% increase compared with 2018 (Phua 2020). The remarkable growth of securitization in China is similar to that in the United States before the global financial crisis of 2007–2009. The securitization market in the United States also experienced rapid growth before the global financial crisis from 2007 to 2009. Many commentators cite the remarkable growth of securitization in the United States as a major contributor to the ensuing crisis. Part of the argument is that securitization creates an additional layer of information asymmetry in the origination of a loan, which results in adverse selection, moral hazard problems, and thus higher default rates. China’s securitization market, as mentioned, has also experienced remarkable development. The question of whether securitization affects the financial stability in China has yet to be answered and is a growing concern for authorities. The answer might depend on the standard of information transparency, and a high degree of information transparency will always benefit an authority’s monitoring activities and help to protect investors.
One of the effective ways to improve the standard of information transparency is to apply FinTech and emerging technologies in the securitization market against the background of the digital transformation of banking. Due to the new digital giants in China—Alibaba and Tencent—and the COVID-19 pandemic, traditional Chinese banks have tended to increase their focus and efforts on digital transformation. For example, some of these traditional banks have leveraged FinTech and emerging technologies, such as machine learning, artificial intelligence, big data, cloud computing, and blockchain, to shape their operating model enterprise-wide. Machine learning and artificial intelligence have had a strong impact on credit risk management, which can be used to deal with the problems of information asymmetry (Mhlanga 2021). According to Deloitte’s (2018b) report, cloud computing, big data, artificial intelligence, and blockchain technology entered the stage of comprehensive application in the banking industry in 2018, and “FinTech”, “Inclusive Finance”, and “Asset Management” have become key words in many banks’ annual reports. FinTech and emerging technologies have also been applied in the securitization market to enhance its standard of information transparency. More specifically, all loan data can be placed on a blockchain. Those loan data thus become immutable and are time-stamped on a verifiable audit trail (Structured Finance Industry Group & Chamber of Digital Commerce 2017). Blockchain technology could be used to automatically share and analyze data in line with regulatory requirements; underlying loans, for example, could be easily and automatically matched against the securitization’s proposed structure, thus making compliance easier (Sindle et al. 2017).
It is currently unclear whether the digital transformation of banking can reduce the impact of information asymmetry and whether information transparency regulations are sufficient for the supervision of securitization or the need to leverage FinTech and emerging technologies. Thus, this study aims to answer the following question: Does China need a higher standard of information disclosure to protect against its risks? To answer this research question, we examined the potential moral hazard and adverse selection problems in securitization and compared those problems in two periods. The first period is pre-2017Q4 and the second period is post-2017Q4. Post-2017Q4 represents the stage of FinTech’s comprehensive application in the banking industry.
The moral hazard and adverse selection problems can be tested by the motivations for the securitization of loans. More details and reasons can be found in Section 2. The original research on the determinants of the securitization of loans emerged during the 1980s, when a strand of U.S. research studied loan sales, an instrument that is similar to loan securitization (Giddy 1985; Pavel 1986; Pavel and Phillis 1987). Giddy found that capital requirement is an important determinant for loan sales. Pavel and Phillis (1987) proved that securitization provides a means of reducing a bank’s credit risks. After the global financial crisis of 2007–2009, research in this area resurfaced. The starting research was on the determinants of European banks’ engagement in loan securitization (Bannier and Hänsel 2008). They examined firm-specific and macroeconomic factors that drive financial institutions’ decisions to engage in loan securitization transactions. Bank size, credit risk, liquidity, and performance are the four main factors of load securitization transactions in European banks. Two similar papers then reported an empirical study on Italy and Spanish loan securitization markets, respectively (Affinito and Tagliaferri 2010; Cardone-Riportella et al. 2010). The result of the study from Affinito and Tagliaferri (2010) is similar to that of Bannier and Hänsel. However, Cardone-Riportella et al. (2010) claimed that liquidity and performance are the only two decisive factors in securitization. Credit risk is not the main determinant. Acharya et al. (2013) also found that risk exposure failed to promote increased securitization growth, which means that banks were securiting without transferring the risk to investors. Recently, the topic on the determinants of loan securitization in European banks was studied again (Farruggio and Uhde 2015), and the determinants of loan securitization in the pre-financial crisis and the post-financial crisis were compared. The determinants of loan securitization changed remarkably over the pre-crisis and crisis periods.
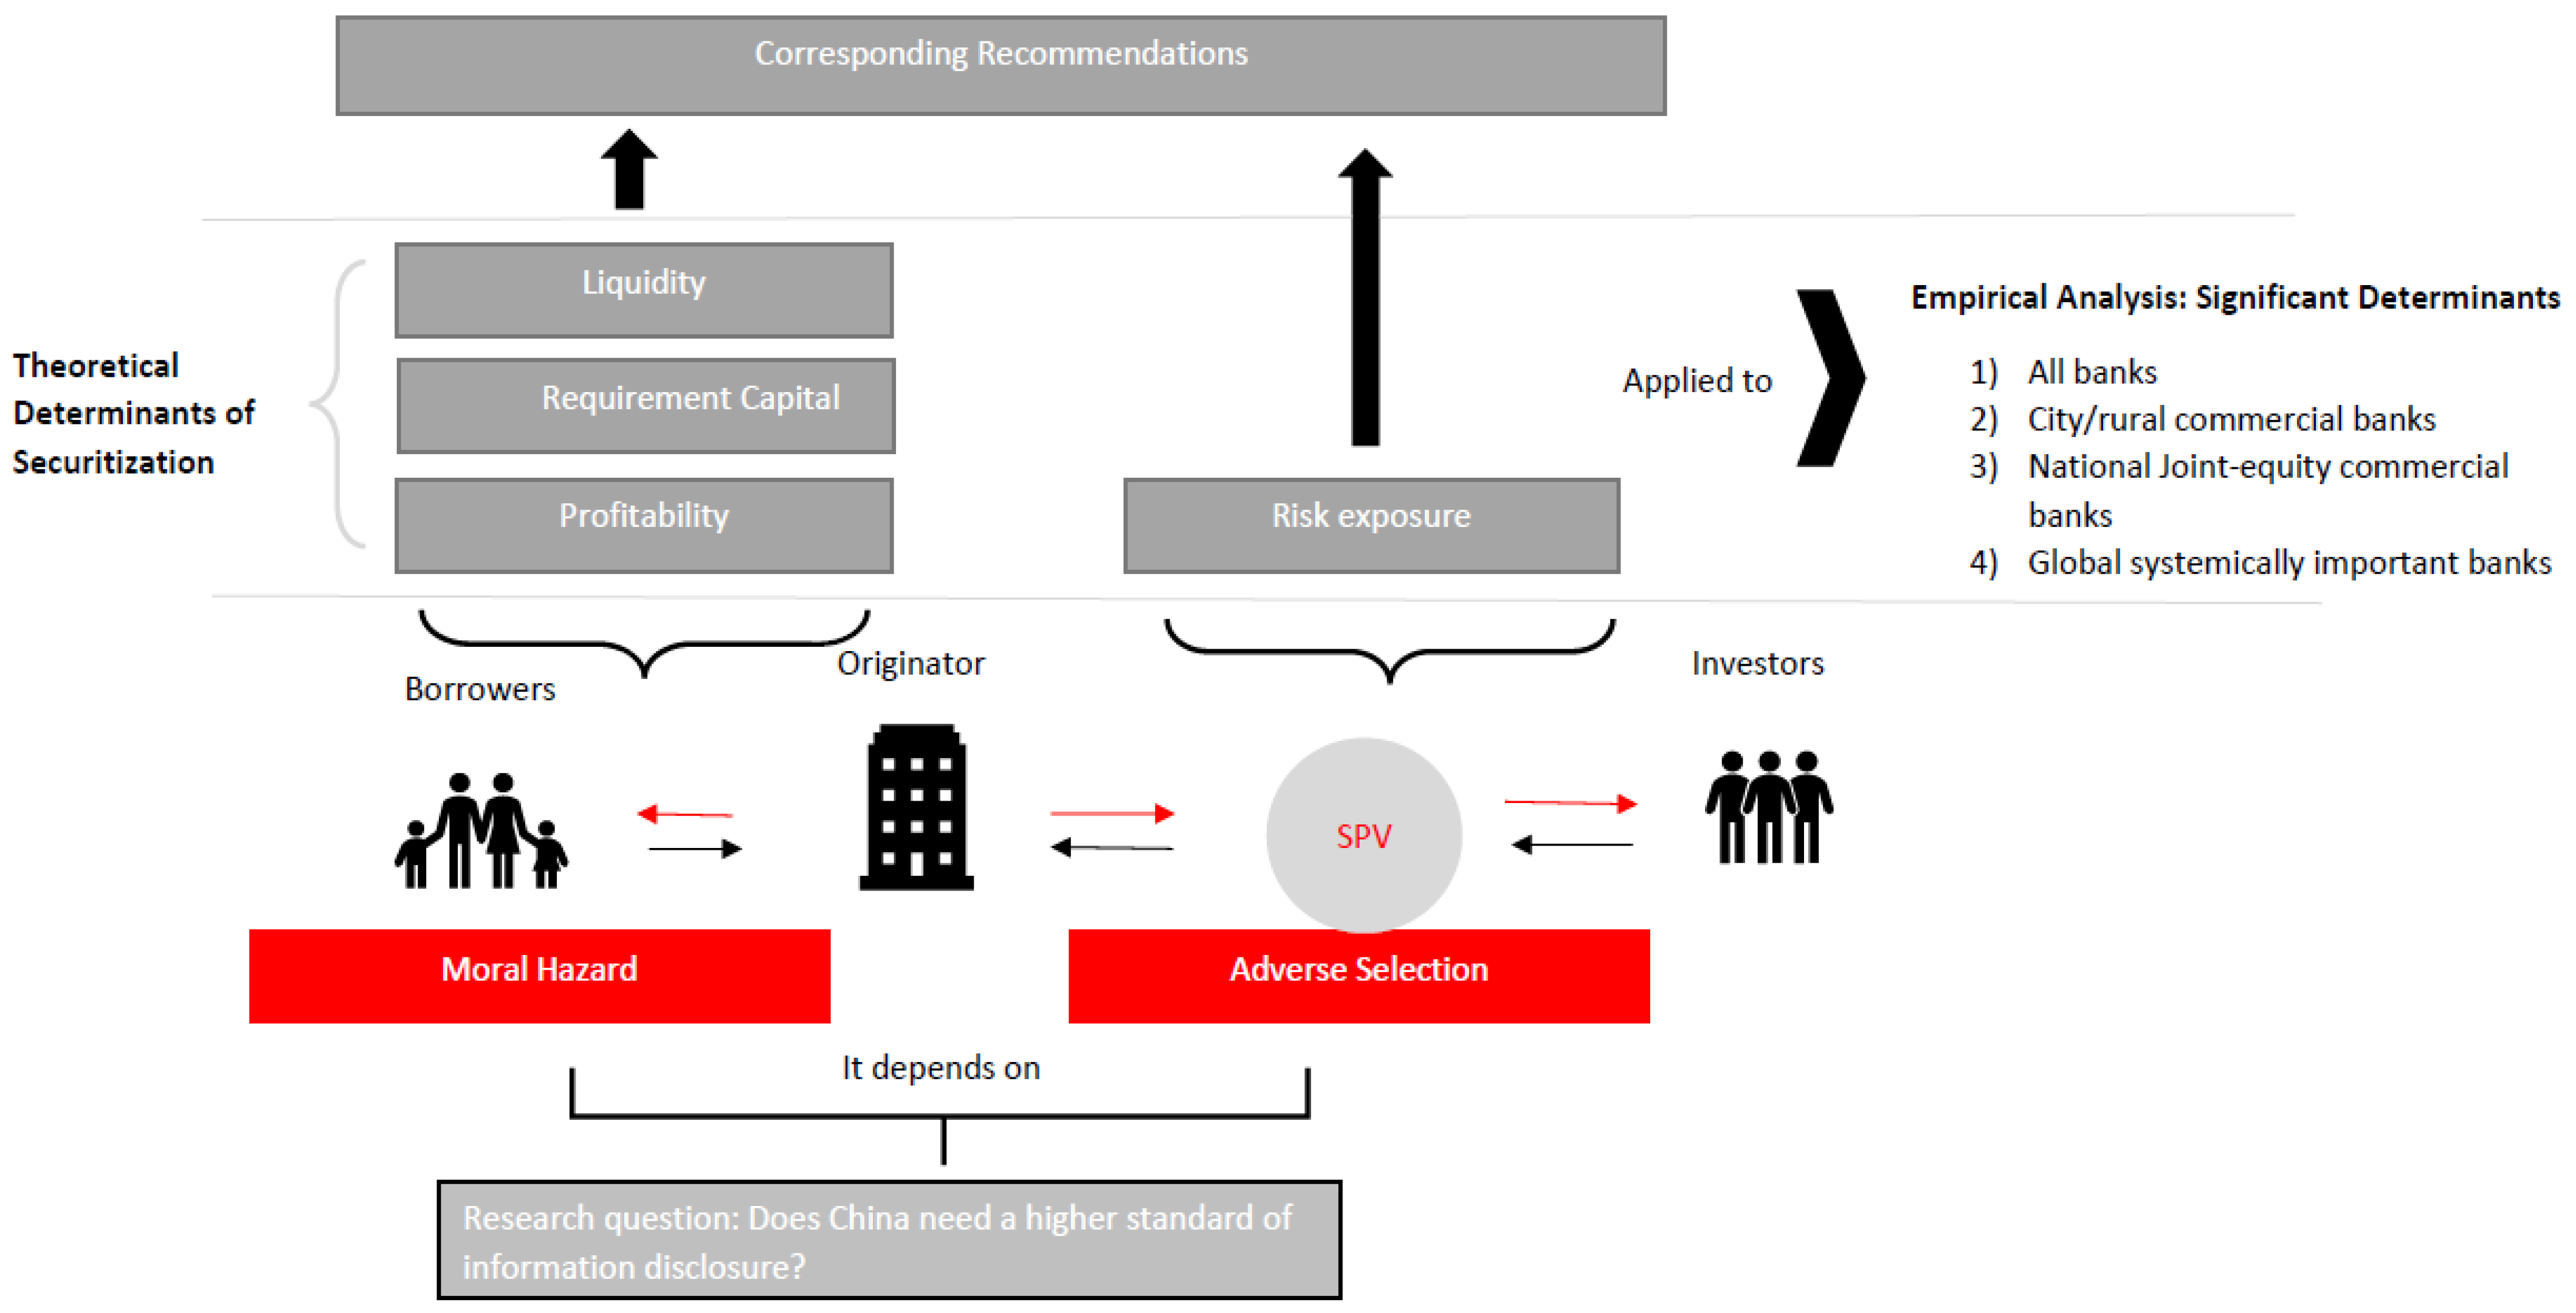
In accordance with these recent journals, (1) the first contribution of this paper is to study the determinants that drive securitization in the Chinese banking section. Markets in different regions and countries reflect the varying outcomes of securitization determinants. The determinants of securitization in China might be quite distinct from previous research. This paper compares the determinants in different types of bank, and how securitization in these various types of banks are affected by the determinants. (2) Additionally, this study proposes and explains why the four determinants mentioned above can be used to examine the problems of information asymmetry in securitization. Specifically, a securitization determinant study reflects not only the motivation of securitization in the banking section, but also the financial stability. Financial stability is influenced by information asymmetry. Information asymmetry is reflected by moral hazards and adverse selection. Moral hazards and adverse selection are tested by the four determinants. After examining how these four determinants are related to the moral hazard and adverse selection problems in securitization, we can then assess whether current information transparent standards are sufficient for securitization development in China. (3) Finally, this study investigates the effect of FinTech in China’s banking sector by comparing the change in securitization determinants in the two periods.
Summarizing our results, we find that the risk exposure is the most significant determinant, followed by liquidity and profitability before the comprehensive FinTech application in China. After that, risk exposure is still the motivation of securities issuance, but there is no evidence that liquidity and performance can promote loan securitization transactions. Capital requirement could be the motivation for securities issuance in commercial banks. Additionally, by comparing the outcomes of the determinants at two stages, this study finds that the application of FinTech can reduce information asymmetry in the securitization market dramatically, especially for moral hazards. However, we still cannot fully reject the influence of banks’ incentives on risk transfers to outside investors after a comprehensive FinTech application. Therefore, the answer to the research question is that China still requires a higher standard of information disclosure to protect against its risks. The remainder of the paper is organized as follows: Section 2 provides the theoretical background and summarizes earlier empirical evidence on securitization determinants, followed by the theories of adverse selection and moral hazards. In Section 2.3, we will explain how those securitization’s determinants are linked to adverse selection and moral hazards. Subsequently, Section 3 presents the empirical methodology, a data description, and variable definitions and empirical models. Empirical results are presented in Section 4, where both univariate analysis and multivariate analysis are given. According to the empirical results, Section 5 will discuss the findings and link them to the adverse selection and moral hazard problems. Section 6 will provide corresponding recommendations. Section 7 concludes.

2. Theoretical Foundation

2.1. Determinants of Loan Securitizations

The research addressing the reasons for securitizations includes the need for new sources of funding (liquidity), credit risk management (risk exposure), the search for new profit opportunities (regulatory capital arbitrage), and performance.

2.1.1. Liquidity

The first reason to securitize an asset is an alternative source of funding. Banks can transform loans into cash by the securitization mechanism (Kothari 2002). This mechanism is typically related to ‘true sale’ transactions when a bank transfers parts of loan portfolios to SPV (Special Purpose Vehicle) and in turn receives liquidity from the issuance of loan-backed securities by the vehicle (Farruggio and Uhde 2015). In this way, banks can acquire alternative funding resources in a new way beyond traditional equity, as well as debt financing. Thus, securitization makes banks less vulnerable to liquidity shocks.
The empirical evidence clearly shows that the liquidity effect is a significant determinant for loan securitization in European markets. Cardone-Riportella et al. (2010) found that liquidity is one of the main factors that drives securitization in Spain according to a sample of 408 observations in the pre- and post-financial crisis. The same conclusion can be found in Italy during the period from 2000 to 2006 (Affinito and Tagliaferri 2010). Similarly, Bannier and Hänsel (2008) found that low liquidity triggered securitization issuances from 17 European countries between 1997 and 2004.

2.1.2. Risk Exposure

Securitization enables banks to lower risk exposure through credit risk transfers. It is related to ‘true sale’ transactions and the ‘bankruptcy-remoteness’ principle. When a bank transfers parts of loan portfolios to SPV, the corresponding loans are also removed from the bank’s balance sheet, and the underlying assets from the bank are isolated. After that, investors do not have any claims against the bank’s assets once a default or bankruptcy occurs. The ‘true sale’ transaction and the ‘bankruptcy-remoteness’ mechanism allow credit risk sharing with investors, and banks do not have obligations to maintain value and reap the excess returns. The risk exposure is distributed by securitization rather than held by one bank, which minimizes the financial distress cost. Early theoretical journals proved that securitization provides a means of reducing a bank’s credit risks by this mechanism (Greenbaum and Thakor 1987; Pavel and Phillis 1987). However, in some cases, credit risks are difficult to transfer out of banks, because the originator generally retains the first-loss tranche (low- or zero-rated securities). This means that risks inherent to the securitized assets are considered in the banks but off-balance sheet (Calomiris and Mason 2004; Higgins and Mason 2004). The other problem is that the transfer of low-quality loans to SPV could lower a bank’s reputation, and only those banks with reputational advantages can repeatedly enter the securitization market and place multiple transactions (Ambrose et al. 2005).
Corresponding to the theoretical predictions, the empirical evidence is ambiguous. Some empirical studies, including those of Minton et al. (2004) and Bannier and Hänsel (2008), show that credit risk exposure is important for banks’ securitization decisions, while other empirical evidence indicates that, compared with risk transfers, issuing banks prefer to retain low-risk loans in their portfolio and remove high-risk loans from the balance sheet to build their reputation (Altunbas et al. 2010; Ambrose et al. 2005; Albertazzi et al. 2015).

2.1.3. Regulatory Capital Arbitrage

Banks can reduce regulatory capital via securitization because of the different capital requirements between the bank’s assets on the balance sheet and those within the first-loss piece. Under the First Basel Capital Accord (Basel I), because the amount of required regulatory equity capital was comparably low when securitizing banks’ assets, banks were able to provoke arbitrage profit by keeping the largest part of default risks (e.g., corporate and retail loans) within the first-loss piece rather than keeping them on banks’ balance sheets (Ambrose et al. 2005; Calomiris and Mason 2004). However, before the financial crisis of 2007–2009, the Basel commitment required a higher standard regarding regulatory capital to improve financial stability (Basel II), and this resulted in fewer opportunities of regulatory capital arbitrage. Basel II follows a ‘substance over form principle’, which more precisely determines the required regulatory capital for all retained tranches of a securitization (Blum 2008) and strongly stimulates incentives to transfer subordinated tranches and the first-loss piece to external investors (Farruggio and Uhde 2015).
The empirical evidence on the regulatory effect is also ambiguous. There is no strong evidence indicating an opportunity to realize regulatory capital arbitrage spur securitizations in U.S. banks from 1993 to 2002 (Minton et al. 2004). By contrast, other U.S. securitization market research yielded different outcomes by employing 112 financial institutions from 2001 to 2005 (Uzun and Webb 2007). Ambrose et al. (2005) provide a similar conclusion and noted that securitization is driven by regulatory capital arbitrage.

2.1.4. Performance

Apart from the factors discussed above, performance is another determinant of securitization because of the accounting benefits, intermediation profit, and higher liquidity. First, securitization allows banks to acquire accounting benefits when the book value is less than the market value of the loans, and an overvaluation of the retained interest is carried at a fair market value in the case of securitizations (Niinimaki 2012). Moreover, banks can acquire an intermediation profit via the specific design in terms of securitization loans rather than long-term warehousing (Duffie 2008). Additionally, Lockwood et al. (1996) suggest that cash inflows from securitization can be used to retire existing debt, which in turn reduces interest expenses and increases reported earnings. In spite of those potential benefits, the downsides of securitization should not be forgotten, including the fixed costs of setting up an SPV and a potential reduction in the flow of tax benefits when the assets are kept on the balance sheet and financed with debt (Calmès and Théoret 2010).
Empirical studies show the ambiguous outcomes of bank performance. Cardone-Riportella et al. (2010) presented supporting theoretical arguments indicating that more efficient and larger banks securitize their loans more frequently and may issue greater transaction volumes. On the other hand, Affinito and Tagliaferri (2010), based on a study of Italy, concluded that less capitalized and riskier banks with less liquidity are more likely to securitize their loans. Bannier and Hänsel (2008) showed that bank efficiency and size might be important determinants of securitization, while their results reveal that less profitable banks have much greater incentives to securitize their loans.

2.2. Securitization and Information Asymmetries

2.2.1. Asymmetric Information in Securitization

Information asymmetry is a condition wherein one party in a relationship has more or better information than another (Bergh et al. 2018). Information about securities’ intrinsic values is asymmetric, due to the long chain of structures inherent in the securitization process, resulting in a loss of information about the quality of the underlying loans (Gorton 2009). In addition, ‘marketing-to-market’ is not feasible in the securitization market; in such cases, valuations often involve ‘marketing-to-model’, which does not reflect a true market price and is associated with information asymmetry (Dowd 2009). Generally, sellers have better information about the deteriorating quality of loans than potential buyers, because most sellers (dealers) are either fully integrated or partially integrated by engaging in some process of the securitization chain; in addition, by owning an originator, sellers also have information on the quality of the originations, since the gains to acquiring better information on the quality of securities are perceived to be small, and consideration to potential buyers is not needed to value the underlying collateral in the securities. Frequently, buyers take the simpler approach of using credit agency ratings or standard copula models, which do not value the underlying securities directly (Beltran et al. 2017).

2.2.2. Adverse Selection in Securitization

Information asymmetries are hard to avoid in the securitization market and will contribute to adverse selection and moral hazard problems. The adverse selection problem appears when two (or more) individuals are about to contract on a trade and one of them happens to have more information than the other(s). Seminal contributions were made by Akerlof (1970), Spence (1978), and Rothschild and Stiglitz (1976), applying adverse selection to the product, labour, and insurance market, respectively. They stated that the information-advantaged individuals always hide key information and mislead other individuals’ decisions, which could result in a threat to information-disadvantaged individuals’ benefits and even drive market prices down. For example, buyers might not be able to distinguish between a high-quality car (a ‘peach’) and a low-quality car (a ‘lemon’), while the seller knows what he/she holds. If the buyer is only willing to pay a fixed price for a car at the fair value (pavg), the seller will sell ‘lemons’ out (since plemon < pavg) and hold ‘peaches’ (since ppeach > pavg). Eventually, the number of ‘lemon’ sellers increases, and ‘peach’ sellers tend to leave the market, which would drive high-quality cars from the market and contribute to a market collapse (Akerlof 1970).
Banking and financial institutions are associated with adverse selection in the securitization market because of information asymmetries. According to the ‘market for lemons’ theory, the sellers (originators) with an information advantage will sell inferior-quality or low-quality loans to their potential buyers (investors) but retain the high-quality loans on their balance sheet via securitization. In the empirical research, the commercial mortgage-backed security (CMBS) market in the U.S. was shown to be consistent with theoretical predictions of a lemon discount; after controlling for observable determinants of loan pricing, conduit loans enjoyed a 34-basis-point pricing advantage over portfolio loans (An et al. 2011). On the contrary, some empirical evidence reflects that some financial institutions aim to build their reputation for not selling lemons to the securitization market. Lenders typically obtain soft and hard information to evaluate the credit quality of a borrower (Petersen 2004; Agarwal and Hauswald 2010). Soft information compared with hard information cannot be credibly transmitted to the market when loans are securitized. Banks securitize loans that have a relatively low amount of soft information (Drucker and Puri 2009), meaning banks retain low-default-risk loans in their portfolios. Likewise, collateralized loan obligations, as a kind of securitization, also prove that adverse selection problems in corporate loan securitizations are less severe than commonly believed (Benmelech et al. 2012). Unlike the aforementioned studies, Agarwal et al. (2012) found that the securitization strategy (adverse selection or not) of lenders changes with the financial environment; specifically, banks generally sold low-default-risk loans into the market but retained high-default-risk loans in their portfolios before the financial crisis, while most banks in financial crisis showed a pattern of adverse selection.

2.2.3. Moral Hazard in Securitization

On the other hand, a situation in which information asymmetry occurs after an agreement is obtained between individuals is called a moral hazard. The term “moral hazard problem”, by extension, has been applied to the principal agent problem (Stiglitz 1989). Mirrlees (1999), Holmström (1979), and Grossman and Hart (1983) have made key contributions to this area. They found that, once the contract has been signed, the agent takes advantage of hidden action and hidden information and can take more risks, because the principal bears the cost of the risks. For example, once a car insurance contract is signed, the insurance company (the principal) observes whether or not the driver is careful enough, and the driver (the agent) might not drive carefully because the insurance company bears the cost of the accident (Mirrlees 1999). A moral hazard also affects securitization market risks once the information asymmetry between lenders and securitization issuers (SPV) increases. When the lending bank sells loans, the bank no longer bears the full cost of default and thus will choose to screen the borrower less than the efficient amount; the moral hazard problem can arise if securitization issuers are naive about lender screening (Dell’Ariccia et al. 2008; Mian and Sufi 2009).
According to the empirical studies, Keys et al. (2008) found that securitization under a moral hazard leads to lax screening, which is consistent with the theoretical result. Specifically, they stated that mortgage purchasers follow a ‘rule of thumb’ in deciding which loans to purchase: for exogenous reasons, they are willing to buy mortgage loans given to the borrowers with Fair Isaac Corporation scores (FICO scores) above 620. However, the default ratio of borrowers with scores higher than 620 is higher than that of borrowers with scores below 620. This is strong evidence that securitization does result in lax screening by lenders. However, Bubb and Kaufman (2014) re-examined the credit score cut-off evidence with a new dataset and through a theoretical lens that assumes rational equilibrium behaviors in comparison with moral hazards in the securitization market.

2.2.4. Adverse Selection and Moral Hazard and Financial Stability

Both adverse selection and moral hazards in securitization affects financial stability and even leads to significant consequences. Adverse selection does not affect the financial market under normal economic conditions; however, as the price falls with an economic downturn, the impacts of adverse selection—an increase in uncertainty of asset value, a flight to liquidity, and a miss assessment of systemic risks (Kirabaeva 2010)—are identified by investors. Buyers (buyer panic) are afraid to invest in overpriced assets (‘lemons’), which results in trading in those assets that may diminish or halt altogether. Moreover, overpriced assets lose their ability to serve as collateral for other transactions, which contributes to a credit crunch (Kirabaeva 2011). The moral hazard is the other important factor that affects financial stability. Under the ‘Originate-to-Distribute’ model, investors bear bank risks via buying banks’ securitization, which often leads to socially excessive risk-taking (e.g., lax screening) (Dowd 2009).

2.3. The Relationship between Determinants and Adverse Selection and Moral Hazard

Based on Section 2.1, loan securitization determinants are liquidity, credit risks, regulatory capital arbitrage, and performance. Each factor reflects the different potential benefits and risks for both securitization sellers and buyers. Summarizing Section 2.2, sellers have more information about the quality of underlying loans than the potential buyers, which could result in adverse selection and moral hazards. This paper considers the adverse selection in securitization that is reflected in credit risk transfers. The bank, as the originator, knows more about the quality of underlying loans than investors. When a securitization transaction involves information asymmetry, banks transfer low-quality loans to SPV and sell them to investors with overvalued prices. With regard to moral hazards, banks that securitize their loan will generate higher profitability because investors bare those risks.
This paper aims to determine whether securitization leads to adverse selection and moral hazards through studying the determinants of securitization in the banking sector. The securitization mechanism is divided into two sections in Figure 1. Adverse selection is reflected on the right side of the figure. It mainly occurs between the originator and investors. If securitization is used as a way to transfer credit risks, a large amount of low-quality loans move into SPV and are then sold to investors. Thus, the risk exposure determinant reflects the motivation of risk transfers and is used to examine adverse selection in securitization transactions. The moral hazard is shown by whether or not banks change their behaviors and their willingness to take risks, which occurs between borrowers and banks. Liquidity, regulatory capital arbitrage, and performance can be used to examine moral hazards. These different determinants show a bank’s behavioral change and change in potential risks. When securitization is used to increase bank liquidity, it might result in lax screening. If regulatory capital arbitrage drives bank securitization, banks tend to hold less capital as a cushion against asset malfunction. Improving profitability via securitization will suffer from the fixed costs of setting up an SPV and a potential reduction in the flow of tax benefits.

3. Material and Methods

3.1. Data Repository

There are 67 banks that have issued securitized securities in China since 2005 to 2017Q4, and only 35 banks that have issued these securities more than twice before 2017Q4. The remaining 32 banks have only issued once, and their securitization transaction volume is lower, so they were not included in this study. After 2017Q4, seven more commercial banks issued securities. The final dataset refers to the above 35 banks from 2007Q4 to 2017Q4 (quarterly) and 42 banks from 2007Q4 to 2021Q2 (quarterly). Data on securitization were drawn from the China Securitization Analytics website and Wind. Other data related to financial statements were collected from Bloomberg, Wind, and annual reports.

3.2. Definition of Variables

3.2.1. Explanatory Variables

The bank-specific variables used in our models are based on the literature review. The main regressors in this study include liquidity, risk exposure, capital requirement, and performance. We describe each variable and its expected effect in the following. Variable definitions and a summary of expected relationships are given in Table 1 and Table 2.

Liquidity

Following discussions in earlier research, this study considers two variables as proxies of the liquidity factor.
(1)
Net Loans/Deposits and Short-Term Funding (ND ratio): this ratio analyses the liquidity assets of a bank. Net loans are the total loans without the loan loss reserve. The higher the net loans, the lower the liquid assets.
(2)
Liquid Assets/Deposits and Short-Term Funding (LD ratio): this is the ratio of the value of the liquid assets (easily converted to cash) to the short-term funding plus deposits. Liquid assets include cash, cash collaterals, and due from banks. Deposits and short-term funding here include total customer deposits (current, saving) and short-term borrowings and repos.
According to the previous studies, because securitization involves a bank transforming its illiquid assets into liquid ones, one will expect a bank to be more predisposed to securitize part of its loan portfolio when its liquid assets are restricted. Therefore, liquid assets/deposits and short-term funding are expected to be positively related to the liquidity of a bank, while net loans/deposits and short-term funding are negatively related to it. Overall, the liquidity effect should be negative, since this paper expects weak banks to have greater incentive to be active in the securitization market.

Risk Exposure

This paper includes two proxies for the credit risk exposure—the loan loss reserves/total loans ratio and the impaired loans/total loans ratio.
(3)
Loan Loss Reserves/Total Loans (LL Reserves): This ratio estimates the quality of loans. Loan loss reserves cover a number of factors related to potential losses containing bad loans, customers defaults, and the renegotiated terms of loans that incur less often than previously estimated. Thus, the larger amount of loan loss reserves means a lower loan quality.
(4)
Impaired Loans/Total Loans (IT ratio): This measures the amount of total impaired loans (as a percentage). The lower impaired loans/total loans ratio corresponds to a better loan quality.
This study assumes that a bank with high credit risks suffers higher financial stress costs and therefore tries to address non-performing loans by securitization rather than by holding them on the balance sheet. Thus, banks with a higher credit risk exposure will securitize a large part of their assets.

Capital Requirement

With respect to the regulatory capital arbitrage hypothesis, this paper uses two proxies for measuring the capital cushion against asset malfunction.
(5)
Total Equities/Total Assets (TETA ratio): this ratio measures the amount of protection afforded to a bank by the amount of equity invested in the bank. Since equity is a basic cushion against asset malfunction, a higher equity-to-asset ratio means that the entity acquires the greater protection.
(6)
Capital Adequacy Ratio (Tier One Capital Ratio): this ratio measures a bank’s capital adequacy. It is the total capital adequacy ratio under the Basel standards. Under the requirement of Basel III, the minimum tier one was increased to 6%: 4.5% of the common equity tier one (CET1) plus 1.5% of an additional tier one (AT1). According to regulations in China, the minimum tier one capital requirement for systemically important financial institutions is 9.5%, and that for non-systemically important financial institutions is 8.5%.
In line with theoretical arguments, we expect that banks in general holding less regulatory capital will suffer from the pressure of regulatory compliance. Poorly capitalized banks may be generally more prone to realize regulatory capital arbitrage through securitization.

Performance

The cost-to-income ratio and the return on assets ratio are used to monitor the effect of performance.
(7)
Cost to Income Ratio (CIR ratio): this ratio is also called the efficiency ratio and indicates the amount of operating expenses as a percentage of the operating revenue. This ratio reviews how efficiently a bank is being run; a high CIR ratio reflects low efficiency and poor performance.
(8)
Return on Assets (ROA ratio): this ratio shows how profitable a bank is relative to its total assets.
It is difficult to expect how performance affects securitization. Previously published studies have not yielded conclusive results in terms of performance.

Dependent Variable

To control for the bank size effect of the dependent variables, the securitization transaction volume is scaled by the entity’s total assets. The sample was collected from 35 securitizing banks, and their total transaction volume is around CNY 1.2 trillion.

3.3. Empirical Model

This paper employs fixed effects and random effects estimation methods on panel data in order to compare the determinants of banks’ engagement in loan securitizations pre- and post-2017 in China. Panel data (also called longitudinal data) embodying information across both time series and cross sections (entities) are multi-dimensional (Diggle et al. 2002). The sample of this study comprises panel data on 35 banks across 7 years and 42 banks across about 11 years for analysis. There are broadly two classes of panel estimator approaches, fixed effects and random effects models, that can be employed in this research. These two models are normally employed to obtain a function that predicts whether an observation belongs to a particular group or when trying to analyze the influence of a series of independent variables on the dependent variable (in our case, the three bank-specific determinants that may influence the amount of securitization). The unobserved variables can have any associations with the observed variables in the fixed effects model, while the unobserved variables are assumed to be uncorrelated or more strongly statistically independent than all of the observed variables in a random effects model. It is difficult to determine whether or not the unobserved variables in this case are statistically independent of the four bank characteristics. To determine the appropriate model, we used the Hausman test. If the probability in the Hausman test is larger than or equal to 0.95 and less than or equal to 1 (0.95 ≤ Prob. ≤ 1), it is suggested that the error term is not correlated with the independent variables, the hypothesis is not rejected, and the random effects model should be applied for an analysis. By contrast, if the probability is too low, the unobserved variables are related to the observed variables, and a fixed effects model will be acceptable.
The empirical models are as follows:
( Transaction volumes / total assets ) i , t = β 0 + β 1 ( liquidity   ratio ) i , t 1 + β 2   ( credit   risk   ratio ) i , t 1 + β 3 ( capital   adequacy   ratio ) i , t 1 + β 4 ( performance   ratio ) i , t 1 + ε i , t 1  
( Transaction volumes / total assets ) i , t = β 0 + β 1 ( net deposit / deposit and   S . T   funding ) i , t 1 + β 2   ( liquidity assets / deposit and   S . T   funding ) i , t 1 + β 3 ( loan   loss reserves / total loan ) i , t 1 + β 4 ( impaired loans / total loan ) i , t 1 + β 5 ( capital   adequacy   ratio ) i , t 1 + β 6 ( equities / assets ) i , t 1 + β 7 ( CIR ) i , t 1 + β 8 ( ROA ) i , t 1 + ε i , t 1  
Here, ( Transaction   Volumes / Total   Assets )   i , t is the dependent variable. β 0 is a common intercept that is the same for all cross-section units and over time. ε i ,   t 1 is the cross-sectional error term. Decisions of securitization issuances are according to published financial statements. Since the securitization transaction volume is not synchronous with the current financial statement data, this paper expects that the securitization transaction volume/total assets is related to the explanatory variables at t − 1 (a quarterly ago). The variables in Equation (1) are calculated according to the above settings. The independent variable liquidity ratio is made up of a liquid assets/deposits and short-term funding ratio and a net loans/deposits and short-term funding ratio (see Table 1). The other three independent variables’ calculations are the same as those for the liquidity ratio, which are the sum of two corresponding proxies. Equation (2) can provide a more intuitive analysis of these variable formations.

4. Results

4.1. Univariate Analysis

4.1.1. By Bank Type

For the study of how bank-specific determinants drive loan securitization in the whole banking industry and in different types of banks, the sample is divided into four types of bank. First, the whole sample is divided into policy banks and commercial banks (see Table 3). Policy banks in China are responsible for financing economic and trade development and state-invested projects according to policy (Turner et al. 2012), namely the China Development Bank, the Import and Export Bank of China, and the Agricultural Development Bank of China. However, China has approved further reforms to those banks (State Council 2015). The remaining banks are commercial banks. The main difference between these two types of banks is that policy banks provide services for policy-related lending, while commercial banks aim to pursue higher profits.
Commercial banks are further divided into two kinds of bank according to asset scale, namely, city/rural commercial banks and national commercial banks. City/rural commercial banks’ assets are much smaller than the other two types of bank and are only found on the basis of urban credit cooperatives (KPMG 2017a), while national commercial banks are able to operate across the country and have assets that are larger than those of city/rural commercial banks.

4.1.2. Independent Variable Comparison

Comparing independent variables of different types of banks can give us their specific characteristics. This paper finds that policy banks have less liquidity and profitability; correspondingly, commercial banks have a greater advantage in these two areas. Studying commercial banks further shows that large-scale banks present less liquidity, lower credit risks, and more adequate regulatory capital for whole periods.
(1)
Policy banks versus commercial banks
The most significant differences between policy banks and commercial banks are in liquidity and performance, especially liquidity (see Table 4 and Table 5). The average liquidity ratio of policy banks can be around five times higher than that of commercial banks (364.4% versus 77.1%). The gap of the liquidity ratio became even wider after 2017, and the average performance between policy banks and commercial banks changed significantly. Variable risk exposure and regulatory capital were similar.
In order to investigate liquidity further (see Table 6 and Table 7), the liquidity variables were divided by (1) net loans/deposits and short-term funding (the ND ratio) and (2) liquid assets/deposits and short-term funding (the LD ratio). The ND ratio of policy banks is much higher than that of commercial banks (315.6% versus 51.7%), which indicates paradoxically that the loans provided by policy banks are around three times greater than their own deposits and short-term funding, which could result in poor liquidity. Even though policy banks on average acquire more liquidity assets compared to commercial banks (48.8% versus 25.2%), they still struggle with poor liquidity because of the massive amount of loans. After 2017Q4, the liquidity issue of policy banks was more serious. The ND ratio of policy banks was about 12 times higher than that of commercial banks.
Both (7) the cost-to-income ratio and (8) the return on assets (ROA) ratio were used to measure bank performance. The difference in the performance ratios between the policy banks and commercial banks is mainly caused by the ROA rather than the cost-to-income ratio. The cost-to-income ratio of the two types of bank are similar (44.1% in policy banks versus 41.1% in commercial banks). However, the cost-to-income ratio of policy banks became much higher than that of commercial banks after 2017Q4, which means that policy banks have higher operating costs. However, the mean of the ROA of commercial banks is much higher than that of policy banks. The ROA of commercial banks is 1.012, which is about 25% higher than that of policy banks. The high ROA of commercial banks reflects that commercial banks have a greater advantage in profitability than policy banks. This also indicates the different operating visions of these two types of bank; policy banks are for policy-related lending, while commercial banks pursue higher profitability.
(2)
(City/rural commercial banks versus national commercial banks
Commercial banks are a large part of our sample, which were divided into two types and analyzed further. On average, commercial banks with larger-scale assets presented less liquidity, lower credit risks, more adequate regulatory capital, and better performance before 2017Q4 (see Table 6 and Table 7). However, the city/rural commercial banks had an advantage in credit risks over national commercial banks after 2017, which improved their performance.
The ratios employed to measure the bank’s credit risks are (3) loan loss reserves/total loans (the LL ratio) and (4) impaired loans/total loans (the IT ratio). National commercial banks had a greater advantage in credit risk management compared with city/rural commercial banks before 2017. The LL ratio and the IT ratio of the city/rural commercial banks were much higher than those of the national commercial bank, which was as high as 3.6%. This indicates that banks with a larger scale are better at risk management. However, the LL ratio of the national commercial banks increased significantly and became much higher than that of the city/rural commercial banks, which caused those banks to lose their advantage in risk management.
Both the CIR and ROA variables, as banking efficiency or performance measures, show that the city/rural commercial banks’ performance was worse (43.4% and 101%) than that of the national commercial banks during the first period. Hence, banks with large-scale assets tend to have better performance. However, the profitability of both kinds of bank changed after 2017Q4, and their profitability tended to be similar.

4.1.3. Univariate Analysis

The previous analysis is based on part of an independent variable comparison. This section analyzes how those characteristics affect their securitization (dependent variables).
(1)
Policy banks versus commercial banks
The securitization transaction volume of commercial banks is much higher than that of policy banks for the two periods. The mean percentages of the transaction volume to total assets are 0.35% and 0.28% for the commercial banks, as opposed to 0.16% and 0.14% for the policy banks (see Table 6 and Table 7). The previous section shows that liquidity and performance are the two major different variables between policy banks and commercial banks for the whole period. Therefore, the liquidity and performance of banks might be two significant determinants that affect loan securitization. Entities resorting to securitization are net borrowers of funds in the interbank market and are seeking to improve its financial position.
Comparing (1) the ND ratio, (2) the LD ratio (liquidity measures), (7) the CIR, and (8) the ROA (performance measures), with higher liquidity and performance, banks acquire securitization issuances. The other two determinants, risk exposure and regulatory capital, also reflect the relationship with bank loan securitization. Risk exposure and regulatory capital are positively related to securitization transaction volume, even though their effects are limited.
(2)
City/rural commercial banks versus national commercial banks
The transaction volume to the total assets in commercial banks increased with their decreasing asset scale for the whole period, even though the amount of securitization issuance rose with a larger asset scale. The percentages of the transaction volume to the total assets regarding city/rural commercial banks was the largest (0.78% and 0.64%), much larger than those of national commercial banks (0.21% and 0.15%).
The previous section indicates that liquidity and performance are also significantly different variables for the two types of bank. Thus, this paper considers the difference in the securitization transaction volume to the total assets because of the important liquidity and performance before 2017Q4. After that, the liquidity and regulatory capital were the two significantly different variables, so the motivations for the securitization of commercial banks changed. Improving liquidity and regulatory capital arbitrage is expected to be the motivation of securitization after 2017Q4. The subsequent analysis will confirm whether this variable is statistically significant in the model.

4.2. Multivariate Analysis

4.2.1. Groups of Bank Samples

This paper focuses first on regression on all bank levels, followed by research on types of bank. The sample of banks is divided into three main groups, namely, (1) whole banks, (2) commercial banks, and (3) national commercial banks (see Table 8). Whole banks consist of all banks (policy banks and commercial banks); commercial banks are composed of city/rural commercial bank and national commercial banks. The national commercial banks are the last group studied.

4.2.2. Results of Four-Variable Regression

This paper examines four variables using a fixed effects model and a random effects model. According to the Hausman test, the probability of all results are lower than 95%, which means that the composite error term is correlated with all of the explanatory variables. Thus, a fixed model is more appropriate. The following analysis is based on the results of the fixed effects model (see Table 9, Table 10, Table 11 and Table 12).
(A) All banks
Liquidity and risk exposure were the two important determinants of securitization in China’s banking sector before 2017Q4, showing a confidence level of more than 99%. Compared with liquidity, risk exposure presents more a significant effect on loan securitization transaction volume, because the probability of securitizing increases given more variation in the dependent variable. When a bank’s risk exposure increased by one unit, the probability that a bank will opt for securities increased by 17.4% when the other variables were held constant. Risk exposure had a positive effect on securitization. The liquidity effect on loan securitization was limited. A one-unit liquidity change only resulted in a 0.1% securitization transaction volume adjustment. The higher risk exposure motivated banks to issue more loan securities. Additionally, banks with a lower liquidity could raise liquidity and funding via securitization.
Risk exposure was an important determinant for securitization only after 2017Q4, showing a confidence level of more than 90%. When a bank’s risk exposure increased by one unit, the probability that a bank will opt for securities increased only by 2.4% when the other variables were held constant, which is much lower than that before 2017Q4. Additionally, improving liquidity was not a determinant of securitization for all banks.
(B) Commercial banks
Consistent with all banks, liquidity and risk exposure were still the two important determinants of the loan securitization transaction volume. The risk exposure ratio was significant at a 99% confidence interval and with an obvious effect on the securitization transaction volume (a one-unit risk exposure rise corresponds to a 15.7% change in securitization transaction volume). Liquidity was only in the 90% confidence interval, so it is not as important as risk exposure.
The motivation for commercial banks’ securitization issuance was similar to the other banks. Risk exposure was the only determinant after 2017Q4.
(C) National commercial banks
The determinants of securitization in national commercial banks were completely different from the previous two groups before 2017Q4. Capital requirements and profitability were two important determinants in this group. Capital requirements, compared with performance, was more significant with respect to securitization. When a bank’s regularity capital decreased by one unit, the probability that a bank would opt to securitize increased by 2.7%. With a lower regularity capital, the banks acquired a higher securitization transaction volume, which could reflect securitization as a way to search for new profit opportunities. The profitability variable was statistically significant, indicating that banks are using securitization to raise their performance, but its effects on national commercial banks are limited (only a 0.1% regression coefficient).
However, capital requirements and profitability were not the determinants of securitization after 2017Q4. The table shows that risk exposure was still the determinant for national commercial banks, which was significant at a 99% confidence interval.

4.2.3. Results of Eight-Variable Regression

In Table 11 and Table 12, as with the four-variable regression analysis, both the random effects approach and the fixed effects approach were applied in this regression. According to the Hausman test probability, the fixed effects model is valid.
To further confirm the findings, eight-variable multivariate analysis was conducted. Each determinant was evaluated by two proxies, introduced in the methodology section. If both of two variables were in a confidence interval greater than 90%, the determinant was considered to drive securitization issuances. Additionally, if only one variable was statistically significant in relation to the transaction volume, its influence on securitization was concluded.
(A)
All banks
Liquidity and risk exposure were the main drivers of loan securitization in the Chinese banking sector, which is basically consistent with previous results, but performance was also a significant driver of securitization in the eight-variable regression before 2017Q4. Specifically, (3) the LT ratio and (4) the IT ratio as risk exposure measures were statistically significant. The coefficients of (3) the LT ratio and (4) the IT ratio were 10.9% and 36.6%, respectively, and appear to exert the most influence on the probability that a bank opts to securitize, compared to the other variables. (1) The ND ratio as a proxy of liquidity indicates statistical significance at the 5% level. While the liquidity effect was limited, the one-unit ND ratio rise only improved securitization truncation volume by 0.1% in all banks. Even though this regression result indicates that securitization can be used as a way to improve a bank’s performance, the coefficient of this ratio is too small, so its effect is limited. (8) The ROA ratio variable as a profitability measure is the least statistically significant determinant among the four basic determinants proposed in the literature.
After 2017Q4, reducing capital requirement and risk exposure was the main determinate for the whole banks. Specifically, (4) the LT ratio was statistically significant, but the coefficients of that ratio were much lower than that before 2017Q4. Both (5) the TETA ratio and (6) the ROA ratio are related to loan securitization issuance. However, they are both significant at a 90% confidence interval.
(B)
Commercial banks
In the group of commercial banks, all four determinants affected loan securitization before 2017Q4 but to varying extents. Risk exposure, compared with the other determinants, was the most significant for securitization. Two variables, (3) the LL ratio and (4) the LT ratio, presented statistical significance at the 99% confidence level. The coefficients of both ratios were also the highest compared to the other variables—11.1% and 30.2%, respectively. Liquidity was the second most significant determinant. (1) The LD ratio measuring liquidity was related to loan securitization. These two determinants are consistent with the four-variable regression. The capital requirement and performance were statistically significant, which also motivates banks to securitize part of its portfolio, but not as significant as risk exposure and liquidity. (6) The tier one ratio (capital requirement measures) and (8) the ROA ratio (profitability measures) were statistically significant, but only in the 90% confidence interval, so they were the least statistically significant. This might explain why neither of them were significant in relation to loan securitization in the four-variable regression. The coefficient value of (8) ROA (performance proxy) was close to zero. Using securitization as a mechanism for improving a commercial bank’s performance does not seem to be very efficient.
The motivation for the securitization issuance of commercial banks was only regulatory capital arbitrage after 2017Q4. Reducing risk exposure and increasing liquidity and performance were no longer determinants of securitization issuances. (6) The tier one ratio (capital requirement measures) was statistically significant but only in the 95% confidence interval.
(C)
National commercial banks
Regularity capital was the only driver of securitization activities in national commercial banks. (5) The TETA ratio measuring capital requirement was the only variable with statistical significance. Profitability was an important determinant for securitization in the four-variable regression, but (7) the CIR and (8) ROA variables measured as bank profitability did not reach statistical significance in the eight-variable regression. This leads to a new conclusion: Regulatory capital, rather than performance, is the only determinant that appears to exert the most influence on loan securitization. National commercial banks could lower their regularity capital (regulatory capital arbitrage) via securitization. Interestingly, risk exposure was no longer a significant determinant for a bank’s securitization decisions in the national commercial banks. This is completely different from all other banks.
Risk exposure was the other determinant of securitization issuance after 2017Q4. The risk exposure and regularity capital were two main drivers of securitization activities in national commercial banks. Specifically, (4) the IT ratio, measured as a bank’s risk exposure, reached statistical significance at the 99% confidence level. (7) The CIR and (8) ROA variables were also statistically significant.
In summary, the results of the eight-variable regression are basically consistent with the four-variable regression, but they also revealed some new important determinants for securitization. Specifically, securitization transaction was motivated by both risk exposure and liquidity, risk exposure especially in the first period, but was still motivated by risk exposure after 2017Q4. However, the eight-variable regression shows that performance was another significant determinant for securitization, even though its effects were limited before 2017Q4.

4.3. Results of Varying Types of Banks

4.3.1. Derivations from Regression Results

The above findings only reflect how these determinants affect securitization decisions in varying bank groups, but it is difficult to indicate how determinants influence varying types of banks, not including national commercial banks. This can be safely deduced by comparing different bank groups (see Table 13). Specifically, city/rural commercial banks can be deduced through a comparison of the p-value and coefficients of commercial banks and national commercial banks. For example, if the former regression probability of a hypothesis variable (p-value) (commercial banks) is higher than that of the national commercial banks, national commercial banks can be considered to have contributed to an increased p-value. If the variable regression probability is the same or similar, their coefficients will be compared and their influence inferred. Policy banks are also analyzed according to this methodology.

4.3.2. Derivations from Four-Variable Regression

(1)
National commercial banks
National commercial banks and their change were analyzed in the four-variable regression section, so we do not need to compare and discuss their important determinants. Liquidity was the only determinant before 2017Q4, but risk exposure became the main motivation for securitization issuance after 2017Q4.
(2)
City/rural commercial banks
In city/rural commercial banks, liquidity and risk exposure were the main determinants for securitization before 2017Q4. As per the previous analysis, capital requirement was the only significant determinant in national commercial banks. In other words, liquidity and risk exposure were not related to national commercial banks’ securitization. However, these two variables were statistically significant in all commercial banks. This implies that city/rural commercial bank liquidity and risk exposure are related to the dependent variable and result in the statistical significance of all commercial banks.
However, liquidity and risk exposure were not the drivers of loan securitization issuance after 2017Q4. The p-value of national commercial banks was in the 99% confidence interval, which was higher than that of commercial banks (in the 95% confidence interval). This implies that city/rural commercial banks have no motivations for securitization issuance.
(3)
Policy banks
Liquidity and risk exposure were significant determinants motivating policy banks’ securitization before 2017Q4. The risk exposure p-value in the all-bank regression was in the 99% confidence interval, and this was found for the national commercial banks as well. Thus, their coefficients were further compared. The coefficient of risk exposure variables in all banks was higher than that of all commercial banks (17.4% versus 15.7%). The risk exposure of the policy banks could influence their securitization decisions and raise the corresponding coefficient in the all-bank regression. The regression probability of liquidity in all banks is higher than that in all commercial banks. Thus, the liquidity of policy banks was also a significant determinant for their securitization transaction and improved the probability in the all-bank regression.
However, it is hard to infer specific drivers by comparing p-values of the commercial bank group and the all-bank group. Due to the lower p-value of the all-bank group, we inferred that there is no motivation for securitization issuance. This outcome is the same in the case of rural/city commercial banks.

4.3.3. Derivation from Eight-Variable Regression

(1)
National commercial banks
More detail about national commercial bank securitization determinants can be found in Section 4.2.3.
(2)
City/rural commercial banks
Liquidity, risk exposure, and profitability are three important determinants for securitization transaction volume in city/rural commercial banks. This is because these three determinants are not statistically significant in the former group but present contrary outcomes in the commercial bank group. The statistical significance comes from the effect of city/rural commercial banks. The (5) TETA ratio is also statistically significant in the sample of commercial banks. However, its p-value is lower than that of the national commercial bank group, confirming that capital requirement is a significant determinant in city/rural commercial banks.
Only the regulatory capital arbitrage is inferred to have been an important determinant after 2017Q4. The (5) TETA ratio was also statistically significant in the sample of commercial banks and is the same as that of the national commercial banks in the 99% confidence interval. The coefficient was higher than that of the commercial bank group, which could imply that regulatory capital arbitrage was the main motivation for city/rural commercial banks to issue securities.
(3)
Policy banks
Risk exposure was inferred to have been an important determinant in policy banks before 2017Q4. The (1) ND ratio (liquidity measures), the two variables (3) and (4) of risk exposure, and (8) the ROA ratio (profitability measures) were statistically significant in all banks, but the regression coefficients of (1) and (8) were smaller or equal to the former groups, which makes it difficult to prove that liquidity and profitability were two important determinants of policy bank securitization issuance. The p-values of variables (3) and (4) of all banks were the same as those of the commercial bank group. Although the coefficient of (3) was lower than that of the sample of commercial banks (10.9% versus 11.1%), the coefficient of (4) in the sample was much higher than that of the commercial bank sample (36.6% versus 30.2%). Therefore, the effect of risk exposure in all banks was greater than that of the commercial bank group. The risk exposure affected policy bank securitization and improved the corresponding coefficient.
Risk exposure and regulatory capital arbitrage were inferred to be two main determinants in policy banks after 2017Q4. Regarding risk exposure, (3) the LT ratio was statistically significant in the 90% confidence interval in the all-bank group, but there was no statistical significance in the commercial bank group. We conclude that national policy banks contributed to an increased p-value. In the same way, it can also be inferred, by comparing (5) TETA ratios, that the regulatory capital arbitrage was the other main determinant.

5. Discussion

5.1. Discussion of Results

This paper investigates what drives bank securitization in China and compares determinants before and after 2017Q4. Generally, the paper shows that, before 2017Q4, a bank was more likely to issue securities if the bank’s credit risk exposure, its liquidity, and its performance were higher. A bank’s credit risk was still a main driver of securitization issuance volume. The regulatory capital arbitrage also influenced securitization decisions. However, the liquidity and performance were not determinants of securitization issuance after 2017Q4. Specifically, credit risk exposure was the most significant determinant compared to the other two. The main motivation of bank securitization could have been credit risk transfers, followed by increased liquidity and improved profitability. Interestingly, capital requirement—or, more precisely, (5) the total equities to total assets and (6) the tier one ratio—did not seem to influence banks’ securitization decisions very strongly before 2017Q4. However, these two variables were statistically significant with respect to securitization issuance after 2017Q4. Liquidity—or, more precisely, (1) net loans to deposits and short-term funding and (2) liquidity assets to deposits and short-term funding—did not seem to influence banks’ securitization decisions very strongly. (5) The cost-to-income ratio and (6) the return on assets also did not seem to influence banks’ securitization decisions strongly after 2017Q4.
The paper also shows that the four determinants in different types of banks display different propensities toward securitization activities in the two periods. To differentiate motivations of securitization between the varying types of banks, this paper looks particularly at the varying types of bank groups in more detail. Before 2017Q4, two types of bank group (the commercial bank group and the national commercial bank group) were used in the empirical models. The findings indicate that risk exposure was still the most important determinant, which is the case in all banks. The (3) loan loss reserves to total loans and (4) the impaired loans to total loans, measuring credit risk exposure, presented statistical significance in the group of commercial banks. Additionally, credit risk exposure affected bank securitization more obviously—the coefficients of (3) and (4) were much higher than those of the other determinants. The second important determinant that drives banks’ securitization was liquidity. (1) The net loans to deposits and short-term funding were statistically significant with respect to securitization transaction volumes, except in the group of national commercial banks. However, because the p-values and coefficients of the liquidity variables were lower than those of risk exposure, the liquidity determinant was not as important. The profitability determinant also drove securitization transactions in all commercial banks but was less important than the above two determinants, which is shown by the lower p-values of profitability. Consistent with the results of all banks, the capital requirement determinant was considered the least important determinant. It is only related to securitization issuance in the group of national commercial banks. After 2017Q4, the all-bank group and the national commercial bank group were the only two groups that issued their securities because of the risk exposure. However, the capital requirement determinant was found to be related to securitization issuance in the group of all banks.
Risk exposure is the most important determinant for bank securitization, by bank group analysis and by different types of bank analysis, for the whole period. Higher credit risks in a bank has motivates a larger part of an asset-securitized portfolio, and these securitized assets are more likely to be low-quality or impaired loans. This is because the bank is able to decrease stress costs and improve risk management when it removes these low-quality or impaired loans from the balance sheet via securitization transactions and shares those credit risks with investors. Thus, these findings are indicative that securitization is mainly used as a risk transfer. Liquidity was the second most important determinant before 2017Q4, but it was not the determinant after 2017Q4. The use of securitization is regarded as a mechanism in the search for liquidity and, therefore, as a source of additional financing. In this way, banks can newly acquire alternative funding resources and be less vulnerable to liquidity shock. The other important determinant is profitability. The first period indicates that securitization was used as a way to improve performance. Generally, that performance mainly came from intermediation profits via a specific design of securitization loans or by raising cash inflows to retire existing debts that could reduce interest expense. However, improving a bank’s performance via securitization issuance could be more difficult after 2017Q4. The capital requirement did not seem to influence banks’ securitization (except national commercial banks in the first period), but this changed after 2017Q4. It can be stated that regulatory capital arbitrage hampered by the regulatory scheme was difficult to apply in the securitization market, but that has changed in the last three years.

5.2. Determinants, Adverse Selection, and Moral Hazards in Chinese Banking

5.2.1. Adverse Selection

The risk exposure determinant, measuring the quality of loans, can be used to test adverse selection problems. These problems are mainly concerned with securitization transactions between the originator and investors. Generally, the originator has more and superior information about the underlying assets than investors. If a securitization transaction involves serious information asymmetry, where the investor is not clear about the underlying quality of an asset, the securitization originator can move low-quality loans into SPV and sell them to investors. Thus, the quality of underlying assets is key in studying adverse selection problems. If large amounts of low-quality underlying assets are moved from banks and sold to investors, investors are more likely to buy ‘lemons’ from an originator, resulting in adverse selection problems. Based on the background of banking in China as well as our regression results, this paper shows that the securitization transactions made in this setting are related to adverse selection problems for the following reasons.
(1)
Writing off non-performing loans, asset management companies (AMCs), ‘debt-to-equity’ swaps, and non-performing loan (NPL) securitization are four main ways to tackle non-performing loans in China. They are allowed and supported in banks in China; however, the effects of those approaches in practice are questioned.
The traditional way to tackle non-performing loans is writing them off. This approach is widely used with lower non-performing loans, but it is at the expense of banks’ net profits and decreases the bank’s profitability.
AMCs are another way to tackle NPLs. They acquire distress debt from banks and then progressively restrict and repack those acquisitions in the flowing. The four major AMCs play a critical role in tackling NPLs (Deloitte 2018a). Building on this, recent reforms allow AMCs, with 35 currently in operation, to take on bad debt. They also permit AMCs to sell bad debt to third-party investors rather than simply acting as warehouses for NPLs (Foreign and Commonwealth Office 2017). However, there are signs that those corporations rely heavily on bank loans to finance their purchases in order to expand their scale; given the circular relationship with the banks, some local AMCs are simply perpetuating loans to zombie firms (Foreign and Commonwealth Office 2017). The effects of AMCs are doubtful; those credit risks might be moved from balance sheets but essentially are not eliminated and could even increase risk exposure.
‘Debt-for-equity’ swaps were initiated by the State Council in 2016 to replace bad loans with an equity stake in the relevant companies, becoming another solution to China’s cooperation debts. In theory, debt-for-equity swaps could act as a relatively growth-friendly route to incorporate deleveraging that can decrease the problems of corporate debt problems (Martin 2016). In other words, ‘debt-to-equity’ swaps aim to decrease high corporate leverage and lower debt risks directly, which could indirectly lower banks’ credit risks. However, in practice, ‘debt-to-equity’ swaps face implementation risks, because banks are compelled to swap bad loans for equity to keep failing ‘zombie’ companies alive (Fitch 2016). In addition, the ‘debt-for-equity’ swap scheme is unlikely to reach a scale at which it addresses corporate sector leverage in a meaningful way, given the lack of investor interest and the capital constraints of banks (Nolet and Wong 2017). If ‘debt-to-equity’ swaps cannot deal with high leverage and NPLs efficiently for corporations, then this approach indirectly fails to decrease NPLs in banks.
With the diversification of underlying assets in terms of securitization, non-performance loan securitization has become a new way to deal with NPLs. The mechanism is similar to loan securitization, but the underlying assets are replaced by non-performing assets. In this way, more investors participate in the market to help optimize non-performing assets and increase banks’ non-performance asset disposal (KPMG 2017b). However, the high risks of these underlying assets could affect the confidence of investors. In order to overcome this issue (Daniel et al. 2016), banks tend to retain large amounts of high risk tranches. Thus, the high cost of NPL securitization could make tackling credit risks difficult.
(2)
The official data from CBRC and other financial institution estimations jointly indicate that credit risks in the banking context in China have been boosted in the past few years, and the financial system is on a dangerous trajectory. If the approaches of tackling non-performing loans are less efficient as discussed above, banks will be encouraged to transfer their risks via loan securitization directly.
Even though exposure to credit risks slowed down after 2016 (KPMG 2017a), NPLs have increased extraordinarily in recent years with the slowdown of the Chinese economy. According to the information disclosed by the CBRC, the various loan balance of commercial banks’ asset portfolios was RMB 98.029 trillion at the end of 2017, representing an increase of RMB 11.121 trillion compared to the end of 2016. The NPL ratio is as high as 1.74% and has risen extraordinarily since 2012 (DBS 2018). However, foreign institutions have estimated that the NPL ratio would be much higher than is indicated by the official data. Fitch (2017) estimated that the NPL ratio could be in a range from 15% to as much as 21%, equivalent to around 11–20% of China’s economy. The IMF (2016) estimated a similar ratio, i.e., a total debt at risk, based on individual firm level data on interest coverage ratios and liability ratios, at 15%.
The high NPLs result in increased stress costs and a threatened stability. However, securitization with ‘true sale’ transactions and the ‘bankruptcy-remoteness’ mechanism provide banks with credit risk transfer opportunities. Generally, because of the market mechanisms in securitization, such as lender reputation concerns, the lenders retain high-default-risk loans in their portfolio; while financial risks grow, lenders change dramatically and retain low-default-risk loans in their portfolios (Agarwal et al. 2012). Thus, when banks are under pressure of high credit risks, they are more likely to share large amounts of low-quality loans via securitization.
It can be summarized that NPLs have increased dramatically in the past few years, but approaches tackling NPLs in practice are doubtful. With a rising risk exposure without efficient methods to tackle risk, high-risk exposure could motivate banks to transfer credit risks from balance sheets via loan securitization directly. In addition, our study indicates that risk exposure presents statistical significance in relation to securitization transaction volume. Higher credit risks in banks drive larger amounts of loan securitization. As mentioned previously, the quality of underlying assets is key to studying adverse selection problems. We conclude that banks tend to pack those low-quality assets from their portfolios and move to SPV to protect themselves against high credit risks. Once a large amount of low-quality or low-performance loans are packaged without efficient information disclosure, investors are more likely to buy low-quality securitizations. This will hurt investor protections and even drive the securitization market down. There are consequences of adverse selection in securitization.

5.2.2. Moral Hazards

In this paper, liquidity, profitability, and capital requirement determinants are used to study moral hazards in bank securitization. Moral hazards are mainly concerned with the relationship between borrowers and banks (originators) or the bank itself. They mainly show that banks use securitization to take on more risks. Specifically, once a bank’s risks are incurred by investors without enough information to supervise the bank’s operations, the bank will take more risks, which results in financial instability. We found, by comparing two periods’ securitization determinants, that moral hazards tended to decrease because these three determinants had a lower influence on securitization issuance. Before 2017Q4, liquidity contributed to serious moral hazard problems in securitization, while the profitability and capital requirement determinants presented a lower association to such problems. However, the capital requirement presented a greater association to moral hazard problems after 2017Q4.

Liquidity

Liquidity is considered an important determinant contributing to moral hazard. Moral hazards in securitization with regard to liquidity are mainly present in lax screening by lenders. Securitization is used to increase bank liquidity according to multiple variable analysis. Banks can acquire additional and sufficient liquidity through securitization. Sufficient liquidity generally encourages banks to offer a larger amount of loans to borrowers and pursue higher profitability. The supply of loans is increased, while the demand is unchanged, and lax screening by lenders can stimulate a higher demand for loans. Lax screening also increases a bank’s financial risks and results in the instability of the financial system, especially for so-called ‘too-big-to-fail’ financial institutions. Additionally, the regulatory scheme also encourages banks to provide more loans to support economic development. The regulatory authorities (China Banking and Insurance Regulatory Commission) released a regulatory scheme aiming to ease the higher amount of liquidity. The specific operation is the relaxation of their bad loans to a range of 120–150% from the current minimum of 150% (WSY 2018). This move can help commercial banks improve their capability in guarding against liquidity risks, serve the real economy, and maintain the safe, stable operation of the banking system (Xinghua 2018). Clearly, banks with the encouragement of a liquidity regulatory scheme lead to large amounts of liquidity from banks to support economic devolvement. This could result in lax screening to a certain degree. We conclude that, before 2017Q4, banks were able to acquire sufficient liquidity and encourage borrowers to take larger loans and that they were more likely to lax-screen borrowers and even offer loans to ineligible borrowers. Therefore, if authorities are not able to acquire enough information to supervise efficiently, lax screening would lose control.
However, Chinese authorities, over the three years prior to the study period, asked banks to restrict the loan supply, especially property loans, to ward off an economic bubble. Banking regulators paid attention to the rebound of the proportion of property loans among their new loans (Nasdaq 2021). Lax screening by lenders decreased under prudential supervision. We inferred that such regulators reduce moral hazards in securitization.

Profitability

Profitability is not associated with moral hazards in securitization, because profitability fails to drive securitization under our analysis. Even though profitability presents statistical significance in relation to securitization transaction volumes in the majority of banks, the correlation coefficient values are almost zero, which reveals that their effects are limited. This could be explained by that fact that securitization can increase liquidity, lower credit risks, and improve risk management, which can improve performance jointly but not directly. In addition, the tax standard of securitization in China is not mature enough, which is reflected by the lower tax incentives and limits the ways in which performance can be improved via securitization. Before the tax reform, securitization generated taxation problems that did not fully reflect the tax neutrality principle (Liang 2015). The pilot program for replacing the business tax with a value-added tax (VAT) abolished the business tax in 2016. However, how the application of a VAT affects the securitization is still ambiguous, because it is not relevant to purely domestic securitization transactions (Phua 2020). Therefore, we conclude that it is difficult for banks to improve their profitability via securitization transactions due to the tax issue and to take more risks. The profitability determinant cannot result in moral hazards in securitization transactions.

Capital Requirement

The capital requirement is not related to moral hazards either. The capital requirement presents no statistical significance in relation to securitizations, which means that most banks do not use loan securitization to save on regulatory capital. This is because the Basel II framework under the ‘standardized approach’ no longer allows for regulatory capital arbitrage. Basel III, which could further enhance the capital regulation, was scheduled to be introduced from 2013 to 2019 (Financial Stability Board 2018). We consider regulatory capital arbitrage to be the main relation between regulatory authorities and banks. Those financial institutions seeking new opportunities of regulatory capital arbitrage might never come to an end, but it has become harder to continue with the maturity of regulations. Regulatory capital arbitrage is difficult to apply in loan securitization. Less regulatory capital could not result in moral hazard problems in securitization transactions before 2017Q4. However, banking regulators in China intensified capital rules in the three years prior to that; for example, banks that failed to comply with capital adequacy requirements by the end of 2010 in terms of the amount of capital they had to hold against their loans were punished, with limits on market access and so on (McMahon 2009). Chinese regulators also drafted tougher capital rules for China’s too-big-to-fail banks, seeking to curb risks (Bloomberg 2021). Regulatory capital arbitrage might have been applied in securitization transactions under the pressure of stricter capital requirements after 2017Q4.

6. Recommendations

This paper aims to examine adverse selection and moral hazards by examining the determinants of securitization in China and then to answer the main research question: Does China need a higher standard of information transparency to protect against its risks? The findings show that securitization involved both adverse selection and moral hazard problems before 2017Q4, but the digital transformation of banking reduced those issues after 2017Q4. Generally, adverse selection, compared with moral hazards, is more serious. Even though digital transformation reduced information asymmetry significantly, adverse selection and moral hazards still affected the loan securitization market and its stability. Thus, China still needs a higher standard of information transparency to protect against these risks. The recommendations according to this paper’s findings are as follows:
(1)
The first recommendation regards the adverse selection problem. The standard of information transparency in terms of the underlying assets should be further improved, particularly for the quality of underlying assets. According to our empirical study, risk exposure is the most significant determinant for securitization, which shows that securitization is mainly used as a way to transfer credit risks to investors. As the operating model of banks tends to change from an ‘originate-to-hold’ to an ‘originate-to-distribute’ model, risk exposure can be shared with securitization investors to lower bank risks, but investors’ benefits should also be protected. It is essential to guarantee that investors are informed about the corresponding price and risks of their investments. A regulatory scheme should require originators to disclose more information in terms of the underlying assets for investors to reduce information asymmetry.
(2)
Securitization also involves moral hazards, which is reflected in the regulatory capital arbitrage. The second recommendation is a regulatory scheme that requires banks to disclose more information about regulatory capital arbitrage and the relative shadow banks.
(3)
We also found that, even though securitization involves both adverse selection and moral hazards, their effects are different in different types of bank. Thus, our third recommendation is that a regulatory scheme should require varying standards of information disclosure according to the type of banks. National commercial banks should disclose more information because national commercial banks evidenced serious moral hazard and adverse selection problems after 2017Q4. Credit risks were highest in the commercial bank group, but they did not excel in terms of performance, which also indicates that protecting these risks is more difficult. Relatively speaking, policy banks and city/rural commercial banks are not expected to need as high a standard as the other two types of banks.
(4)
This paper also indicates, via a comparison of two periods, that digital transformation resulted in lower information asymmetry and higher financial stability. Even though digital transformation reduces adverse selection and moral hazards in banking, it still affects securitization. The last recommendation is to apply blockchain in securitization to further enhance their information transparency.

7. Conclusions

In summary, by comparing two periods, FinTech applications in the banking industry could result in lower information asymmetry. However, moral hazard and adverse selection problems still affect the securitization market, which could affect financial stability. Thus, China needs a higher standard of information transparency.
The moral hazard and adverse selection problems were tested by studying the determinants of loan securitization in China’s banking sector. Specifically, risk exposure was the main determinant of securitization issues over the whole period, which means that the adverse selection problem might affect the securitization market. This result is similar to that of studies by Minton et al. (2004) and Bannier and Hänsel (2008). Liquidity and performance were considered to test moral hazards, and they were less statistically significant with respect to securitization issuance after 2017Q4. However, the capital requirement could be a main determinant of securitization. This conclusion is similar to that of studies by Uzun and Webb (2007) and Ambrose et al. (2005).
In order to protect against adverse selection and moral hazards, China needs a higher standard of information transparency. First, since adverse selection in securitization mainly affects risk transfer, information disclosure should focus more on the underlying assets to ensure that investors know what they are investing in and that they are willing to pay corresponding prices and bear the corresponding risks. The second recommendation regards moral hazards, which are mainly reflected in the capital requirement. Information disclosure should correspond more to regulatory capital arbitrage. The third is that a regulatory scheme of information disclosure should be diversified according to the varying types of bank. The last recommendation is to apply blockchain in securitization to further enhance their information transparency.

Author Contributions

Conceptualization, C.W.; methodology, X.C.; software, X.C.; validation, C.W.; formal analysis, C.W. and X.C.; investigation, C.W. and X.C.; resources, X.C.; data curation, X.C.; writing—original draft preparation, C.W. and X.C.; writing—review and editing, C.W. and X.C.; visualization, C.W. and X.C.; supervision, C.W. and X.C.; project administration, C.W. and X.C. All authors have read and agreed to the published version of the manuscript.

Funding

This research received no external funding.

Institutional Review Board Statement

Not applicable.

Informed Consent Statement

Not applicable.

Data Availability Statement

Data was obtained from Bloomberg, banks’ financial reports, Wind and China Securitization Analytics website.

Conflicts of Interest

The authors declare no conflict of interest.

References

  1. Acharya, Viral V., Philipp Schnabl, and Gustavo Suarez. 2013. Securitization without risk transfer. Journal of Financial economics 107: 515–36. [Google Scholar] [CrossRef] [Green Version]
  2. Affinito, Massimiliano, and Edoardo Tagliaferri. 2010. Why do (or did?) banks securitize their loans? Evidence from Italy. Journal of Financial Stability 6: 189–202. [Google Scholar] [CrossRef]
  3. Agarwal, Sumit, and Robert Hauswald. 2010. Distance and private information in lending. The Review of Financial Studies 23: 2757–88. [Google Scholar] [CrossRef]
  4. Agarwal, Sumit, Yan Chang, and Abdullah Yavas. 2012. Adverse selection in mortgage securitization. Journal of Financial Economics 105: 640–60. [Google Scholar] [CrossRef] [Green Version]
  5. Akerlof, George A. 1970. The market for lemons: Quality uncertainty and the market mechanism. Quarterly Journal of Economics 84: 488–500. [Google Scholar] [CrossRef]
  6. Albertazzi, Ugo, Ginette Eramo, Leonardo Gambacorta, and Carmelo Salleo. 2015. Asymmetric information in securitization: An empirical assessment. Journal of Monetary Economics 71: 33–49. [Google Scholar] [CrossRef]
  7. Altunbas, Yener, Leonardo Gambacorta, and David Marques-Ibanez. 2010. Does Monetary Policy Affect Bank Risk-Taking? ECB Working Paper, No. 1166. Available online: https://www.ecb.europa.eu/pub/pdf/scpwps/ecbwp1166.pdf (accessed on 11 March 2018).
  8. Ambrose, Brent W., Michael LaCour-Little, and Anthony B. Sanders. 2005. Does regulatory capital arbitrage, reputation, or asymmetric information drive securitization? Journal of Financial Services Research 28: 113–33. [Google Scholar] [CrossRef]
  9. An, Xudong, Yongheng Deng, and Stuart A. Gabriel. 2011. Asymmetric information, adverse selection, and the pricing of CMBS. Journal of Financial Economics 100: 304–25. [Google Scholar] [CrossRef]
  10. Bannier, Christina E., and Dennis N. Hänsel. 2008. Determinants of European Banks’ Engagement in Loan Securitization. Deutsche Bundesbank Working Paper No. 10. Available online: https://www.econstor.eu/bitstream/10419/19787/1/200810dkp_b_.pdf (accessed on 11 March 2018).
  11. Beltran, Daniel O., Larry Cordell, and Charles P. Thomas. 2017. Asymmetric information and the death of ABS CDOs. Journal of Banking & Finance 76: 1–14. [Google Scholar]
  12. Benmelech, Efraim, Jennifer Dlugosz, and Victoria Ivashina. 2012. Securitization without adverse selection: The case of CLOs. Journal of Financial Economics 106: 91–113. [Google Scholar] [CrossRef] [Green Version]
  13. Bergh, Donald, David J. Ketchen, Ilaria Orlandi, Pursey P. M. A. R. Heugens, and Brian K. Boyd. 2018. Information Asymmetry in Management Research: Past Accomplishments and Future Opportunities. Journal of Management 45: 014920631879802. Available online: https://www.researchgate.net/publication/327804777_Information_Asymmetry_in_Management_Research_Past_Accomplishments_and_Future_Opportunities (accessed on 14 November 2021). [CrossRef]
  14. Bloomberg. 2021. China Drafts Tougher Capital Rules for Too-Big-to-Fail Banks. Available online: https://www.bloomberg.com/news/articles/2021-04-02/china-drafts-tougher-capital-rules-for-too-big-to-fail-banks (accessed on 31 October 2021).
  15. Blum, Jürg M. 2008. Why ‘Basel II’may need a leverage ratio restriction. Journal of Banking & Finance 32: 1699–707. [Google Scholar]
  16. Bubb, Ryan, and Alex Kaufman. 2014. Securitization and moral hazard: Evidence from credit score cutoff rules. Journal of Monetary Economics 63: 1–18. [Google Scholar] [CrossRef] [Green Version]
  17. Calmès, Christian, and Raymond Théoret. 2010. The impact of off-balance-sheet activities on banks returns: An application of the ARCH-M to Canadian data. Journal of Banking & Finance 34: 1719–28. [Google Scholar]
  18. Calomiris, Charles W., and Joseph R. Mason. 2004. Credit card securitization and regulatory arbitrage. Journal of Financial Services Research 26: 5–27. [Google Scholar] [CrossRef] [Green Version]
  19. Cardone-Riportella, Clara, Reyes Samaniego-Medina, and Antonio Trujillo-Ponce. 2010. What drives bank securitisation? The Spanish experience. Journal of Banking & Finance 34: 2639–51. [Google Scholar]
  20. Daniel, James, Jose M. Garrido, and Marina Moretti. 2016. Debt Equity Conversions and NPL Securitization in China: Some Initial Considerations. International Monetary Fund. Available online: https://www.imf.org/en/Publications/TNM/Issues/2016/12/31/Debt-Equity-Conversions-and-NPL-Securitization-in-China-Some-Initial-Considerations-43876 (accessed on 7 July 2018).
  21. DBS. 2018. China Banking Sector. Available online: https://webcache.googleusercontent.com/search?q=cache:_ln1Y9lfUrAJ:https://www.dbs.com.sg/sme/aics/pdfController.page%3Fpdfpath%3D/content/article/pdf/AIO/062018/180613_insights_pumping_the_liquidity.pdf+&cd=1&hl=en&ct=clnk&gl=uk (accessed on 7 July 2018).
  22. Dell’Ariccia, Giovanni, Deniz Igan, and Luc U. C. Laeven. 2008. Credit Booms and Lending Standards: Evidence from the Subprime Mortgage Market. Available online: https://www.elibrary.imf.org/view/journals/001/2008/106/article-A001-en.xml (accessed on 31 October 2021).
  23. Deloitte. 2018a. On Your Marks, Deloitte Deleveraging Asia 2018. Available online: https://www2.deloitte.com/content/dam/Deloitte/sg/Documents/financial-services/sea-fsi-deleveraging-asia-2018.pdf (accessed on 8 July 2018).
  24. Deloitte. 2018b. Review and Outlook of China Banking Industry 2018. Available online: https://www2.deloitte.com/cn/en/pages/financial-services/articles/listed-chinese-banks-results-analysis-for-2018.html (accessed on 31 October 2021).
  25. Diggle, Peter, Patrick Heagerty, Kung-Yee Liang, and Scott Zeger. 2002. Analysis of Longitudinal Data. Oxford: Oxford University Press. [Google Scholar]
  26. Dowd, Kevin. 2009. Moral hazard and the financial crisis. Cato Journal 29: 141. [Google Scholar]
  27. Drucker, Steven, and Manju Puri. 2009. On Loan Sales, Loan Contracting, and Lending Relationships. Available online: https://www.researchgate.net/publication/227465267_On_Loan_Sales_Loan_Contracting_and_Lending_Relationships (accessed on 19 November 2021).
  28. Duffie, Darrell. 2008. Innovations in Credit Risk Transfer: Implications for Financial Stability. BIS Working Paper No. 255. Available online: https://www.bis.org/publ/work255.pdf (accessed on 1 July 2008).
  29. Farruggio, Christian, and André Uhde. 2015. Determinants of loan securitization in European banking. Journal of Banking & Finance 56: 12–27. [Google Scholar]
  30. Financial Stability Board. 2018. Basel III—Implementation. Available online: http://www.fsb.org/what-we-do/implementation-monitoring/monitoring-of-priority-areas/basel-iii/ (accessed on 7 July 2018).
  31. Fitch. 2016. China’s Debt-for-Equity Swap Face Implementation Risks. Available online: https://www.fitchratings.com/site/pr/1013123 (accessed on 8 July 2018).
  32. Fitch. 2017. Data Reference from ‘China’s Toxic Debt Pile May be 10 Times Official Estimates’: Fitch. Available online: https://www.cnbc.com/2016/09/23/chinas-toxic-debt-pile-may-be-10x-official-estimates-fitch.html (accessed on 7 July 2018).
  33. Foreign and Commonwealth Office. 2017. Financial Services Special Report: Risks in China’s Financial System. Available online: https://assets.publishing.service.gov.uk/government/uploads/system/uploads/attachment_data/file/612595/Risks_in_China_s_Financial_System.pdf (accessed on 7 July 2018).
  34. Giddy, Ian. 1985. Regulation of off-balance sheet banking. Federal Reserve Bank of San Francisco Proceedings 165–90. Available online: https://ideas.repec.org/a/fip/fedfpr/y1985p165-190.html (accessed on 7 July 2018).
  35. Gorton, Gary. 2009. The subprime panic. European Financial Management 15: 10–46. [Google Scholar] [CrossRef]
  36. Greenbaum, Stuart I., and Anjan V. Thakor. 1987. Bank funding modes: Securitization versus deposits. Journal of Banking & Finance 11: 379–401. [Google Scholar]
  37. Grossman, Sanford J., and Oliver D. Hart. 1983. Implicit contracts under asymmetric information. The Quarterly Journal of Economics 123–56. [Google Scholar] [CrossRef]
  38. Higgins, Eric J., and Joseph R. Mason. 2004. What is the value of recourse to asset-backed securities? A clinical study of credit card banks. Journal of Banking & Finance 28: 875–99. [Google Scholar]
  39. Hogan Lovells. 2019. The Rising and Booming Chinese Securitization Market—A Comparison with the European Securitization Market. Available online: https://www.hoganlovells.com/~/media/hogan-lovells/pdf/debt-capital-markets-global-insights/2019-debt-capital-markets/2the-rising-and-booming-chinese-securitization-market--a-comparison-with-the-european-securitization-market.pdf?la=en (accessed on 21 July 2021).
  40. Holmström, Bengt. 1979. Moral hazard and observability. The Bell Journal of Economics, 74–91. [Google Scholar] [CrossRef] [Green Version]
  41. Huang, Kun, Qiuge Yao, and Chong Li. 2019. Impacts of Financial Market Shock on Bank Asset Allocation from the Perspective of Financial Characteristics of Banks. International Journal of Financial Studies 7: 29. [Google Scholar] [CrossRef] [Green Version]
  42. IMF. 2016. Resolving China’s Corporate Debt Problem. Available online: https://www.imf.org/external/pubs/ft/wp/2016/wp16203.pdf (accessed on 7 July 2018).
  43. Keys, Benjamin J., Tanmoy Mukherjee, Amit Seru, and Vikrant Vig. 2008. Securitization and screening: Evidence from subprime mortgage backed securities. Quarterly Journal of Economics 125: 307–62. [Google Scholar] [CrossRef]
  44. Kirabaeva, Koralai. 2010. Adverse Selection, Liquidity, and Market Breakdown. Working Paper/Document de travail 2010-32. Vancouver: Bank of Canada. [Google Scholar]
  45. Kirabaeva, Koralai. 2011. Adverse Selection and Financial Crises. Vancouver: Bank of Canada, pp. 11–19. [Google Scholar]
  46. Kothari, Vinod. 2002. Whole Business Securitization: Secured Lending Repackaged—A Comment on Hill. Duke Journal Comparative & International Law 12: 537. [Google Scholar]
  47. KPMG. 2017a. China’s City Commercial Banks: Opportunity Knocks? Available online: http://www.kpmg.com.cn/en/virtual_library/Financial_advisory_services/Chin_comm_bank/Opportunity_knocks.pdf (accessed on 1 June 2018).
  48. KPMG. 2017b. Mainland China Banking Survey. Available online: https://assets.kpmg.com/content/dam/kpmg/cn/pdf/en/2017/08/2017-mainland-china-banking-survey.pdf (accessed on 7 July 2018).
  49. Liang, Shaoze. 2015. Chinese Credit Asset Securitization: Development Status, Problems and Suggestions. International Business and Management 11: 75–80. Available online: http://www.cscanada.net/index.php/ibm/article/viewFile/8021/pdf (accessed on 7 July 2018).
  50. Lockwood, Larry J., Ronald C. Rutherford, and Martin J. Herrera. 1996. Wealth effects of asset securitization. Journal of Banking & Finance 20: 151–64. [Google Scholar]
  51. Martin, Dan. 2016. Debt-For-Equity Swaps Lead to More Questions than Answers. Finch Rating. Available online: https://fitchratings.COM/understandingcreditratings (accessed on 8 July 2018).
  52. McMahon. 2009. China Banking Regulator Gets Tough on Capital Rules. The Wall Streethournal. Available online: https://www.wsj.com/articles/SB10001424052748703819904574553571535733270 (accessed on 31 October 2021).
  53. Mhlanga, David. 2021. Financial inclusion in emerging economies: The application of machine learning and artificial intelligence in credit risk assessment. International Journal of Financial Studies 9: 39. [Google Scholar] [CrossRef]
  54. Mian, Atif, and Amir Sufi. 2009. The consequences of mortgage credit expansion: Evidence from the US mortgage default crisis. The Quarterly Journal of Economics 124: 1449–96. [Google Scholar] [CrossRef]
  55. Minton, Bernadette, Anthony Sanders, and Philip E. Strahan. 2004. Securitization by Banks and Finance Companies: Efficient Financial Contracting or Regulatory Arbitrage? No. 2004-25. Available online: https://ideas.repec.org/p/ecl/ohidic/2004-25.html (accessed on 31 October 2021).
  56. Mirrlees, James A. 1999. The theory of moral hazard and unobservable behaviour: Part I. The Review of Economic Studies 66: 3–21. [Google Scholar] [CrossRef]
  57. Nasdaq. 2021. China’s Regulator Asks Smaller Banks to Restrict Property Loan Growth. Available online: https://www.nasdaq.com/articles/chinas-regulator-asks-smaller-banks-to-restrict-property-loan-growth-2021-06-01 (accessed on 31 October 2021).
  58. Niinimaki, J.-P. 2012. Hidden loan losses, moral hazard and financial crises. Journal of Financial Stability 8: 1–14. [Google Scholar] [CrossRef]
  59. Nolet, Alessandro, and Camilla Wong. 2017. Debt for Equity Swaps, a solution to China’s NPL Problems? Available online: https://www.clearygottlieb.com/-/media/organize-archive/cgsh/files/2017/publications/emrj-summer-2017-issue-4/debt-for-equity-swaps--a-solution-to-chinas-npl-problems.pdf (accessed on 7 July 2018).
  60. Pavel, Christine A. 1986. Securitization. Economic Perspectives 10: 16–31. [Google Scholar]
  61. Pavel, Christine A., and David Phillis. 1987. Why commercial banks sell loans: An empirical analysis. Economic Perspectives 11: 3–14. [Google Scholar]
  62. Petersen, Mitchell A. 2004. Information: Hard and Soft. Available online: https://citeseerx.ist.psu.edu/viewdoc/download?doi=10.1.1.196.5380&rep=rep1&type=pdf (accessed on 7 July 2020).
  63. Phua, Patrick. 2020. Structured Finance and Securitisation in China: Overview. Thomson Reuters. Available online: https://uk.practicallaw.thomsonreuters.com/1-501-1427?transitionType=Default&contextData=%28sc.Default%29 (accessed on 31 October 2021).
  64. Rothschild, Michael, and Joseph E. Stiglitz. 1976. Equilibrium in Competitive Insurance Markets: An Essay on the Economics of Imperfect Information. The Quanerly Journal of Economics 90: 629–49. [Google Scholar]
  65. Sindle, Guy, Lisa Hernandez, Prakash Santhana, Dzmitry Maroz, Val Srinivas, and Urval Goradia. 2017. Applying Blockchain in Securitization: Opportunities for Reinvention. Available online: https://www2.deloitte.com/content/dam/Deloitte/us/Documents/regulatory/us-sfig-report-applying-blockchain-in-securitization-opportunities-for-reinvention.pdf (accessed on 22 July 2021).
  66. Spence, M. 1978. Job market signaling. In Uncertainty in Economics. New York: Academic Press, pp. 281–306. [Google Scholar]
  67. State Council. 2015. China Approves Reforms to Three Policy Banks. Available online: http://english.gov.cn/policies/latest_releases/2015/04/12/content_281475087560462.htm (accessed on 1 June 2018).
  68. Stiglitz, J. E. 1989. Principal and agent. In Allocation, Information and Markets. London: Palgrave Macmillan, pp. 241–53. [Google Scholar]
  69. Structured Finance Industry Group & Chamber of Digital Commerce. 2017. Can an Blockchain Reinvent the Securitization Industry? Available online: https://digitalchamber.org/assets/applying-blockchain-in-securitization-executive-summary.pdf (accessed on 22 July 2021).
  70. Tang, Ya, Daixi Chen, Jing Chen, and Jianguo Xu. 2017. The rise of China’s securitization market. Financial Markets, Institutions & Instruments 26: 279–94. [Google Scholar]
  71. Turner, Grant, Nicholas Tan, and Dena Sadeghian. 2012. The Chinese Banking System. Sydney: Reserve Bank of Australia, September. [Google Scholar]
  72. Uzun, Hatice, and Elizabeth Webb. 2007. Securitization and risk: Empirical evidence on US banks. The Journal of Risk Finance 8: 11–23. [Google Scholar] [CrossRef]
  73. WSY. 2018. China Lowers Banks’ Liquidity Requirement. Available online: https://www.wsj.com/articles/china-lowers-banks-capital-requirement-1520340796 (accessed on 7 July 2018).
  74. Xinghua. 2018. China Curbs Banks’ Liquidity Risks with New Rule. Available online: http://www.xinhuanet.com/english/2018-05/25/c_137206243.htm (accessed on 7 July 2018).
Figure 1. Framework of the study.
Ijfs 09 00066 g001
Table 1. Variable definitions and expected relationships.
SymbolDescriptionMeasurementExpected Relationship
Dependent Variable
Transaction volumes_total assetsSecuritization transaction volumesSecuritization transaction volumes divided by bank total assets *
Independent Variable
LiquidityLiquidity of a bankLiquid Assets/deposits and short-term funding ratio plus net loans/deposits and short-term funding ratio *+
Risk exposureBank’s credit risk exposureLL reserves ratio plus impaired loans/total loans ratio *+
Capital requirementBank regulatory capitalTier one ratio plus equities/assets ratio *-
PerformancePerformance of bankCost-to-income ratio plus return on assets ratio *?
* Data source: independent variable data are from Bloomberg, banks’ financial reports, and Wind; the transaction volume data is from the China Securitization Analytics website and Wind.
Table 2. Variable definitions and expected relationships.
SymbolDescriptionMeasurementExpected Relationship
Dependent Variable
Transaction volume_total assetsSecuritization transaction volumesSecuritization transaction volumes divided by bank total assets *
Independent Variable
Net_loans_D&ST_fundingBank’s net loans to deposits and short-term funding ratioBook value of bank’s net loans divided by total deposits and short-term funding quarterly *+
Liquidity_assets_D&ST_fundingLiquidity assets to deposits and short-term funding ratioCash and cash equivalents of banks divided by total deposits and short-term funding quarterly *-
Loan_loss_reserves_total_loansCreditors budget as an allowance for bad loans to total loans ratioBook value of a bank’s loan reserves divided by total loans *+
Impaired_loans_total_loansImpaired loans to total loans ratioBook value of a bank’s impaired loans divided by total loans *+
Total_equities_total_assetsTotal equities to total assets ratioRatio of total equity divided by total assets *-
Tier_oneTier one ratioCore capital divided by total assets *-
Cost_to_IncomeCost-to-income ratioBank total cost divided by total income *?
Return_on_assetsTotal return on total assets ratioBank’s return on assets ratio *?
* Data source: independent variable data are from Bloomberg, banks’ financial reports, and Wind; the transaction volume data is from the China Securitization Analytics website and Wind.
Table 3. Specific kinds of banks.
Bank TypeDescription
(A) Whole bankWhole banks are composed of policy banks and commercial banks.
(1) Policy banksThese banks, according to the policy, are responsible for financing economic and trade development and state-invested projects.
(2) Commercial banksThese banks, according to the market, provide services such as accepting deposits, providing business loans, and offering basic investment products.
(B) Commercial banksCommercial banks are composed of city/rural commercial banks, national joint-equity commercial banks, and global systemically important banks.
(3) City/rural commercial banksThese banks only focus on specific rural regions and cities (small and medium-sized banks).
(4) National joint-equity commercial banksThese banks are able to operate in the whole country (medium-sized and large banks).
(5) Global systemically important banksThese banks are financial institutions whose distress or disorderly failure would cause significant disruption to the wider financial system and economic activity (super large banks).
Source: (A) Whole banks = policy banks + commercial banks. (B) Commercial banks = city/rural commercial banks + national joint-equity commercial banks + global systemically important banks.
Table 4. Bank-specific determinant variable comparison (pre-2017Q4).
SymbolPolicy BanksCommercial BanksCity/Rural Commercial BanksNational Commercial Banks
Dependent Variable (Mean)
Transaction volumes_total assets0.00160.00350.00780.0015
Independent Variable (Mean)
(1) Liquidity3.6440.7710.6980.807
(2) Risk exposure0.0360.0360.0470.031
(3) Regulatory capital0.1540.1660.1570.169
(4) Performance1.1971.4071.3251.477
Data were collected from Bloomberg, Wind, the banks’ financial reports, and the China Securitization Analytics website.
Table 5. Bank-specific determinant variable comparison (post-2017Q4).
SymbolPolicy BanksCommercial BanksCity/Rural Commercial BanksNational Commercial Banks
Dependent Variable (Mean)
Transaction volumes_total assets0.00140.00280.00640.0015
Independent Variable (Mean)
(1) Liquidity9.9110.9240.8430.954
(2) Risk exposure0.0470.0430.0430.044
(3) Regulatory capital0.1420.1750.1670.178
(4) Performance1.6480.8120.8120.812
Data were collected from Bloomberg, Wind, the banks’ financial reports, and the China Securitization Analytics website.
Table 6. Bank-specific determinant variable comparison (pre-2017Q4).
SymbolPolicy BankCommercial BanksCity/Rural Commercial BankNational Commercial Banks
Dependent Variable (Mean)
Transaction volumes_total assets0.00160.00350.00780.0015
Independent Variable (Mean)
(1) Net_loans_D&ST_funding3.1560.5170.4420.548
(2) Liquidity_assets_D&ST_funding0.4880.2520.2560.259
(3) Loan_loss_reserves_total_loans0.0270.0290.0360.026
(4) Impaired_loans_total_loans0.0090.0070.0120.005
(5) Total_equities_total_assets0.0630.0640.0610.065
(6) Tier_one0.0810.1010.0960.104
(7) Cost_to_Income0.4410.4110.4230.394
(8) Return_on_assets0.7571.0120.9301.083
Data were collected from Bloomberg, Wind, the banks’ financial reports, and China Securitization Analytics website.
Table 7. Bank-specific determinant variable comparison (post-2017Q4).
SymbolPolicy BankCommercial BanksCity/Rural Commercial BankNational Commercial Banks
Dependent Variable (Mean)
Transaction volumes_total assets0.00140.00280.00640.0015
Independent Variable (Mean)
(1) Net_loans_D&ST_funding9.58760.76740.68250.7980
(2) Liquidity_assets_D&ST_funding0.32390.15710.16000.1560
(3) Loan_loss_reserves_total_loans0.01380.01390.01200.0146
(4) Impaired_loans_total_loans0.03270.02950.03080.0290
(5) Total_equities_total_assets0.07000.06880.06560.0699
(6) Tier_one0.07200.10660.10090.1086
(7) Cost_to_Income1.64080.80580.80520.8060
(8) Return_on_assets0.00710.00640.00680.0062
Data were collected from Bloomberg, Wind, the banks’ financial reports, and the China Securitization Analytics website.
Table 8. Types of bank group.
Types of Bank GroupDescription
(A) Whole bankWhole banks = policy banks + City/Rural commercial bank + National commercial banks
(B) Commercial bankCommercial banks = City/Rural commercial bank + National commercial banks
(C) National commercial bankNational commercial bank
Table 9. Regression results of four variables in t − 1 (pre-2017Q4).
All Banks All Commercial BanksNational Commercial Banks
Fixed Effects ModelRandom Effects ModelFixed Effects ModelRandom Effects ModelFixed Effects ModelRandom Effects Model
(1) Liquidity (t − 1)−0.001 ***−0.001 ***−0.010 *−0.009 *−0.003−0.002
(−3.375)(−3.375)(−1.911)(−1.810)(−1.243)(−0.927)
(2) Risk_Exposure (t − 1)0.174 ***0.174 ***0.157 ***0.162 ***−0.0010.016
(−5.072)(−5.072)(−6.608)(−6.826)(−0.019)(−0.385)
(3) Capital_Requirement (t − 1)−0.011−0.0110.004−0.001−0.027 ***−0.020 ***
(−0.659)(−0.659)−0.227(−0.051)(−2.802)(−3.104)
(4) Profitability (t − 1)−0.0002−0.00020.0010.002**0.001 **0.0005
(−0.010)(−0.010)(−0.835)(−2.03)(−2.117)(−0.657)
Constant0−0.00030.0030.0020.007 *0.006
(−0.094)(−0.095)(−0.703)(−0.408)(−1.75)(−1.623)
Observation1291291181188787
Adjusted R-squared0.4410.4320.460.4490.2190.173
Hausman Test Prob.0 0 0.006
Data were collected from Bloomberg, Wind, the banks’ financial reports, and the China Securitization Analytics website; t-statistics are in parentheses. *** p < 0.01, ** p < 0.05, * p < 0.10.
Table 10. Regression results of four variables in t − 1 (post-2017Q4).
All BanksAll Commercial BanksNational Commercial Banks
Fixed Effects ModelRandom Effects ModelFixed Effects ModelRandom Effects ModelFixed Effects ModelRandom Effects Model
(1) Liquidity (t − 1)000.001−0.001 ***−0.001−0.001 ***
(0.000)(0.000)(0.002)(0.002)(0.001)(0.001)
(2) Risk_Exposure (t − 1)−0.024 *−0.026 *−0.051 **−0.051−0.038 ***−0.033
(−0.024)(−0.026)(0.021)(0.020)(0.014)(0.013)
(3) Capital_Requirement (t − 1)−0.0020.0020.0040.0070.006−0.001
(−0.002)(0.002)(0.008)(0.007)(0.005)(0.005)
(4) Profitability (t − 1)000.0010.001 **00
(0.000)(0.000)(0.001)(0.001)(0.000)(0.000)
Constant0.004 ***0.005 ***0.0030.0060.003 **0.004
(0.001)(0.001)(0.002)(0.002)(0.002)(0.001)
Observation387387362362266266
Adjusted R-squared0.010.010.76490.0290.0010.043
Hausman Test Prob.0.47 0.01 0.01
Data were collected from Bloomberg, Wind, the banks’ financial reports, and the China Securitization Analytics website; t-statistics are in parentheses. *** p < 0.01, ** p < 0.05, * p < 0.10.
Table 11. Regression results of eight variables in t − 1 (pre-2017).
All BanksAll Commercial BanksNational Commercial Banks
Fixed Effects ModelRandom Effects ModelFixed Effects ModelRandom Effects ModelFixed Effects ModelRandom Effects Model
(1) Net_loans_D&ST_funding (t − 1)−0.001 **−0.001 **−0.015 **−0.013 ***−0.0010.00006
(−2.214)(−2.553)(−1.907)(−2.125)(−0.372)−0.022
(2) Liquidity_assets_D&ST_funding (t − 1)−0.003−0.0040.001−0.0003−0.001−0.001
(−1.123)(−1.280)−0.431(−0.096)(−0.184)(−0.427)
(3) Loan_loss_reserves_total_loans (t − 1)0.109 ***0.116 ***0.111 ***0.115 ***−0.039−0.021
−4.394−4.64−4.878−5.334(−0.960)(−0.510)
(4) Impaired_loans_total_loans (t − 1)0.366 ***0.367 ***0.302 ***0.303 ***00.011
−6.418−5.982−5.425−5.49(−0.003)−0.235
(5) Total_equities_total_assets (t − 1)0.0280.0560.120 *0.142 **−0.122 **−0.101 ***
−0.642−1.197−1.851−2.184(−2.630)(−2.708)
(6) Tier_one (t − 1)−0.048−0.062 **−0.041−0.046*0.0230.019 **
(−1.656)(−2.266)(−1.559)(−1.935)−1.578−2.189
(7) Cost_to_income (t − 1)0.0010.0010.0010.0010.0010.001
−0.646−0.831−0.809−0.725−0.889−1.56
(8) ROA (t − 1)0.003 *0.003 **0.003 *0.0020−0.001
−1.789−2.376−1.872−1.539−0.298(−0.575)
Constant−0.001−0.001−0.002−0.0020.008 **0.007 **
(−0.391)(−0.463)−0.492−1.539−2.138−2.192
Observation1291291181188787
Adjusted R-squared0.4990.490.5190.5180.390.247
Hausman Test Prob.0.000 0.000 0.011
Data were collected from Bloomberg, Wind, the banks’ financial reports, and the China Securitization Analytics website; t-statistics are in parentheses. *** p < 0.01, ** p < 0.05, * p < 0.10.
Table 12. Regression results of eight variables in t − 1 (post-2017).
All BanksAll Commercial BanksNational Commercial Banks
Fixed Effects ModelRandom Effects ModelFixed Effects ModelRandom Effects ModelFixed Effects ModelRandom Effects Model
(1) Net_loans_D&ST_funding (t − 1)0.0000.0000.001−0.003−0.0010.001
(0.000)(0.000)(0.002)(0.002)(0.002)(0.001)
(2) Liquidity_assets_D&ST_funding (t − 1)0.0020.0020.0080.011 **−0.002−0.001
(0.002)(0.002)(0.005)(0.005)(0.004)(−0.001)
(3) Loan_loss_reserves_total_loans (t − 1)−0.049 *−0.043 *−0.036−0.011−0.002−0.001
(−0.049)(−0.043)(0.030)(0.028)(0.021)(−0.001)
(4) Impaired_loans_total_loans (t − 1)−0.003−0.007−0.041−0.065−0.106 ***−0.097 ***
(−0.003)(−0.007)(0.045)(0.042)(0.031)(−0.097)
(5) Total_equities_total_assets (t − 1)−0.039 *−0.027−0.0290.02−0.043 ***−0.048 ***
(−0.039)(−0.027)(0.029)(0.026)(0.022)(−0.048)
(6) Tier_one (t − 1)0.028 *0.022 *0.031 **0.0170.024 **0.017*
(0.028)(0.022)(0.015)(0.014)(0.010)(0.017)
(7) Cost_to_income (t − 1)0.0000.0000.0000.0000.0000.000
(0.000)(0.000)(0.001)(0.001)(0.001)(0.000)
(8) ROA (t − 1)0.0440.0870.0220.054−0.068−0.046
(0.044)(0.087)(0.046)(0.045)(0.032)(−0.046)
Constant0.004 ***0.005 ***0.0000.0030.005 ***0.004 ***
(0.001)(0.001)(0.003)(0.002)(0.002)(0.002)
Observation386386361361265265
Adjusted R-squared0.7630.0370.7700.0610.3560.098
Hausman Test Prob.0.000 0.000 0.005
Data were collected from Bloomberg, Wind, the banks’ financial reports, and the China Securitization Analytics website; t-statistics are in parentheses. *** p < 0.01, ** p < 0.05, * p < 0.10.
Table 13. Types of bank.
Kinds of BanksDerivation from Regression Results
(1) National commercial banksNational commercial banks = (C) National commercial banks
(2) City/rural commercial banksCity/rural commercial banks = (B) Commercial banks − (C) National commercial banks
(3) Policy banksPolicy banks = (A) Whole banks − (B) Commercial banks
Publisher’s Note: MDPI stays neutral with regard to jurisdictional claims in published maps and institutional affiliations.

