Time Varying Spillovers between the Online Search Volume and Stock Returns: Case of CESEE Markets


Abstract
1. Introduction
2. Related Research
3. Methodology Description
4. Results
4.1. Data Description
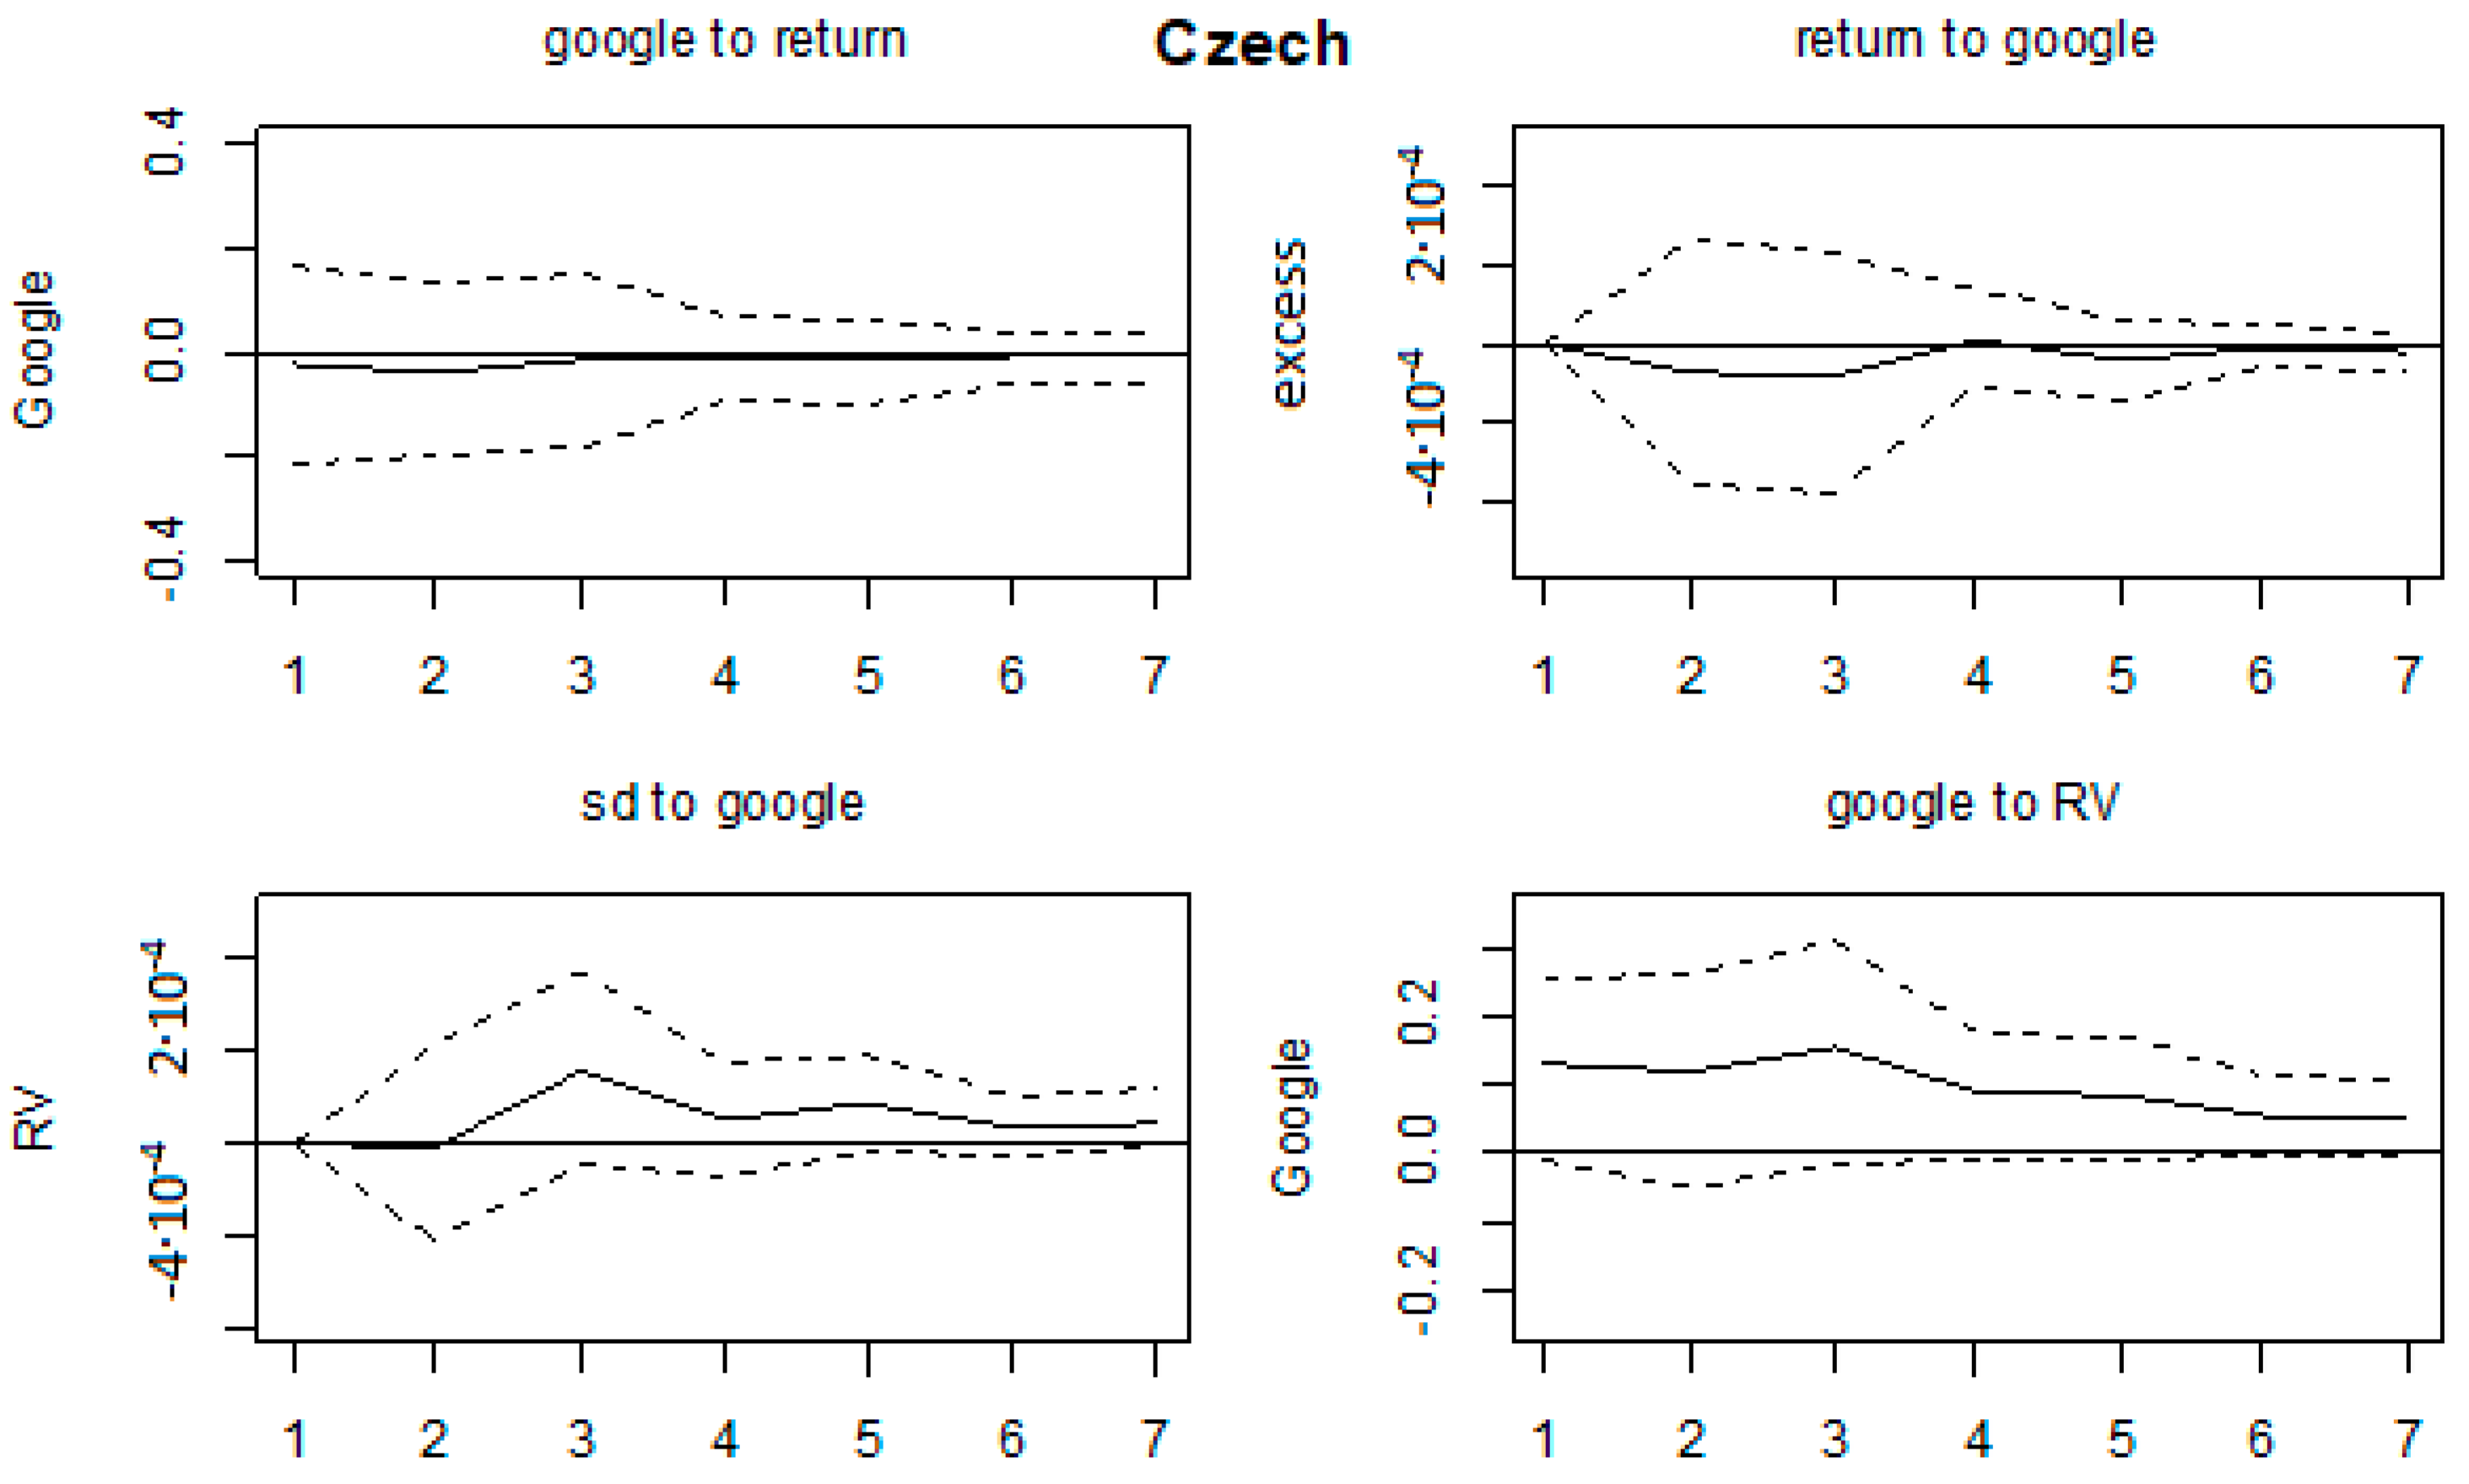
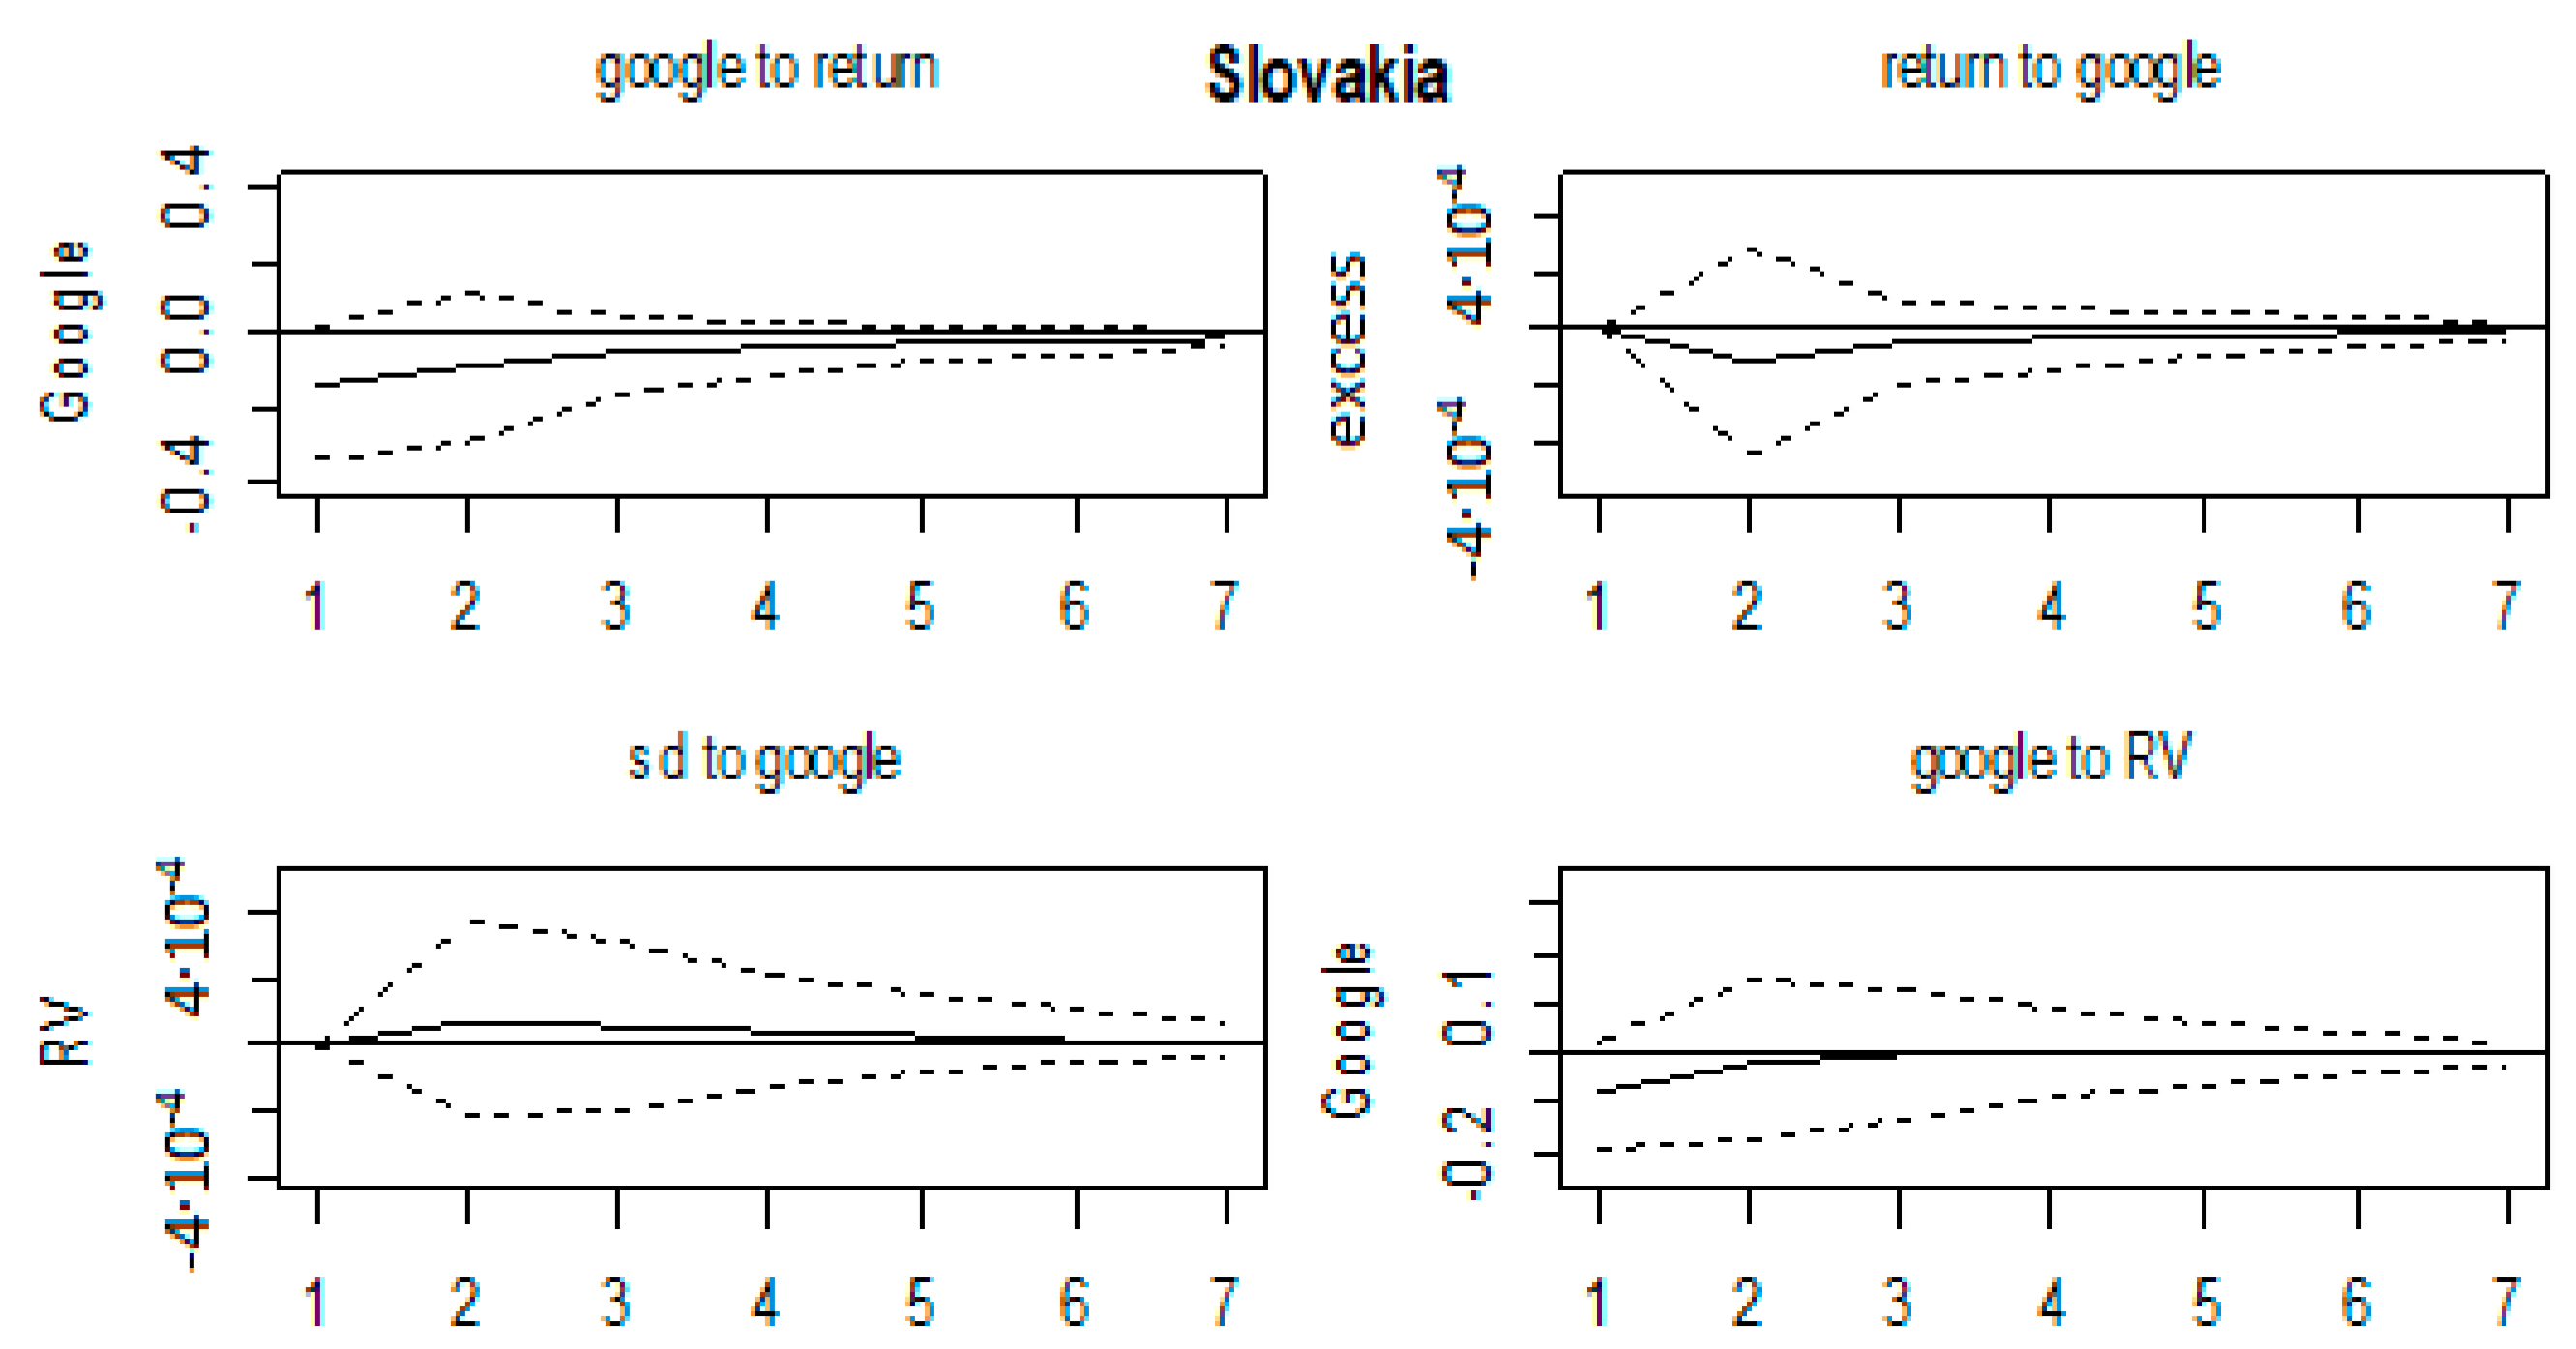
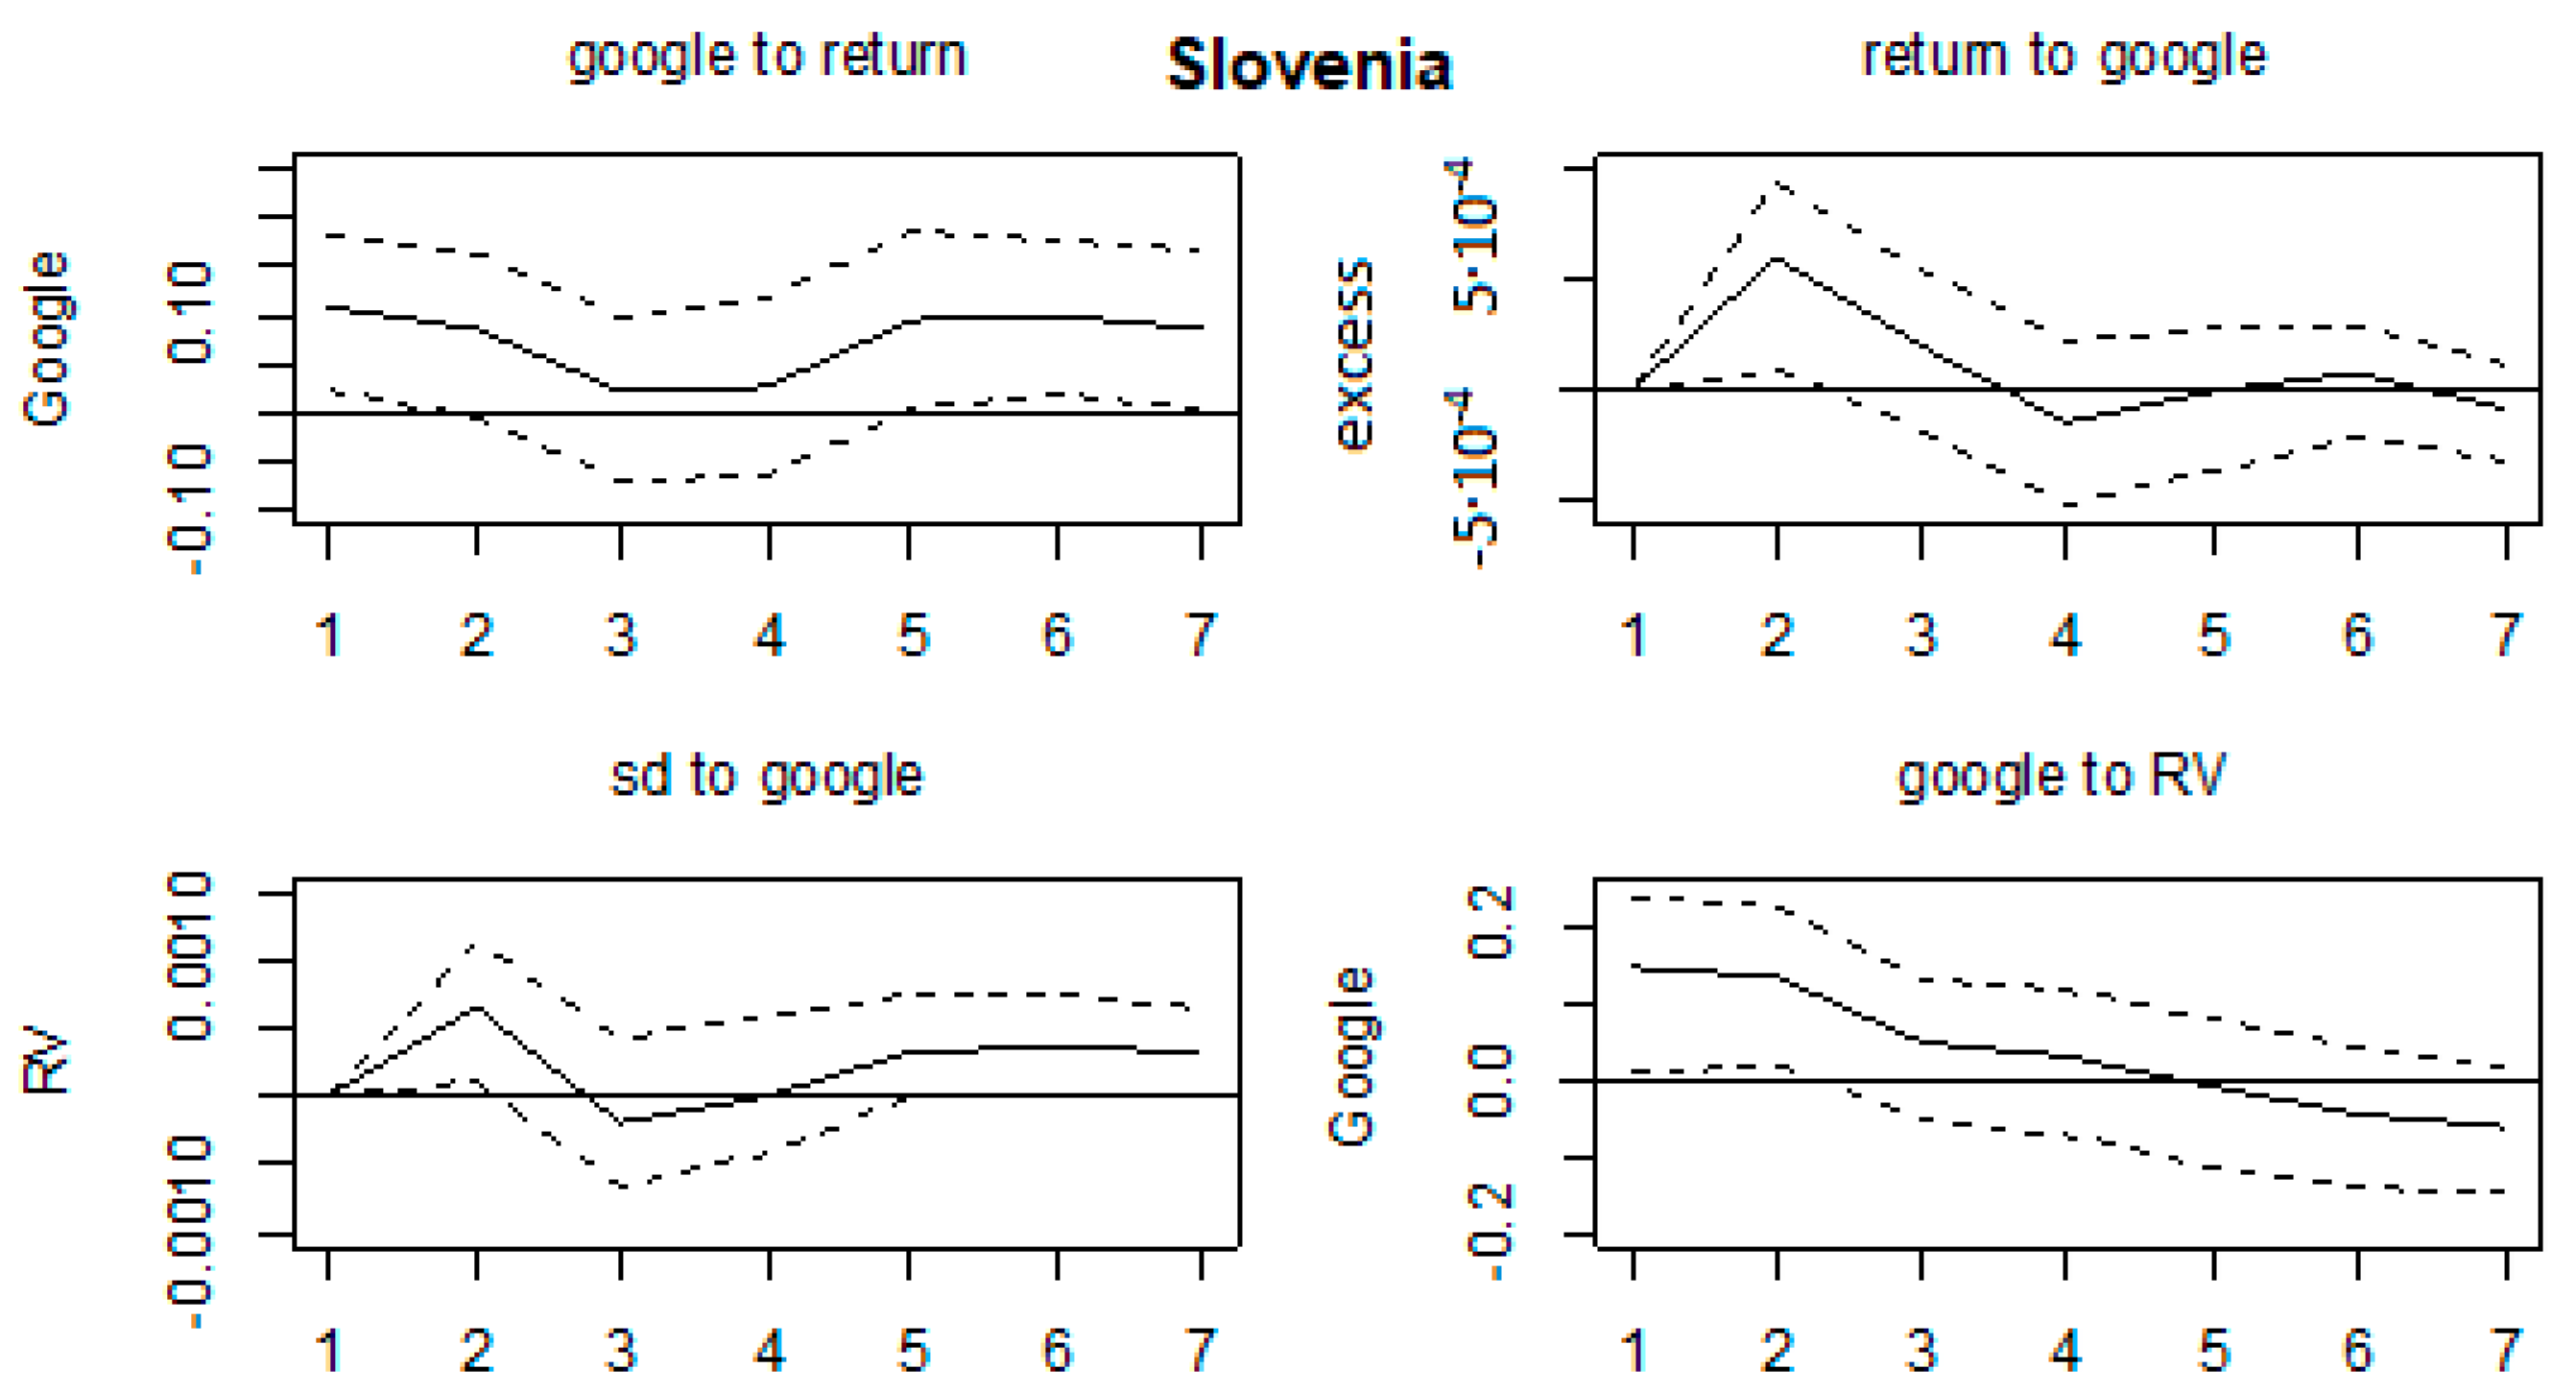
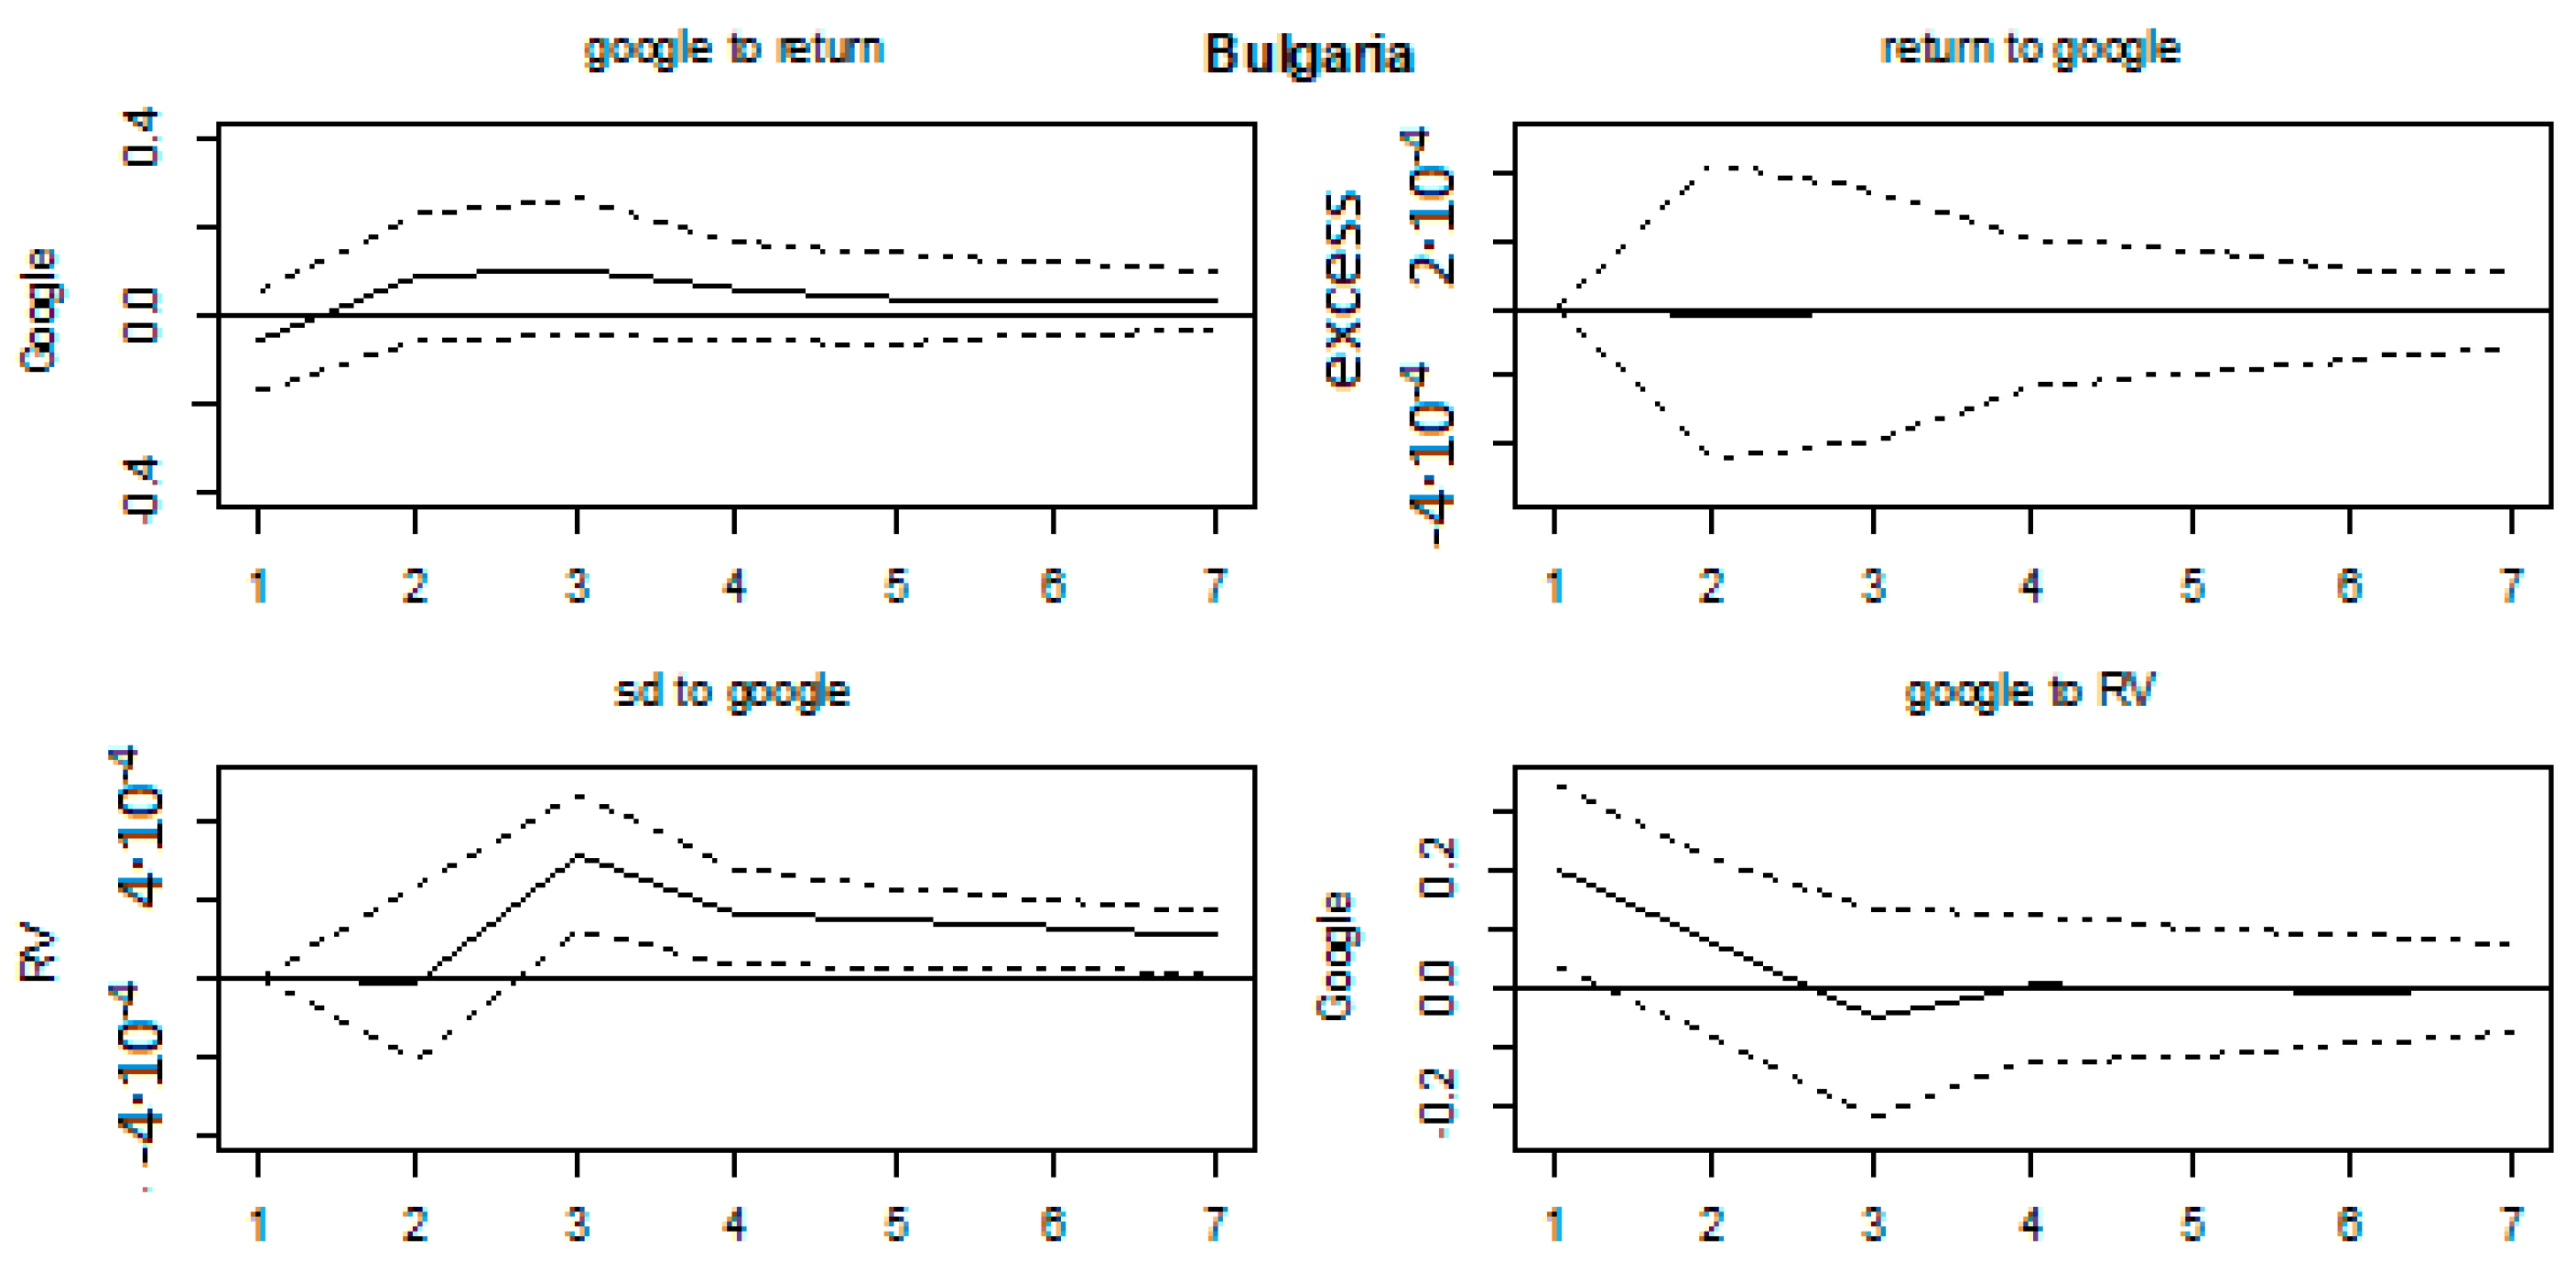
4.2. VAR Results
4.3. Spillover Indices Results
5. Conclusions
Funding
Acknowledgments
Conflicts of Interest
Appendix A

| Country | Return | Excess Return | Realized Volatility | Google Search Volume |
|---|---|---|---|---|
| Hungary | −7.0149 *** | −5.789 *** | −4.2054 *** | −3.6045 *** |
| Croatia | −8.2586 *** | −9.922 *** | −6.4532 *** | −3.1011 ** |
| Ukraine | −9.077 *** | −9.500 *** | −7.123 *** | −4.1481 *** |
| Slovenia | −6.0497 *** | −9.233 *** | −6.1911 *** | −2.8907 ** |
| Poland | −7.3147 *** | −7.483 *** | −5.3317 *** | −4.5645 *** |
| Bosnia and Herzegovina | −5.4507 *** | −6.227 *** | −4.7188 *** | −5.3291 *** |
| Czech Republic | −8.8916 *** | −8.778 *** | −5.9225 *** | −3.633 *** |
| Slovakia | −7.1175 *** | −6.902 *** | −5.5583 *** | −4.295 *** |
| Bulgaria | −5.5037 *** | −6.945 *** | −6.279 *** | −2.6779 * |
| Serbia | −6.9199 *** | −6.622 *** | −5.4058 *** | −3.7528 *** |
| Country | Multivariate Test | |
|---|---|---|
| ARCH Test | LM Test | |
| Hungary | 413.320 (0.733) | 47.697 (0.092) * |
| Croatia | 400.230 (0.302) | 13.901 (0.126) |
| Ukraine | 14.959 (0.092) * | 38.405 (0.361) |
| Slovenia | 48.593 (0.078) * | 26.446 (0.090) * |
| Poland | 437.540 (0.417) | 99.827 (0.700) |
| Bosnia and Herzegovina | 396.000 (0.892) | 18.77 (0.406) |
| Czech Republic | 443.040 (0.346) | 10.973 (0.278) |
| Slovakia | 453.760 (0.226) | 119.68 (0.208) |
| Bulgaria | 438.880 (0.412) | 131.48 (0.062) * |
| Serbia | 396.000 (0.892) | 99.431 (0.710) |


References
- Aalborg, Halvor Aarhus, Peter Molnár, and Jon Erik de Vries. 2019. What can explain the price, volatility and trading volume of Bitcoin? Finance Research Letters 29: 255–65. [Google Scholar] [CrossRef]
- Andersen, Torben, and Tim Bollerslev. 1998. Answering the sceptics: Yes standard volatility models do provide accurate forecasts. International Economic Review 39: 885–905. [Google Scholar] [CrossRef]
- Andrei, Daniel, and Michael Hasler. 2014. Investor attention and stock market volatility. The Review of Financial Studies 28: 33–72. [Google Scholar] [CrossRef]
- Andries, Alin Marius, Iulian Ihnatov, and Nicu Sprincean. 2018. Do seasonal anomalies still exist in central and eastern European countries? A conditional variance approach. Romanian Journal of Economic Forecasting 20: 60–83. [Google Scholar]
- Antonakakais, Nikolas, Cristhophe Andre, and Rangan Gupta. 2016. Dynamic Spillovers in the United States: Stock Market, Housing, Uncertainty, and the Macroeconomy. Southern Economic Journal 83: 609–24. [Google Scholar] [CrossRef]
- Baele, Lieven, Geert Bekaert, and Larissa Schäfer. 2015. An Anatomy of Central and Eastern European Equity Markets. Columbia Business School Working Paper, No. 15–71. Singapore: Columbia Business School. [Google Scholar]
- Bank, Matthias, Martin Larch, and Georg Peter. 2011. Google search volume and its influence on liquidity and returns of German stocks. Financial Markets and Portfolio Management 25: 239–64. [Google Scholar] [CrossRef]
- Barber, Brad, and Terrance Odean. 2007. All that glitters: The effect of attention and news on the buying behavior of individual and institutional investors. Review of Financial Studies 21: 785–818. [Google Scholar] [CrossRef]
- Barndorff-Nielsen, Ole, and Neil Shephard. 2002. Econometric analysis of realised volatility and its use in estimating stochastic volatility models. Journal of the Royal Statistical Society 64: 253–80. [Google Scholar] [CrossRef]
- Bijl, Laurens, Glenn Kringhaug, Peter Molnár, and Eirik Sandvik. 2016. Google searches and stock returns. International Review of Financial Analysis 45: 150–56. [Google Scholar] [CrossRef]
- Black, Fischer. 1986. Noise. The Journal of Finance 41: 529–43. [Google Scholar] [CrossRef]
- Bortoli, Clement, and Stephane Combes. 2015. Contribution from Google Trends for Forecasting the Short-Term Economic Outlook in France: Limited Avenues. Institut National de la Statistique et des Éstudes Économiques. Available online: https://www.insee.fr/en/statistiques/1408911?sommaire=1408916 (accessed on 25 May 2019).
- Chen, Tao. 2017. Investor Attention and Global Stock Returns. Journal of Behavioral Finance 18: 358–72. [Google Scholar] [CrossRef]
- Chen, Joseph, Harrison Hong, and Jeremy Stein. 2002. Breadth of Ownership and Stock Returns. Journal of Financial Economics 66: 171–205. [Google Scholar] [CrossRef]
- Chen, Jian, Guohao Tang, Jiaquan Yao, and Guofu Zhou. 2019. Investor Attention and Stock Returns. Available online: https://ssrn.com/abstract=3194387 (accessed on 25 May 2019).
- Da, Zhi, Joseph Engelberg, and Pngjie Gao. 2010. The Sum of All Fears: Investor Sentiment and Asset Prices, SSRN eLibrary. Available online: https://pdfs.semanticscholar.org/cc4f/6f4dba88381810412ea3d929715f38cb9ee0.pdf (accessed on 25 May 2019).
- Da, Zhi, Joseph Engelberg, and Pengjie Gao. 2011. In search of attention. The Journal of Finance 66: 1461–99. [Google Scholar] [CrossRef]
- De Long Bradford, James, Andrei Shleifer, Lawrence Summers, and Robert Waldmann. 1990. Noise trader risk in financial markets. Journal of Political Economy 98: 703–38. [Google Scholar] [CrossRef]
- Demirer, Mert, Umut Gokcen, and Kamil Yilmaz. 2018. Financial Sector Volatility Connectedness and Equity Returns. Koc University-TUSIAD Economic Research Forum, Working Paper No. 1803. Istanbul: Koc University. [Google Scholar]
- Dergiades, Theologos, Eleni Mavragani, and Bing Pan. 2018. Google trends and tourists’ arrivals: Emerging biases and proposed corrections. Tourism Management 66: 108–20. [Google Scholar] [CrossRef]
- Diebold, Francis, and Kamil Yilmaz. 2009. Measuring Financial Asset Return and Volatility Spillovers with Application to Global Equity Markets. The Economic Journal 119: 158–71. [Google Scholar] [CrossRef]
- Diebold, Francis, and Kamil Yilmaz. 2011. Equity Market Spillovers in the Americas. In Financial Stability, Monetary Policy, and Central Banking. Bank of Chile Central Banking Series 5; Edited by Rodrigo Alfaro. Santiago: Bank of Chile Central Banking, pp. 199–214. [Google Scholar]
- Diebold, Francis, and Kamil Yilmaz. 2012. Better to Give than to Receive: Predictive Directional Measurement of Volatility Spillovers. International Journal of Forecasting 28: 57–66. [Google Scholar] [CrossRef]
- Dimpfl, Thomas, and Stephan Jank. 2016. Can Internet Search Queries Help to Predict Stock Market Volatility? European Financial Management 22: 171–92. [Google Scholar] [CrossRef]
- Dzielinski, Michal. 2012. Measuring economic uncertainty and its impact on the stock market. Finance Research Letters 9: 167–75. [Google Scholar] [CrossRef]
- Fama, Eugene. 1965. Random Walks in Stock Market Prices. Financial Analysts Journal 21: 55–59. [Google Scholar] [CrossRef]
- Fama, Eugene. 1970. Efficient Capital Markets: A Review of Theory and Empirical Work. The Journal of Finance 25: 383–417. [Google Scholar] [CrossRef]
- Fang, Lily, and Joel Peress. 2009. Media Coverage and the Cross-section of Stock Returns. The Journal of Finance 64: 2023–52. [Google Scholar] [CrossRef]
- Ferreira, Paulo. 2018. Long-range dependencies of Eastern European stock markets: A dynamic detrended analysis. Physica A 505: 454–70. [Google Scholar] [CrossRef]
- Frieder, Laura, and Avanidhar Subrahmanyam. 2005. Brand Perceptions and the Market for Common Stock. Journal of Financial and Quantitative Analysis 40: 57–85. [Google Scholar] [CrossRef]
- Goddard, John, Arben Kita, and Qingwei Wang. 2015. Investor attention and FX market volatility. Journal of International Financial Markets, Institutions & Money 38: 79–96. [Google Scholar]
- Goel, Sharad, Jake Hofman, Sebastien Lahaie, David Pennock, and Duncan Watts. 2010. Predicting consumer behavior with Web search. Proceedings of the National Academy of Sciences of the United States of America 107: 17486–90. [Google Scholar] [CrossRef]
- Google Trends Data. 2019. Available online: https://trends.google.com/trends/ (accessed on 25 May 2019).
- Grinblatt, Mark, and Matti Keloharju. 2000. The investment behavior and performance of various investor types: A study of Finland’s unique data set. Journal of Financial Economics 55: 43–67. [Google Scholar] [CrossRef]
- Grullon, Gustavo, George Kanatas, and James Weston. 2004. Advertising, breadth of ownership, and liquidity. Review of Financial Studies 17: 439–61. [Google Scholar] [CrossRef]
- Habibah, Ume, Suresh Rajput, and Ranjeta Sadhwani. 2017. Stock market return predictability: Google pessimistic sentiments versus fear gauge. Cogent Economics & Finance 5: 1390897. [Google Scholar]
- Hamid, Alain, and Moritz Heiden. 2015. Forecasting volatility with empirical similarity and Google Trends. Journal of Economic Behavior & Organization 117: 62–81. [Google Scholar]
- Han, Liyan, Ziying Li, and Libo Yin. 2017. Investor Attention and Stock Returns: International Evidence. Emerging Markets Finance and Trade 54: 3168–88. [Google Scholar] [CrossRef]
- Havranek, Tomas, and Ayaz Zeynalov. 2018. Forecasting Tourist Arrivals: Google Trends Meets Mixed Frequency Data. Munich Personal RePEc Archive, MPRA paper No. 90203. Munich: Munich University Library. [Google Scholar]
- Investing Data Website. 2019. Available online: https://www.investing.com/ (accessed on 25 May 2019).
- Joseph, Kissain, Babajide Wintoki, and Zelin Zhang. 2011. Forecasting abnormal stock returns and trading volume using investor sentiment: Evidence from online search. International Journal of Forecasting 27: 1116–27. [Google Scholar] [CrossRef]
- Jun, Seung-Pyo, Hyoung Sun Yoo, and San Choi. 2018. Ten years of research change using Google Trends: From the perspective of big data utilizations and applications. Technological Forecasting & Social Change 130: 69–87. [Google Scholar]
- Khan, Mehwish Aziz, and Eatzaz Ahmad. 2018. Measurement of Investor Sentiment and Its Bi-Directional Contemporaneous and Lead–Lag Relationship with Returns: Evidence from Pakistan. Sustainability 11: 94. [Google Scholar] [CrossRef]
- Kim, Neri, Katarína Lučivjanská, Peter Molnár, and Roviel Villa. 2019. Google searches and stock market activity: Evidence from Norway. Finance Research Letters 28: 208–20. [Google Scholar] [CrossRef]
- Koop, Gary, Mashem Pesaran, and Simon Potter. 1996. Impulse response analysis in nonlinear multivariate models. Journal of Econometrics 74: 119–47. [Google Scholar] [CrossRef]
- Lehavy, Reuven, and Richard Sloan. 2008. Investor recognition and stock returns. Review of Accounting Studies 13: 327–61. [Google Scholar] [CrossRef]
- Li, Jun, and Jiangfeng Yu. 2012. Investor Attention, Psychological Anchors, and Stock Return Predictability. Journal of Financial Economics 104: 401–19. [Google Scholar] [CrossRef]
- Lütkepohl, Helmut. 1993. Introduction to Multiple Time Series Analysis. Berlin: Springer. [Google Scholar]
- Lütkepohl, Helmut. 2006. New Introduction to Multiple Time Series Analysis. Berlin: Springer. [Google Scholar]
- Lütkepohl, Helmut. 2010. Vector Autoregressive Models. Economics Working Paper ECO 2011/30. Fiesole: European University Institute. [Google Scholar]
- Merton, Robert. 1987. A simple model of capital market equilibrium with incomplete information. The Journal of Finance 42: 483–510. [Google Scholar] [CrossRef]
- Molnár, Peter, and Milan Bašta. 2017. Google searches and Gasoline prices. Paper presented at 2017 14th International Conference on the European Energy Market (EEM), Dresden, Germany, June 6–9; pp. 1–5. [Google Scholar]
- Mondria, Jordi, Thomas Wu, and Yi Zhang. 2010. The determinants of international investment and attention allocation: Using internet search query data. Journal of International Economics 82: 85–95. [Google Scholar] [CrossRef]
- Necula, Ciprian, and Alina-Nicoleta Radu. 2012. Long Memory in Eastern European Financial Markets Returns. Economic Research 25: 316–77. [Google Scholar] [CrossRef]
- Netmarketshare. 2019. Available online: https://netmarketshare.com (accessed on 25 May 2019).
- Odean, Terrance. 1998. Are investors reluctant to realize their losses? The Journal of Finance 53: 1775–98. [Google Scholar] [CrossRef]
- Önder, Irem. 2017. Forecasting tourism demand with Google trends: Accuracy comparison of countries versus cities. International Journal of Tourism Research 19: 648–660. [Google Scholar] [CrossRef]
- Padungsaksawasdi, Chaiyuth, Sirimon Treepongkaruna, and Robert Brooks. 2019. Investor Attention and Stock Market Activities: New Evidence from Panel Data. International Journal of Financial Studies 7: 30. [Google Scholar] [CrossRef]
- Peng, Lin, and Wei Xiong. 2006. Investor attention, overconfidence and category learning. Journal of Financial Economics 80: 563–602. [Google Scholar] [CrossRef]
- Pesaran, Hashem, and Yongcheol Shin. 1998. Generalized impulse response analysis in linear multivariate models. Economics Letters 58: 17–29. [Google Scholar] [CrossRef]
- Preis, Tobias, Daniel Reith, and Eugene Stanley. 2010. Complex dynamics of our economic life on different scales: Insights from search engine query data. Philosophical Transactions of the Royal Society A 368: 5707–19. [Google Scholar] [CrossRef]
- Preis, Tobias, Helen Susannah Moat, and Eugene Stanley. 2013. Quantifying Trading Behavior in Financial Markets Using Google Trends. Scientific Reports 3: 1684. [Google Scholar] [CrossRef]
- Sibley, Steven, Yanchu Wang, Yuhang Xing, and Xiaoyan Zhang. 2016. The information content of the sentiment index. Journal of Banking & Finance 62: 164–79. [Google Scholar]
- Škrinjarić, Tihana. 2018a. Mogu li Google trend podaci poboljšati prognoziranje prinosa na Zagrebačkoj burzi? (Can Google trend data enhance return forecasting on Zagreb Stock Exchange?). Zbornik radova Ekonomskog fakulteta Sveučilišta u Mostaru (Journal of Economy and Business, University of Mostar) 24: 58–76. [Google Scholar]
- Škrinjarić, Tihana. 2018b. The value of food sector on Croatian capital market if the Agrokor crisis did not happen: Synthetic control method approach. CEA Journal of Economics 13: 53–65. [Google Scholar]
- Škrinjarić, Tihana. 2018c. Testing for Seasonal Affective Disorder on Selected CEE and SEE Stock Markets. Risks 6: 140. [Google Scholar] [CrossRef]
- Škrinjarić, Tihana, and Mirjana Čižmešija. 2019. Investor attention and risk predictability: A spillover index approach. Paper presented at the 15th International Symposium on Operations Research in Slovenia, Bled, Slovenia, September 25–27; pp. 423–28. [Google Scholar]
- Škrinjarić, Tihana, and Zrinka Orlović. 2019. Effects of economic and political events on stock returns: Event study of Agrokor case in Croatia. Croatian Economic Survey 21: 47–86. [Google Scholar] [CrossRef]
- Smith, Geoffrey Peter. 2012. Google Internet Search Activity and Volatility Prediction in the Market for Foreign Currency. Finance Research Letters 9: 103–10. [Google Scholar] [CrossRef]
- Takeda, Fumika, and Takumi Wakao. 2014. Google search intensity and its relationship with returns and trading volume of Japanese stocks. Pacific-Basin Finance Journal 27: 1–18. [Google Scholar] [CrossRef]
- Tan, Selin Düz, and Oktay Tas. 2019. Investor attention and stock returns: Evidence from Borsa Istanbul. Borsa Istanbul Review 19: 106–16. [Google Scholar]
- Tantaopas, Parkpoom, Chaiyuth Padungsaksawasdi, and Sirimon Treepongkaruna. 2016. Attention effect via internet search intensity in Asia-Pacific stock markets. Pacific-Basin Finance Journal 38: 107–24. [Google Scholar] [CrossRef]
- Tkacz, Greg. 2013. Predicting Recessions in Real-Time: Mining Google Trends and Electronic Payments Data for Clues. C.D. Howe Institute, Issue 387. Toronto: C. D. Howe Institute Commentary. [Google Scholar]
- Urbina, Jilber. 2013. Financial Spillovers across Countries: Measuring Shock Transmissions. MPRA Working Paper. Munich: Munich Personal RePEc Archive. [Google Scholar]
- Vlastakis, Nikolas, and Raphael Markellos. 2012. Information demand and stock market volatility. Journal of Banking & Finance 36: 1808–21. [Google Scholar]
- Vosen, Simeon, and Torsten Schmidt. 2011. Forecasting Private Consumption: Survey Based Indicators vs. Google Trends. Journal of Forecasting 30: 565–78. [Google Scholar] [CrossRef]
- Vozlyublennaia, Nadia. 2014. Investor attention, index performance, and return predictability. Journal of Banking & Finance 41: 17–35. [Google Scholar]
- Woo, Jaemin, and Ann Owen. 2019. Forecasting private consumption with Google Trends data. Journal of Forecasting 38: 81–89. [Google Scholar] [CrossRef]
- Yang, Tian, Jinsong Liu, Qianwei Ying, and Tahir Yousaf. 2019. Media Coverage and Sustainable Stock Returns: Evidence from China. Sustainability 11: 2335. [Google Scholar] [CrossRef]
- Zhang Wei, Dehua Shen, Yongjie Zhang, and Xiong Xiong. 2013. Open source information, investor attention, and asset pricing. Economic Modelling 33: 613–619. [Google Scholar] [CrossRef]
- Zhang, Junru, Hadrian Geri Djajadikerta, and Zhaoyong Zhang. 2018. Does Sustainability Engagement Affect Stock Return Volatility? Evidence from the Chinese Financial Market. Sustainability 10: 3361. [Google Scholar] [CrossRef]
| 1 | For details, please see Lehavy and Sloan (2008). |
| 2 | Autoregressive integrated moving average—generalized autoregressive conditional heteroskedasticity. |
| 3 | Vector auto regression. |
| 4 | Individual company names are utilized in studies, which observe those company returns series, as in Preis et al. (2010); Bijl et al. (2016); Tan and Tas (2019) and Khan and Ahmad (2018). |
| 5 | Authors observed Romania, Hungary, Czech Republic, Poland, Slovenia, Bulgaria, Slovakia and Croatia and found inefficiencies of the stock markets by using the fractional differencing approach. |
| 6 | Authors compared CEE stock markets by using a variety of measures regarding growth, development, concentration, etc. Although these countries faced a similar past regarding the economic system, their stock markets today have somewhat great differences in terms of market concentration, liquidity, etc. |


| Country | Initial Date | N | Index Name |
|---|---|---|---|
| Hungary | March 2011 | 100 | BUX |
| Croatia | January 2004 | 186 | CROBEX |
| Ukraine | January 2004 | 186 | PFTS |
| Slovenia | April 2006 | 159 | SBITOP |
| Poland | March 2011 | 100 | WIG |
| Bosnia and Herzegovina | December 2012 | 79 | BIRS |
| Czech Republic | January 2012 | 90 | PX |
| Slovakia | August 2011 | 95 | SAX |
| Bulgaria | August 2011 | 95 | SOFIX |
| Serbia | December 2012 | 79 | BELEX |
| Country | p (Length) |
|---|---|
| Hungary | 2 |
| Croatia | 6 |
| Ukraine | 3 |
| Slovenia | 4 |
| Poland | 1 |
| Bosnia and Herzegovina | 1 |
| Czech Republic | 2 |
| Slovakia | 1 |
| Bulgaria | 2 |
| Serbia | 1 |
| Country/Cause in the Granger Test | Excess Return | RV | GSV |
|---|---|---|---|
| Hungary | 1.148 (0.334) | 3.809 (0.005) *** | 2.169 (0.073) * |
| Croatia | 0.506 (0.911) | 3.808 (0.000) *** | 3.559 (0.000) *** |
| Ukraine | 1.393 (0.215) | 1.114 (0.341) | 1.111 (0.355) |
| Slovenia | 0.926 (0.495) | 6.881 (0.000) *** | 4.075 (0.000) *** |
| Poland | 0.027 (0.973) | 0.084 (0.919) | 0.517 (0.597) |
| Bosnia and Herzegovina | 2.607 (0.076) * | 0.374 (0.688) | 0.010 (0.989) |
| Czech Republic | 0.759 (0.553) | 0.709 (0.587) | 0.778 (0.540) |
| Slovakia | 0.403 (0.669) | 0.111 (0.895) | 0.410 (0.664) |
| Bulgaria | 1.590 (0.177) | 1.285 (0.276) | 3.175 (0.014) ** |
| Serbia | 0.454 (0.636) | 2.014 (0.136) | 2.655 (0.073) * |
| Excess Return | RV | GSV | From | |
|---|---|---|---|---|
| Excess Return | 95.34 | 2.30 | 2.36 | 1.55 |
| RV | 2.23 | 91.85 | 5.92 | 2.72 |
| GSV | 2.01 | 4.43 | 93.56 | 2.15 |
| TO | 1.41 | 2.24 | 2.76 | 6.42 |
| Excess Return | RV | GSV | From | |
|---|---|---|---|---|
| Excess Return | 91.45 | 7.23 | 1.32 | 2.85 |
| RV | 3.56 | 68.65 | 27.79 | 10.45 |
| GSV | 3.31 | 31.16 | 65.53 | 11.49 |
| TO | 2.29 | 12.80 | 9.70 | 24.79 |
| Excess Return | RV | GSV | From | |
|---|---|---|---|---|
| Excess Return | 70.55 | 16.03 | 13.42 | 9.82 |
| Std dev | 1.26 | 66.04 | 32.69 | 11.32 |
| GSV | 3.52 | 17.60 | 78.89 | 7.04 |
| TO | 1.59 | 11.21 | 15.37 | 28.17 |
| Excess Return | RV | GSV | From | |
|---|---|---|---|---|
| Excess Return | 98.28 | 1.48 | 0.24 | 0.57 |
| Std dev | 0.55 | 89.86 | 9.59 | 3.38 |
| GSV | 2.18 | 2.79 | 95.03 | 1.66 |
| TO | 0.91 | 1.42 | 3.28 | 5.61 |
| Excess Return | RV | GSV | From | |
|---|---|---|---|---|
| Excess Return | 98.41 | 1.36 | 0.23 | 0.53 |
| RV | 3.15 | 93.76 | 3.09 | 2.08 |
| GSV | 3.31 | 3.01 | 93.68 | 2.11 |
| TO | 2.15 | 1.46 | 1.11 | 4.72 |
| Excess Return | RV | GSV | From | |
|---|---|---|---|---|
| Excess Return | 98.17 | 1.36 | 0.47 | 0.61 |
| RV | 2.65 | 92.08 | 5.27 | 2.64 |
| GSV | 0.32 | 8.65 | 91.03 | 2.99 |
| TO | 0.99 | 3.34 | 1.91 | 6.24 |
| Excess Return | RV | GSV | From | |
|---|---|---|---|---|
| Excess Return | 96.28 | 0.63 | 3.09 | 1.24 |
| RV | 1.48 | 97.22 | 1.30 | 0.93 |
| GSV | 2.82 | 0.79 | 96.93 | 1.20 |
| TO | 1.43 | 0.47 | 1.46 | 3.37 |
| Excess Return | RV | GSV | From | |
|---|---|---|---|---|
| Excess Return | 74.92 | 17.19 | 7.89 | 8.36 |
| RV | 3.39 | 79.74 | 16.33 | 6.75 |
| GSV | 11.03 | 6.86 | 82.11 | 5.96 |
| TO | 4.99 | 8.02 | 8.07 | 21.07 |
| Excess Return | RV | GSV | From | |
|---|---|---|---|---|
| Excess Return | 99.17 | 0.11 | 0.72 | 0.28 |
| RV | 3.70 | 80.04 | 26.26 | 6.65 |
| GSV | 3.13 | 4.78 | 92.09 | 2.64 |
| TO | 2.28 | 1.63 | 5.66 | 9.57 |
| Excess Return | RV | GSV | From | |
|---|---|---|---|---|
| Excess Return | 97.86 | 0.83 | 1.31 | 0.71 |
| RV | 0.24 | 61.54 | 38.22 | 12.82 |
| GSV | 0.11 | 36.87 | 63.02 | 12.33 |
| TO | 0.12 | 12.57 | 13.17 | 25.86 |
© 2019 by the author. Licensee MDPI, Basel, Switzerland. This article is an open access article distributed under the terms and conditions of the Creative Commons Attribution (CC BY) license (http://creativecommons.org/licenses/by/4.0/).
Share and Cite
Škrinjarić, T. Time Varying Spillovers between the Online Search Volume and Stock Returns: Case of CESEE Markets. Int. J. Financial Stud. 2019, 7, 59. https://doi.org/10.3390/ijfs7040059
Škrinjarić T. Time Varying Spillovers between the Online Search Volume and Stock Returns: Case of CESEE Markets. International Journal of Financial Studies. 2019; 7(4):59. https://doi.org/10.3390/ijfs7040059
Chicago/Turabian StyleŠkrinjarić, Tihana. 2019. "Time Varying Spillovers between the Online Search Volume and Stock Returns: Case of CESEE Markets" International Journal of Financial Studies 7, no. 4: 59. https://doi.org/10.3390/ijfs7040059
APA StyleŠkrinjarić, T. (2019). Time Varying Spillovers between the Online Search Volume and Stock Returns: Case of CESEE Markets. International Journal of Financial Studies, 7(4), 59. https://doi.org/10.3390/ijfs7040059