Article

Currency Market Efficiency Revisited: Evidence from Korea

Centre for Financial Law, Legal Research Institute of Korea University, Seoul 02841, Korea
Int. J. Financial Stud. 2019, 7(3), 52; https://doi.org/10.3390/ijfs7030052
Submission received: 15 May 2019 / Revised: 9 September 2019 / Accepted: 11 September 2019 / Published: 16 September 2019

Abstract

:
This study aims to test the efficiency of the Korean foreign exchange market and examine its determinants through several well-established methodologies based on the forward rate unbiasedness hypothesis and covered interest rate parity. The empirical findings indicate that the currency market and its related derivatives markets seem to be inefficient during the 2006–2016 period, but have improved considerably after the 2008 global financial crisis. Further, as the main culprits of market inefficiency, we stress the presence of risk premia in the international financial market and the role of central bank intervention.

1. Introduction

The currency or foreign exchange market is commonly deemed to be the largest and most efficient financial market, where large, fast-paced transactions are performed worldwide and around the clock, with average daily trading volumes in the trillions of dollars (Bank of International Settlement 2016). Particularly, the foreign exchange (FX) market is often considered to be the closest to a perfectly competitive market in which every participant is a price taker. All currency traders are assumed to obtain identical and complete sets of information on the market price, and reflect it fully and instantaneously in their decision making. That is to say, the currency market is informationally efficient in the spirit of Fama’s classical argument of efficient capital market hypothesis, with applications to foreign exchange trading. Therefore, it is generally believed that any participants cannot systematically generate excess profits by trading in such a highly decentralized market.
However, the efficiency of the foreign exchange market since the 2008 global financial crisis (GFC) has come under increasing criticism. Close scrutiny by regulators revealed FX rigging scandals, mainly involving large globally-renowned banks, which led to dozens of traders being laid off, and banks involved in market manipulation being fined up to several hundred billion dollars (Finch 2017). Contrary to the common belief that the foreign exchange market is so efficient that no individual is able to affect the exchange rate, major cartel traders managed to rig the currency market.
The skeptical view of an efficiently functioning foreign exchange market can be seen from another angle. Suppose the currency market is extremely efficient, as it is considered to be. Mispricing should be rare and may not persist in the market. Instead, it eventually disappears as the price discrepancies draw speculators who seek a risk-free return using the “buy low and sell high” strategy to promptly eliminate mispricing. Unfortunately, however, data sometimes tells a different story.
The objective of this study is to investigate whether the Korean currency market has been functioning efficiently. To this end, we perform several statistical tests to examine the hypothesis that systematically generating excess profits is not possible for an extended period of time using data from the Korean FX market, where previous studies are still limited, especially for the post-GFC period. We then explore the underlying factors that influence market transactions. In particular, we incorporate transaction costs, including the relevant risk components (credit and liquidity) explicitly into the analysis, and emphasize the role of market intervention by the central bank. More importantly, we not only consider transactions in the currency market, but also those in its related derivatives (swap) market, because the two markets are closely linked and a thorough understanding of inter-market transactions is necessary to effectively tackle the analysis. This comprehensive approach makes an important contribution to the literature.
The remainder of the paper is organized as follows: Section 2 presents a literature review and some basic analytical frameworks designed for the empirical analyses. Section 3 describes the data and methodologies. Consequently, in Section 4, empirical analysis is performed and interpretations of the results are provided. Finally, Section 5 provides concluding remarks.

2. Analytical Framework and a Review of the Relevant Literature

Conceptually, market efficiency indicates informational efficiency. In an efficient market, prices at any given time fully reflect all available information relevant to the process of price formation (Fama 1970); thus, making it impossible for market participants to earn abnormal returns by exploiting the known information set. The original concept of “efficiency” in a capital market can be applied to a foreign exchange market in exactly the same manner.
As documented by Jensen (1978), the efficient market hypothesis (EMH) places its theoretical basis on the “random walk hypothesis” and “rational expectations hypothesis”, both of which are dominant paradigms in modern finance and macroeconomics. Therefore, in an efficient foreign exchange market, the price (i.e., exchange rate) changes must have identical and independent distributions (i.i.d.), so that the past movement or trend of the exchange rate and trading volume of the currency itself cannot be used to predict future changes in exchange rates (random walk theory). Moreover, an agent cannot form expectations of price changes that are systemically different from the market consensus on the same informational basis (rational expectation theory).
On the basis of these arguments, we can now develop the framework for testing the EMH in the foreign exchange market, which is generally called the “forward rate unbiasedness hypothesis” (FRUH). The FRUH states that without any transaction costs or risk premia, there must be a one-to-one relationship between the forward rate and its corresponding future spot rate (see Equation (1)):
E t ( s t + m ) = f t ,
where E t is an expectation operator conditioned on the information set available at time t, s t + m is the spot rate at time t + m, and f t is the forward rate on the contract date t.
Suppose we do not reject the rational expectations hypothesis (Muth 1961) that a systematic error cannot arise in the formation of expectations but agents can correctly predict market prices on average and over time. Muth’s notion can be expressed in mathematical terms, as indicated by Equation (2):
s t + m = E ( s t + m ) + ε t + m ,
where ε t + m , the realized forecast error, must have an expected value of zero, conditional on all the publicly known information. Therefore, Equation (2) implies that, to the extent that agents reflect all the past information on exchange rates, the best estimate of the future spot rate is the currently expected value itself.
Subsequently, substituting Equation (1) into (2) yields a more intuitive form of Equation (3), which, in turn, can be transformed into the linear regression Equation (4):
s t + m = f t + ε t + m ,
s t + m = α + β f t m + ε t + m .
Eventually, in order for FRUH to be empirically supported, the coefficients on the constant and the independent variable (i.e., forward rate) in Equation (4), or ( α , β ) must be (0,1), respectively, and the error term must follow a white-noise process. If α is statistically and significantly different from zero and β is not estimated to be equal to one, the forward rate is not an unbiased predictor of the future spot rate, which means that there can be some exploitable arbitrage opportunities during the spot and forward exchange market transactions. In other words, the criterion for market efficiency is violated.
However, when the underlying assumption of risk neutrality and rational expectations does not hold, testing the hypothesis might not be valid any more. We need to be cautious while interpreting the results using the above-mentioned approach. Even if the statistical test of Equation (4) rejects the null hypothesis of α = 0 and β = 1, there is no guarantee that the foreign exchange market is not efficient and we should be ready to control for more explanatory factors (e.g., transaction costs, risk premia) in the original equation for further analysis.
There is abundant theoretical and empirical literature exploring the validity of the FRUH, and the evidence is decidedly mixed depending on the sample periods and currency pairs analyzed (see Table 1). Earlier tests (Cornell 1977; Frankel 1980; Levich 1989) on major currencies (e.g., U.S. dollar, U.K. pound, Deutsche mark) mostly supported that the forward rate is an unbiased predictor of the future spot rates from the observation that the forecast error, the difference between the forward rate and its corresponding future spot rate, was estimated to be zero without any significant autocorrelation.
Moreover, the cointegration technique has been widely used to test the presence of a long-run stable relationship between the forward rate and the future spot rates, and the findings are mixed. Hakkio and Rush (1989) demonstrated that the forward rate and spot exchange rate are cointegrated within the United Kingdom and Germany, but the unbiasedness hypothesis was rejected when tested using the error correction model (ECM). Baillie and Bollerslev (1989) found that the spot rate and forward rate in seven advanced countries are cointegrated with one common stochastic trend, but Evans and Lewis (1993) could not find such a cointegrated relationship. Regarding currency markets in the Asia-Pacific, Ahmad et al. (2012) asserted that the foreign exchange markets in the region appear to be efficient.
Another strand of literature, mainly attributed to Fama (1984), holds that the current forward premium is an unbiased estimator of the future depreciation rate and tested the presence of a one-to-one relationship. Fama’s approach, which is based on the simple linear regression analysis, has become the most popular approach for testing the FRUH. However, Fama’s conventional regression method failed to support the hypothesis, as indicated by a large body of literature (Baillie and Bollerslev 2000; Frankel and Poonawala 2010; Froot and Thaler 1990; Gilmore and Hayashi 2011; Sarno 2005). According to Froot and Thaler, many studies tested the FRUH and found that the slope coefficient ( β ) of the regression equation is reliably less than one, even less than zero in many cases. These results do not make any economic sense and are counterintuitive as well. The empirical finding of β < 1 indicates that when the domestic interest rate rises relative to the foreign interest rate and the forward premium rises accordingly, the spot exchange rate is not fully adjusted (or depreciated) enough to eliminate market disequilibrium. Especially, the negative value of β indicates that when the domestic interest rate and the forward premium rises, the domestic currency is expected to be stronger (or appreciated), which makes the foreign exchange market deviate from its equilibrium.
Further, we can extend these arguments on the foreign exchange market to the related swap market transactions. The foreign exchange market, where foreign currencies are traded and exchange rates are determined, and the swap market, where the borrowing of foreign currencies takes places and its corresponding interest rates are determined, are distinct fields. Nonetheless, traders and investors around the world move their funds with few restrictions in the international financial market, and foreign exchange transactions in both markets are often closely linked. The most common transaction pattern is lending or investing in bonds in the domestic market with funds borrowed from the foreign exchange (FX) swap for short-term instrument (e.g., commercial paper or certificate deposits) or currency swap market dealers for mid-term or long-term instruments (e.g., government issued notes or bonds). Currency exchange of foreign funds (e.g., U.S. dollars) into a domestic currency (e.g., Korean won) takes place via the foreign exchange market. Figure 1 exhibits a typical transaction flow chart.
As depicted in Figure 1, investors may draw credit from their foreign counterpart at a relatively low interest rate and convert the foreign currency for the domestic one to invest in the domestic securities that promise higher yields. Currency risk is hedged by a foreign exchange swap, or “sell and buy” transactions. Thus, a positive payoff from the carry trades becomes the arbitrage return. However, such a disparity cannot persist for a long time, as arbitrageurs exploiting excess profit will eventually correct the market disequilibrium. The presence of arbitrage opportunities in a large, persistent, systematic way is due to some critical market frictions, which is a sign that the currency market and its related derivatives market are not efficient. Equation (5), which represents the covered interest rate parity (CIP), suggests no arbitrage condition that must be met to ensure market equilibrium:
i d , t i f , t = ( f t m s t ) s t ,
where i d , t is the domestic interest rate, i f , t is the foreign interest rate, and the right side of the equation, or forward point divided by spot exchange rate, is often called the foreign exchange swap rate.
Equation (5) implies that hedged or covered returns from investing in different currencies should be the same, regardless of the level of their interest rates. When the interest rate in the home country ( i d , t ) is higher than the interest rate in a foreign country ( i f , t ), the domestic currency is expected to depreciate until the total return from the perspective of investors becomes equal, and vice versa. The deviation from covered interest rate parity indicates the presence of arbitrage opportunities and Equation (6) displays such a condition:
C I D = ( i d , t i f , t ) ( f t m s t ) s t ,
where CID is the abbreviation of covered interest rate parity (CIP) deviation.
The test results of the validity of CIP diverge, conditional upon the sample periods and markets studied. Many studies on major currencies generally support CIP during normal times, but a large deviation from CIP during the turbulence of crisis and its persistence through protracted periods of time has been highlighted. In tranquil times, the deviations can occur at any time, but they are generally short-lived when the financial market is hit by external shock, and it persists due to market frictions, mostly transaction costs (Bhar et al. 2004; Frenkel and Levich 1977; Taylor 1987). However, in turbulent times with highly uncertain market sentiment, the resilience mechanism does not usually work. Baba and Packer (2009) demonstrated that a heightened funding liquidity risk and counterparty risk during the 2008 GFC led to a sharp increase in CID of the U.S. dollar-Euro currency pairs and their finding was confirmed by Coffey et al. (2009) and Griffoli and Ranaldo (2012) for other currency pairs as well. Baba and Shim (2014) showed that a regime-switching analysis of CID identified a crisis period starting in mid-2007, and the crisis momentum was the main factor responsible for the sharp deviation of CIP in Korea.
Another notable hypothesis has been suggested to explain the CIP deviation in the Korean foreign exchange market. Song and Kim (2008) and Chang (2008) found that the Korean central bank’s intervention could hinder the currency market from balancing itself. Chang (2008) inferred that a central bank’s net purchase of foreign currencies led to a depreciation of the domestic currencies, and the higher spot exchange rate lowered the swap rate that resulted in the deviation from CIP. Park (2010) revealed the channel through which the market intervention associated with the sterilization policy might delay the adjustment process to reach equilibrium. According to Park (2010), a central bank responds to a massive capital influx by absorbing the excess foreign currencies (or reserve assets build up) to dampen the volatility of the exchange rate, which results in an increase in domestic currency liquidity. The central bank, in turn, absorbs the excess domestic currencies by issuing bonds (i.e., sterilization policy) for price stability (Ryoo et al. 2013), and the sales of these bonds could raise the bond rates, or at least prevent the domestic interest rate from falling, to restore equilibrium. An alternative policy option, meanwhile, was pursued; building swap arrangements with major central banks, such as the Fed. In the fourth quarter of 2008 (rightly after the GFC), the Bank of Korea entered into a USD 30 billion swap arrangement with the US Federal Reserve and a 180 billion yuan/KRW 38 trillion swap arrangement with the People’s Bank of China. The Korea central bank also expanded the ceiling of an existing bilateral currency swap agreement with the Bank of Japan from USD 3 billion equivalent to USD 20 billion equivalent (Chung 2010). The borrowed funds were provided to the domestic banks suffering from short-term foreign currency liquidity risk, which successfully worked. Through improved market confidence, the Korean foreign exchange and banking system quickly regained stability. Furthermore, what has drawn policy makers’ particular attention is that the US dollar loans of proceeds of swap with the Fed were effective, whereas the use of the BOK’s own foreign reserves was not (Baba and Shim 2014). Casting a doubt about the efficacy of central bank’s intervention using official reserves, several recent studies, having analyzed the policy effects on CIP deviations, stressed the key role of dollar swap lines established by the Fed, and other lenders of last resort, in ameliorating distortions in the FX swap market (e.g., Baba and Packer 2009; Coffey et al. 2009).

3. Data and Methodology

For the empirical analysis, we used the daily data on the spot and forward exchange rates over an 11-year period from 1 January 2006 to 31 December 2016, extracted from Bloomberg and the Bank of Korea (BOK) economic statistics databases. One notable aspect of this study is that we use off-shore non-deliverable forward (NDF) rates instead of on-shore forward exchange rates, because the Korean forward market is still premature in terms of access to non-resident investors and market liquidity, and as such, foreign investors hedge the currency risk or take their own speculative positions mostly in NDF markets. For instance, in 2016 the average daily trading volume of forward foreign exchange in the Korean interbank market was estimated to be around USD 0.25 billion, whilst the daily NDF transactions amounted to be USD 8.22 billion (Bank of Korea 2017). We choose the instrument with a three-month tenor on forward contracts, as it is the most actively traded instrument in the market. Moreover, we selected a sample period starting in 2006, when the Korean foreign exchange authority abolished the “capital transaction permission system,” transforming it into a reporting system. Hence, the foreign exchange market in Korea is at least “de jure” (by the law) recognized as having reached the comparable standards of liberalization in advanced economies.
Using the data, we conduct the market efficiency test, including a randomness check of exchange rate behavior. To this purpose, we implement “runs test”, which is a non-parametric statistical technique that can be used to test the hypothesis that a sequence of change in the spot exchange rate is produced in a random manner. If a series of elements are found to be randomly distributed (i.e., mutually independent), we can say that the foreign exchange market is working efficiently. We could have detected randomness through a test of serial correlation; however, using a non-parametric method has a clear advantage over a univariate distribution analysis using a significance test to assume normality (Burt et al. 1977), as the exchange rate distribution is strongly leptokurtic.
We then move to the discussion on FRUH and test the theoretical relationship using the same data set. As noted in the previous section, testing the FRUH has been widely used in the extant literature to examine foreign exchange market efficiency. As such, we use this framework and apply it to real data from the Korean currency market. We choose the following three ways of testing, set forth by academics, to replicate the empirical findings.
First, we compute the difference between the forward rate and its corresponding future spot exchange rate (i.e., forecast error), and examine whether the error terms are expected to be zero and serially correlated. When the forecast error is deemed not to be statistically and significantly different from zero, and they are unrelated to each other, we can conclude that the forward exchange rate is an unbiased predictor of its corresponding future spot exchange rate.
Second, we perform a time series analysis on the basis of the regression equations presented in the previous section. To be specific, we test the FRUH by running the regression of Equation (4), where s and f denote the logarithm of the spot rate and forward exchange rate, respectively. The time subscript t refers to the date of a forward contract made with m indicating the maturity period of the contract, while ε is the regression error term.
The spurious regression problem can be avoided by conducting unit root test and detecting the non-stationarity of the process of spot and forward exchange rates. If the forward rate and its associated future spot rate are integrated of order “d”, or I(d) process, respectively, each series can be rendered stationary after differencing them “d” times. Even if the individual series are deemed to be non-stationary, we can conclude that there exists a long-run equilibrium relationship between the variables, when they have common stochastic trends and their linear combination is integrated of order zero, or cointegrated. We apply the cointegration tests and error correction model (ECM) in the next stage and test the FRUH based on this technique.
Third, we replicate Fama’s (1984) regression method. Fama’s approach is seemingly different than the previous one, in that it tests the FRUH by regressing the change in the spot exchange rate on the current forward premium, not by running the “levels” regression such as in Equation (4). The specific form of regression is modeled in Equation (7):
Δ s t + m = α + β ( f t m s t ) + ε t ,
where Δ s implies the change in the spot exchange rate from time t to t + m, while the remaining notations in Equation (7) are the same as that in Equation (4). In the equation above, if the coefficients of α and β are zero and one, respectively, we can say that the FRUH holds true and, thus, the forward rate is an unbiased estimator of the corresponding future spot rate, which supports the efficient foreign exchange market hypothesis.
Furthermore, as noted in the previous section, we can investigate the market efficiency issue through the lens of covered interest rate parity (CIP). The deviation from CIP indicates possible arbitrage opportunities in the markets, implying that the efficient market hypothesis can be rejected in the foreign exchange market. The interest rates used to derive CIP are the three-month certificate deposit (CD) rate for the domestic part, and three-month Libor for the foreign counterpart.
For further analysis, we also calculated the risk-adjusted arbitrage opportunities, which recognize the presence of a neutral band (Frenkel and Levich 1975) where arbitrageurs do not actively trade in the market due to the transaction costs and risk premia that must be paid. The effective trading cost is estimated to have averaged 100 basis points during the whole sample period and around 60 basis points since the 2008 crisis moment, which implies that at least these amounts of arbitrage opportunities are needed to attract investors to restore market equilibrium. To be precise, the trading cost was computed taking the following risk components into account: credit risk, funding liquidity risk, and market liquidity risk (see Table 2). Each component was summed and then subtracted from the original deviation from the CIP to derive the risk-adjusted arbitrage opportunities.
Using the revised data, we then examined the underlying factors behind the foreign exchange sector’s inefficient behavior in more detail. Once all other risk factors that constitute market frictions have been controlled for, the remainder is the central bank’s foreign exchange intervention as discussed in the previous section. As such, we employed the conventional least squares methods to test for its causality.
This approach allows us to find a clue for the puzzling state of persistent disequilibrium in the Korean foreign exchange market and derive a useful policy implication for the national economy. The next section provides empirical evidence with a more precise description of the procedures of the regression analysis.

4. Empirical Analysis and Results

4.1. Runs Test for Detecting Randomness

We begin with the Wald–Wolfowitz test (also known as ‘runs test’) to investigate whether a series of spot exchange rates follow a random process. All the data is expressed as currency price changes. A run is defined as a set of sequential values with two-valued data; for instance, a series of data with positive or negative signs. The test is to determine whether the number of positive or negative runs is distributed equally in time under the null hypothesis that the number of runs in a sequence of elements is a random variable. The test statistic is asymptotically normal for the large sample, or standard normal test statistic ( z ) is:
z = ( R μ ) / σ ,
where R is the number of runs, and its mean ( μ ) and standard deviation ( σ ) are calculated as follows:
μ = ( 2 N + N / N ) + 1
σ = 2 N + N ( 2 N + N N ) N 2 ( N 1 ) = ( μ 1 ) ( μ 2 ) N 1 ,
where N + is the number of positive price changes, N is the number of negative price changes, and N is the total number of observations ( N = N + + N ).
When the absolute value of the test statistic ( z ) is reliably larger than the critical value, we can reject the null hypothesis, which indicates that the elements of the sequence are not mutually independent. As it is then possible to predict the price changes, we may conclude that the market is not at least weakly efficient. Table 3 shows that the Korean foreign exchange market did not satisfy this criterion for market efficiency for the entire sample, while it was relatively efficient during the post-crisis regime.

4.2. Test for the Forward Rate Unbiasedness Hypothesis (FRUH)

4.2.1. Price Discrepancy (Forecast Error) Test

As an intuitive and straightforward method to test for market efficiency, we investigate the statistical properties of forward rate forecast errors in more detail. In line with Grauer et al. (1976), forecast error, which is the forward rate minus the subsequently observed spot rate, should have a mean of zero that does not vary over time to prevent autocorrelation (Cornell 1977). When the forecast error is identified with a zero-mean random process, we can say that there are no ways of making profits in the forward exchange market and the one-to-one relationship between the forward rate and the future spot rate is expected.
The relevant statistics are given in Table 4, indicating that the mean forecast errors are very likely to be zero, but the elements are highly serially correlated. This result is interpreted as evidence that the Korean foreign exchange market is not very efficient.

4.2.2. Johansen Cointegration Test and Error Correction Model (ECM) Approach

The spot and forward rates are known to be non-stationary. Hence, we need to test whether each series of exchange rates has a unit root before estimating the regression equation. We employed the most popular methods, the augmented Dickey-Fuller test (ADF) (Dickey and Fuller 1979, 1981) and the Phillips and Perron (PP) test (Phillips and Perron 1988) to identify unit roots. The test results are summarized in Table 5. Both the ADF and PP tests do not reject the null hypothesis that spot rate and the forward rate has a unit root, or nonstationary series in level, but reject the hypothesis above in the first difference.
Given that the exchange rates are first order integrated, or I(1) process, and their first difference follows the I(0) process, the FRUH requires that the forward and the future spot rates to be cointegrated to avoid the problem of spurious regression. Otherwise, we should take the first difference to make the series stationary, which raises the issue of substantial information loss in data. Therefore, we move onto a statistical test to determine the number of cointegrating vectors in a system of non-stationary variables, a technique created by Johansen (1988, 1991).
Table 6 suggests that both the results for trace and maximum eigenvalue tests indicate that there exists one cointegrating relationship between the forward rate and its corresponding future spot rate. From Table 6 we see that the null hypothesis of zero cointegrating vectors is rejected at the 5 percent level, but the hypothesis that, at most, one cointegrating equation exists is not rejected at the same level of significance.
For robustness check, we also conducted the Engel–Granger two-step test for cointegration (Engel and Granger 1987). The idea behind the Engel–Granger two-step approach is that if nonstationary variables have a common trend path, then their linear combination is stationary. The test procedure is to run the ordinary least squares (OLS) regression to estimate the residual term, and then conduct a unit root test for the series of the error term. Table 7 presents the results.
As they are cointegrated, their long-run relationship is reliable and we can proceed to estimate the short-run adjustment in the error correction model (ECM) framework. In ECM, the change in the spot rate is regressed on a set of lagged terms and the specific form of the model is as follows (Hakkio and Rush 1989; Park 2000):
Δ s t + m = α + β Δ f t 1 m + γ ε t + m 1 + μ t + m ,
where ε t + m 1 is a lagged error term in the cointegrating equation. The coefficient on the error correction, or the speed of adjustment term, which is denoted as γ , must have a negative value because the parameter measures how the variable reacts to deviations from the long-run equilibrium.
Table 8 provides the relevant statistics. One notable thing is that the coefficient on the error correction term ( γ ), despite being statistically significant, records a very low negative value (−0.005835), which implies that around 0.6 percent of disequilibrium is corrected each day. The speed of convergence towards long-run equilibrium is slow, and it is interpreted as evidence that the FRUH does not hold true.

4.2.3. Fama’s Regression Approach

Table 9 presents the results replicating Fama’s (1984) conventional regression. We run the regressions for the post-2008 crisis observations, as well as for the entire sample, to check for the emergence of any structural change in the system surrounding the key event.
Estimation result reports that the Wald F-statistic for the null hypothesis of ( α , β ) = (0,1) is rejected at the 5% level for the entire period and the result remains unchanged. The data from the post-crisis period confirms the result. The hypothesis of ( α , β ) = (0,1) is rejected even at the one percent level, and in particular, the estimate of α is not zero, unlike for the entire sample period.
These findings are consistent with the vast majority of current studies that have rejected the FRUH on the basis of Fama’s methodology. The beta coefficient is without the forward discount bias puzzle, but it still does not pass the test for the FRUH.

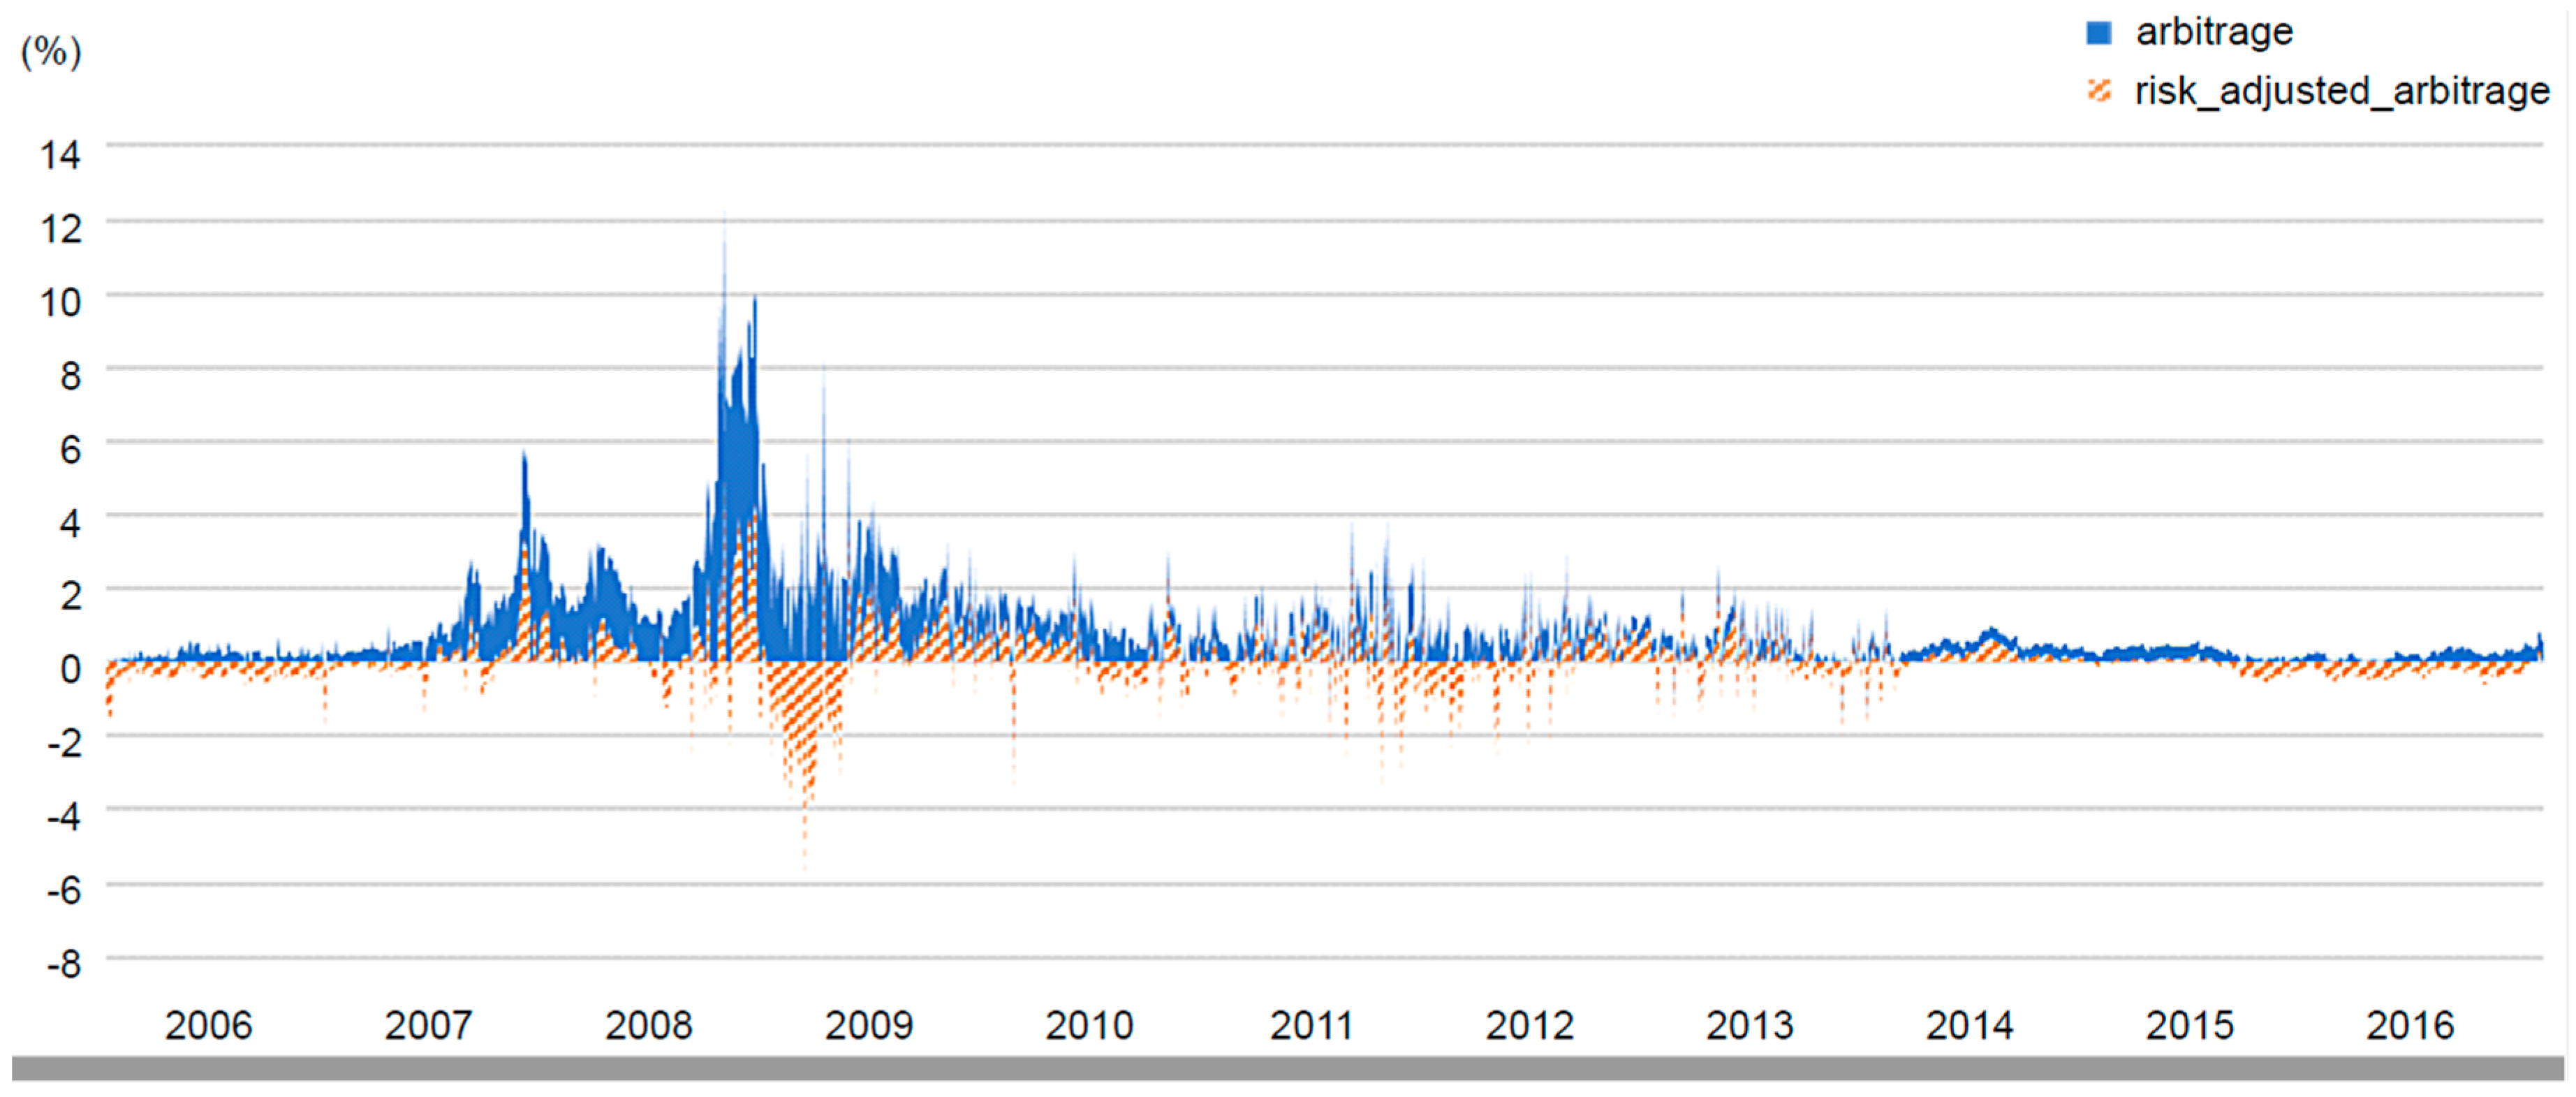
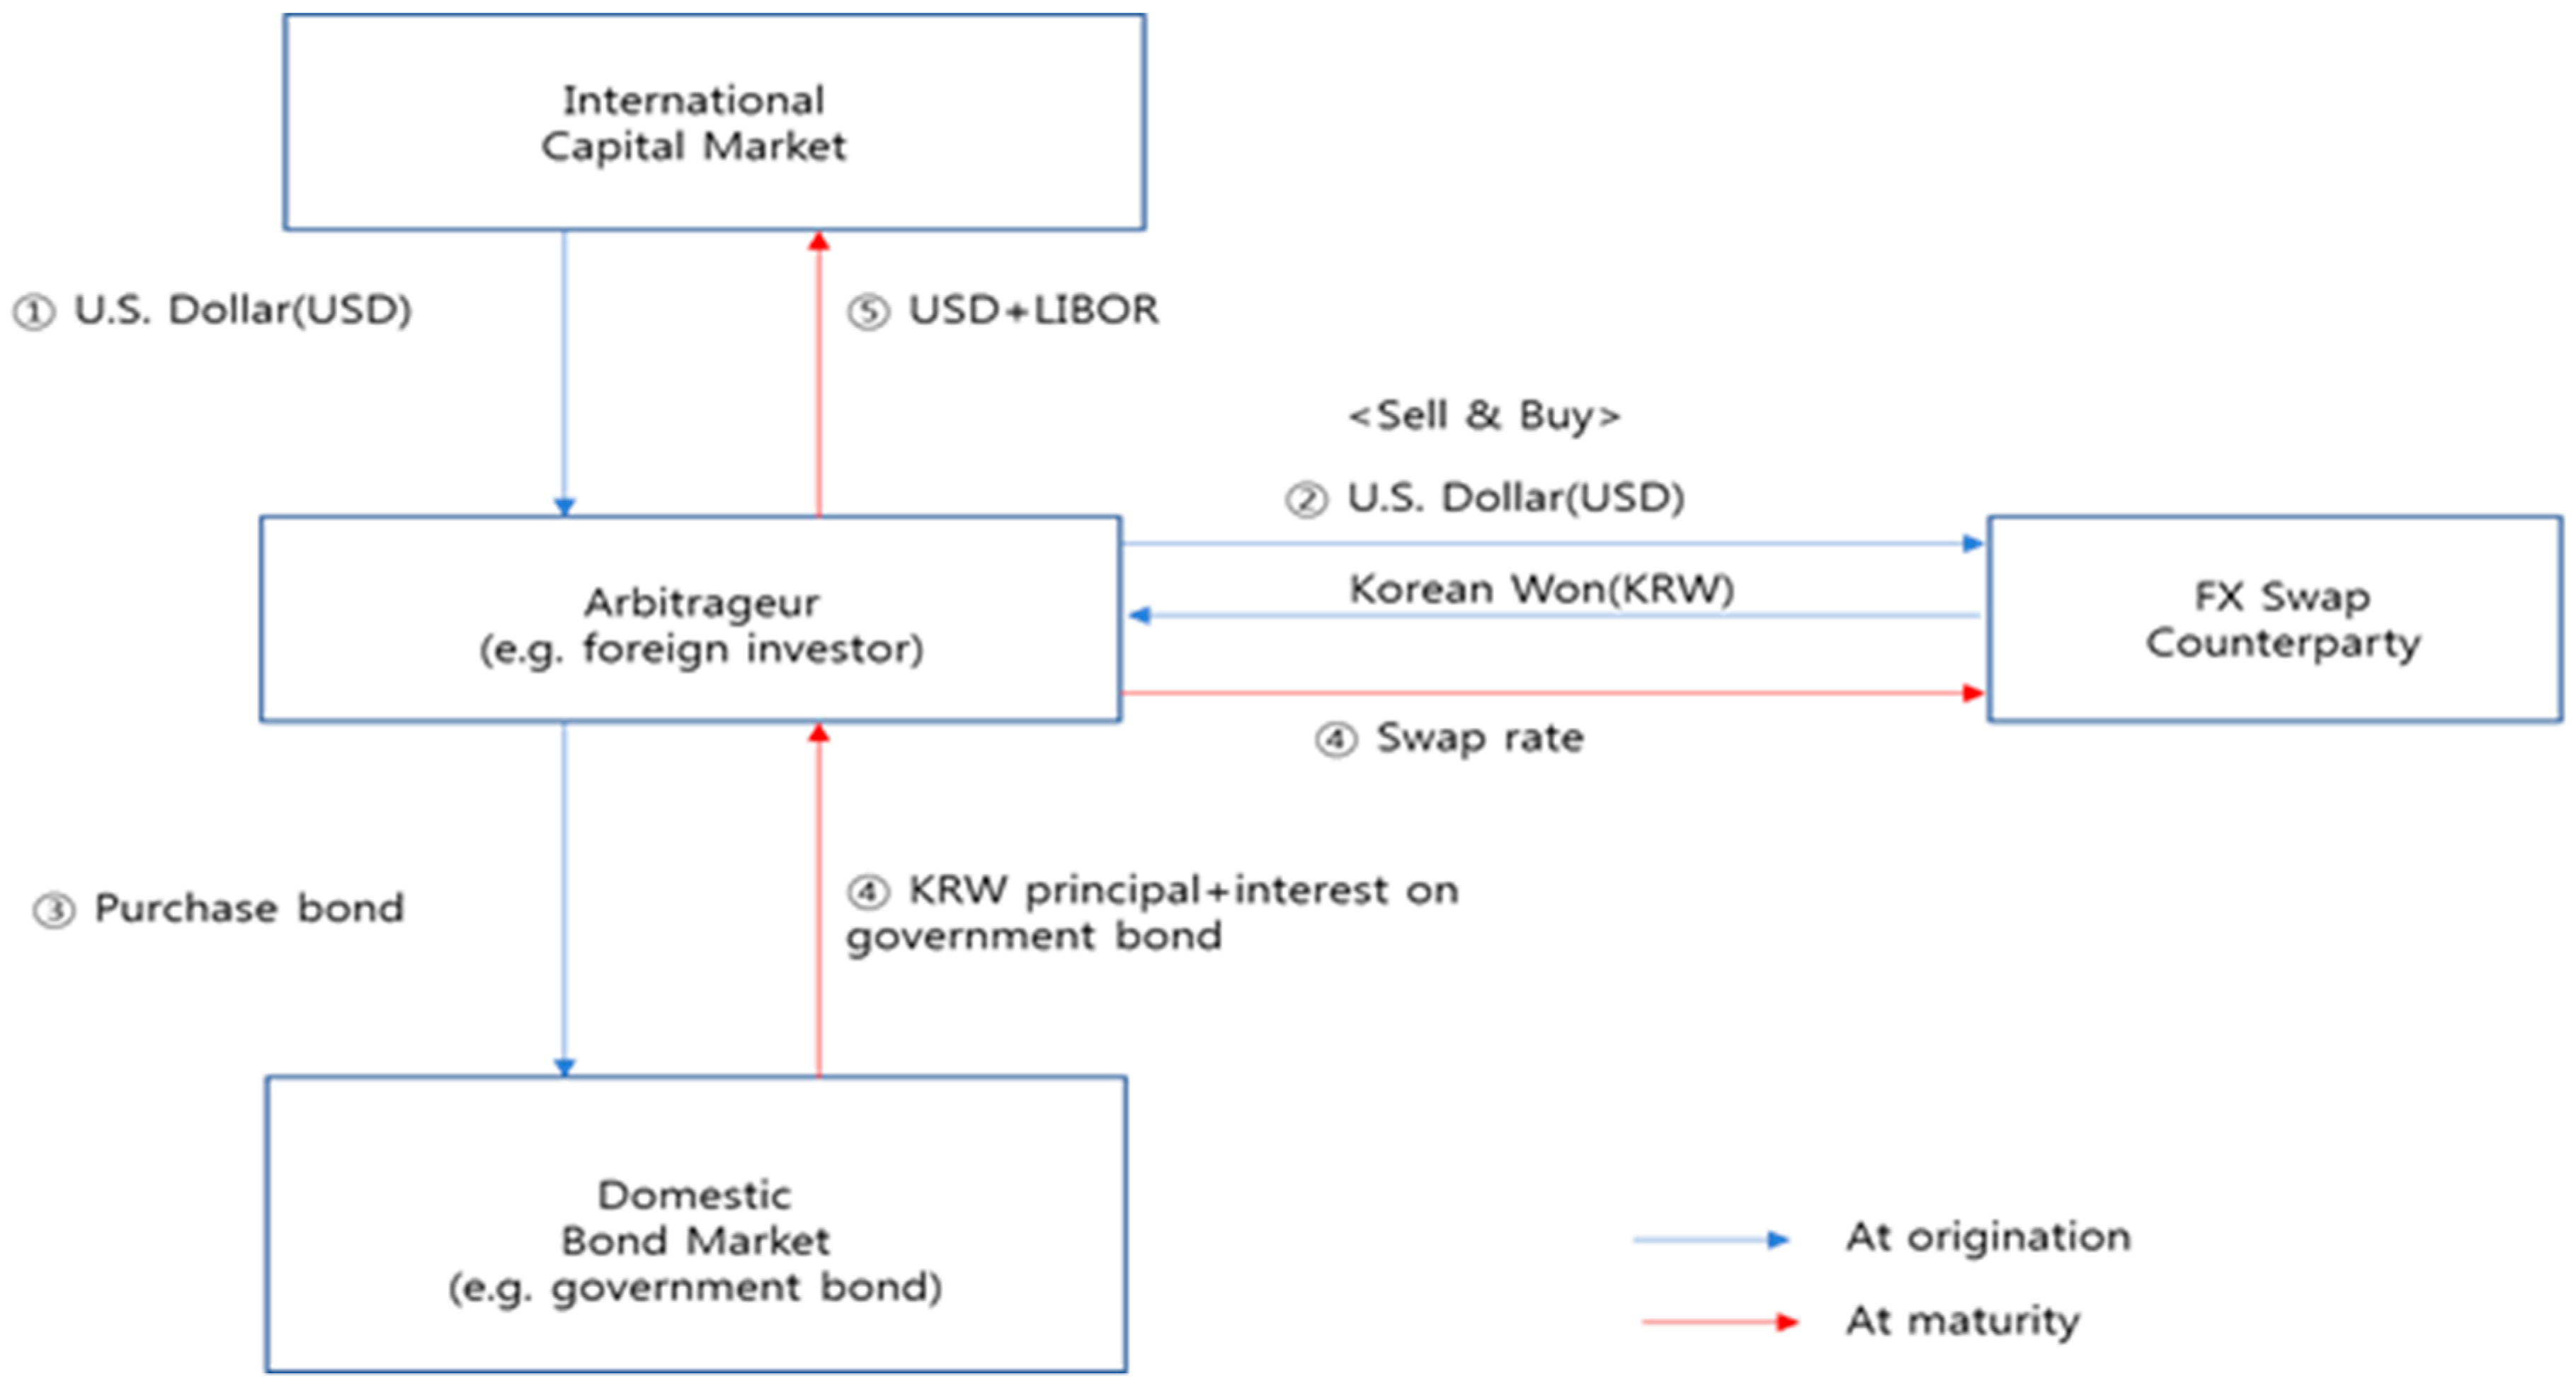
4.3. Puzzling Deviation from Covered Interest Rate Parity (CIP)

The persistent disequilibrium in the foreign exchange market and its related swap market has attracted the attention of policy makers and regulators in Korea. The deviation from the covered interest rate parity, or arbitrage opportunities, lasted for an extended time, peaking around the 2008 global financial crisis. Obviously, such opportunities for the risk-free return were expected to draw a massive capital inflow and inject a large amount of foreign funds (mainly short-term external borrowing) into the Korean financial system. However, right after the crisis, there was a striking reversal of trend to a sudden stop which is commonly defined as a sharp reduction in the flow of international capital, despite high chances of obtaining a free lunch, indicating the need for further research.
With respect to this challenge, the risk adjusted arbitrage suggests a plausible explanation. As observed in the Figure A1 in the Appendix B, the original arbitrage appears to be somewhat exaggerated: when we take risk premia into consideration, the chance of a free lunch is significantly reduced. The risk adjusted arbitrage, obtained by subtracting the summed risk premia components from the original arbitrage, really reflects the market situation more correctly. Note that it had a positive value until the outbreak of the crisis and turned sharply negative at the peak of the crisis from late 2008 to early 2009. After that, it remained slightly positive until 2014, but has recorded some negative values since 2015. In other words, arbitrage opportunities have been hovering around zero during the post-crisis period, which cautiously suggests some clues for improved market efficiency.
We now use the least squares method to identify economic factors that could determine the arbitrage opportunities in the foreign exchange market. As discussed in the previous section, the candidates include the central bank’s market intervention and risk premia in the international financial market. On occasion, they may turn into frictions that hinder the market from balancing itself. Thus, our hypothesis is that the extent of reliability of the central bank’s intervention in the spot or forward exchange market explains arbitrage return opportunities and the way the result changes when the estimated risk factor (credit and liquidity risk), as an exogenous variable, is taken into consideration. To this purpose, we estimated and constructed the foreign exchange intervention data series by using International Monetary Fund (IMF) and Bank of Korea (BOK) economic statistics data bases. Specifically, the spot market intervention was estimated from the change in international reserves (in U.S. dollar value change adjusted terms) and forward market intervention was estimated from the change in the net forward long position given by the BOK (see Figure A2 in Appendix B for the trends in the data series). Moreover, the risk premia are the same as described in the previous section, where we summed credit risk (using CDS as a proxy), funding liquidity risk (TED spread), and market liquidity risk (bid-ask spread as transaction costs) to obtain the risk premia.
Each variable passed the ADF unit root test for stationarity and the Durbin-Wu-Hausman (DWH) test for exogeneity of regressors. When conducting the DWH test, the Korean stock price index (KOSPI) was used as an instrument variable (IV) such that it is correlated with the regressor of the risk factor, but independent of the disturbance term. As time series of each data subset turned out to be stationary and exogenous through the relevant diagnostic tests, we can safely rely on the results of the regression analysis without worrying much about consistent estimators. Multicollinearity between regressors was also checked (see Table A1 in Appendix A). Table 10 presents the estimation results, and the main findings are as follows.
First, arbitrage opportunities as evidence of market inefficiency are mostly explained by the presence of risk premia. Second, the central bank’s market intervention has also affected the foreign exchange market in a distortive way. Particularly, forward intervention rather than spot intervention was found to have a significant effect on the formation of arbitrage opportunities. Third, the market inefficiency represented by arbitrage returns subsided substantially after the 2008 crisis and we corroborate that the explanatory power of the regressors decreased around this regime-switching event.
These findings are intuitively conforming and consistent with the pattern of data seen in the figures in Appendix B. Risk premia, which skyrocketed during the crisis, must be the most important source of market inefficiency, and the post-crisis data in a relatively tranquil period witnessed that the BOK’s intervention has changed markedly in terms of its direction as well as volume. Official intervention in the spot and forward markets has declined significantly and its stance clearly exhibited a symmetric pattern, especially since 2015.

5. Concluding Remarks

The concept of market efficiency is important in evaluating the degree of development and sophistication of a financial market. In an efficient market, the price mechanism works best with very little or no friction, which helps any deviations from an equilibrium to be corrected instantly. It is impossible for arbitrage opportunities to persist for a prolonged period of time. Furthermore, efficiency could be a precondition for financial stability, as a lack of efficiency keeps the market from restoring equilibrium and often increases the disparity in an unbalanced manner.
Empirical evidence, mainly based on the well-established theoretical notions of the forward rate unbiasedness hypothesis (FRUH) and covered interest rate parity (CIP) with the relevant regression techniques, indicates that the Korean currency market was not very efficient during the period 2006–2016, but has improved in the post-crisis period of 2010–2016. Market inefficiency, represented by the persistent presence of arbitrage opportunities, was detected in the foreign exchange market and its related derivatives market, and the risk premia in the international financial market and the central bank’s market intervention had contributed to the formation of inefficiency.
These results are consistent with a large body of literature on this subject and have implications for the Korean government or the central bank in seeking effective foreign exchange risk management for the national economy. Particularly, it should be noted that relying upon official reserves to curb distortion in the currency market is limited, but rather bears some risk of deteriorating the market condition on the existence of destabilizing and misguided speculation. In terms of policy effectiveness, swap lines with other major central banks (e.g., the US Federal Reserve) worked even better, thus calling for closer international policy coordination. Of course, the lesson is not solely confined to the Korean case but would be an important consideration for the governments or central banks of other emerging market economies facing the same foreign exchange policy challenges. Probably, this will be the foremost contribution of this paper to the literature.

Funding

This research received no external funding.

Conflicts of Interest

The author declares no conflict of interest.

Appendix A

Table A1. Correlation matrix of variables used in the regression analysis.
(A) Entire sample period
Spot Intervention (s)Forward Intervention (f)Risk Factor (r)
spot intervention (s)1
forward intervention (f)0.1647591
risk factor (r)−0.321210−0.0536771
(B) post-crisis period
Spot Intervention (s)Forward Intervention (f)Risk Factor (r)
spot intervention (s)1
forward intervention (f)0.3040541
risk factor (r)−0.008382−0.1489391
Note: The variance inflation factor (VIF) for each estimated regression coefficient (i.e., 1.142858 for spot intervention, 1.027904 for forward intervention, 1.115047 for risk factor) is so close to unity, which implies that the least squares regression analysis does not suffer from multicollinearity.

Appendix B

Figure A1. Original versus risk-adjusted arbitrage opportunities. Source: Author’s calculation using Bloomberg and Bank of Korea (BOK) databases.
Ijfs 07 00052 g0a1
Figure A2. Central bank’s foreign exchange market intervention trends. Note: Change in net forward long position indicates the BOK’s estimated intervention in the forward exchange market. Source: Author’s calculation using International Monetary Fund (IMF) and Bank of Korea (BOK) databases.
Ijfs 07 00052 g0a2

References

  1. Ahmad, Rubi, S. Ghon Rhee, and Yuen Meng Wong. 2012. Foreign exchange market efficiency under recent crises: Asia-Pacific focus. Journal of International Money and Finance 31: 1574–92. [Google Scholar] [CrossRef]
  2. Baba, Naohiko, and Frank Packer. 2009. Interpreting deviations from covered interest parity during the financial market turmoil of 2007–08. Journal of Banking and Finance 33: 1953–62. [Google Scholar] [CrossRef]
  3. Baba, Naohiko, and Ilhyock Shim. 2014. Dislocations in the won-dollar swap markets during the crisis of 2007–2009. International Journal of Finance and Economics 19: 279–302. [Google Scholar] [CrossRef]
  4. Baillie, Richard T., and Tim Bollerslev. 1989. Common stochastic trends in a system of exchange rates. The Journal of Finance 44: 167–81. [Google Scholar] [CrossRef]
  5. Baillie, Richard T., and Tim Bollerslev. 2000. The forward premium anomaly is not as bad as you think. Journal of International Money and Finance 19: 471–88. [Google Scholar] [CrossRef]
  6. Bank of International Settlement. 2016. The triennial central bank survey of FX and over-the-counter (OTC) derivatives markets in 2016. Press Release, December 11. [Google Scholar]
  7. Bank of Korea. 2017. Foreign exchange market trends during 2016. Press Release, January 19. [Google Scholar]
  8. Bhar, Ramprasad, Suk-Joong Kim, and Toan M. Pham. 2004. Exchange rate volatility and its impact on the transaction costs of covered interest rate parity. Japan and the World Economy 16: 503–25. [Google Scholar] [CrossRef]
  9. Burt, John, Fred R. Kaen, and G. Geoffrey Booth. 1977. Foreign exchange market efficiency under flexible exchange rates. The Journal of Finance 32: 1325–30. [Google Scholar] [CrossRef]
  10. Chang, Eui Tae. 2008. Determinants of deviations from covered interest parity in Korea during 1999~2007. Journal of Money and Finance 22: 185–215. [Google Scholar]
  11. Chung, Heechun. 2010. The Bank of Korea’s Policy Response to the Global Financial Crisis. BIS Papers, No. 54. Basel: Bank for International Settlements. [Google Scholar]
  12. Coffey, Niall, Warren B. Hrung, and Asani Sarkar. 2009. Capital Constraints, Counterparty Risk, and Deviations from Covered Interest Rate Parity. Federal Reserve Bank of New York Staff Reports, No. 393. New York: Federal Reserve Bank of New York. [Google Scholar]
  13. Cornell, Bradford. 1977. Spot rates, forward rates and exchange market efficiency. Journal of Financial Economics 5: 55–65. [Google Scholar] [CrossRef]
  14. Dickey, David A., and Wayne A. Fuller. 1979. Distribution of the estimators for autoregressive time series with a unit root. Journal of the American Statistical Association 74: 427–31. [Google Scholar]
  15. Dickey, David A., and Wayne A. Fuller. 1981. Likelihood ratio statistics for autoregressive time series with a unit root. Econometrica 49: 1057–72. [Google Scholar] [CrossRef]
  16. Engel, Robert F., and Clive W. J. Granger. 1987. Co-integration and error correction: Representation, estimation and testing. Econometrica 55: 251–76. [Google Scholar] [CrossRef]
  17. Evans, Martin D. D., and Karen K. Lewis. 1993. Trends in excess returns in currency and bond markets. European Economic Review 37: 1005–19. [Google Scholar] [CrossRef]
  18. Fama, Eugene F. 1970. Efficient capital markets: A review of theory and empirical work. Journal of Finance 25: 383–417. [Google Scholar] [CrossRef]
  19. Fama, Eugene F. 1984. Forward and spot exchange rates. Journal of Monetary Economics 14: 319–38. [Google Scholar] [CrossRef]
  20. Finch, Gavin. 2017. World’s Biggest Banks Fined $321 Billion Since Financial Crisis. Bloomberg. Available online: https://www.bloomberg.com/news/articles/2017-03-02/world-s-biggest-banks-fined-321-billion-since-financial-crisis (accessed on 4 November 2017).
  21. Frankel, Jeffrey A. 1980. Test of rational expectations in the forward exchange market. Southern Economic Journal 46: 1083–101. [Google Scholar] [CrossRef]
  22. Frankel, Jeffrey A., and Jumana Poonawala. 2010. The forward market in emerging currencies: Less biased than in major currencies. Journal of International Money and Finance 29: 585–98. [Google Scholar] [CrossRef]
  23. Frenkel, Jacob A., and Richard M. Levich. 1975. Covered interest arbitrage: Unexploited profits? Journal of Political Economy 83: 325–38. [Google Scholar] [CrossRef]
  24. Frenkel, Jacob A., and Richard M. Levich. 1977. Transaction costs and interest arbitrage: Tranquil versus turbulent periods. Journal of Political Economy 85: 1209–26. [Google Scholar] [CrossRef]
  25. Froot, Kenneth A., and Richard H. Thaler. 1990. Anomalies: Foreign exchange. Journal of Economic Perspectives 4: 179–92. [Google Scholar] [CrossRef]
  26. Gilmore, Stephen, and Fumio Hayashi. 2011. Emerging market currency excess returns. American Economic Journal: Macroeconomics 3: 85–111. [Google Scholar] [CrossRef]
  27. Grauer, Frederick L. A., Robert H. Litzenberger, and Richard E. Stehle. 1976. Sharing rules and equilibrium in an international capital market under uncertainty. Journal of Financial Economics 3: 233–56. [Google Scholar] [CrossRef]
  28. Griffoli, Tommaso M., and Angelo Ranaldo. 2012. Limits to Arbitrage during the Crisis: Funding Liquidity Constraints and Covered Interest Parity. Working Papers on Finance, Swiss Institute of Banking and Finance, No. 2012/12. St. Gallen: Swiss Institute of Banking and Finance. [Google Scholar]
  29. Hakkio, Craig S., and Mark Rush. 1989. Market efficiency and cointegration: An application to the sterling and deutschemark exchange markets. Journal of International Money and Finance 8: 75–88. [Google Scholar] [CrossRef]
  30. Jensen, Michael C. 1978. Some anomalous evidence regarding market efficiency. Journal of Financial Economics 6: 95–101. [Google Scholar] [CrossRef]
  31. Johansen, Søren. 1988. Statistical analysis of cointegrating vectors. Journal of Economic Dynamics and Control 12: 231–54. [Google Scholar] [CrossRef]
  32. Johansen, Søren. 1991. Estimation and hypothesis testing of cointegration vectors in Gaussian vector autoregressive models. Econometrica 59: 1551–80. [Google Scholar] [CrossRef]
  33. Levich, Richard M. 1989. Is the foreign exchange market efficient? Oxford Review of Economic Policy 5: 40–60. [Google Scholar] [CrossRef]
  34. Muth, John F. 1961. Rational expectations and the theory of price movements. Econometrica 29: 315–35. [Google Scholar] [CrossRef]
  35. Park, Dae Keun. 2000. The non-deliverable forward exchange market and the Korean currency crisis. Kukje Kyungje Yongu 6: 1–22. [Google Scholar]
  36. Park, Hae Sik. 2010. Persistent factor of interest rate arbitrage in the Korean economy. Weekly Finance Brief, Korea Institute for Finance 19: 12–13. [Google Scholar]
  37. Phillips, Peter C. B., and Pierre Perron. 1988. Testing for a unit root in time series regression. Biometrika 75: 335–46. [Google Scholar] [CrossRef]
  38. Ryoo, Sangdai, Taeyong Kwon, and Hyejin Lee. 2013. Foreign Exchange Market Developments and Intervention in Korea. BIS Paper, No. 73. Basel: Bank for International Settlements. [Google Scholar]
  39. Sarno, Lucio. 2005. Viewpoint: Towards a solution to the puzzles in exchange rate economics: Where do we stand? The Canadian Journal of Economic/Revue Canadienne d’Economique 38: 673–708. [Google Scholar] [CrossRef]
  40. Song, Chi Young, and Kyung Soo Kim. 2008. What lies behind persistent failure of covered interest parity in the won/dollar exchange market: An empirical investigation. Korea Review of Applied Economics 10: 5–32. [Google Scholar]
  41. Taylor, Mark P. 1987. Covered interest parity: A high-frequency, high-quality data study. Economica 54: 429–38. [Google Scholar] [CrossRef]
Figure 1. The transaction mechanisms in the foreign exchange related swap market.
Ijfs 07 00052 g001
Table 1. Some selected works on the foreign exchange market efficiency.
ArticlesDataEstimation TechniquesResults
FRUH (or Forward bias puzzle) testingFrankel (1980)GBP, DEM,
FRF, ITL
July 1974 to April 1978
OLS
estimation
  • DEM passed FRUH tests, indicating that market efficiency holds.
  • Other currencies rather ambiguous.
Fama (1984)Nine major currencies
August 1973 to December 1982
OLS
estimation
  • Risk premium explains more of the variance than the forecast error does, implying that the efficiency of forward exchange markets is not refuted.
  • Policy intervention in foreign exchange markets cannot be justified.
Hakkio and Rush (1989)GBP, DEM
July 1975 to October 1986
Cointegration test
Error correction model
  • The joint hypothesis of no risk premium combined with efficient use of information was rejected, providing an evidence off market inefficiency.
Evans and Lewis (1993)GBP, DEM, JPY
January 1975 to December 1989
Johansen test
  • Failed to find a long-run relationship between forward and corresponding future spot rates, providing an evidence of market inefficiency.
Baillie and Bollerslev (2000)DEM
January 1974 to December 1991
OLS
estimation
  • Estimated slope coefficient significantly differently from unity and also significantly less than zero.
  • Nonetheless, forward premium anomaly (i.e., regression coefficient less than one, even often negative) does not provide sufficient statistical evidence to reject the FRUH.
Frankel and Poonawala (2010)14 emerging market (EM) currencies
December 1996 to April 2004
OLS
estimation
  • Smaller bias than for advanced country currencies; regression coefficient is on average positive and not significantly less than zero.
Gilmore and Hayashi (2011)20 EM currencies
plus
9 major currencies
June 1996 to December 2010
OLS
estimation
  • Mean excess return (the difference between forward exchange rate and spot rate at maturity) significantly positive for EM currencies.
  • Forward premium puzzle is less prevalent for EM currencies than for major currencies.
Ahmad et al. (2012)12 Asia-Pacific currencies
January 1997 toJune 2010
Johansen test
OLS
estimation
  • Foreign exchange market is generally efficient with only a handful of currency markets show a sign of inefficiency.
  • Forward bias puzzle is merely a statistical phenomenon.
Persistent CIP deviations puzzleBaba and Packer (2009)FX swap implied rate (EUR), dollar Libor, CDS spreads
September 2006 to September 2008
EGARCH (1,1)
  • Sharp and persistent CIP deviations during the crisis moment are significantly associated with counterparty risk.
Griffoli and Ranaldo (2012)EUR, CHF, JPY, GBP, CDS, VIX, TED, Libor-OIS
March 2006 to April 2009
Time-series, panel regression
  • Arbitrage profits from CIP deviations were large and persistent for months.Insufficient funding liquidity is the main culprit.
Song and Kim (2008)KRW
January 2000 to April 2007
OLS
estimation
  • Persistent deviations from CIP in the currency market were observed.
  • Interest arbitrage trading were not large enough to quickly restore the CIP when CIP deviates.
Chang (2008)KRW
April 1999 to December 2007
OLS
estimation
  • Inefficiencies as well as frictions in the currency market have limited profitable arbitrage opportunities.
  • Both foreign investment in domestic stocks and official intervention explain the deviations from CIP.
Note: All currencies are against the US dollar.
Table 2. The risk components entailing the interest rate arbitrage transactions.
Type of RiskProperty of RiskRelevant Data
Credit riskCounterparty riskPerceived credit or default risk in the economy from the perspective of a lenderCredit default swap (CDS) premium on the Korean government bond with a maturity of one year †
Liquidity riskFunding
liquidity risk ‡
Difficulty of borrowing in the international financial marketTED spread, which is the difference between the Libor and U.S. T-bills
Market
liquidity risk
Transaction costs incurred when a trade is executedBid-ask spread in the Korean foreign exchange market
† As there were no transactions and the market data on CDS with a maturity of three months was not available, we used CDS premium with a tenor of one year as a proxy. While the extant literature most commonly uses the five-year CDS data, we need to be cautious while employing this data in our analysis because it overestimates the credit risk component. ‡ Funding liquidity risk is closely connected to counterparty credit risk in that a lender will not extend funds to a borrower whose credit status is deteriorating. Therefore, funding liquidity risk is sometimes categorized as credit risk.
Table 3. Currency price change runs: Signs and test result.
Entire Period
(1 January 2006~31 December 2016)
Post-Crisis Period
(1 January 2010~31 December 2016)
+-0+-0
Runs in days132113793883888220
Total observed Runs1296823
Total expected runs1350.38860.44
Standard error25.9620.72
Z statistic †2.091.81
ResultReject the null hypothesis of random processDo not reject the null hypothesis
Note: A (+) indicates a rise in the Korean won price of the U.S. dollar; a (-) indicates a fall in the Korean won price of the U.S. dollar, while a (0) indicates no change in price. † indicates the absolute value with the critical value being 1.96 at the 5% significance level. Source: Author’s calculation using Bloomberg and Bank of Korea’s (BOK) databases.
Table 4. Summary statistics for forward rate forecast errors.
f t m s t + m
MeanStandard Errort-StatisticAutocorrelationPartial Correlation
Lag 1Lag 2Lag 3Lag 1Lag 2Lag 3
−0.0006890.001096−0.6286330.9800.9630.9470.9800.0630.037
Table 5. Unit root test for stationarity of the series.
ADFPP
t-StatisticProbabilityt-StatisticProbability
Spot ratesLevel0.4727310.81690.4911090.8213
First difference−59.541190.0001−59.541190.0001
Forward ratesLevel0.1003810.71440.0927370.7121
Fist difference−56.706060.0001−56.706060.0001
Note: The critical values at 1 percent, 5 percent, and 10 percent levels are −2.565770, −1.950935, and −1.616625, respectively.
Table 6. Johansen cointegration test.
(A) Unrestricted cointegration rank test (Trace)
Hypothesized No. of Cointegrating Equation(s)Trace Statistic0.05 Critical ValueProbability
None *37.1148220.261840.0001
At most 14.6408449.1645460.3251
(B) Unrestricted cointegration rank test (maximum eigenvalue)
Hypothesized No. of Cointegrating Equation(s)Max. Eigen-Statistic0.05 Critical ValueProbability
None *32.4739815.892100.0001
At most 14.6408449.1645460.3251
* denotes the rejection of the hypothesis at the 5 percent level.
Table 7. Engel–Granger two-step (cointegration) test.
t-StatisticProbability
Augmented Dickey-Fuller test statistic−4.6595920.0000
Note: The null hypothesis is that the residual has a unit root.
Table 8. Results of the error correction model (ECM).
Δ s t + m = α + β Δ f t 1 m + γ ε t + m 1 + μ t + m
α β γ t ( α ) t ( β ) t ( γ )
7.16 × 10−50.018271−0.005835 *0.4658080.981871−2.112434
* indicates statistically significant at 5 percent level of significance.
Table 9. Fama’s regression results for the FRUH.
Δ s t + m = α + β ( f t m s t ) + ε t
α β t ( α ) t ( β ) Wald StatisticF-Probability
Entire sample period
(1 January 2006~31 December 2016)
0.0011550.7617971.0411988.4542623.6921330.0250
Post-crisis period
(1 January 2010~31 December 2016)
−0.0030930.667737−3.0048565.94670515.792720.0000
Table 10. Estimation results for the determination of arbitrage opportunities.
(A) Risk-adjusted arbitrage
r a _ a t = α + β 1 s t + β 2 f t + ε t
Entire Sample PeriodPost-Crisis Period
Coefficientt-StatisticCoefficientt-Statistic
Constant (α)0.0229790.4375590.0080620.207459
Spot intervention (s)−0.010874−0.969072−0.002904−0.260960
Forward intervention (f)0.059555 ***3.7548090.024829 **2.179205
Adj. R20.0859540.034060
(B) Original arbitrage
a t = α + β 1 s t + β 2 f t + β 3 r t + ε t
Entire Sample PeriodPost-Crisis Period
Coefficientt-StatisticCoefficientt-Statistic
Constant (α)0.0843931.1272750.222637 ***2.716893
Spot intervention (s)−0.015182−1.284817−0.001679−0.157680
Forward intervention (f)0.059540 ***3.7585950.019852 *1.801014
Risk factor (r)0.943651 ***19.252900.635225 ***5.115877
Adj. R20.7697580.226943
*, **, *** denotes significance at 10%, 5%, and 1% levels, respectively.

