Article

The Determinants of FDI in Sub-Saharan Economies: A Study of Data from 1990–2017

1
Independent Researcher, University of Westminster, London W1W 7BY, UK
2
Independent Researcher, University of Lincoln, Lincoln LN6 7TS, UK
*
Author to whom correspondence should be addressed.
Int. J. Financial Stud. 2019, 7(3), 43; https://doi.org/10.3390/ijfs7030043
Submission received: 6 June 2019 / Revised: 22 July 2019 / Accepted: 5 August 2019 / Published: 12 August 2019

Abstract

:
Foreign Direct Investment (FDI) can bring in much needed capital, particularly to developing countries, help improve manufacturing and trade sectors, bring in more efficient technologies, increase local production and exports, create jobs and develop local skills, and bring about improvements in infrastructure and overall be a contributor to sustainable economic growth. With all these desirable features, it becomes relevant to ascertain the factors which attract FDI to an economy or a group of adjacent economies. This paper explores the determinants of FDI in ten sub-Saharan economies: Liberia, Sierra Leone, Ivory Coast, Ghana, Nigeria, Mali, Mauritania, Niger, Cameroun, and Senegal. After an extensive literature review of theories and empirical research, using a set of cross-sectional data over the period 1990–2017, two econometric models are estimated with FDI/GDP (the ratio of Foreign Direct Investment to Gross Domestic Product) as the dependent variable, and with inflation, exchange rate changes, openness, economy size (GDP), income levels (GNI/capita (Gross National Income) per capita), and infrastructure as the independent variables. Over the period, higher inflows of FDI in relation to GDP appear to be have been attracted to the markets with better infrastructure, smaller markets, and lower income levels, with higher openness and depreciation in the exchange rate, though the coefficients of the last two variables are not significant. These results show the type of FDI attracted to investments in this region and are evaluated from theoretical and practical viewpoints. FDI is an important source of finance for developing economies. On average, between 2013 and 2017, FDI accounted for 39 percent of external finance for developing economies. Policy guidelines are formulated for the enhancement of FDI inflows and further economic development in this region. Such a study of this region has not been made in the recent past.
JEL Classification:
C21; F21; F23

1. Introduction

1.1. Background

Developing countries are growing economies and have a thirst for capital. Capital can come into an economy across national borders, in many forms, as it seeks the highest rate of return.
Foreign direct investment (FDI) is defined as an investment involving a long-term relationship and reflecting a lasting interest and control by a resident entity in one economy (foreign direct investor or parent enterprise) in an enterprise resident in an economy other than that of the foreign direct investor (FDI enterprise or affiliate enterprise or foreign affiliate (OECD 1990; IMF 1993). FDI implies that the investor exerts a significant degree of influence on the management of the enterprise resident in the other economy. Such investment is usually by way of equity capital, implying long-term involvement, and is preferred over other private capital flows such as portfolio investments which are considered short-term and can flow out much more easily. The resilience of foreign direct investment during financial crises lead many developing countries to regard it as the private capital inflow of choice (Loungani and Razin 2001). Moreover, FDI brings in efficient technologies, capital inputs, human capital development via training of local employees, and contributes to corporate tax revenues in the host country (Feldstein 2000). Higher production and exports and other improvements in soft and hard infrastructure suggest it can overall be a contributor to sustainable economic growth. By contrast, Portfolio Investment Flows (PFI) are capital flows into a country which seek financial returns in the short and medium terms through investment in the stock and bond markets. PFI is generally not preferred by countries because it is linked with rapid outflows in crisis times, destabilizing the operations of local financial markets.

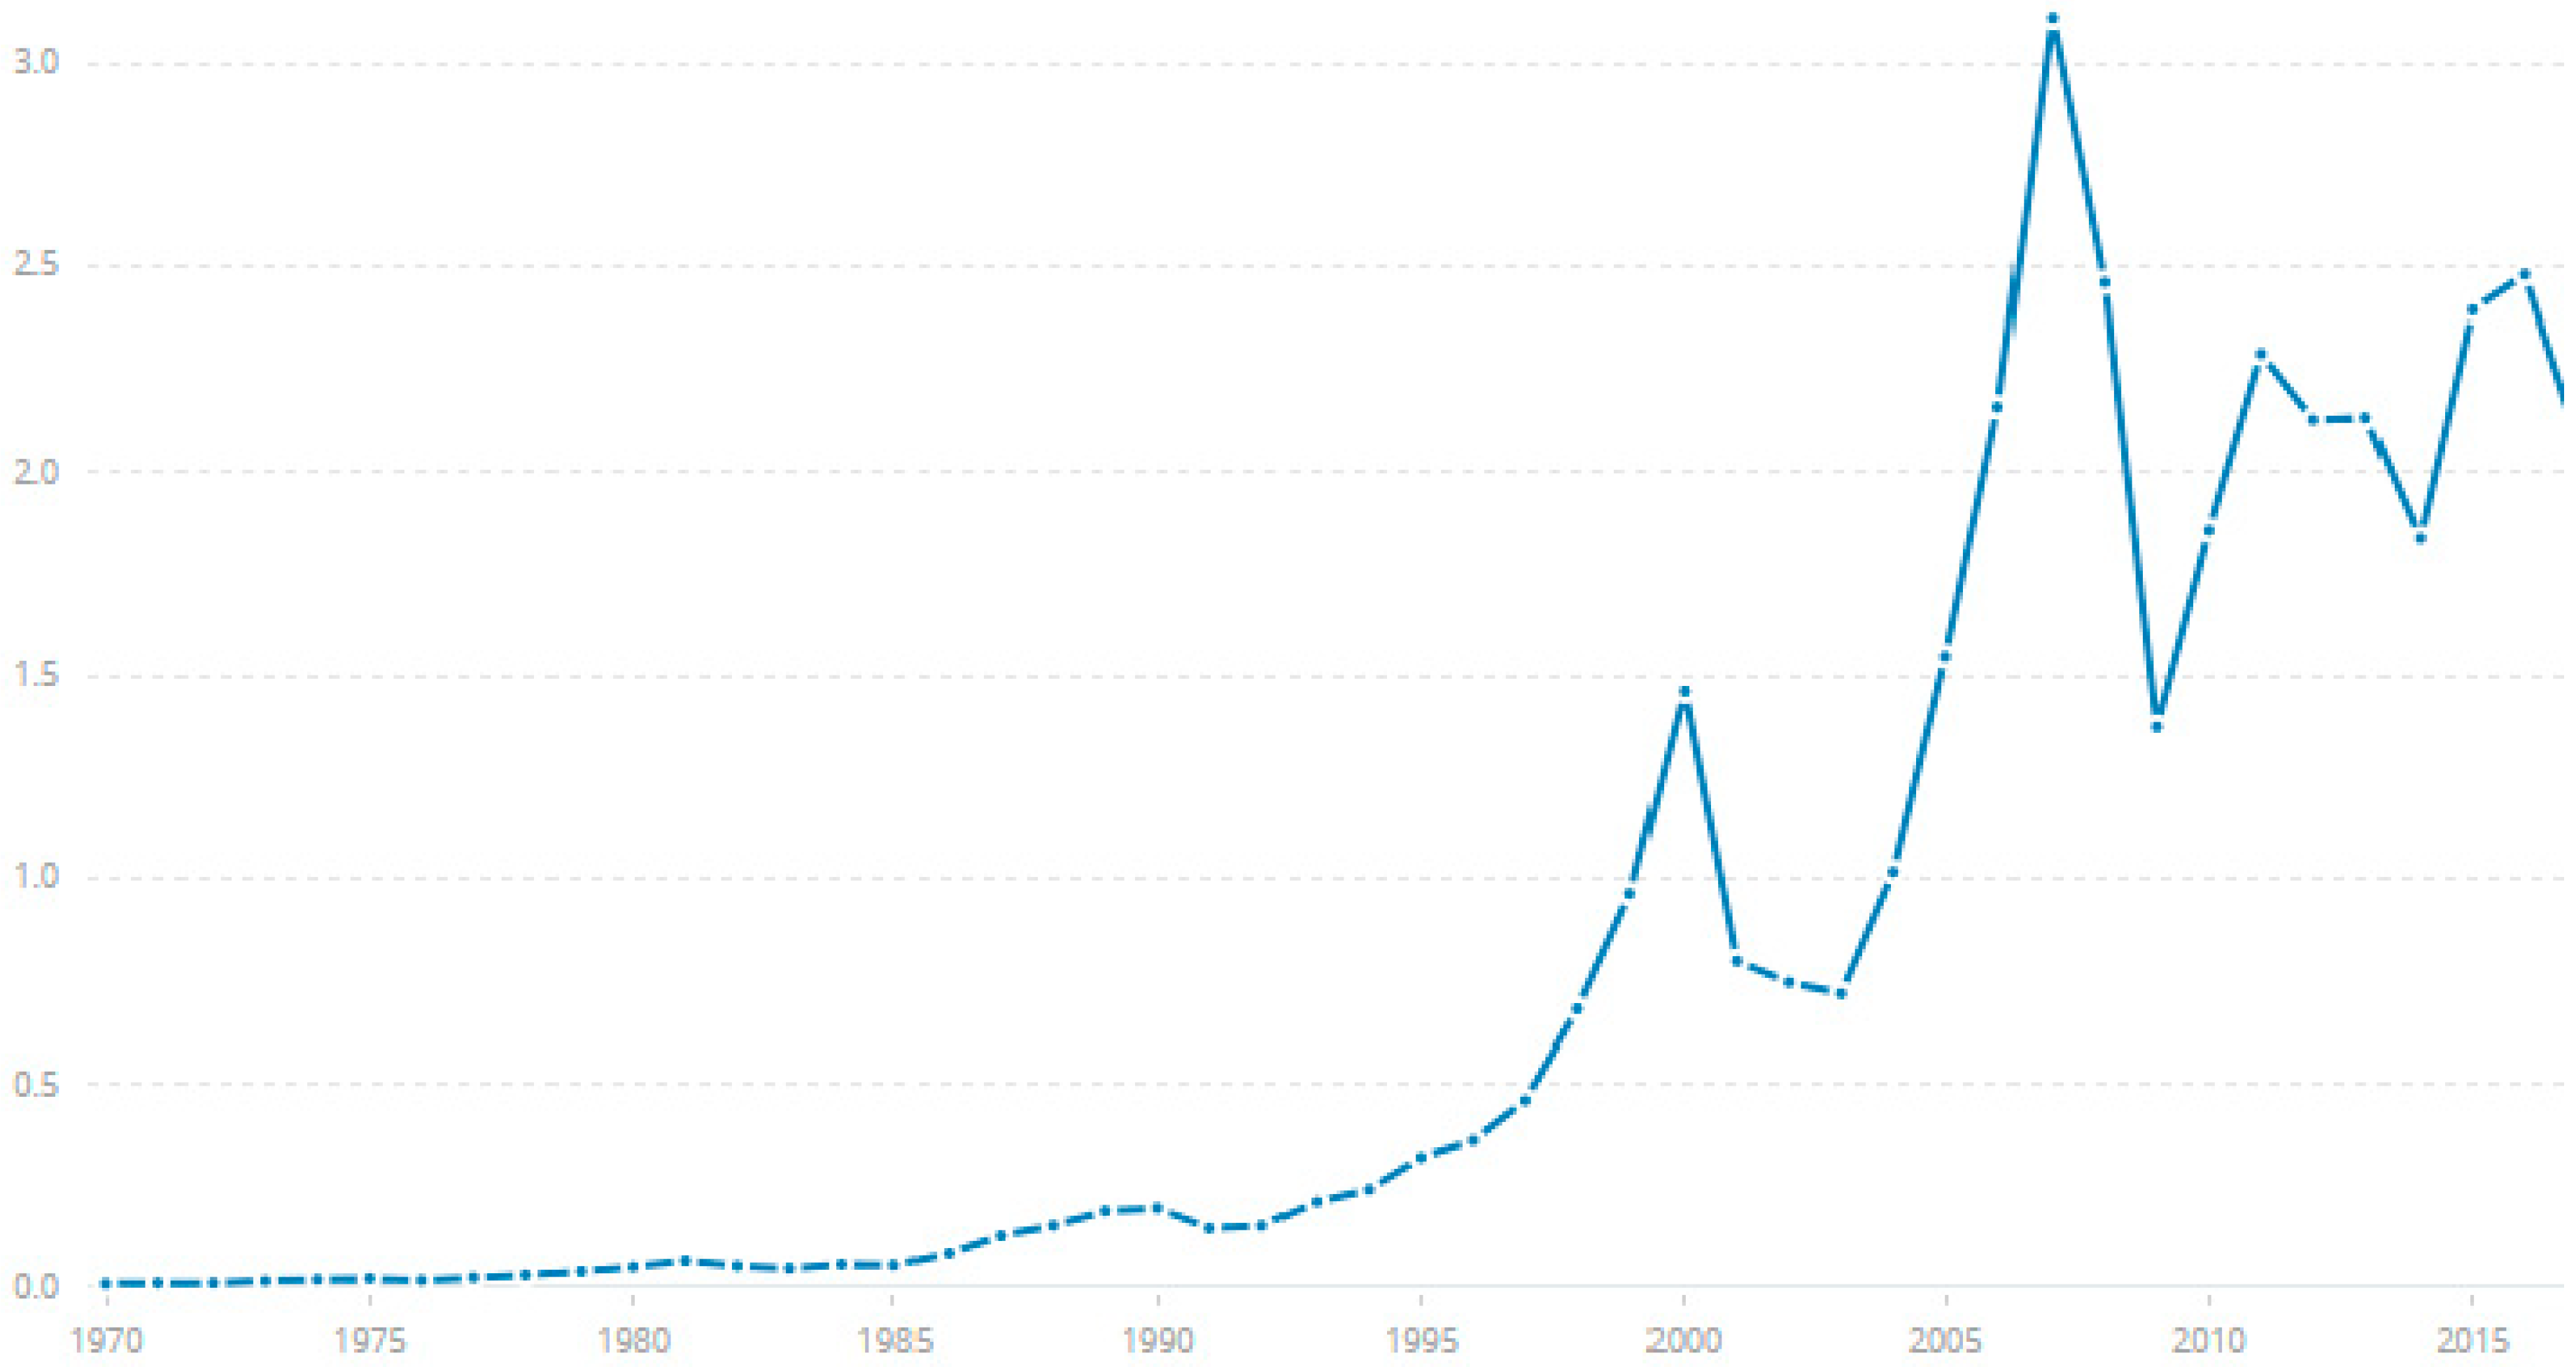
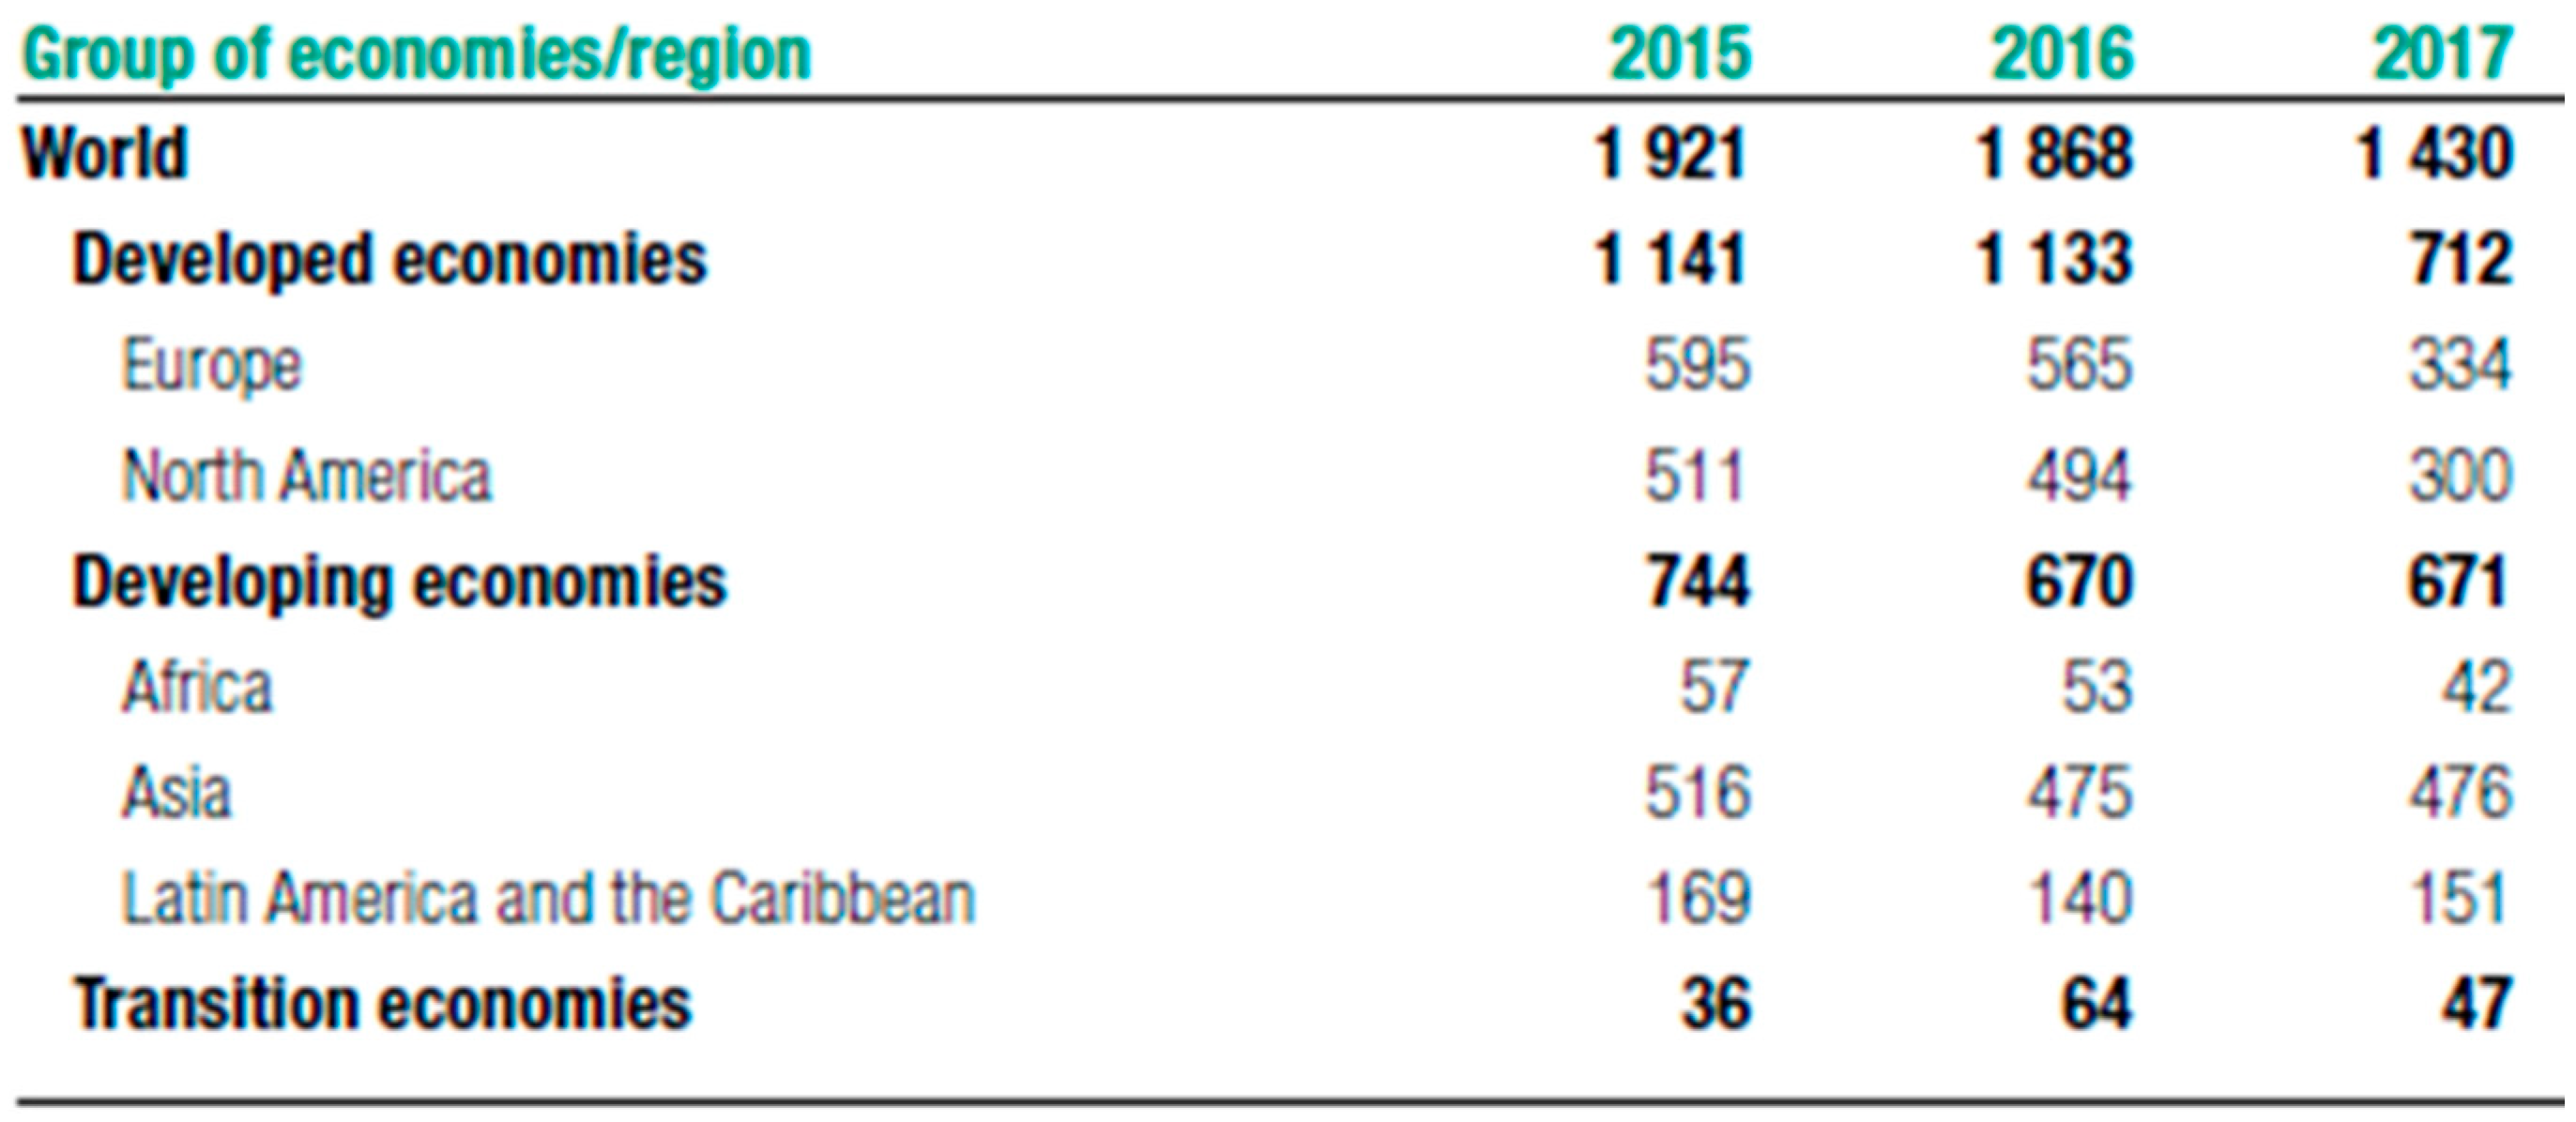
1.2. World FDI Inflows

The last few decades have witnessed a rapid increase in the net inflow of FDI from US$0.498 billion in 1970 to a value of US$2.561 trillion in 2017, expressed in current US $ trillion (Figure 1 and Figure 2)
In 2017, Africa received US$42 billion of FDI inflows, representing 6% of the FDI inflows to developing economies (total US$671 billion and 47% of total FDI). In comparison, other developing economies in Asia received 71% and Latin America and the Caribbean received 23%. Of the US$42 billion FDI inflows into Africa in 2017, the top five host economies were Egypt (US$7.4 billion), Ethiopia (US$3.6 billion), Nigeria (US$3.5 billion), Ghana (US$3.3 billion), and Morocco (US$2.7 billion). Of Africa’s share of FDI inflows in 2017, West Africa’s share was US$11 billion (26%).
By FDI stock in Africa in 2016, the countries with the largest investments were USA US $57 billion, UK $55 billion, France $49 billion, China $40 billion, and South Africa $24 billion (UNCTAD (2018), World Investment Report).
All forms of FDI come into Africa: market-seeking (Brands from MNEs), resource-seeking (natural resource related industries), as well as efficiency-seeking (relocating industry from home countries to increase efficiency through lower cost of inputs). Compared to other main regions receiving FDI, Africa receives a greater proportion in the primary sector and less in the secondary sector. For example, in 2017 in Africa, the FDI investment in manufacturing was 25%, while it was 52% in Asia and 45% in Latin America and the Caribbean regions. Growth in the primary sector is constrained but investments in the secondary sector (manufacturing) can lead to rapid and sustained growth. FDI is also a source of finance for many urgent projects required by the continent, for example, infrastructure. There is also a growing demand for services in the tertiary sector (banking, IT, telecommunication).
MNEs (Multinational Enterprises) are the major contributors of FDI to developing economies. Motivation for MNE investment is covered in four main theories in FDI: production cycle theory, perfect capital or exchange market theory, internationalization theory, and the eclectic paradigm to explain the flow of FDI to foreign countries. This effort has been enhanced by the introduction of various regional trade agreements across the globe such as the European Union trade agreement, North American Free Trade Agreement (NAFTA), Asian Pacific Economic Cooperation (APEC), Economic Community of West African States, etc. Despite the challenges associated with the formation of these trade agreements, there are enormous efforts to facilitate the movement of goods and services, finance, and people across borders to enhance economic activities in the most needed regions of the world (World Investment Report 2007).
The inflow of FDI to the ten countries of this study: Liberia, Sierra Leone, Ivory Coast, Ghana, Nigeria, Mali, Mauritania, Niger, Cameroun, and Senegal are no exception to the above effort and theoretical findings of scholars. Most of the selected countries are developing nations with a market-based economy that is constrained by low human per capita income, inadequate infrastructure (electricity, roads, water system, etc.), low exports, low population, weak access to finance, small market size, etc., (OECD 2017). Therefore, these countries heavily rely on natural resource endowment, and the inflow of foreign direct investment as well as foreign aid from the global community to drive the economy. The World Bank, International Monetary Fund, and other institutions including the African Development Banks as well as the Organization of Economic Cooperation and Development (OECD) have consistently assessed and supported the growth of the countries’ economy through budgetary support and capacity building in key public institutions of government.
Foreign direct investment plays a major role in a developing economy with respect to filling the gap in domestic savings, creating additional employment, and developing the skills of locals, among other beneficial effects. In Africa, FDI has become a critical source of capital for investment in infrastructure and developmental initiatives to complement government efforts in key sectors of the economy (Anyanwu 2006, 2011). Although Africa does not benefit from the inflow of FDI as compared to other regions in the world, it remains a potential for future inflow of FDI. Many earlier studies on FDI have focused on South and North Africa. Sub-Saharan countries in West Africa are a regional economic bloc that provide wider access to markets for investors and this study is thus relevant at this time.

1.3. Aim of This Paper

The aim of the current research is to determine through analysis, the determinants of FDI flows in ten sub-Saharan African countries: Liberia, Sierra Leone, Ivory Coast, Ghana, Nigeria, Mali, Mauritania, Niger, Cameroun, and Senegal during the period 1990 to 2017, and make policy recommendations for the promotion of FDI and economic growth in these countries.

1.4. Structure of This Paper

This research is divided into various sections: Section 1 covered the introduction and background of the countries with respect to FDI and the investment climate and set out the aims of the current research. In Section 2, theories and empirical research on FDI and its determinants are reviewed and appraised. In Section 3, the methodology and econometric models used, data sources, and definitions are covered. In Section 4, econometric models are estimated from the data and the results are interpreted. In Section 5 the results obtained in the previous section are discussed and compared with previous research. Finally, the conclusion of the work and policy recommendations are presented in Section 6.

2. Literature Review

The movement of capital to maximize resource utilization has made a large contribution toward stabilizing global economy over the years. Foreign direct investment is a driver of employment, technological progress, productivity improvements, and economic growth. The last few decades have witnessed huge capital movement in the form of FDI from US$54.1 billion in 1980 to US$1.45 trillion in 2013. The literature reviewed here first looks at the main theories of FDI and their implications, and then at the determinants of FDI from the perspective of the host economy.

2.1. Main Theories of Foreign Direct Investment (FDI) and their Implications

Over the years, researchers across the globe have developed four major theories on FDI: product cycle theory, perfect capital or exchange market theory, internationalization theory, and the eclectic paradigm.
According to (Vernon 1966) product cycle theory, there are four stages of the production cycle: innovation, growth, maturity, and decline. In the first two stages, innovative products are created by companies for local consumption and grow in local markets. With maturity as competition grows, the surplus is exported and eventually the company makes investments in foreign markets. This theory was emphasized in the work of Foellmi et al. (2018). According to exchange market theory, from an exporting country’s point of view, for example, the US, an increase in RER (Real Exchange Rate), expressed in fc units/$ (foreign currency unit/$), decreases US export competitiveness, while a decrease in RER, expressed as fc units/$, increases export competitiveness and this can explain FDI made by exporting countries. Cushman (1985) analyzed the influence of exchange rate uncertainty as a factor of FDI and showed that real exchange rate increase stimulated FDI made by USD, while a foreign currency appreciation has reduced American FDI. Although currency risk rate theory does not explain simultaneous foreign direct investment between countries with different currencies, it is argued by proponents that such investments are made in different times.
According to Hymer (1972), to whom Internalization theory is attributed to, MNEs made FDI to reduce competition and exploit firm specific advantages, even though relocation of activities may involve adjustment costs. According to Hymer (1976), MNEs see opportunities through market imperfections in the final product market through capabilities not shared with competitors and a major conclusion drawn is that FDI is a firm-level strategy decision to increase their market share in the global economy rather than a capital-market financial decision.
According to Eclectic Paradigm theory, developed by Dunning (1977, 1980), firms make FDI investments because of three aspects: Ownership advantages, Locational advantages, and Internalization (OLI). The ownership characteristic can give a company control over resources (natural or other intangible such as patents and trademarks), technology or access to financial capital. Location advantages may arise from lower operating costs, political support from host country’s government, or better social acceptability while finally the internalization characteristic allows a firm to set up foreign production rather than license it. The Eclectic paradigm shows that OLI parameters can vary from firm to firm and the final form it takes depends upon context and the economic, political, and social characteristics of the host country.
Dunning (1993) further describes three main types of FDI from the perspective of investing firms: market-seeking FDI, also called horizontal FDI (where the objective is to access and serve local and global markets), and resource-seeking FDI, also called vertical or export-oriented FDI, where firms invest abroad to obtain overseas resources: raw materials, labor, natural endowments (oil, gas, mineral ores). Such FDI can involve building production chains in the host country. Efficiency-seeking FDI, where a firm structures its operations for economies of scale and scope through common governance of geographically dispersed activities.
While existing theories of foreign direct investment attempt to explain FDI flows in terms of multinational firms and their objectives, it is further meaningful to examine the impact of various characteristics of the economy of the host country on FDI inflows, to capture the effects of any theories, not so far postulated.

2.2. Factors Determining FDI Flows from Empirical Research

In the next section, empirical research on some main determinants of FDI inflows such as Inflation, Exchange rates, Openness, GDP (market size), Income levels (GDP per capita), and infrastructure and other enveloping issues relating to an economy are reviewed in detail.

2.2.1. Inflation, Exchange Rates, Openness

The research of Faroh and Shen (2015) on the Sierra Leone economy using data over the period of 1985–2012 found that the inflation rate is weakly negatively related to FDI inflows, while interest rates have no effect, exchange rate stability and higher trade openness strongly and significantly attract more FDI. However, the research of Obiamaka et al. (2011) and Omankhanlen’s (2011) research on FDI inflows into Nigeria in the period 1980–2011 found that inflation has no effect on FDI inflows. Xaypanya et al. (2015) studied the determinants of FDI in the ASEAN (Association of Southeast Asian Nations) region using data over an eleven-year period (2000–2011) and found that while there are significantly positive effects of infrastructure facility and level of openness on FDI inflows into the ASEAN region, the inflation rate had a negative impact.
Abbott et al. (2012) empirically examined the effect of exchange rate regimes on foreign direct investment (FDI) flows on a panel of 70 developing countries for the period 1985–2004 and found that developing countries with fixed or intermediate regimes significantly outperformed those with a flexible exchange rate system in attracting FDI flows. Chong and Tan (2008) studied four Southeast Asian economies found that there is a long-run co-movement between exchange rate and FDI. The study of Ang (2008) on the Malaysian economy supported the proposition that currency value depreciation is associated with greater FDI inflows. The research of Wafure and Nurudeen (2010) revealed that exchange rate depreciation is one of the main determinants of foreign direct investment in Nigeria. The research of Xing and Wan (2006) indicated that the devaluation of the yuan (renminbi) improved China’s competitiveness in attracting FDI from Japan. Walsh and Yu (2010) detailed the relationship between exchange rate and foreign direct investment flow to host country. They argued that within an imperfect capital market, weaker currency in the host country has a positive impact on the inflow of FDI in that country as assets of the host country become less expensive. On the other hand, the research of Lily et al. (2014) on inflows of foreign direct investment (FDI) into ASEAN economies 1970–2011, using the ARDL (Auto Regressive Distributed Lag) approach found that there was significant long-run cointegration between exchange rate and FDI with a negative sign for the exchange rate coefficient, implying currency appreciation, and moreover, the direction of causality was between the exchange rate coefficient and FDI inflows in most cases.
If investment projects are directed towards the tradable sector, a country’s degree of openness to international trade is a relevant factor in the investment decision. Jordaan (2004) argues that the impact of openness on FDI depends on the type of investment. When investments are market-seeking, trade restrictions (and therefore less openness) can have a positive impact on FDI, as foreign firms that seek to serve local markets may decide to set up subsidiaries in the host country if it is difficult to import their products to the country. In contrast, multinational firms engaged in export-oriented investments may prefer to invest in a more open economy since increased imperfections that accompany trade protection generally imply higher transaction costs associated with exporting. Wheeler and Mody (1992) observe a strong positive support for the hypothesis in the manufacturing sector, but a weak negative link in the electronics sector. Kravis and Lipsey (1982), Culem (1988), and Edwards (1990) find a strong positive effect of openness on FDI and Schmitz and Bieri (1972) obtain a weak positive link. Pärletun (2008) find that trade openness is positive but statistically significant from zero. In ODI (1997), it is stated that while access to specific markets—judged by their size and growth—is important, domestic market factors are predictably much less relevant in export-oriented foreign firms. A range of surveys suggests a widespread perception that “open” economies encourage more foreign investment.
A study by Kosekahyaoglu (2006) on the Turkish economy finds a unidirectional Granger causality from FDI to trade openness, and not from trade openness to FDI inflows. Results from other studies suggest either a complementary or a substitution relationship between trade openness and FDI inflows, depending on whether intermediate or final goods are being considered (Aydin 2010). Most studies of this relationship indicate that the relationship is complementary. (Kamath 2008). In conclusion, although there are reasons that suggest both substitution and complementarity effects, the results almost point to a positive relationship between trade openness and FDI inflows.

2.2.2. Gross Domestic Product (GDP) and GDP Per Capita

There is confusion in the literature on GDP and GDP per capita, which in many papers are referred to interchangeably. Gross Domestic Product (GDP) is the value of all market and some nonmarket goods and services produced within the geographic borders of a given country and is an indicator of the size of an economy, whereas GDP per capita is an indicator of the income level of a country and a rough indicator of a country’s economic wellbeing and purchase power of its citizens (Callen 2008). It is necessary to distinguish between the two as they represent prospects for FDI from different perspectives.
Chakrabarti (2001) argues that the larger the market size in host country, the greater the opportunity for foreign direct investment inflow, as a large market is required for efficient utilization of resources and exploitation of economies of scale. Pärletun (2008) and Ang (2008) also find that GDP has a significant positive impact on FDI.
Jordaan (2004) mentions that FDI will move to countries with larger and expanding markets and greater purchasing power, where firms can potentially receive a higher return on their capital. Edwards (1990) and Jaspersen et al. (2000) use the inverse of income per capita as a proxy for the return on capital and conclude that real GDP per capita is inversely related to FDI/GDP, but Schneider and Frey (1985), Tsai (1994), and Asiedu (2002) find a positive relationship between the two variables. They argue that a higher GDP per capita implies better prospects for FDI in the host country. In a study on India, Indonesia, and Pakistan, Azam and Lukman (2010) find that market potential proxied by GDP per capita, foreign debt, domestic investment, trade liberalization, and infrastructure are the significant economic determinants of inward FDI during 1971–2005. A recent study by Kurecic et al. (2015) attempted to examine the interdependence of GDP per capita and foreign direct investment in the transitional economies of Central and Eastern Europe. In their study, which used annual time series data over the years 1994 to 2013, the states examined were classified into three geopolitical groups, two groups of non-EU states and a third group of more recent EU states. The findings of the study revealed that FDI and GDP per capita were related based on evidence from 14 states out of 20.

2.2.3. Infrastructure

Soft infrastructure implies market-oriented institutions, governance structures and such, and hard means physical infrastructure (such as roads, telephone connections, airports, roads, fast distribution networks, electricity transmissions, and railroads).
Bakar et al. (2012), studying Malaysia, have pointed to the importance of both hard and soft infrastructure toward attracting FDI inflows. Chakrabarti et al. (2012) also examined the relationship between infrastructure and FDI in India between the year 2002 and 2007 and found that there is a positive relationship between physical infrastructure and FDI inflow, though this depended on the level of infrastructure. Behname (2012) studied the relationship between infrastructure and FDI flows in a cross-sectional dataset of Southern Asia countries between 1980 and 2009 and found that urban infrastructure impacts FDI positively. Fung et al. (2005), whe researching which type of infrastructure (hard or soft) draws the attention of foreign investors and attracts FDI to China, found that both soft and hard infrastructure have a significant positive effect on FDI inflow although soft infrastructures outpace hard infrastructure in attracting FDI. Seetanah (2009) studied Mauritius data (1981–2005) to examine the link between FDI and physical infrastructure in attracting FDI to the manufacturing and services sector of Mauritius. The result of the estimation showed manufacturing sector investors pay more attention to physical infrastructure while services sector investors paid less attention to it. A study by Hakro and Omezzine (2011) to study the link between FDI flows and governance infrastructure in Mena Region countries found that governance infrastructure has a significant positive impact on FDI flows to the regions. Rehman et al. (2011) studied the impact of infrastructure on FDI in Pakistan over the period 1975–2008 and found that infrastructure and market size were positively related and exchange rate negatively related to FDI inflows in the short-run and in the long-run.
Asiedu (2002) investigated the determinants of FDI in 70 developing countries, 35 of which are from the Sub-Saharan Africa region, for the period between 1988 and 1997 infrastructural development and economic openness were key to attracting FDI. Essia and Onyema (2012) also found that improved infrastructure (energy supply, improvements in infrastructures for transportation and communication, and maintaining flexible institutional frameworks) is a necessary condition for better FDI inflows. Babatunde (2011), using panel data on Sub-Saharan African countries 1980–2003 found that infrastructure, trade openness, and GDP per capita were important for FDI inflows. Wheeler and Mody (1992), studying the investment location decisions of US firms, examined the impact of infrastructure quality on investment in 42 developing countries over the period between 1982 and 1988 and found that quality of energy, communication, and transport infrastructure have a highly significant positive impact on the volume of investment in the countries under study.

2.2.4. Other Factors Related to an Economy

Fedderke and Romm (2006) identified both policy and non-policy factors that drive foreign direct investment across-borders. They referred to product-market regulation, labor-market arrangements, corporate tax rates, openness, trade barriers, infrastructure, and restriction on direct FDI as policy factors that drive FDI inflows. The research also categorized market size of recipient country as measured by GDP, transport cost, factor endowments, and political and economic stability as non-policy factors. The role of taxes in attracting FDI over the years has been researched Karkinsky and Riedel (2012), and Becker et al. (2012) using panel data of multinational institutions from various perspectives which showed that corporate taxes in the host country have significant negative effects on the flow of FDI. On the other hand, research by Jones and Temouri (2016) showed that corporate taxes have no significant effect on the flow of FDI. Sekkat and Veganzones-Varoudakis (2007) researched the determinants of foreign direct investment inflow, into three categories, namely, basic economic factors, trade, and the exchange market policies and other aspects of the investment climate such as foreign exchange policy regime as well as trade liberalization and exchange rate volatility, and found that the host economy’s business climate such as infrastructure, availability of skilled labor, incentive factors, political risk, economic factors, social factors, political stability, and the role of institutions to enforce law and order are key drivers of foreign direct investment in foreign economies. In their work on the role of interest rate in attracting foreign direct investment using five Asian economies, Siddiqui and Aumeboonsuke (2014) argued that political stability is a vital determinant of FDI inflow. Hence, low political risk signals government commitment to protecting investors and has a positive effect on FDI inflow. The research of Anyanwu (2006, 2011) finds that investment in Africa, with its less transparent regimes and policies, religious and ethnic groups conflicts, and wars, scares away investments.

2.2.5. Summary

The importance of FDI to an economy is clear: it creates additional employment, technological progress, productivity improvements, and economic growth. In summary, existing theories on FDI postulate actions for firms from the perspective of the MNE which could be market-seeking or horizontal FDI, resource-seeking or vertical FDI, or efficiency-seeking, which could be restructuring operations overseas to achieve economies of scale or scope. While MNE motivation can be seen from these aspects, much empirical research has also been conducted on the determinants of FDI from the perspective of the host economy where there does not appear to be any theory. On the effect of some main determinants of FDI, there does not appear to be a consensus among researchers on the effect of inflation in attracting FDI inflows. While inflation can be seen to be the outcome of macroeconomic policies followed by a government, investors may be looking for longer term prospects in the economy based on its location, market size, income levels, and natural endowments. Empirical research on the impact of the exchange rate on FDI inflows suggests that in developing markets, investors seem to prefer currency depreciation so that their inward investments can have a higher purchase power in terms of local asset values, while in developed markets, currency appreciation is preferred by investors as it represents higher potential returns when converted into the investment currency. Although the overall conclusion from empirical research favors trade openness, it also gives us the insight that it depends on investor objectives: a higher level of trade openness does not favor FDI which is market-seeking, but those which are more export-oriented. Market size (represented by the value of Real GDP) is clearly important, as it represents future potential for expansion, growth, and resource utilization. On the other hand, income levels, represented by Real GDP per capita are indicative of the purchasing power of citizens in the economy and are an indicator of what type of FDI investment is appropriate as an entry strategy for the market. Finally, both soft and hard infrastructure are important for higher FDI inflows, their relative importance depending on the type of activity the investor is in. A review of other important characteristics for an economy to receive higher FDI inflows revealed that levels of taxation, political risk, and social factors are also important considerations.

3. Research Design

3.1. Problem Statement

The advantages of incoming FDI to developing countries are documented in research. As no previous recent research has been conducted to assess the determinants of FDI on the economies of Sub-Saharan Africa, the larger countries in this region are identified for this analysis: Liberia, Sierra Leone, Guinea, Ivory Coast, Ghana, Nigeria, Niger, Mauritania, Cameroon, and Senegal. After extensively reviewing previous research and alternative ways to study this problem, a positivist deductive approach was chosen. Relying on factors identified in previous empirical research, this study intended to analyze the impact of inflation, gross domestic product, gross national income per capita, exchange rate, openness, and infrastructure on FDI inflows to these selected countries between 1990 to 2017. Analysis of these variables are expected to provide further statistical explanations of their relationship with the inflow of foreign direct investment in the region. This will be useful to make policy recommendations for the promotion of foreign direct investment in these countries.
Therefore, the model for the research is specified as below:
FDI / GDP = f ( inflation ,   gross   domestic   product ,   gross   national   income   per   capita , exchange   rate ,   openness ,   infrastructure )

3.2. Data Sources

The study is focused on analyzing the relationship between five independent variables identified from the literature review in ten countries in Sub-Saharan Africa: Liberia, Sierra Leone, Ivory Coast, Mali, Nigeria, Mauritania, Niger, Ghana, Cameroon, and Senegal over the period 1990–2017. The sources of data collected for dependent and independent variables specific to each of the countries are summarized in Table 1 below, values are real or normalized as ratios:

3.3. Method of Analysis

In econometric estimation, variables are required to be stationary. If the variables turn out to be a mix of I(0) and I(1), the appropriate method will be the ARDL (auto-regressive distributed lag) approach. To capture the common and unique facts related to the inflow of FDI in the markets being studied, a panel cointegration approach was considered. This has the advantage of identifying long-run processes (common to the entire market) and short-run effects at work in each market. Panel unit root tests were conducted on each variable in the model to ensure regression estimations are affected with stationary variables. Panel cointegration tests were performed to test for the presence of cointegration.

4. Data Description, Analysis, and Findings

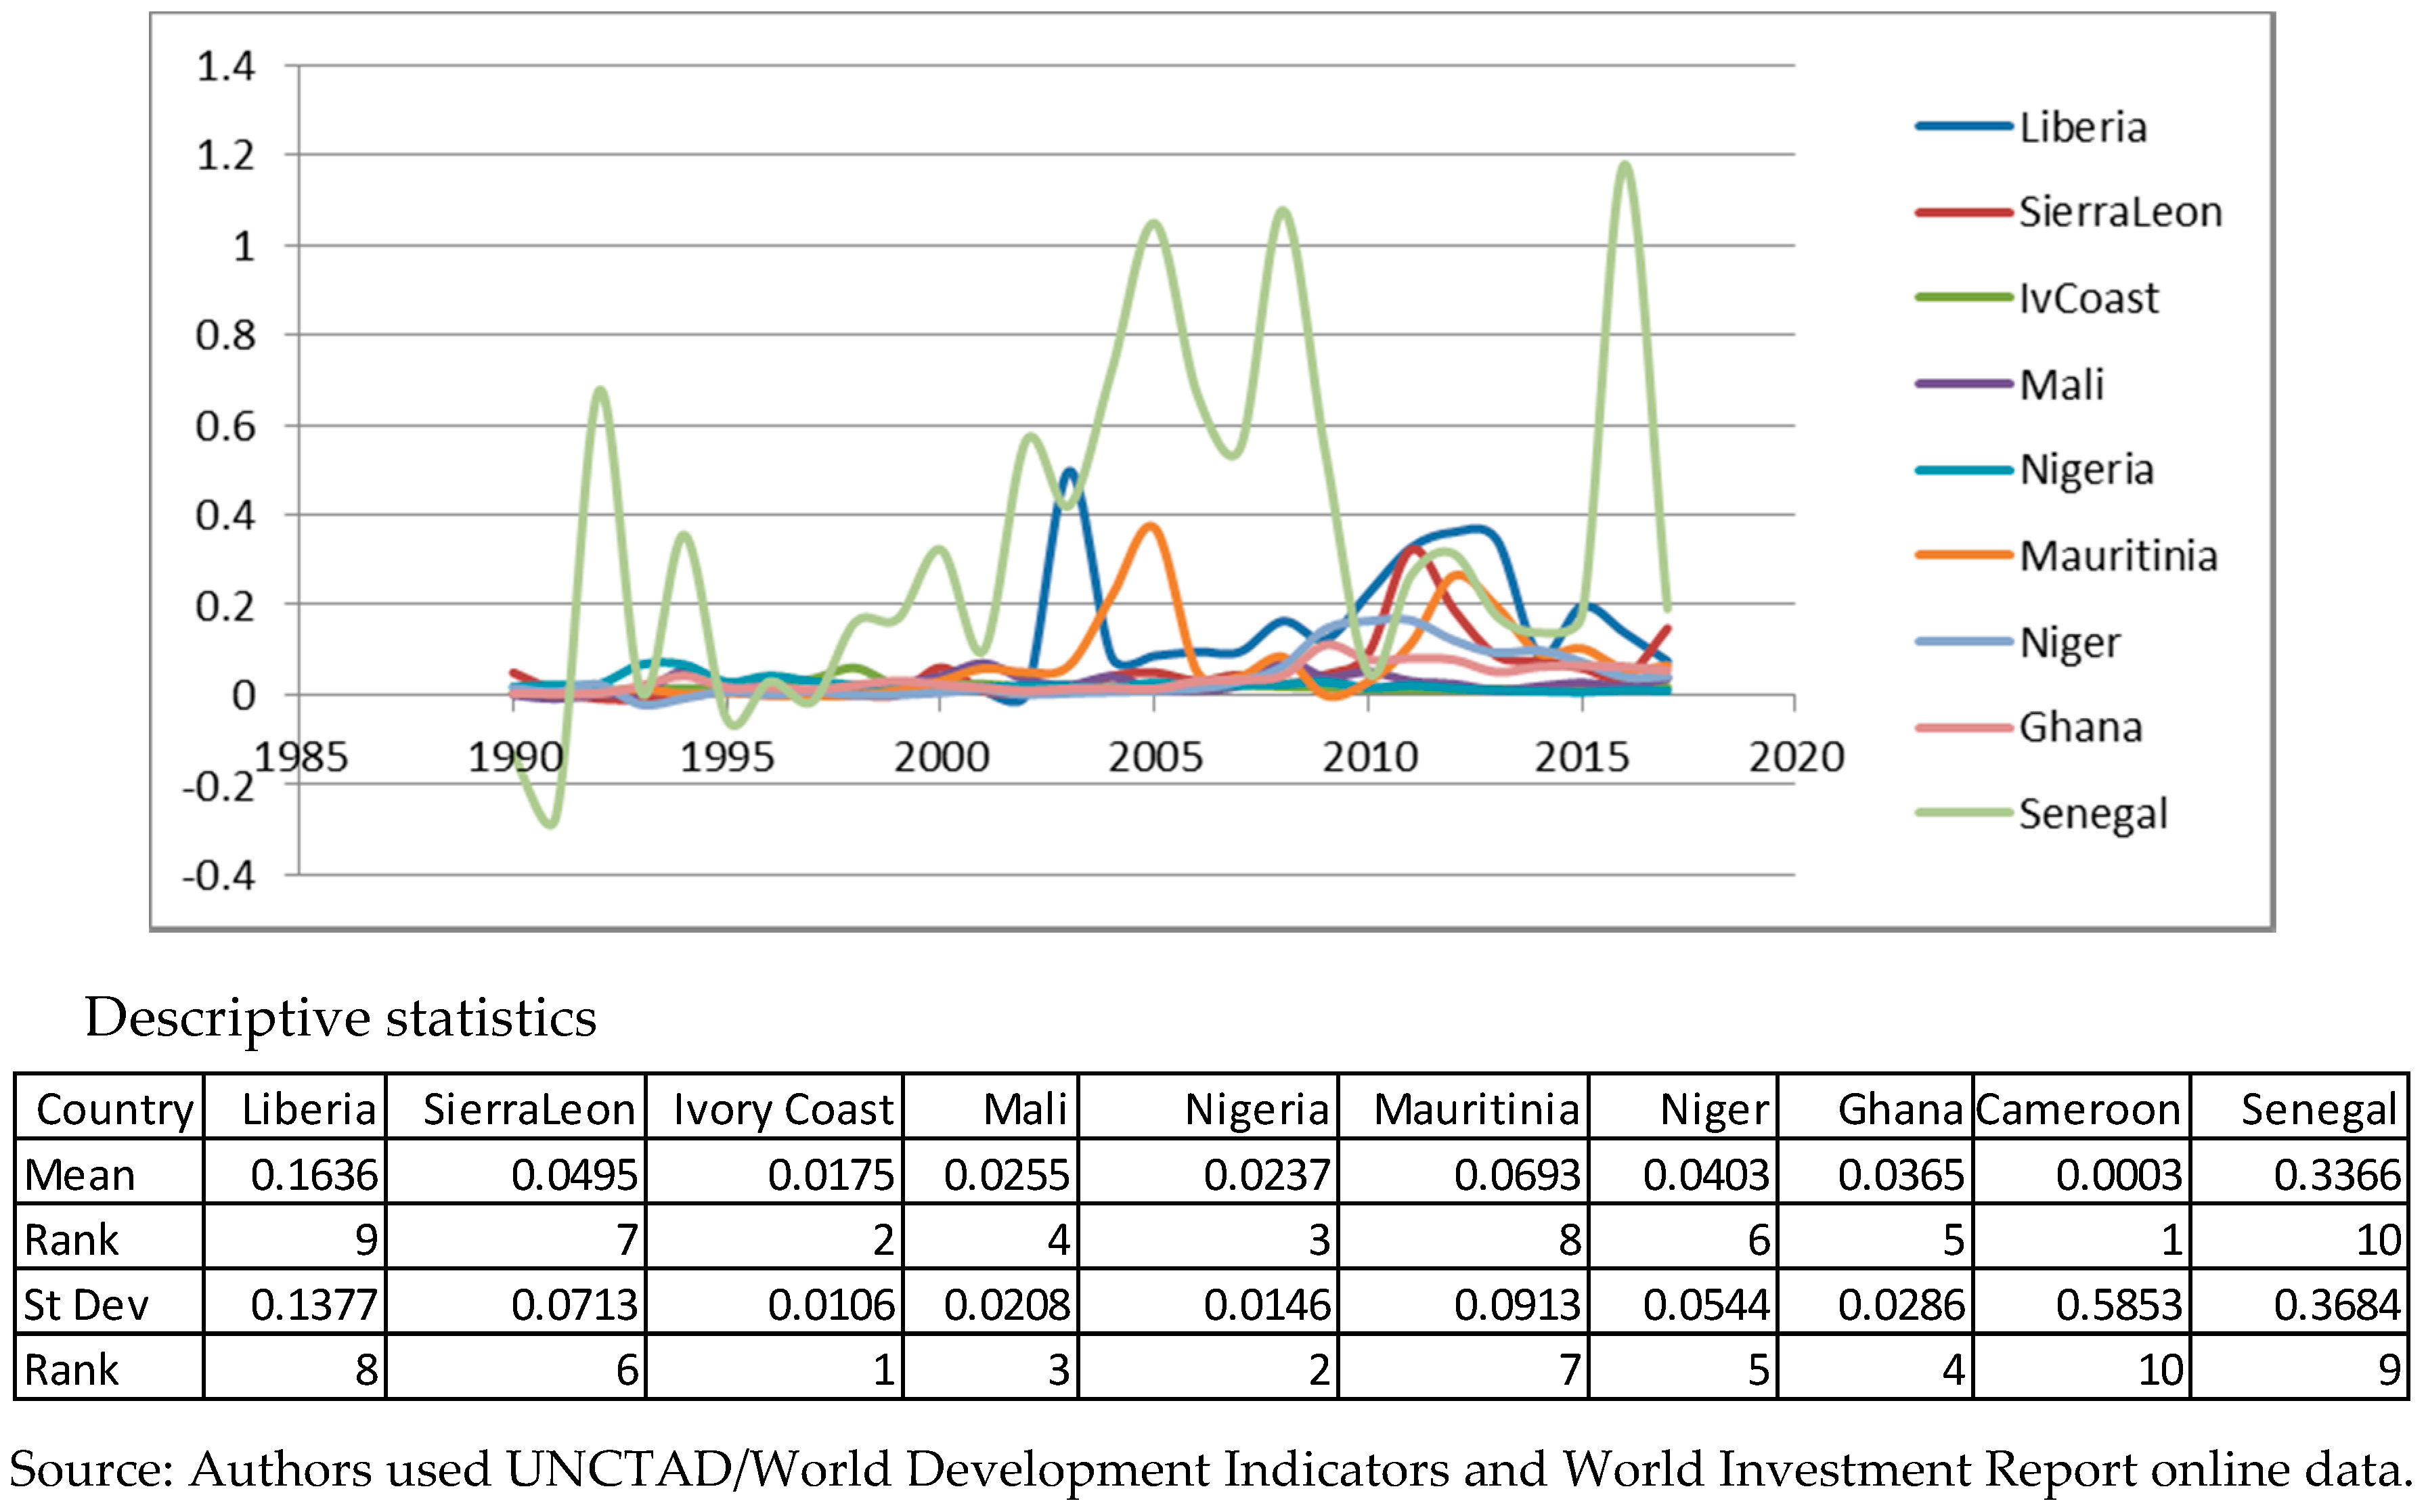
4.1. Data Description

After inspection of the data on variables in the analysis, to look at individual and overall market characteristics, RGDP and RGNIPC are natural logged (prefixed with L) to adjust for the variations and the change in the Exchange rate (EXRTO$) is computed (prefixed with D). Details of the variables for all countries are presented in Appendix A. Table 2 ranks the values for the various economies for each variable in ascending order.
Table 2 shows that the larger countries have higher income levels, lower openness, higher exchange rate depreciation, and higher inflation, but not the highest level of FDI inflows. Four countries in the region have regional trade agreements (Ivory Coast, Mali, Senegal, Niger) and five use the Central African Franc as their currency.
The summary of the mean and standard deviation for each variable is presented below in Table 3.

4.2. Data Analysis

The data consists of observations for ten countries from 1990 to 2017 (28 years), however, some data were not available in this period, making it an unbalanced panel. The variables specified in the model for estimation were tested for stationarity using the panel unit root test. Stationarity of the variables is supported as follows: FDIGDP, INF, DEXRTO$, OPEN are I(0) series, i.e., stationary at the level while LRGDP and LGNIPC are I(1) series, i.e., stationary at the first difference. The details are in Appendix B.
The correlation between the independent variables is presented in Table 4. None of the correlations except for that between LRGDP and LRGNIPC is more than 0.6.
As the variables are a mix of I(0) and I(1), the ARDL method is the appropriate one for estimations. To test long-run and short-run relationships, the estimations are based on panel cointegration (FDI/GDP, INF, OPENNESS, DEXROTO$, OPEN, LOGRGDP, LOGRGNIPC). Given the high correlation between LRGDP and LRGNIPC, it is necessary to estimate models with these variables separately. The results of the ARDL (Auto-Regressive Distributed Lag) models estimated are as given below in Table 5.

Interpretation of Results

The long-run relationship shows that higher FDI inflows in relation to GDP are associated with periods of higher inflation, better infrastructure, lower income levels, and smaller markets, while the common short-run equation relating to changes in the independent variables validate the long-run equation and show the direction of causality of the changes in the independent variables on changes in the dependent variable, but do not, on average, show the significance of the changes of the variables in the short-run. The positive signs of the openness and exchange rate changes variable, in the long-run equation they point to the general trend in the data, though these are not statistically significant. The short-run effects represent changes in the independent variables influencing the changes in the ratio of FDI to GDP, while the long-run equation captures the relationship across the period of estimation. A summary of the short- and long-run models for each country is presented in Table 6, details of the short-run models are presented in Appendix D.
Both models are useful to look at, and the short-run effects in the two models are about 95% the same (signs are same 70/74 cases). However, in Model 2, all the long-run equations are significant and imply causality between the significant variables (inf, infra, lrgdp) and the ratio FDI/GDP.

5. Discussion

In the models estimated with the six independent variables (inflation, openness, currency changes, infrastructure, income levels, and market size), the coefficients of four variables showed long-run significance in explaining the dependent variable (FDI/GDP). Higher FDI flows as a percentage of market (GDP) have taken place in markets with better infrastructure but lower size and income levels, characterized by higher inflation. The signs of the coefficients of exchange rate changes and openness are both positive, though they are not significant. The short-run effects represent changes in the independent variables influencing the changes in the ratio of FDI to GDP, while the long-run equation captures the relationship across all the markets.
Next, the implications of each independent variable used for estimation of the impact on FDI is discussed with respect to previous research findings so that implications for Sub-Saharan markets can be assessed.

5.1. Inflation (INF)

While studies by Faroh and Shen (2015), Xaypanya et al. (2015), found that lower inflation attracts higher FDI inflows, studies by Obiamaka et al. (2011), and Omankhanlen (2011) found that it had no effect on FDI inflows. In this study, the coefficient of the long run equation was significant and positive pointing to the inflationary macroeconomic conditions in these markets. Nevertheless, the coefficient of the change in inflation was negative in one model and positive in the other, but not significant, pointing to the need for macroeconomic stabilization across the markets.

5.2. Exchange Rates (EXRTO$)

While the study by Abbott et al. (2012) found the relevance of fixed exchange rate regimes in attracting higher FDI flows, studies by Wafure and Nurudeen (2010), Xing and Wan (2006), and Walsh and Yu (2010) found that exchange rate depreciation was important, while a study by Lily et al. (2014) found that exchange rate appreciation was relevant. In this study, in the long-run, the coefficient of the changes in the exchange rate was positive in sign but not significant. In the short-run, the coefficient of the change in exchange rate was negative in both models but not significant, pointing to the trend toward stabilization.

5.3. Trade Openness (OPEN)

Jordaan (2004) argued that market-seeking companies look for more closedness, while export-seeking firms seek more openness. When trade restrictions are higher, foreign firms have to resort to FDI to access local markets, while the presence of higher openness and availability of lower-cost local resources may attract more FDI in the case of export-oriented companies. These arguments are supported by the research of Wheeler and Mody (1992), Kravis and Lipsey (1982), Culem (1988), Edwards (1990), and Kosekahyaoglu (2006). There are also arguments of bi-directional causality.
In this study, in the long-run, the coefficient of openness was positive in sign but not significant in both models. In the short-run, the coefficient of the change in exchange rate was positive but not significant in both models, pointing to the trend of increasing openness across the markets.

5.4. Infrastructure (INFRA)

Studies by Chakrabarti et al. (2012), Behname (2012), and Fung et al. (2005) point to the higher FDI inflows attracted by countries with better infrastructure. Bakar et al. (2012), and Seetanah (2009) differentiated between hard (physical) and soft infrastructure (market-based institutional framework) and discussed their relevance. A study by Hakro and Omezzine (2011) found the importance of governance structures in attracting FDI. These findings are in line with research by Wheeler and Mody (1992), Babatunde (2011), Anyadike (2012), and Essia and Onyema (2012). In this study, the coefficient of infrastructure was positive and significant in both models, pointing to the importance of the infrastructure variable. In the short-run, the coefficient of the change in infrastructure was negative but not significant in both models, pointing to the need for more investment in infrastructure.

5.5. Market Size (GDP)

Chakrabarti (2001), Pärletun (2008), and Ang (2008) also found that the size of the market has a significant positive impact on FDI. The argument being that the larger market size in the host country gives the investor opportunities for efficient utilization of resources and exploitation of economies of scale. In this study, the coefficient of market size was negative in one model and significant, pointing to the better opportunities presented in smaller markets. So also, the short-run equation where the coefficient was negative but not significant points to the better opportunities in smaller markets.

5.6. Income Level (GNIPC)

Jordaan (2004), Schneider and Frey (1985), Tsai (1994), Asiedu (2002), and Azam and Lukman (2010) state FDI will move to countries with larger and expanding markets and greater purchasing power, where firms can potentially receive a higher return on their capital. On the other hand, studies by Edwards (1990) and Jaspersen et al. (2000) imply that a lower GDP per capita implies better prospects for FDI in the host country. This is also evident from the study by Kurecic et al. (2015) of the relationship between income levels and FDI in the transitional economies of Central and Eastern Europe, which found a greater attraction of FDI to markets with lower income, implying that the attraction for FDI is greater here, with investors seeing greater potential in these markets. In this research, the coefficient of income levels was negative and significant in one model pointing to the area where investment was attracted most. In the short-run, again the coefficient of the change in income levels was negative but not significant, pointing to investors seeing better prospects in markets with lower income levels.
These findings compared and contrasted with previous research give rise to important considerations for policy formulation for these countries. Although so far, the smaller Sub-Saharan countries with lower income levels and markets, but higher inflation, appear to have attracted a higher proportion of FDI in relation to GDP, the importance of infrastructure, exchange rate adjustments, and openness also become clear. Such FDI is of the nature of resource-seeking FDI, although the potential of the larger markets attracts market-seeking and efficiency-seeking FDI through larger size, more efficient utilization of resources, and exploitation of economies of scale.

6. Conclusions

The benefits of FDI via efficient technologies and capital inputs, human capital development via training of local employees, and contribution to corporate tax revenues in the host country have been discussed earlier. Higher production and exports and other improvements in soft and hard infrastructure suggest it can be an overall contributor to sustainable economic growth.
The aim of this research was to ascertain the determinants of FDI in ten Sub-Saharan economies in Africa: Liberia, Sierra Leone, Ivory Coast, Ghana, Nigeria, Mali, Mauritania, Niger, Cameroun, and Senegal and then to make policy recommendations for sustained economic growth. From an econometric analysis of data in the period 1990–2017, the sign of coefficients in the long-run causality equation implies that higher proportions of FDI in relation to GDP, of the resource-seeking type has been coming into these markets. However, this is only a comparative statement as the larger economies have attracted their share of market-seeking and efficiency FDI. Policies appropriate for a country will vary from country to country on whether it is attracting market-seeking or horizontal FDI, resource-seeking or vertical FDI, or efficiency-seeking FDI. FDI is also a major source of external finance for developing economies on average, between 2013 and 2017, FDI accounted for 39 percent of external finance for developing economies (UNCTAD 2018).
Market characteristics apart, good macroeconomic management to lower inflation and stabilize exchange rates can only lead to benefits for all the economies. These deliver a higher degree of certainty in returns for investors. The differentiation between hard and soft infrastructure is also important. Good physical infrastructure lowers costs and soft infrastructure eases operations and improves governance issues, vital for attracting FDI. The general wisdom is also that economies must move to higher openness for increased international competitiveness.
The intangible benefits of FDI such as improved technologies, development of local human resources, skills transfers, higher taxes to government, and prompts on policy changes necessary for higher economic activity need to be taken into account in formulating policies. The rationalization of internal legal frameworks, simplification of rules for investors, improvements in the working of the banking and services sector, assured repatriation of profits are all important matters which enhance FDI inflows for all markets.
The ten economies in Sub-Saharan Africa in this study are all developing countries which need capital for growth, each economy will need to analyze its present structure (whether predominantly commodity-based, manufacturing-, agricultural-, industrial-, or service-orientated), assess its resources (stock of labor, intellectual capital, and natural resources), the linkages between sectors and economies, and its vision for the future. Policies to promote internal investment will vary from market to market depending on these matters. Thereafter policy makers can devise suitable policies with relative emphasis on various actions, consistent with reaching its planned targets.

Limitations and Recommendations for Further Research

The UNCTAD and World Bank databases have made available much of the data for this study. While the variables chosen for the analysis all proved to be relevant, deeper analysis would require reliable data and complete datasets on other determinants such as labor cost, economy wide power consumption, corporate tax rate, corruption, natural resources, effectiveness of rule of law, and political risk. In-depth country-based studies with the same variables tested for linkages with other sectors, economies, and economic growth will doubtless provide further insights. Four countries in the ten countries have a common trade agreement and five a common currency, the specific implications of such arrangements for higher FDI inflows could be further studied. These are some of the directions which can be taken in future studies.

Author Contributions

Conceptualization, writing and revising, P.J. and V.S.

Funding

This research received no external funding.

Conflicts of Interest

The authors declare no conflicts of interest.

Appendix A. Descriptive Statistics for Variables. Source: Authors’ Work

Figure A1. Foreign Direct Investment (FDI) as a ratio of Gross Domestic Product (GDP)% (1990–2017).
Ijfs 07 00043 g0a1
The average FDI/GDP ratio over the period 1990–2017 was highest for Senegal and Liberia (more than 15%) and lowest for Cameroon and Ivory Coast (less than 2%) though the variability of inflows was also high for Senegal and Liberia. Senegal and Liberia had double digit ratios while the other countries had lower ratios for FDI/GDP.
Figure A2. Inflation based on Consumer Price Index CPI in the ten countries (1990–2017).
Ijfs 07 00043 g0a2
In the period under study 1990–2017, average inflation has been low in Niger, Mali, Ivory Coast, Senegal, and Cameroon but higher in the other countries. The highest levels of inflation have been in Nigeria and Ghana (double digit inflation) where the variability has also been higher.
Figure A3. Exchange Rate changes year to year% (1990–2017).
Ijfs 07 00043 g0a3
On average, the currencies of all ten countries depreciated with the highest average depreciation over the period 1990–2017 in Ghana, Sierra Leone and Nigeria (double digit) and lowest in Cameroon, Senegal, Niger, Ivory Coast, and Mali. Currency depreciation is considered attractive for vertical FDI.
Figure A4. Openness (OPEN).
Ijfs 07 00043 g0a4
The highest level of openness in the period 1990–2017 was in Liberia, Mauritania, Ivory Coast, and Ghana (all above 70%) and lowest in Nigeria and Cameroon (below 50%). Openness is considered less important for market seeking FDI than those which are export-oriented.
Figure A5. Market size Log of Real Gross Domestic Product (RGDP).
Ijfs 07 00043 g0a5
Market size is considered an important variable for market-seeking FDI. The largest markets in the ten countries are Nigeria, Ghana, Ivory Coast, and Senegal, with Liberia and Sierra Leone being the smallest.
Figure A6. GNI Per Capita (1990–2017).
Ijfs 07 00043 g0a6
GNI per capita is a measure of the income level and purchasing power capacity of a country. Average real GNI per capita (2011$) over the period 1990–2017 was highest in Nigeria, Mauritania, Ivory Coast, and Ghana (above $2500) and lowest in Liberia and Niger (<$1000).
Figure A7. Infrastructure (1990–2017). Source: Authors’ work.
Ijfs 07 00043 g0a7
Infrastructure is important for foreign investors. Here the sum of Fixed telephone line and Mobile cell subscriptions per 100 persons is used as a measure of infrastructural development of a country as suggested. In terms of this measure of the infrastructure, Senegal, Ivory Coast, Mauritania, Ghana, and Cameroon have the highest levels of infrastructure, while Sierra Leone and Niger seem to have the poorest.

Appendix B. Panel Unit Root Tests for Stationarity. Source: Authors’ Work

Table A1. Panel Unit Root Test for FDIGDP variable.
Panel unit root test: Summary
Series: FDIGDP
Date: 07/18/19 Time: 18:42
Sample: 1990 2017
Exogenous variables: Individual effects
User-specified lags: 1
Newey-West automatic bandwidth selection and Bartlett kernel
MethodStatisticProb.**Cross-sectionsObs
Null: Unit root (assumes common unit root process)
Levin, Lin & Chu t *−3.337830.000410250
Null: Unit root (assumes individual unit root process)
Im, Pesaran and Shin W-stat −3.804690.000110250
ADF-Fisher Chi-square49.47580.000310250
PP-Fisher Chi-square63.89080.000010260
* Null hypothesis, there is a unit root. ** Probabilities for Fisher tests are computed using an asymptotic Chi, -square distribution. All other tests assume asymptotic normality.
Table A2. Panel Unit Root Test for INF variable.
Panel unit root test: Summary
Series: INF
Date: 07/18/19 Time: 18:45
Sample: 1990 2017
Exogenous variables: Individual effects
User-specified lags: 1
Newey-West automatic bandwidth selection and Bartlett kernel
MethodStatisticProb. **Cross-sectionsObs
Null: Unit root (assumes common unit root process)
Levin, Lin & Chu t *−2.605460.004610231
Null: Unit root (assumes individual unit root process)
Im, Pesaran and Shin W-stat−4.351990.000010231
ADF-Fisher Chi-square63.72590.000010231
PP-Fisher Chi-square81.34090.000010241
* Null hypothesis, there is a unit root. ** Probabilities for Fisher tests are computed using an asymptotic Chi. -square distribution. All other tests assume asymptotic normality.
Table A3. Panel Unit Root Test for DEXRTO$ variable.
Panel unit root test: Summary
Series: DEXRTO$
Date: 07/18/19 Time: 18:38
Sample: 1990 2017
Exogenous variables: Individual effects
User-specified lags: 1
Newey-West automatic bandwidth selection and Bartlett kernel
Balanced observations for each test
MethodStatisticProb. **Cross-sectionsObs
Null: Unit root (assumes common unit root process)
Levin, Lin & Chu t *−7.416230.000010250
Null: Unit root (assumes individual unit root process)
Im, Pesaran and Shin W-stat−7.300360.000010250
ADF—Fisher Chi-square89.79240.000010250
PP—Fisher Chi-square129.5060.000010260
* Null hypothesis, there is a unit root. ** Probabilities for Fisher tests are computed using an asymptotic Chi. -square distribution. All other tests assume asymptotic normality.
Table A4. Panel Unit Root Test for DLRGNIPC variable.
Panel unit root test: Summary
Series: D(LRGNIPC)
Date: 07/18/19 Time: 18:43
Sample: 1990 2017
Exogenous variables: Individual effects
User-specified lags: 1
Newey-West automatic bandwidth selection and Bartlett kernel
Balanced observations for each test
MethodStatisticProb. **Cross-sectionsObs
Null: Unit root (assumes common unit root process)
Levin, Lin & Chu t *−0.751720.226110250
Null: Unit root (assumes individual unit root process)
Im, Pesaran and Shin W-stat −5.204620.000010250
ADF—Fisher Chi-square65.32610.000010250
PP—Fisher Chi-square155.6600.000010260
* Null hypothesis, there is a unit root. ** Probabilities for Fisher tests are computed using an asymptotic Chi. -square distribution. All other tests assume asymptotic normality.
Table A5. Panel Unit Root Test for OPEN variable.
Panel unit root test: Summary
Series: OPEN
Date: 07/18/19 Time: 18:44
Sample: 1990 2017
Exogenous variables: Individual effects
User-specified lags: 1
Newey-West automatic bandwidth selection and Bartlett kernel
MethodStatisticProb.**Cross-sectionsObs
Null: Unit root (assumes common unit root process)
Levin, Lin & Chu t *−1.579930.057110250
Null: Unit root (assumes individual unit root process)
Im, Pesaran and Shin W-stat −1.872510.030610250
ADF—Fisher Chi-square28.14000.106110250
PP—Fisher Chi-square32.17280.041510260
* Null hypothesis, there is a unit root. ** Probabilities for Fisher tests are computed using an asymptotic Chi. -square distribution. All other tests assume asymptotic normality.
Table A6. Panel Unit Root Test for DLRGDP variable.
Panel unit root test: Summary
Series: D(LRGDP)
Date: 07/18/19 Time: 18:45
Sample: 1990 2017
Exogenous variables: Individual effects
User-specified lags: 1
Newey-West automatic bandwidth selection and Bartlett kernel
MethodStatisticProb. **Cross-sectionsObs
Null: Unit root (assumes common unit root process)
Levin, Lin & Chu t *−2.930430.001710240
Null: Unit root (assumes individual unit root process)
Im, Pesaran and Shin W-stat −4.299680.000010240
ADF—Fisher Chi-square54.90260.000010240
PP—Fisher Chi-square108.6880.000010250
* Null hypothesis, there is a unit root. ** Probabilities for Fisher tests are computed using an asymptotic Chi. -square distribution. All other tests assume asymptotic normality.

Appendix C. Panel Cointegration test. Source: Authors’ Work

Table A7. Panel Cointegration test to test for presence of cointegration.
Pedroni Residual Cointegration Test
Series: FDIGDP LRGNIPC DEXRTO$ LRGDP OPEN INF
Date: 07/18/19 Time: 18:55
Sample: 1990 2017
Included observations: 280
Cross-sections included: 10
Null Hypothesis: No cointegration
Trend assumption: No deterministic trend
User-specified lag length: 1
Newey-West automatic bandwidth selection and Bartlett kernel
Alternative hypothesis: common AR coefs. (within-dimension)
Weighted
StatisticProb.StatisticProb.
Panel v-Statistic−3.7532810.9999−2.6706430.9962
Panel rho-Statistic−1.1353540.1281−0.6827820.2474
Panel PP-Statistic−9.4569120.0000−7.2325590.0000
Panel ADF-Statistic−5.2132680.0000−3.5178660.0002
Alternative hypothesis: individual AR coefs. (between-dimension)
StatisticProb.
Group rho-Statistic0.9332570.8247
Group PP-Statistic−7.8706910.0000
Group ADF-Statistic−3.1034530.0010
Cross section specific results
Phillips-Peron results (non-parametric)
Cross IDAR(1)VarianceHACBandwidthObs
Liberia0.0970.0048810.0048810.0015
Sierra Leone−0.4060.0020000.0005049.0010
Ivory Coast−0.1754.50 × 10−52.49 × 10−56.0026
Mali0.2800.0002080.0002351.0026
Nigeria−0.1008.52 × 10−55.31 × 10−57.0026
Mauritania0.2540.0030320.0030953.0026
Niger0.0370.0001790.0001671.0026
Ghana0.3780.0002060.0002060.0026
Cameroon−0.0510.3332280.2004856.0026
Senegal−0.3620.0587410.0544142.0026
Augmented Dickey-Fuller results (parametric)
Cross IDAR(1)VarianceLagMax lagObs
Liberia0.0610.0051311--14
Sierra Leone−1.1710.0016761--9
Ivory Coast−0.5873.99 × 10−51--25
Mali0.1980.0001971--25
Nigeria−0.5407.00 × 10−51--25
Mauritania0.1660.0030131--25
Niger0.1060.0001561--25
Ghana0.2720.0002061--25
Cameroon−0.3270.3215321--25
Senegal−0.5720.0544031--25

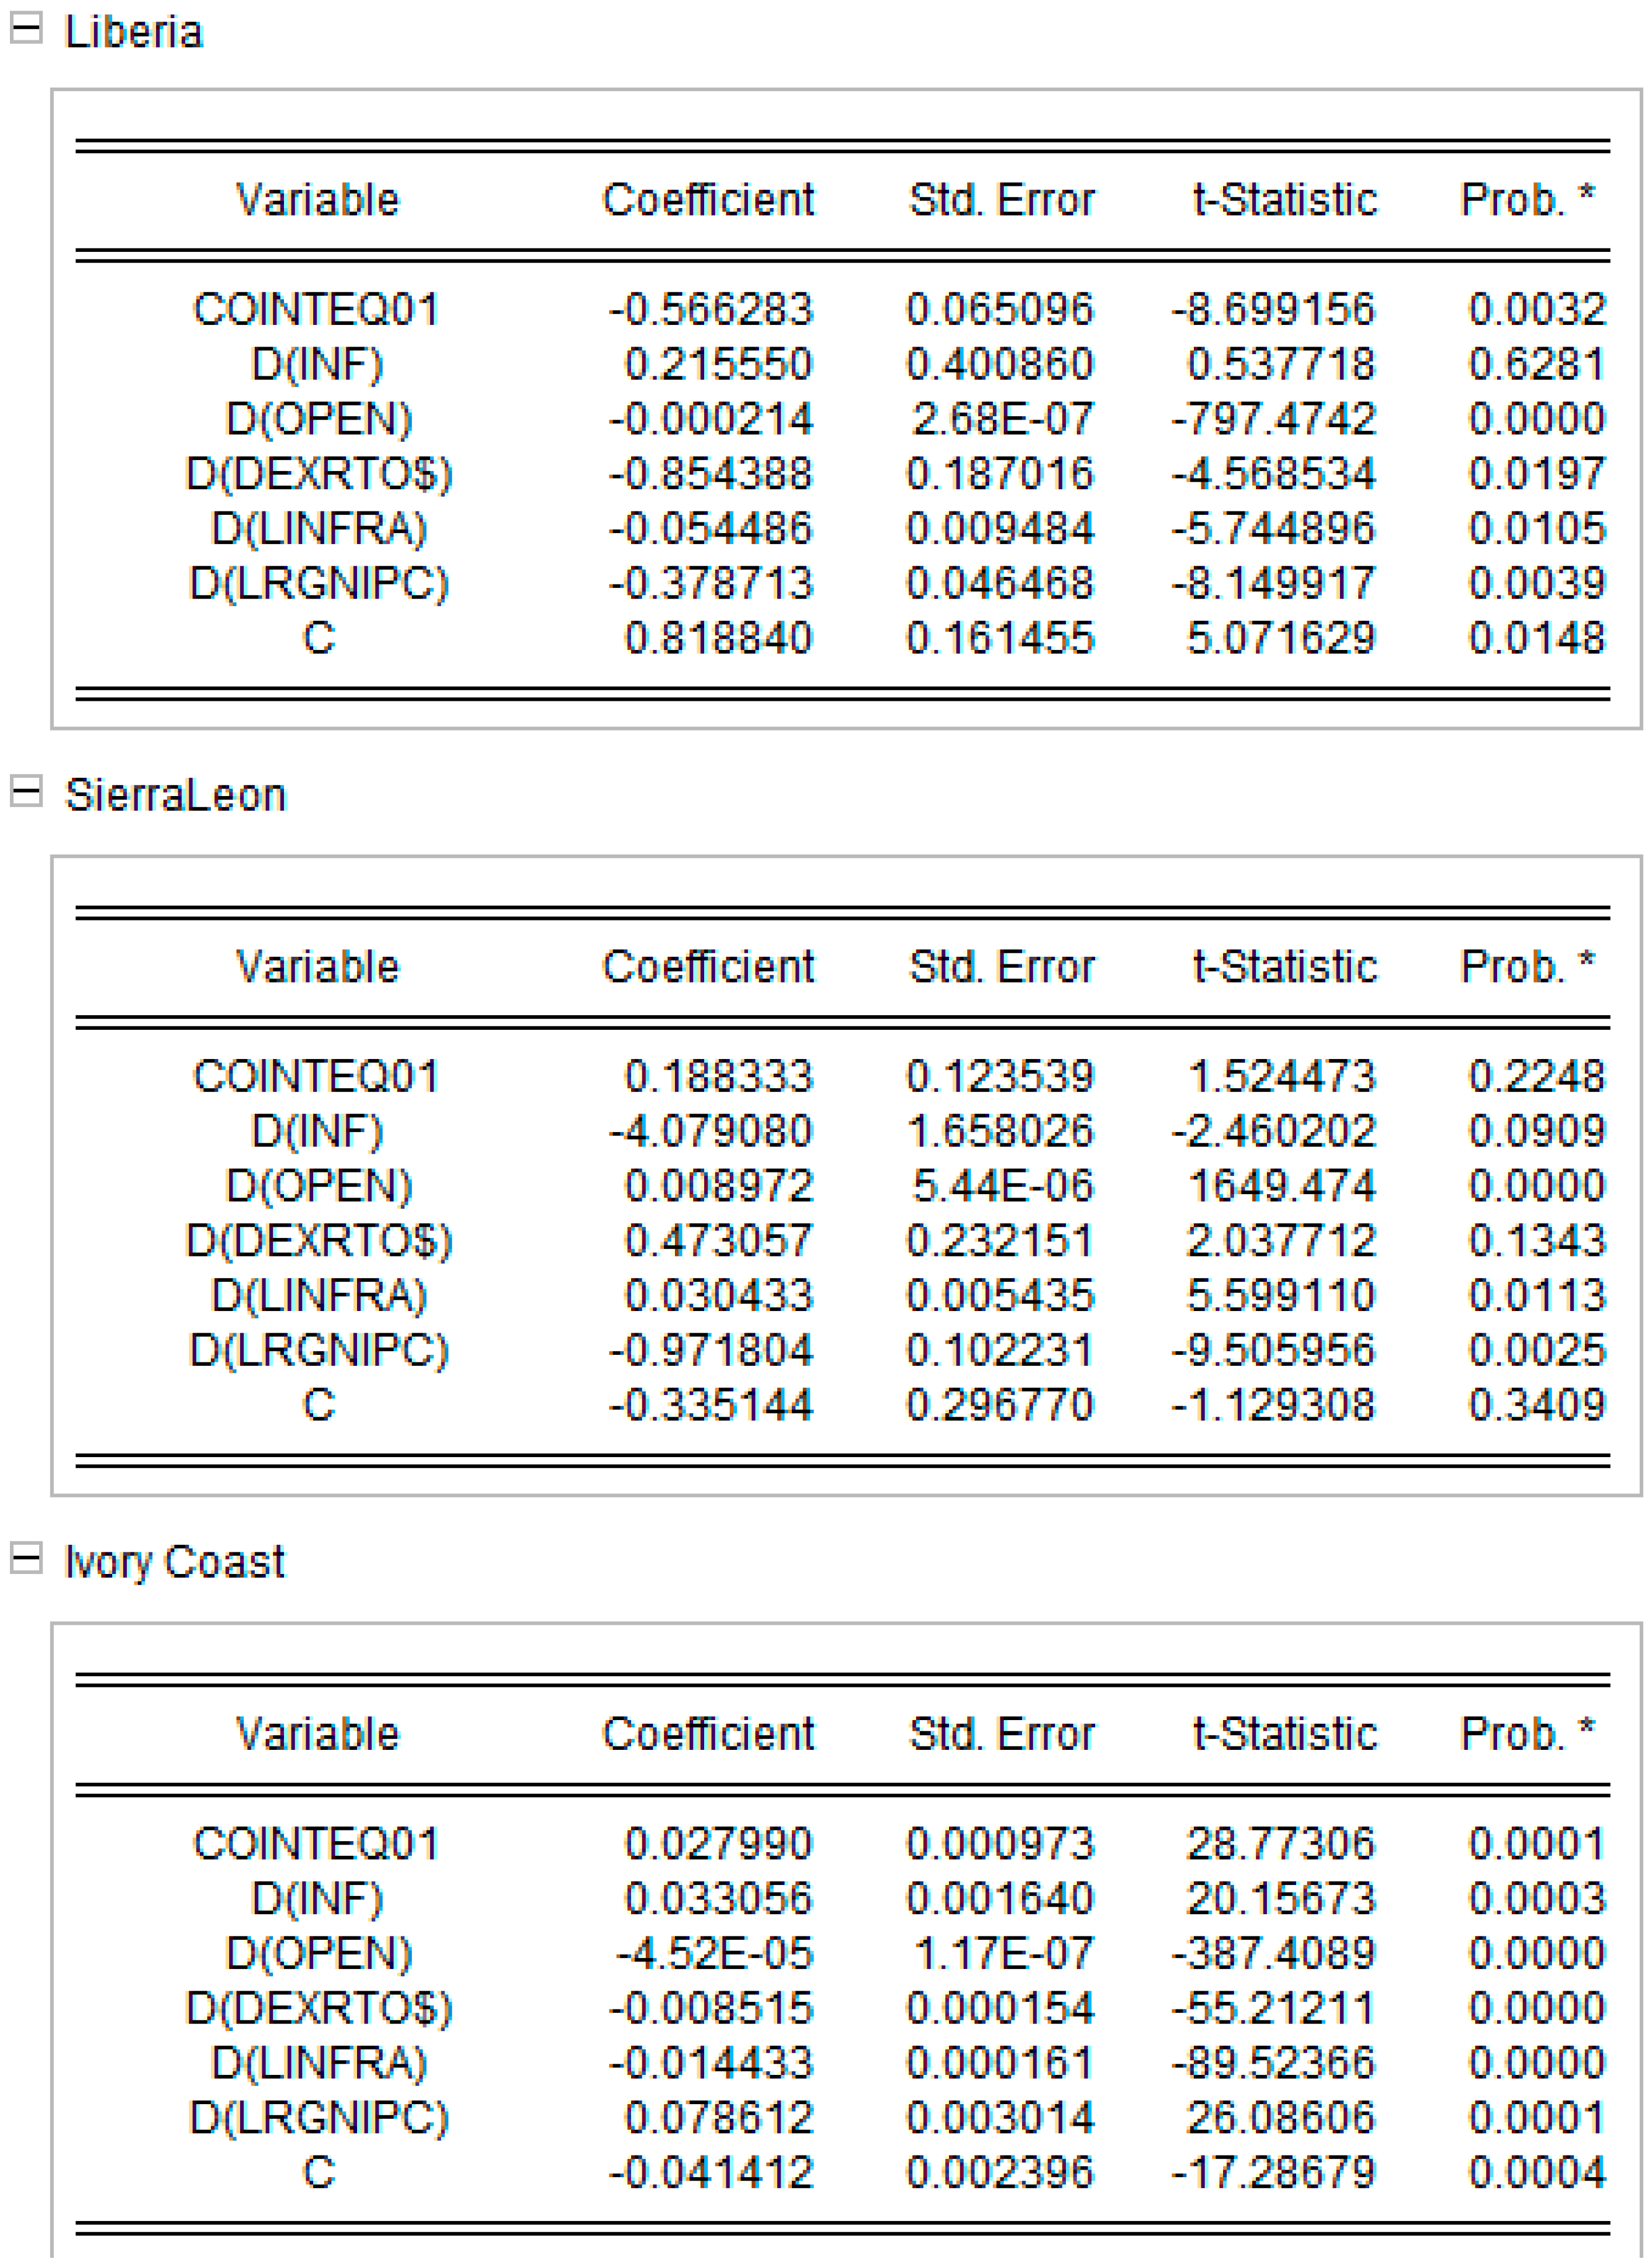
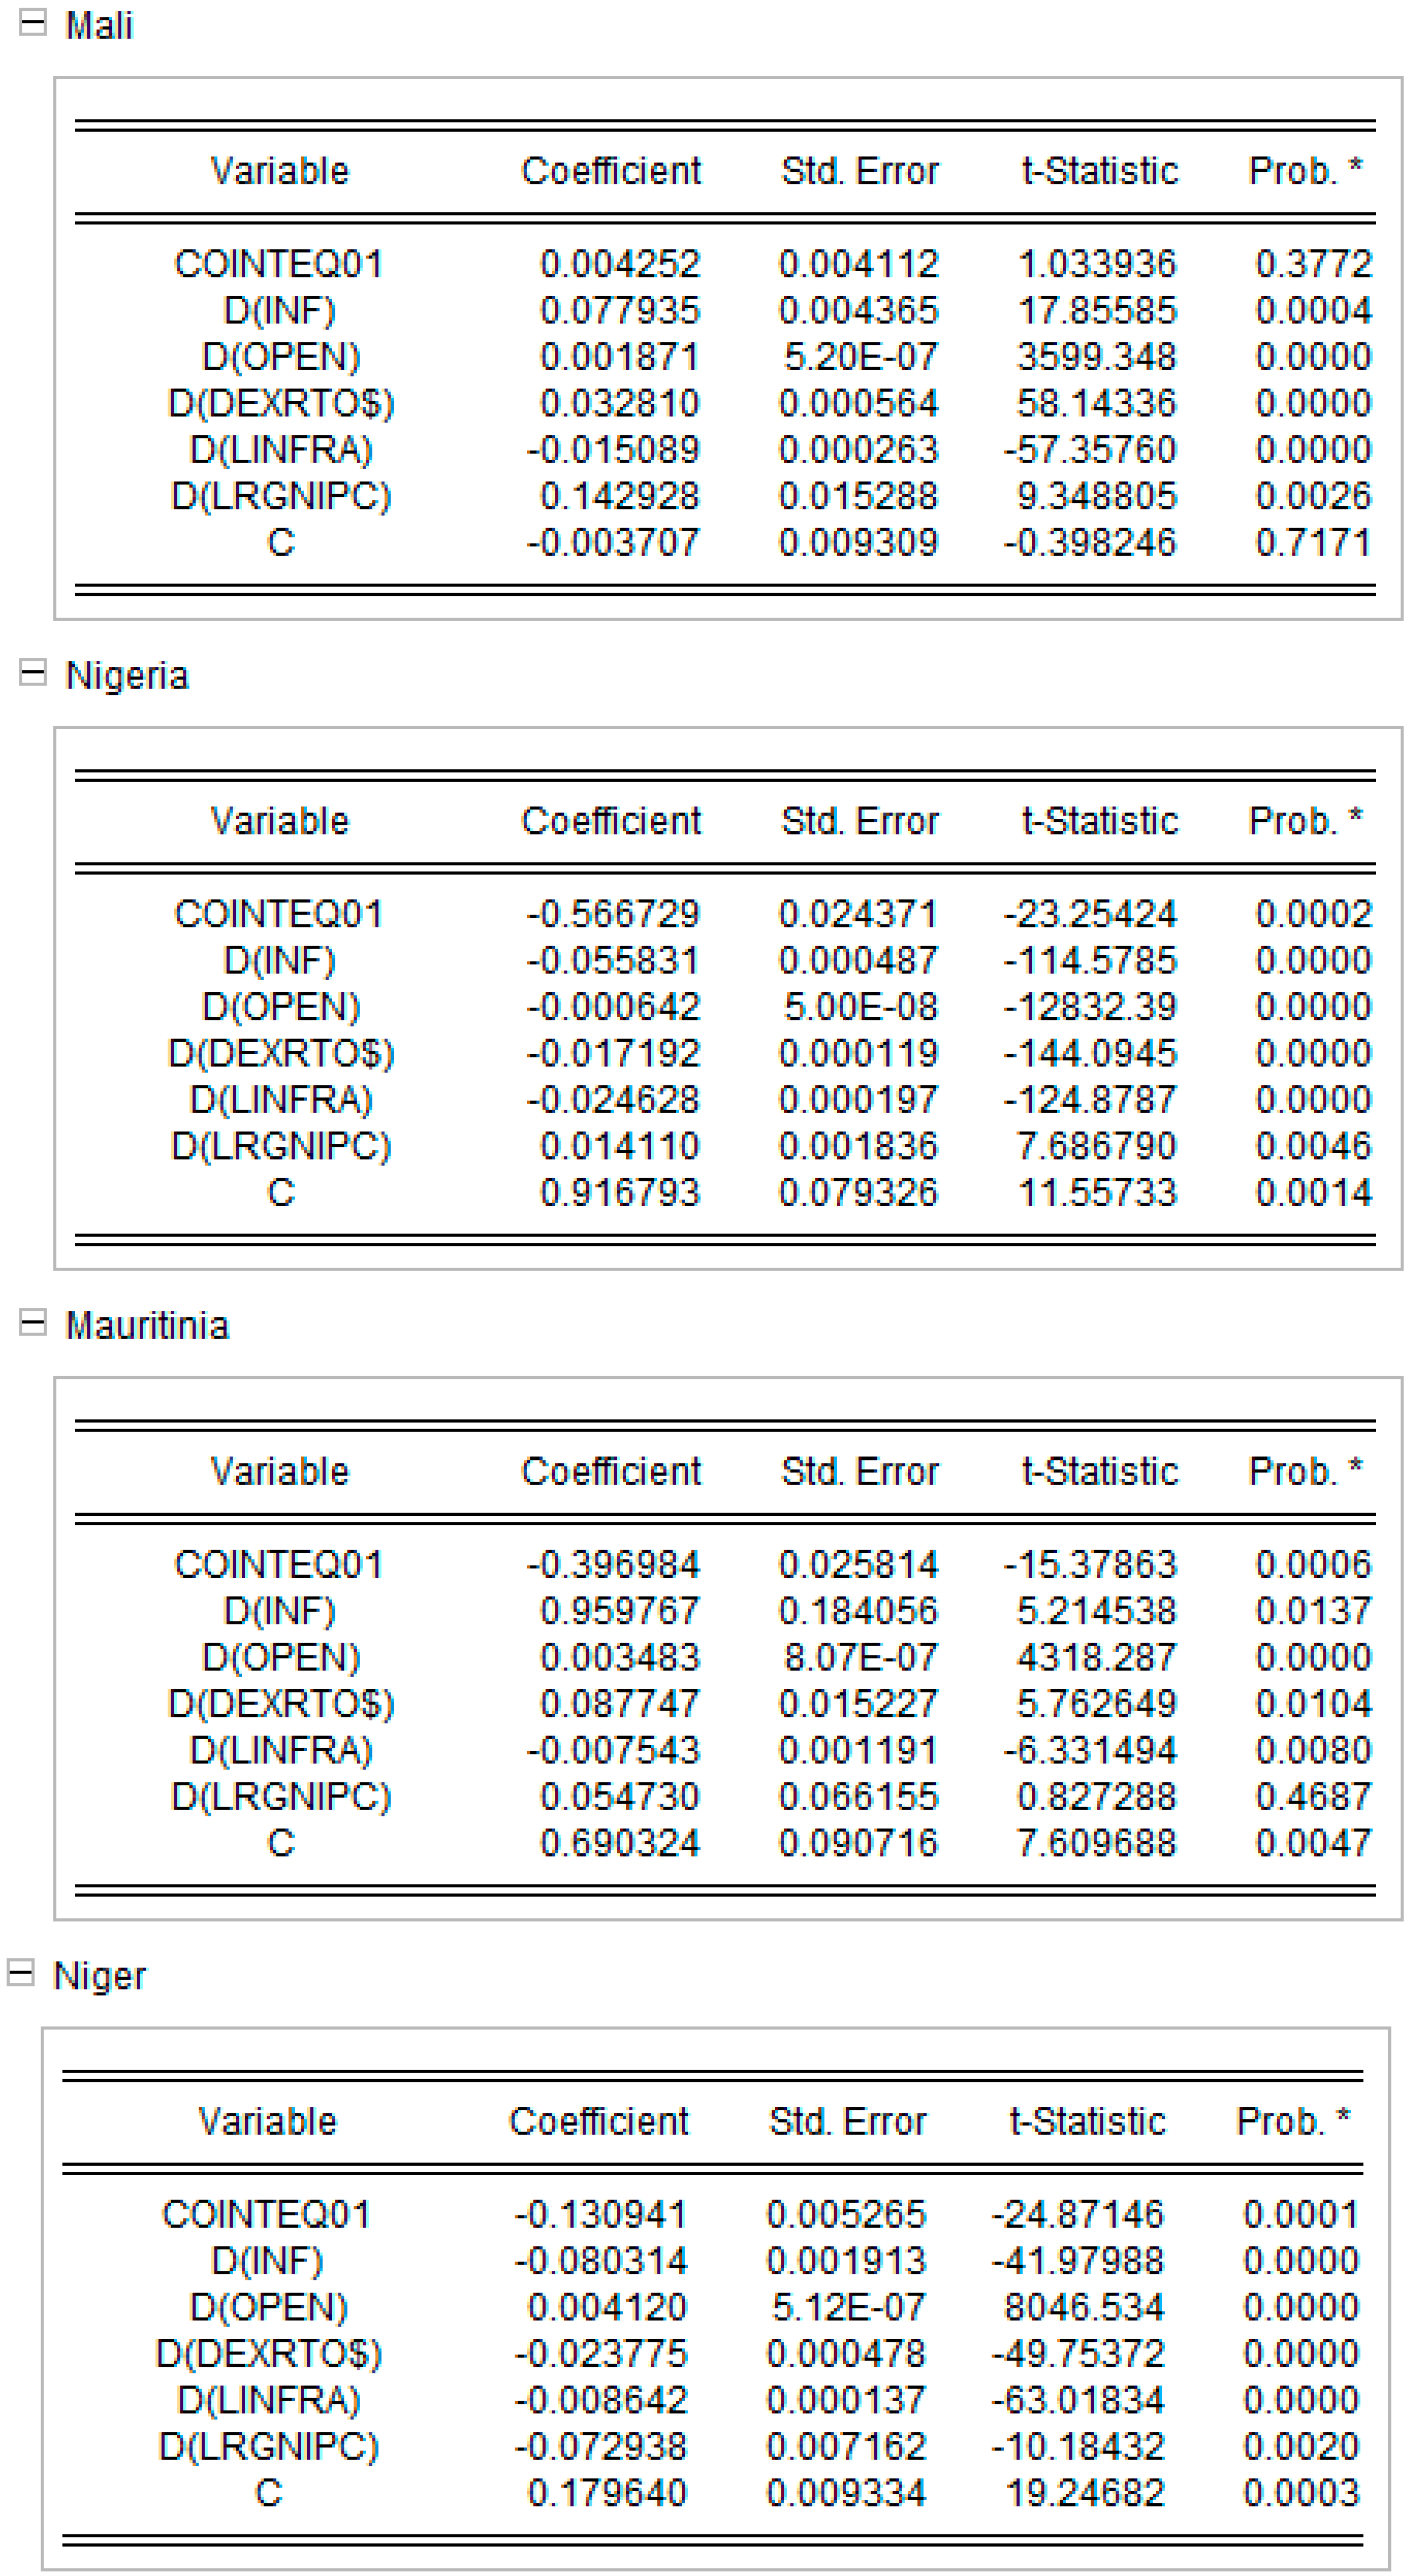
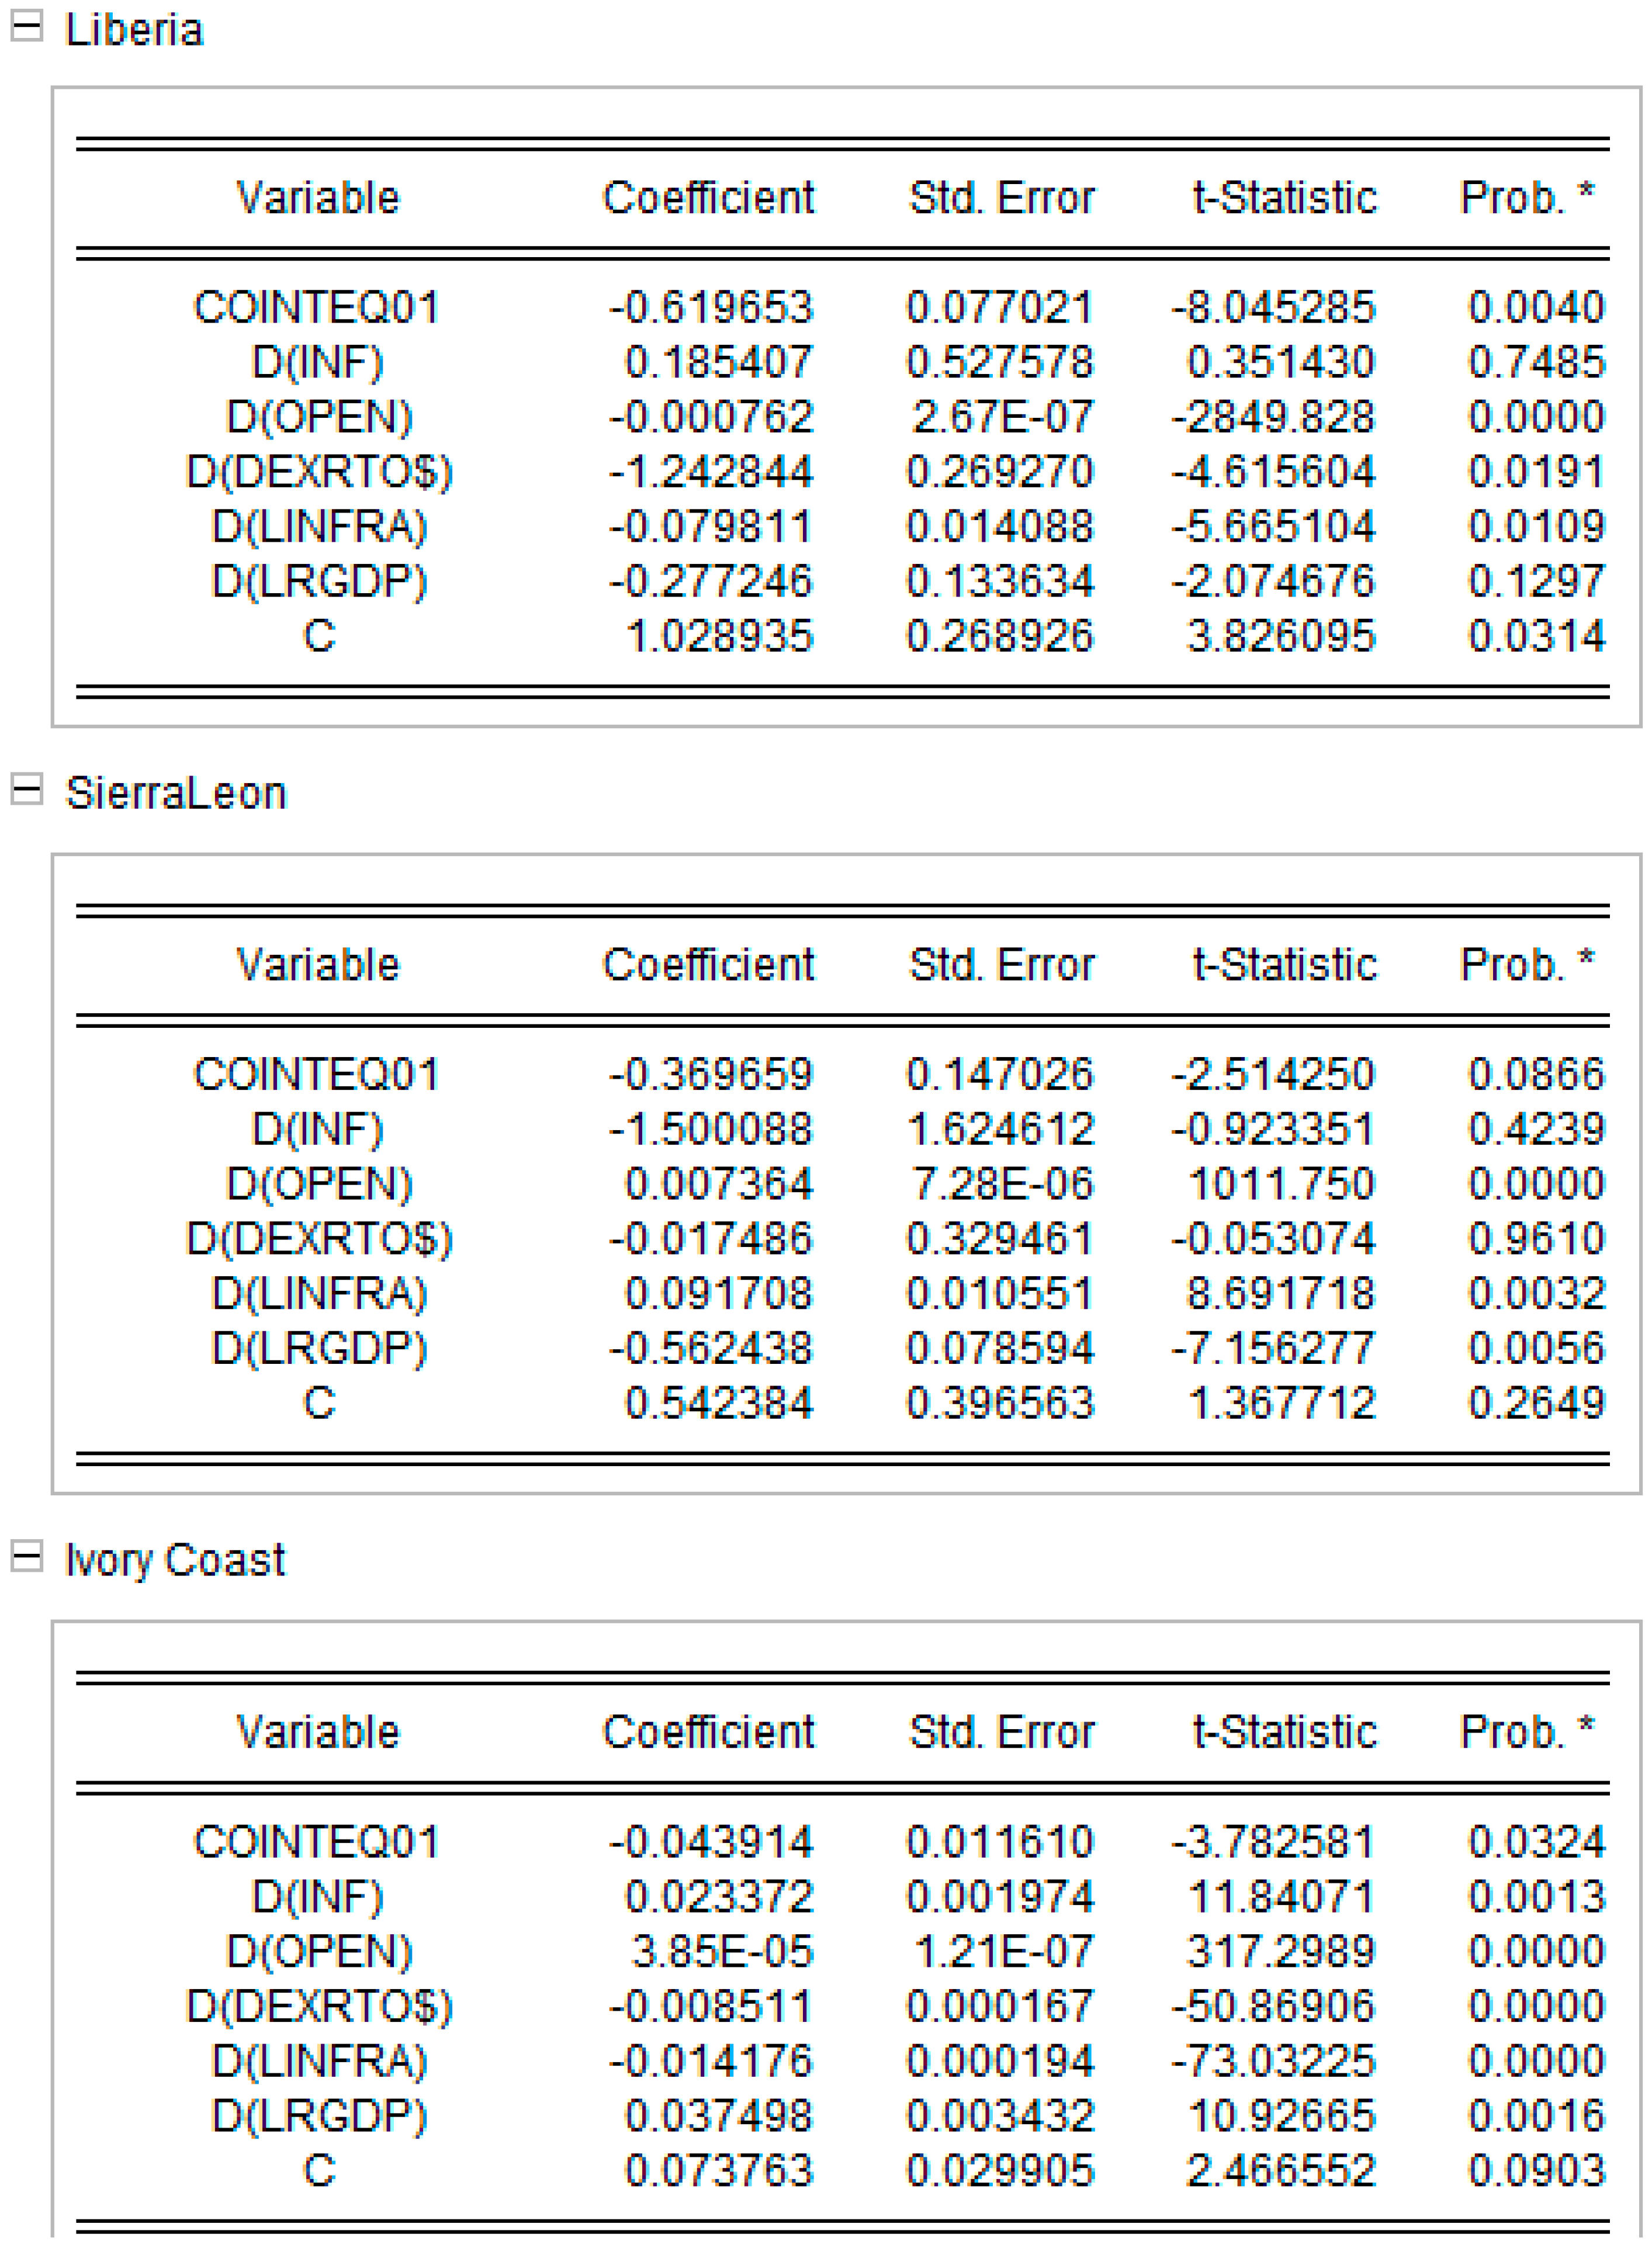
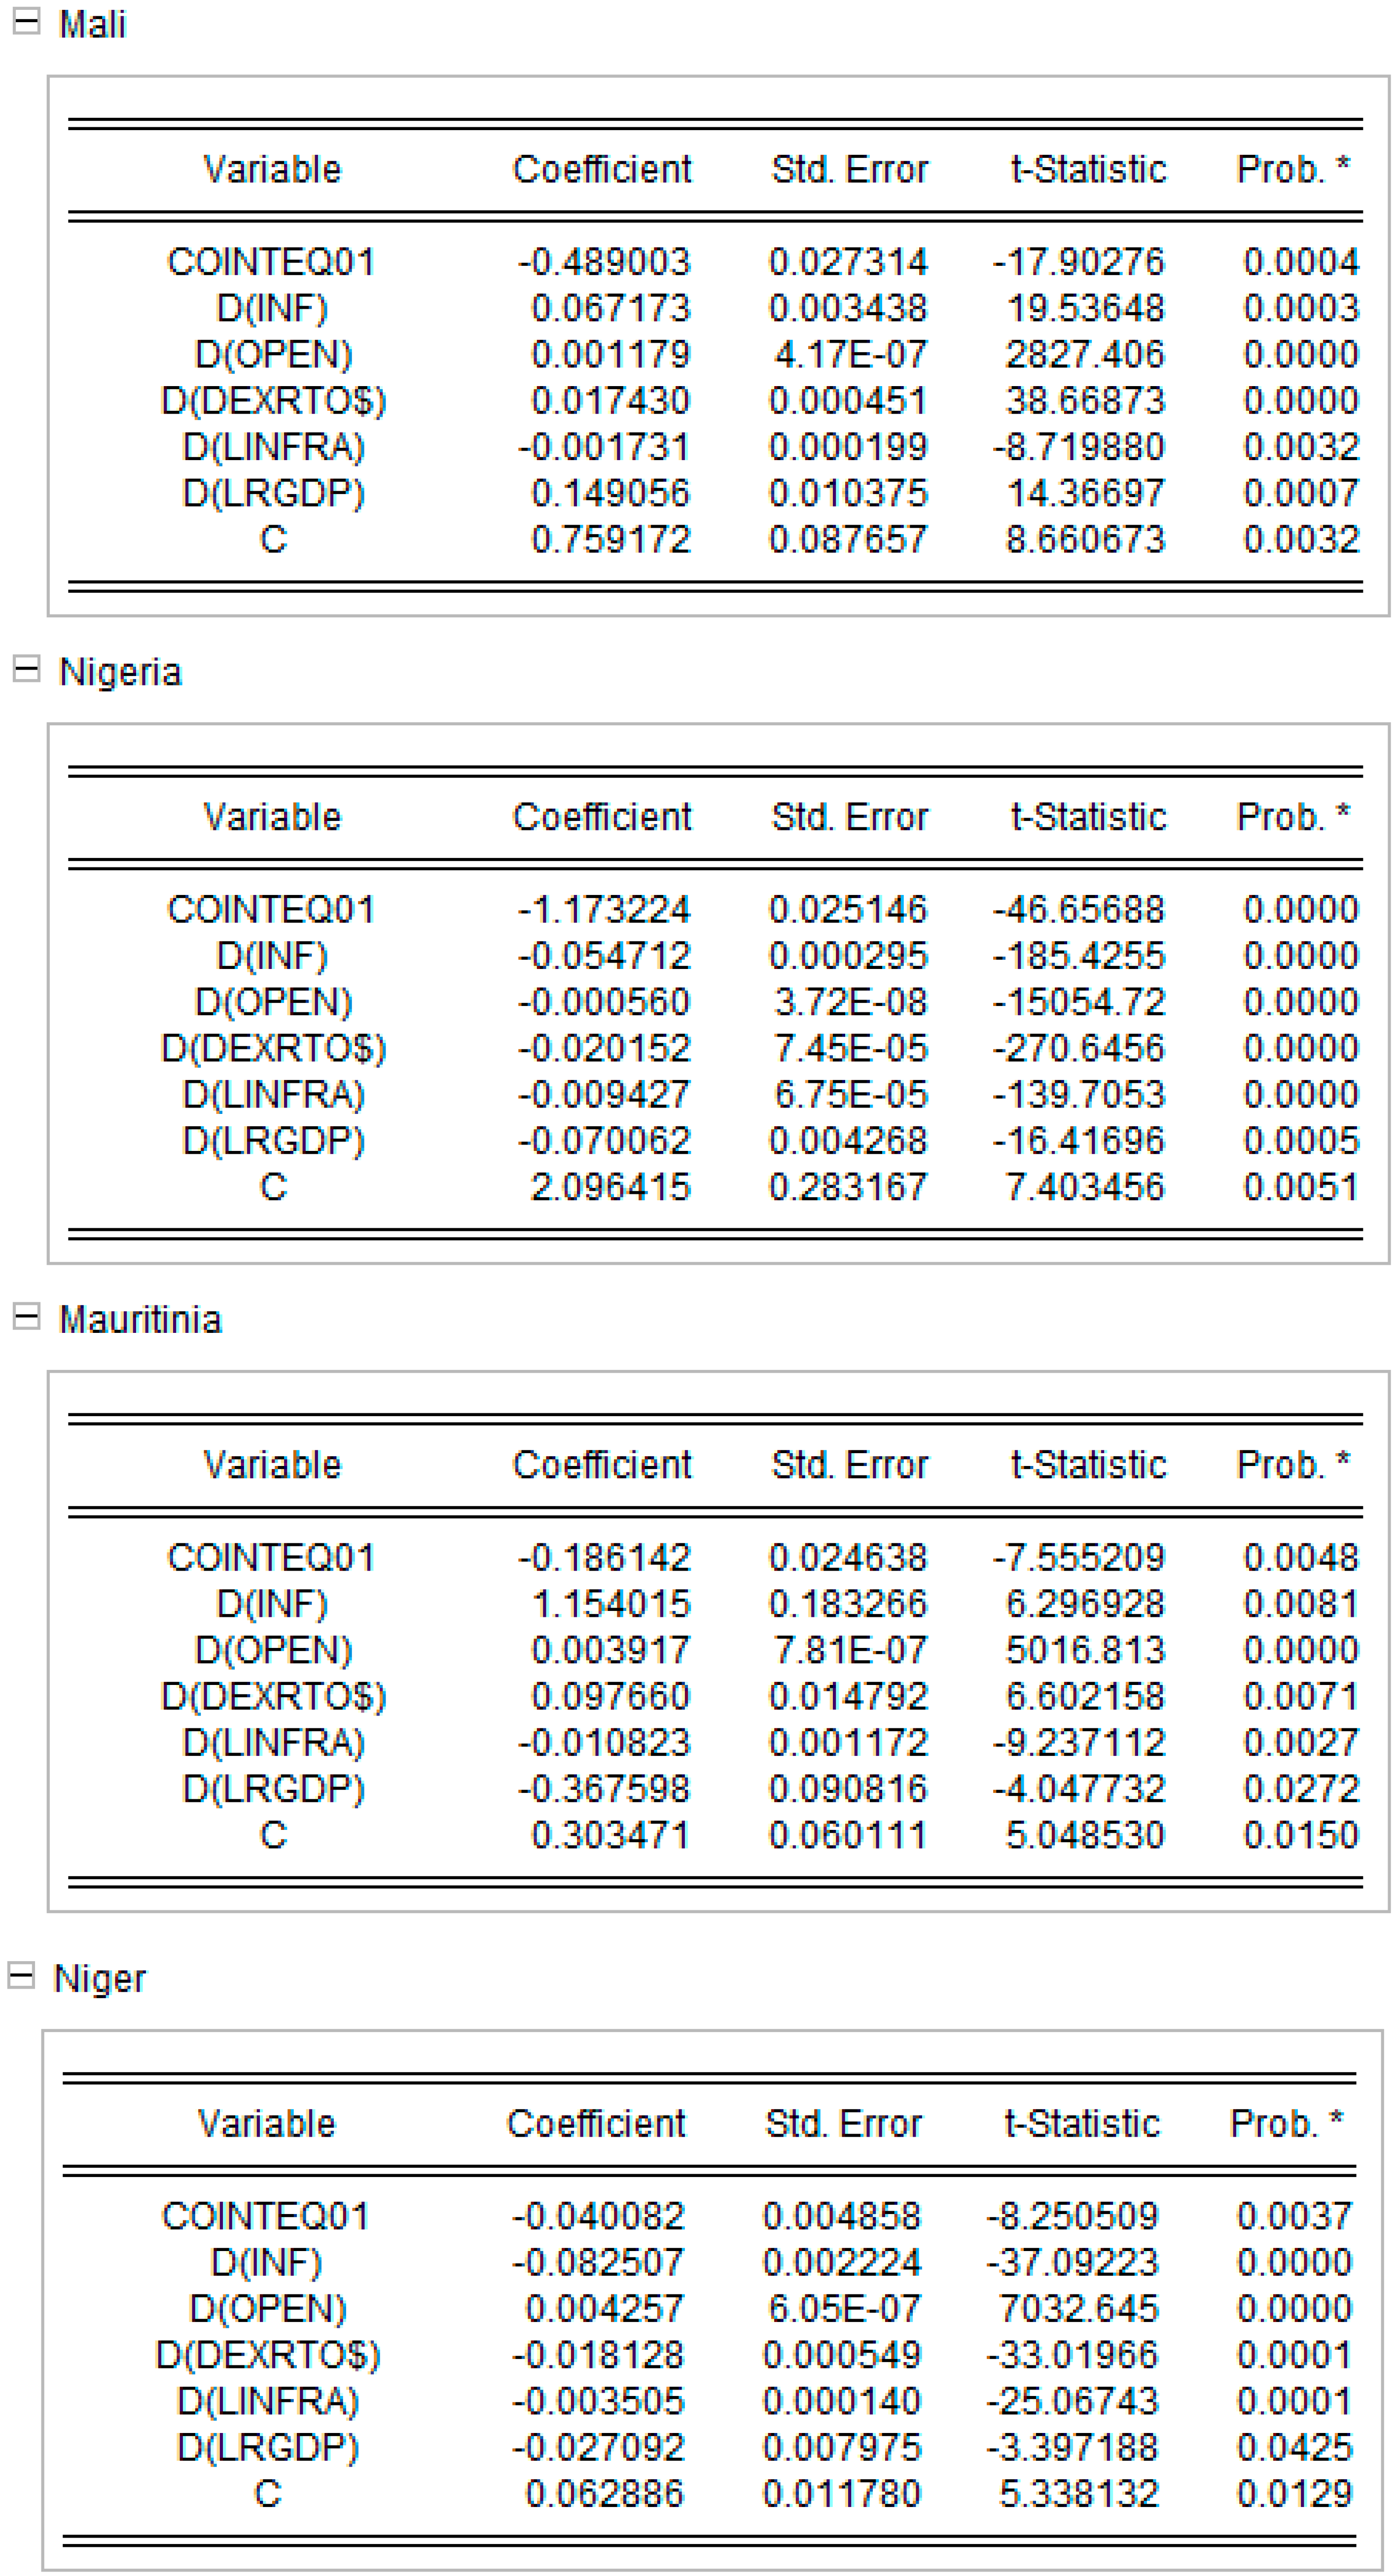
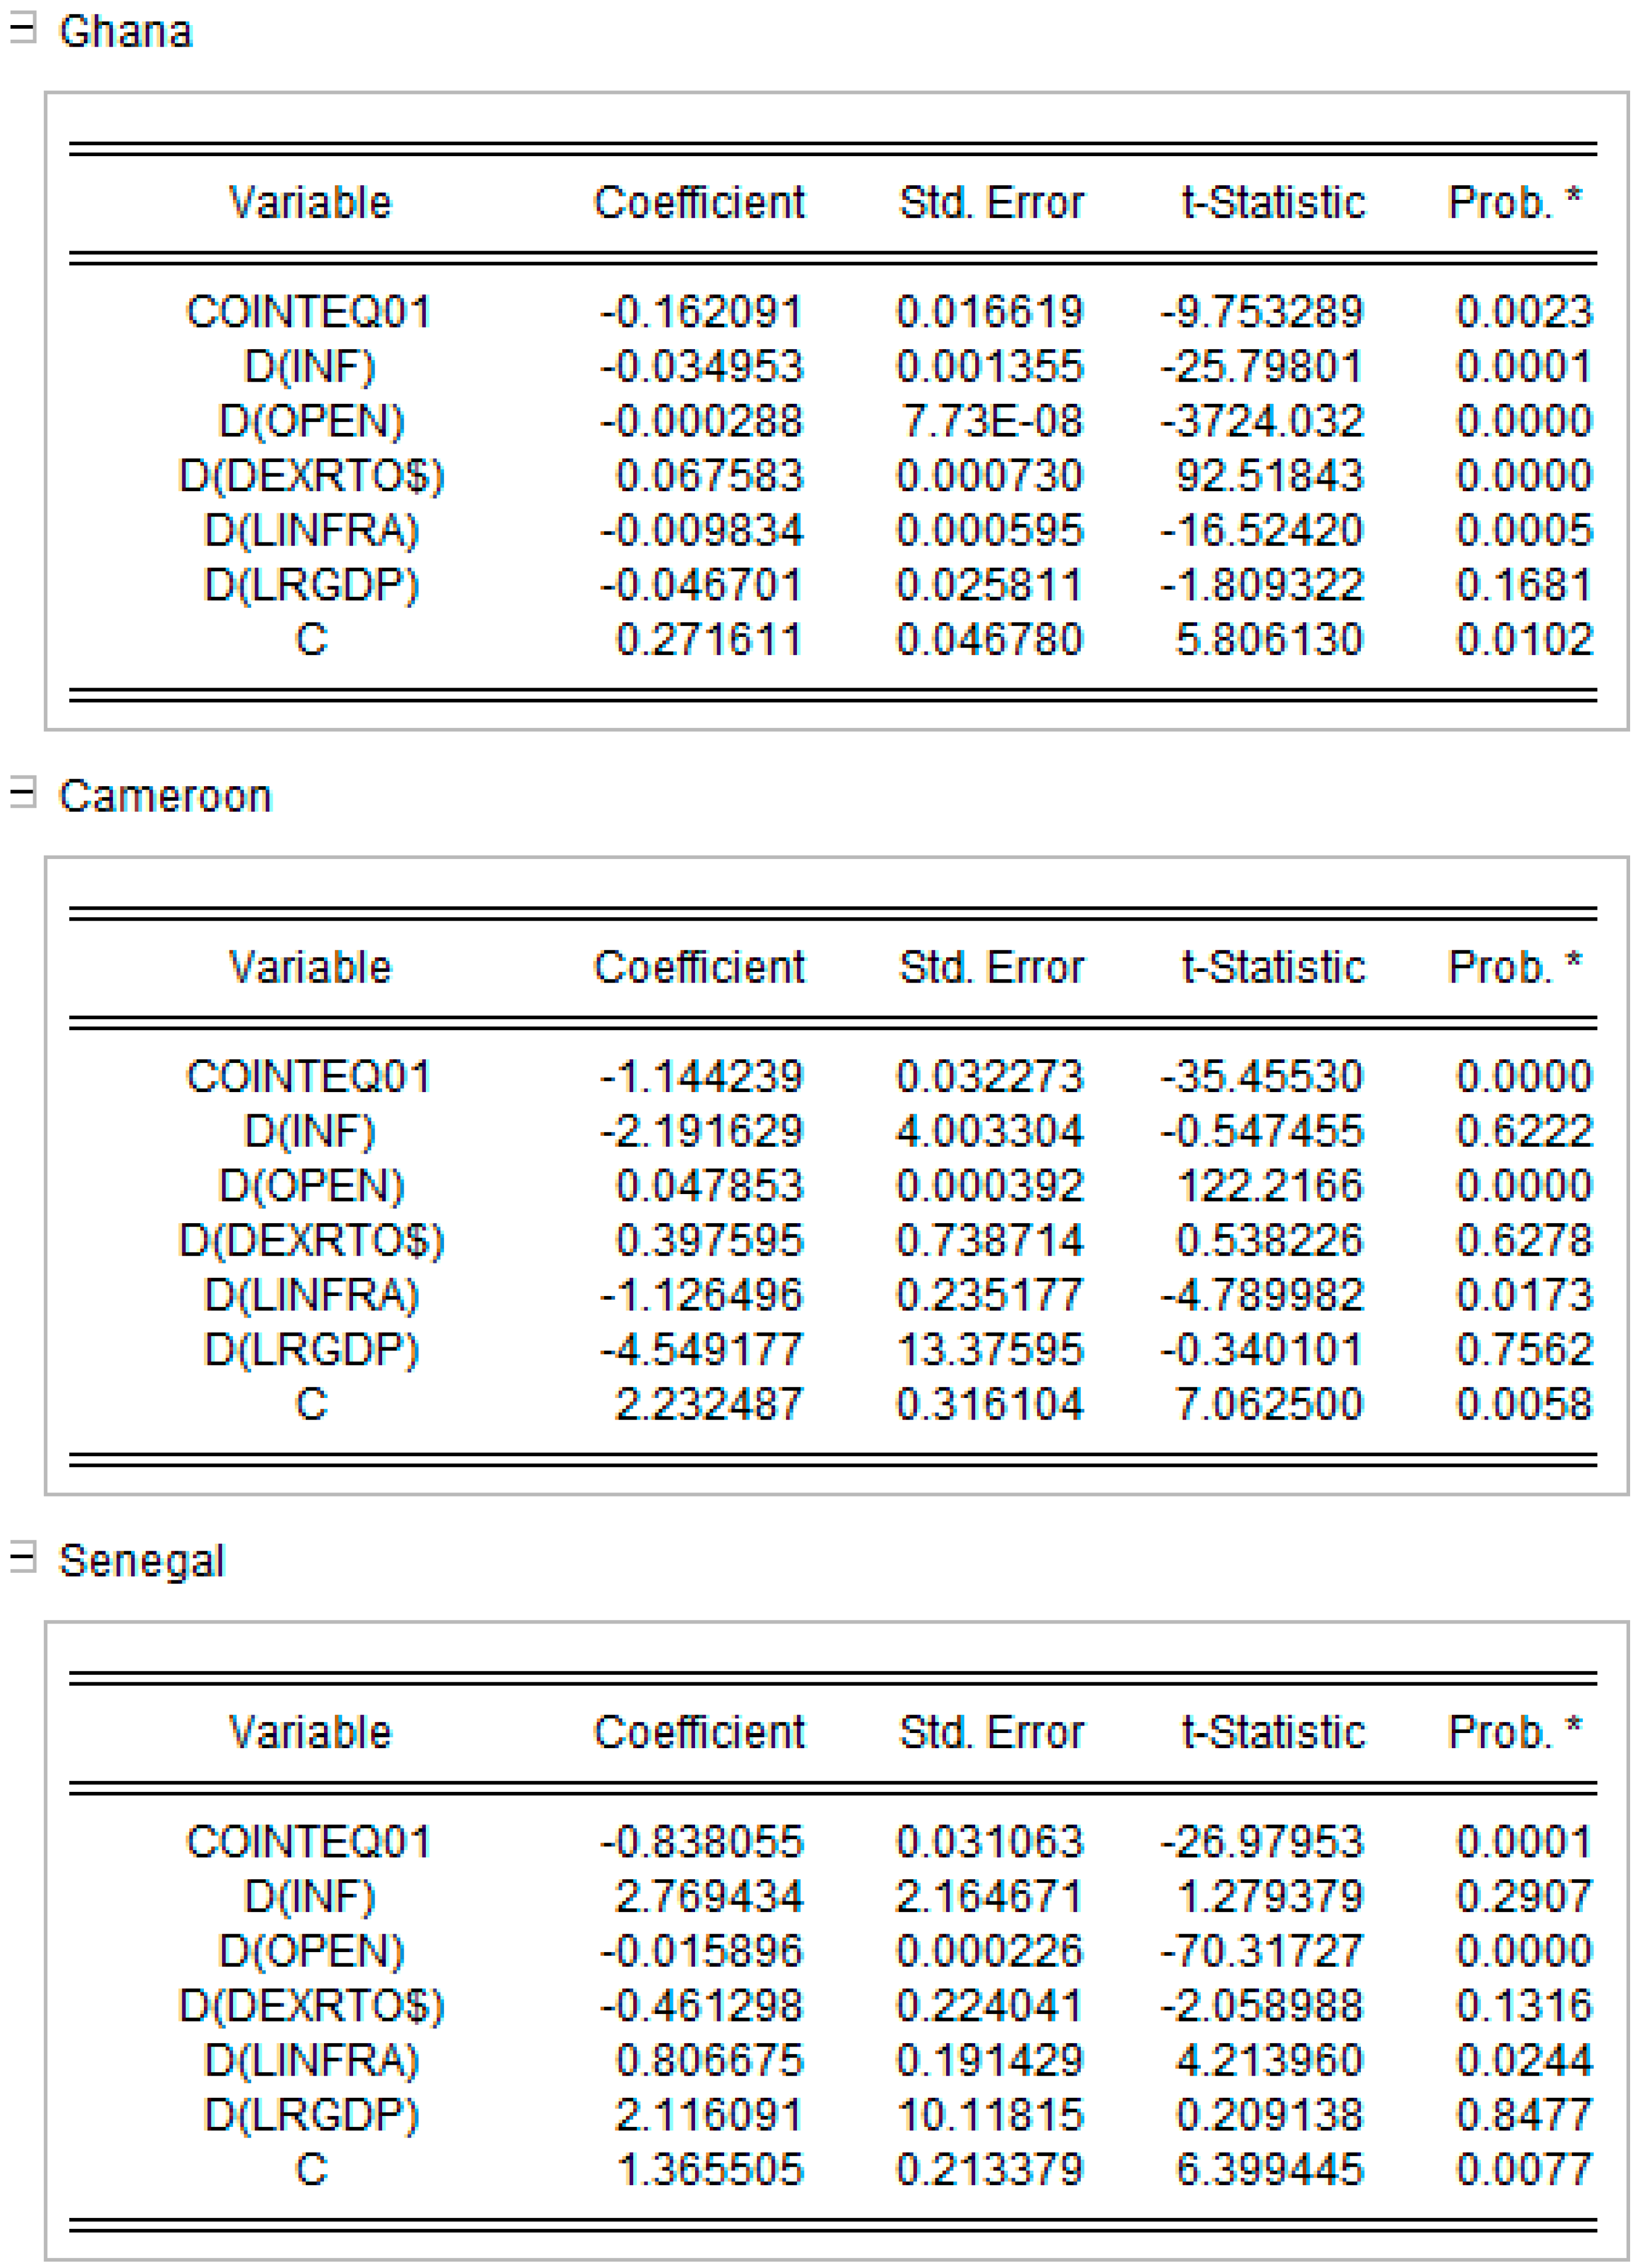
Appendix D. Short-Run Equations for Models 1 and 2. Source: Authors’ Work

Appendix D.1. Short Run equations for Model 1 Model 1

* probability of the null hypothesis being valid
Ijfs 07 00043 g003Ijfs 07 00043 g004Ijfs 07 00043 g005

Appendix D.2. Short Run equations for Model 2 Model 2

* probability of the null hypothesis being valid
Ijfs 07 00043 g006Ijfs 07 00043 g007Ijfs 07 00043 g008

References

  1. Abbott, Andrew, David Cushman, and Glauco De Vita. 2012. Exchange rate regimes and foreign direct investment flows to developing countries. Review of International Economics 20: 95–107. [Google Scholar] [CrossRef]
  2. Ang, James B. 2008. Determinants of foreign direct investment in Malaysia. Journal of Policy Modeling 30: 185–89. [Google Scholar] [CrossRef]
  3. Anyadike, N. O. 2012. Poor Infrastructure: The Hindrance to Foreign Investment and Economic Development in Nigeria. Interdisciplinary Journal of Contemporary Research in Business 4. [Google Scholar]
  4. Anyanwu, John. 2006. Promoting of investment in Africa. African Development Review 18: 42–71. [Google Scholar] [CrossRef]
  5. Anyanwu, John. 2011. Determinants of Foreign Direct Investment Inflows to Africa, 1980–2007. African Development Bank Group Working Paper. September, pp. 1–31. Available online: http://jds.sagepub.com/content/20/1-2/89.short%5Cnhttp://www.afdb.org/fileadmin/uploads/afdb/Documents/Publications/WORKING 136 Determinants of Foreign Direct Investment Inflows To Africa 1980-2007 AS.pdf (accessed on 1 August 2019).
  6. Asiedu, Elizabeth. 2002. On the Determinants of Foreign Direct Investment to Developing Countries: Is Africa Different? World Development 30: 107–19. [Google Scholar] [CrossRef]
  7. Azam, Muhammad, and Ling Lukman. 2010. Determinants of Foreign Direct Investment in India, Indonesia and Pakistan: A Quantitative Approach. Available online: https://www.researchgate.net/publication/273757902_ (accessed on 23 May 2019).
  8. Aydin, A. 2010. On the interaction between foreign direct investment inflows and international trade: Complementary or substitution? a case study of turkey. International Research Journal of Finance and Economics 48: 130–43. [Google Scholar]
  9. Babatunde, Abimbola. 2011. Trade Openness, Infrastructure, FDI and Growth in Sub-Saharan African Countries. Journal of Management Policy and Practice 12: 27–36. [Google Scholar]
  10. Bakar, Norazamin, Siti Hadijah Che Mat, and Mukaramah Harun. 2012. The Impact of Infrastructure on Foreign Direct Investment: The Case of Malaysia. Procedia Social and Behavioral Sciences 65: 205–11. [Google Scholar] [CrossRef]
  11. Becker, Johannes, Clemens Fuest, and Nadine Ridel. 2012. Corporate tax effects on the quality and quantity of FDI. European Economic Review 56: 1495–511. [Google Scholar] [CrossRef]
  12. Behname, Mehdi. 2012. Foreign Direct Investment and Economic Growth: Evidence from Southern. Asia Atlantic Review of Economics 2. Available online: http://www.unagaliciamoderna.com/eawp/coldata/uplo... irect_Investment.pdf (accessed on 24 February 2019).
  13. Callen, Timothy. 2008. Back to Basics. What Is Gross Domestic Product? Finance & Development. Available online: http://www.imf.org/external/pubs/ft/fandd/2008/12/pdf/basics.pdf (accessed on 23 February 2019).
  14. Chakrabarti, Avik. 2001. The Determinants of Foreign Direct Investments: Sensitivity Analyses of Cross-Country Regressions. Kyklos 54: 89–114. Available online: http://doi.wiley.com/10.1111/1467-6435.00142 (accessed on 20 January 2019). [CrossRef]
  15. Chakrabarti, Rajesh, Krishnamurthy Subramanian, Sesha Meka, and Kuntluru Sudershan. 2012. Infrastructure and FDI: Evidence from District-Level Data in India. Available online: https://www.isb.edu/faculty/KrishnamurthySubramanian/Images/FDI_infra_20Mar2012_ReStud.pdf (accessed on 15 March 2019).
  16. Chong, Lee-Lee, and BH Tan. 2008. Exchange rate risk and macroeconomic fundamentals: Evidence from four neighbouring southeast Asian economies. International Research Journal of Finance and Economics 16: 88–95. [Google Scholar]
  17. Culem, Claudy G. 1988. The locational determinants of direct investments among industrialized countries. European Economic Review 32: 885–904. [Google Scholar] [CrossRef]
  18. Cushman, David O. 1985. Real Exchange Rate Risk, Expectations, and the Level of Direct Investment. The Review of Economics and Statistics 67: 297–308. [Google Scholar] [CrossRef]
  19. Dunning, John H. 1977. Trade, Location of Economic Activity and the MNE: A Search for an Eclectic Approach. In The International Allocation of Economic Activity. London: Palgrave Macmillan. [Google Scholar]
  20. Dunning, John H. 1980. Towards an Eclectic Paradigm of International Production. Journal of International Business Studies 11: 1–3. [Google Scholar] [CrossRef]
  21. Dunning, John H. 1993. Multinational Enterprises and the Global Economy. Harlow: Addison Wesley Publishing Co. [Google Scholar]
  22. Edwards, Sebastian. 1990. Capital Flows, Foreign Direct Investment, and Debt-Equity Swaps in Developing Countries. NBER Working Paper No. 3497. Massachusetts Avenue, Cambridge, MA, USA: National Bureau of Economic Research. [Google Scholar]
  23. Essia, Uwem, and Joseph Onyema. 2012. Determinants of Foreign Direct Investment in Nigeria. Journal of Money, Investment and Banking. Available online: https://www.academia.edu/15419113/DETERMINANTS_OF_FOREIGN_DIRECT_INVESTMENT_IN_NIGERIA1 (accessed on 20 February 2019).
  24. Faroh, Alie, and Hongliang Shen. 2015. Impact of Interest Rates on Foreign Direct Investment: Case Study Sierra Leone Economy. International Journal of Business Management and Economic Research 6: 124–32. [Google Scholar]
  25. Fedderke, Johannes Wolfgang, and A. T. Romm. 2006. Growth impact and determinants of foreign direct investment into South Africa, 1956–2003. Economic Modelling 23: 738–60. [Google Scholar] [CrossRef]
  26. Feldstein, Martin. 2000. Aspects of Global Economic International Integration, Outlook for the Future. NBER Working Paper No. 7899. Massachusetts Avenue, Cambridge, MA, USA: National Bureau of Economic Research. [Google Scholar]
  27. Foellmi, Reto, Sandra Hanslin Grossmann, and Andreas Kohler. 2018. A dynamic North-South model of demand-induced product cycles. Journal of International Economics 110: 63–86. [Google Scholar] [CrossRef] [Green Version]
  28. Fung, K. C., Alicia Garcia-Herrero, Hitomi Izaka, and Alan Siu. 2005. Hard or Soft? Institutional Reforms and Infrastructure spending as Determinants of foreign direct investment in China. The Japanese Economic Review 56: 408–16. [Google Scholar] [CrossRef]
  29. Hakro, Nawaz A., and Abdallah Omezzine. 2011. FDI Flows and Governance in MENA. Countires. Middle Eastern Finance and Economics 12: 143–56. [Google Scholar]
  30. Hymer, S. 1972. Internationlization of Capital. Journal of Economic Issues 6: 91–111. [Google Scholar] [CrossRef]
  31. Hymer, Stephen H. 1976. The International Operations of National Firms: A Study of Direct Foreign Investment. Cambridge: MIT Press. [Google Scholar]
  32. IMF. 1993. Foreign Direct Investment Trends and Statistics: A Summary—IMF. Some Key Concepts and Definitions for the Recording of FDI. Available online: https://www.imf.org/External/np/sta/fdi/eng/2003/102803s1.pdf (accessed on 12 February 2019).
  33. IMF. n.d. IMF’s International Financial Statistics Base. Available online: http://data.imf.org/?sk=4C514D48-B6BA-49ED-8AB9-52B0C1A0179B (accessed on 15 January 2019).
  34. Jaspersen, Frederick. Z., Anthony. H. Aylward, and A. David Knox. 2000. Risk and Private Investment: Africa Compared with Other Developing Areas. In Investment and Risk in Africa. Studies on the African Economies. Edited by P. Collier and C. Pattillo. London: Palgrave Macmillan. [Google Scholar]
  35. Jones, Chris, and Yama Temouri. 2016. The determinants of tax haven FDI. Journal of World Business 51: 237–50. [Google Scholar] [CrossRef]
  36. Jordaan, Johannes Cornelius. 2004. Foreign Direct Investment and Neighbouring Influences. Unpublished Doctoral’s thesis, University of Pretoria, Pretoria, South Africa. Available online: https://repository.up.ac.za/bitstream/handle/2263/24008/Complete.pdf?sequence=4 (accessed on 20 March 2019).
  37. Kamath, G. B. 2008. Impact of foreign direct investment in India. The ICFAI University Journal of International Business 3: 16–38. [Google Scholar]
  38. Karkinsky, Tom, and Nadine Riedel. 2012. Corporate taxation and the choice of patent location within multinational firms. Journal of International Economics 88: 176–85. [Google Scholar] [CrossRef]
  39. Kosekahyaoglu, Levent. 2006. A comparative analysis of FDI in Turkey and the CEECS: Is there any link between Fdi and Trade? Journal of Business Economics and Management 7: 183–200. [Google Scholar] [CrossRef]
  40. Kravis, Irving B., and Robert Lipsey. 1982. The location of overseas production and production for export by U.S. multinational firms. Journal of International Economics 12: 201–23. [Google Scholar] [CrossRef]
  41. Kurecic, Petar, Goran Luburic, and Goran Kozina. 2015. The influence of the size of the economy and European integration on foreign direct investments in the Central, Southeastern and Eastern European states 1994–2013. Paper presented at 10th International Scientific Conference on Economic and Social Development, Miami, FL, USA, September 25. [Google Scholar]
  42. Lily, Jaratin, Kogid Mori, Mulok Dullah, Sang Liem Thien, and Rozilee Asid. 2014. Exchange Rate Movement and Foreign Direct Investment in Asean. Economies Economics Research International 2014: 320949. [Google Scholar] [CrossRef]
  43. Loungani, Prakash, and Assaf Razin. 2001. How beneficial is foreign direct investment for developing countries? Finance and Development 38: 6–9. [Google Scholar]
  44. Obiamaka, Egbo P., Josephat Onwumere, and Chigozie Okpara. 2011. Foreign direct investment and economic growth in Nigeria: A granger causality analysis. International Journal of Current Research 3: 225–32. [Google Scholar]
  45. Overseas Development Institute, London (UK). 1997. Foreign Direct Investment flows to low-income countries: A review of the evidence. Available online: https://www.odi.org/sites/odi.org.uk/files/odi-assets/publications-opinion-files/2626.pdf (accessed on 20 January 2019).
  46. OECD. 1990. OECD Benchmark Definition of Foreign Direct Investment. Available online: https://www.oecd.org/daf/inv/investment-policy/2090148.pdf (accessed on 12 February 2019).
  47. OECD. 2017. Local Content Policies in Minerals-Exporting Countries: The Case of Australia. Trade Policy Note (December). Available online: www.oecd.org/trade (accessed on 10 February 2019).
  48. Omankhanlen, Alex Ehimare. 2011. The Effect of Exchange Rate and Inflation on Foreign Direct Investment and its relationship with Economic Growth in Nigeria. Economics and Applied Information 1: 5–16. [Google Scholar]
  49. Pärletun, Jana. 2008. The Determinants of Foreign Direct Investment: A Regional Analysis with Focus on Belarus. Lund: Lund University, pp. 10–16. [Google Scholar]
  50. Rehman, Abdul, Muhammad Ilyas, Hassan Mobeen Alam, and Muhammad Akram. 2011. The Impact of Infrastructure on Foreign Direct Investment: The Case of Pakistan. International Journal of Business and Management 6. [Google Scholar] [CrossRef]
  51. Schmitz, Andrew, and Jurg Bieri. 1972. EEC tariffs and U.S. direct investment. European Economic Review 3: 259–70. [Google Scholar] [CrossRef]
  52. Schneider, Friedrich, and Bruno Frey. 1985. Economic and political determinants of foreign direct investment. World Development 13: 161–75. [Google Scholar] [CrossRef]
  53. Seetanah, Boopen. 2009. A Sector-Wise Panel Data Study on the Link between Transport Infrastructure and FDI in Mauritius. Paper presented at 9th Global Conference on Business & Economics, Cambridge, UK, October 17; ISBN 978-0-9742114-2-7. [Google Scholar]
  54. Sekkat, Khalid, and Marie-Ange Veganzones-Varoudakis. 2007. Openness, investment climate, and FDI in developing countries. Review of Development Economics 11: 607–20. [Google Scholar] [CrossRef]
  55. Siddiqui, Hira Aijaz Ahmed, and Visarach Aumeboonsuke. 2014. Role of Interest Rate in Attracting the Fdi: Study on Asean 5 Economy. International Journal of Technical Research and Applications 2: 59–70. [Google Scholar]
  56. Tsai, P. L. 1994. Determinants of Foreign Direct Investment and Its Impact on Economic Growth. Journal of Economic Development 19: 137–63. [Google Scholar]
  57. UNCTAD. 2018. World investment Report 2018. Available online: https://unctad.org/en/PublicationsLibrary/wir2018_en.pdf (accessed on 10 January 2019).
  58. Vernon, Raymond. 1966. International Investment and International Trade in the Product Cycle. The Quarterly Journal of Economics 80: 190. Available online: https://academic.oup.com/qje/article-lookup/doi/10.2307/1880689 (accessed on 12 January 2019).
  59. Wafure, Obida G., and Abu Nurudeen. 2010. Determinants of Foreign Direct Investment in Nigeria: An Empirical Analysis. Available online: https://www.researchgate.net/publication/265627570_ (accessed on 20 January 2019).
  60. Walsh, James P., and Jiangyan Yu. 2010. Determinants of Foreign Direct Investment: A Sectoral and Institutional Approach (July 2010). IMF Working Papers. pp. 1–27. Available online: https://ssrn.com/abstract=1662260 (accessed on 16 January 2019).
  61. Wheeler, David, and Ashoka Mody. 1992. International investment location decisions: The case of U.S. firms. Journal of International Economics 33: 57–76. [Google Scholar] [CrossRef]
  62. World Bank. n.d. World Bank’s World Leading Indicators base. Available online: https://data.worldbank.org/indicator (accessed on 15 January 2019).
  63. World Investment Report. 2007. Available online: https://unctad.org/en/Docs/wir2007_en.pdf (accessed on 21 March 2019).
  64. Xaypanya, Phonesavanh, Poomthan Rangkakulnuwat, and Sasaiwimon Warumsiri Paweenawat. 2015. The determinants of foreign direct investment in ASEAN: The first differencing panel data analysis. International Journal of Social Economics 42: 239–50. [Google Scholar] [CrossRef]
  65. Xing, Yuqing, and Guanghua Wan. 2006. Exchange Rates and Competition for FDI in Asia. The World Economy 29: 419–34. [Google Scholar] [CrossRef]
Figure 1. World net foreign direct investment (FDI) inflows: 1970–2017. y-axis: in current trillion US$. Source: https://data.worldbank.org/indicator/BX.KLT.DINV.WD.GD.ZS?view=chart.
Ijfs 07 00043 g001
Figure 2. FDI inflows 2015–2017 to regions and economies (USD $billion). Source: UNCTAD (FDI/MNE database: www.unctad.org/fdistatistics).
Ijfs 07 00043 g002
Table 1. Variables in the Models and Data Sources (Created by Authors) (World Bank n.d.) (IMF n.d.).
VariablesMeaningData Source
FDI/GDPNet Foreign Direct Investment/Gross Domestic ProductWorld Bank’s World Leading Indicators base
RGDPReal Gross Domestic Product (2010 base)World Bank’s World Leading Indicators base
RGNIPCGross National Income per capita (2011 base)World Bank’s World Leading Indicators base
INFRAFixed Line and Mobile subscriptions per 100 people World Bank’s World Leading Indicators base
EXRTO$Official Exchange Rate: local currency units per US$IMF’s International Financial Statistics base
INFInflation Rate based on Consumer Price IndexWorld Bank’s World Leading Indicators base
OPEN(Export+Import)/Gross Development ProductWorld Bank’s World Leading Indicators base
Table 2. Rankings of the mean for the various economies by variable (ascending order). Source: Authors’ work.
CountryFDI/GDPINFOPENDEXRTO$RGDPRGNIPCINFRA
Liberia98610113
Sierra Leone 7794232
Ivory Coast2518889
Mali4315544
Nigeria398110105
Mauritania 8679398
Niger6213421
Ghana510107967
Cameroon1412776
Senegal101166510
Table 3. Mean and standard deviation of the variables. Source: Authors’ work.
StatisticLRGNIPCLINFRALRGDPOPEN%INFDEXRTO$FDIGD
Mean7.587813.802023.298768.84720.06970.05030.0797
Median7.757914.054423.310960.46730.04560.02820.0277
Maximum8.617418.855726.8638311.35410.54720.76301.9144
Minimum5.80518.761220.989820.7225−0.0812−0.1992−1.2801
Std. Dev.0.56462.57961.369537.59450.08890.12760.2596
Observations240240240240240240240
Table 4. Correlation between the independent variables. Source: Authors’ work.
VariableLRGNIPCLINFRALRGDPOPENINFDEXRTO$
LRGNIPC10.4063120.679295−0.265510.115050.073887
LINFRA0.40631210.5379310.011979−0.07277−0.13281
LRGDP0.6792950.5379311−0.415890.2771420.101042
OPEN−0.265510.011979−0.4158910.021052−0.04142
INF0.11505−0.072770.2771420.02105210.472181
DEXRTO$0.073887−0.132810.101042−0.041420.4721811
Table 5. Summary of Auto-Regressive Distributed Lag (ARDL) models estimated with FDI/Gross Domestic Product (GDP) as the dependent variable. Source: Authors’ work.
Model 1Model 2
Dependent Variable: D(FDIGDP)
Method: ARDL
Sample: 2003 2017
Included observations: 230
Dependent lags: 1 (Fixed)
Dynamic regressors (1 lag, fixed)
Fixed regressors: C
VariableCoefficientProb *.CoefficientProb *.
Long Run EquationLong Run Equation
INF0.11240.00030.06290.0000
OPEN0.00000.92060.00020.4243
DEXRTO$0.04800.13080.01310.3192
LINFRA0.03210.00000.01140.0001
LRGNIPC−0.25900.0000
LRGDP −0.07460.0000
Short Run EquationShort Run Equation
COINTEQ01−0.41080.0032−0.50660.0002
D(INF)−0.24940.65920.03360.9369
D(OPEN)0.00490.34020.00470.3641
D(DEXRTO$)−0.04260.7188−0.11880.4007
D(LINFRA)−0.04520.7606−0.03570.8071
D(LRGNIPC)−0.51050.3856
D(LRGDP) −0.35980.4909
C0.68250.00520.87370.0007
Mean dependent variable0.0029 0.0029
S.E. of regression0.2316 0.2363
Sum squared residuals8.8525 9.2124
Log likelihood437.0997 437.5212
S.D. dependent variable0.3269 0.3269
Akaike info criterion−3.0175 −3.0210
Schwarz criterion−1.9298 −1.9333
Hannan−Quinn criterion−2.5792 −2.5827
* Probability of the null hypothesis being valid.
Table 6. Summary of long- and short-run effects in various economies in Models (1) and (2). Source: Authors’ work.
Long Run Causality *Short Run Significance *M1M2
CountryM1 **M2 **D(INF)D(OPEN)D(EXRTO$)D(INFRA)D(LRGNIPC)D(LRGDP)
Liberiayesyes
Sierra Leone noyes++ ++
Ivory Coastnoyes+++++
Malinoyes++++++++
Nigeriayesyes+
Mauritania yesyes++++++
Nigeryesyes++
Ghanayesyes+++
Cameroonyesyes ++
Senegalyesyes ++
* significant at the 5% levels; +/− stands for sign of significant coefficients; ** Model 1 (M1): Model 1: +inf, +linfra, −lrgnic; ** Model 2 (M2): Model 1: +inf, +linfra, −lrgdp.

