1. Introduction
Banks have indispensable roles in supporting the economy of a country through their liquidity creation and risk transformation functions; however, previous studies have often focused on the latter function. Nevertheless, liquidity creation has attracted significant research attention over the past decade after
Berger and Bouwman (
2009) introduced a new approach for assessing the liquidity creation efficiency of banks.
According to the liquidity creation theory, banks finance their illiquid assets with liquid liabilities to create liquidity for their customers (
Bryant 1980;
Diamond and Dybvig 1983). These institutions also conduct off-balance sheet activities, such as loan commitments (
Holmström and Tirole 1998;
Kashyap et al. 2002), to create liquidity. In other words, banks hold illiquid items to provide cash for the non-bank public.
The Syrian economy was affected during wartime, but recently, the banking sector has begun to recover and record high profits. The expansion and growth of banking assets are the most critical indicators of the speed of prosperity and recovery in the banking sector. Despite the crisis, the assets of private banks in Syria increased in 2016, with an increased rate of 48.8% in 2015 and 224% in 2010. Private Banks as a whole achieved about 131 billion Syrian pounds (SYP) in profits in 2016 compared to about 79 billion SYP in 2015. Bank earnings rose by 65% in one year and 748% in three years.
This study measures the amount of liquidity that Syrian commercial banks created between 2004 and 2016 and examines the effect of liquidity creation on bank profitability.
Although Syria is a relatively small country and the private banking sector is still maturing compared to other countries, this study contributes to existing literature in different ways. First, this study is the first to measure the liquidity creation and test its effects on the bank performance in Syria. Second, the Syrian banking sector has been operating in wartime since 2011 and liquidity creation under such extreme circumstances has never been studied. Thus, this study is expected to expand the previous literature on liquidity creation with the unique situation of Syrian banks.
The remainder of this paper is organized as follows:
Section 2 shows the status of the Syrian banking sector;
Section 3 reviews the literature;
Section 4 presents the data and methodology employed in the analyses;
Section 5 and
Section 6 describe the empirical results and the outcomes of the robustness check, respectively; and
Section 7 provides a summary of conclusions.
2. The Syrian Banking Sector
In Syria, before 2000, the entire banking sector was under the control of the public sector. However, 2001 witnessed a remarkable development through the issuance of Law No. 28, which allowed private banks to operate in the country. Aside from the state-owned commercial banks, Syria currently has 14 private banks, including three Islamic banks.
Table 1 lists the commercial banks operating in Syria and their total assets as of 31 December 2016.
Over the past few years, the Middle East and North African regions have witnessed major conflicts, perhaps more intense than anywhere else in the world. These conflicts have caused devastating human and economic losses and the destruction of the infrastructure of many countries. The region is facing an unprecedented challenge, especially with the emergence of militant and non-governmental groups. These conflicts have created the biggest crisis in the Middle East: the refugee crisis; the largest since World War II.
In addition to the tragic loss of life and material destruction, the conflicts have led to a deep recession, an unprecedented rise in inflation and a collapse in the financial situation. The institutions of these countries have also been damaged, but the damage varies between countries. It has moved to neighboring countries such as Lebanon, Turkey, and other parts of Europe.
Syria is one of the devastated countries, where the war has been on-going for eight years. The World Bank published a report in July 2017 citing the losses of the Syrian economy during the first six years of war.
According to the latest statistics, half of the infrastructure and more than a third of the housing in most Syrian cities have been destroyed and the displacement of more than half of the population inside and outside the country has caused the refugee crisis. The World Bank was unable to confirm material and economic losses accurately.
The Syrian economy has suffered a severe collapse in all economic, financial, and social indicators. Since the beginning of the war, the growth rate has been negative, the value of the Syrian pound has collapsed and inflation and unemployment have risen to record levels.
The Syrian banking sector, like all the other sectors, has been affected by the war. The ratio of bad debts increased as a result of the cessation of payments by customers, and decreased liquidity ratios caused the decline of deposits and the increase in withdrawals. This prompted banks to strengthen their liquidity ratios to face any expected drawbacks which reflected negatively on the efficiency of the use of available funds. Some banks’ branches were also robbed or vandalized in areas with armed conflict, which cost them additional losses. Some banks have also been forced to close their branches as a result of difficult access due to the security situation in some cities, especially in areas under the control of non-government groups.
Despite the current Syrian crisis and the physical damage suffered by some bank offices, they have decided to stay in the country in the long run. The financial reports of private banks listed on the Damascus Stock Exchange have indicated that these banks have continued to operate and have not stopped despite the crisis. The disclosures have also indicated that these banks have been expanding and increasing their assets.
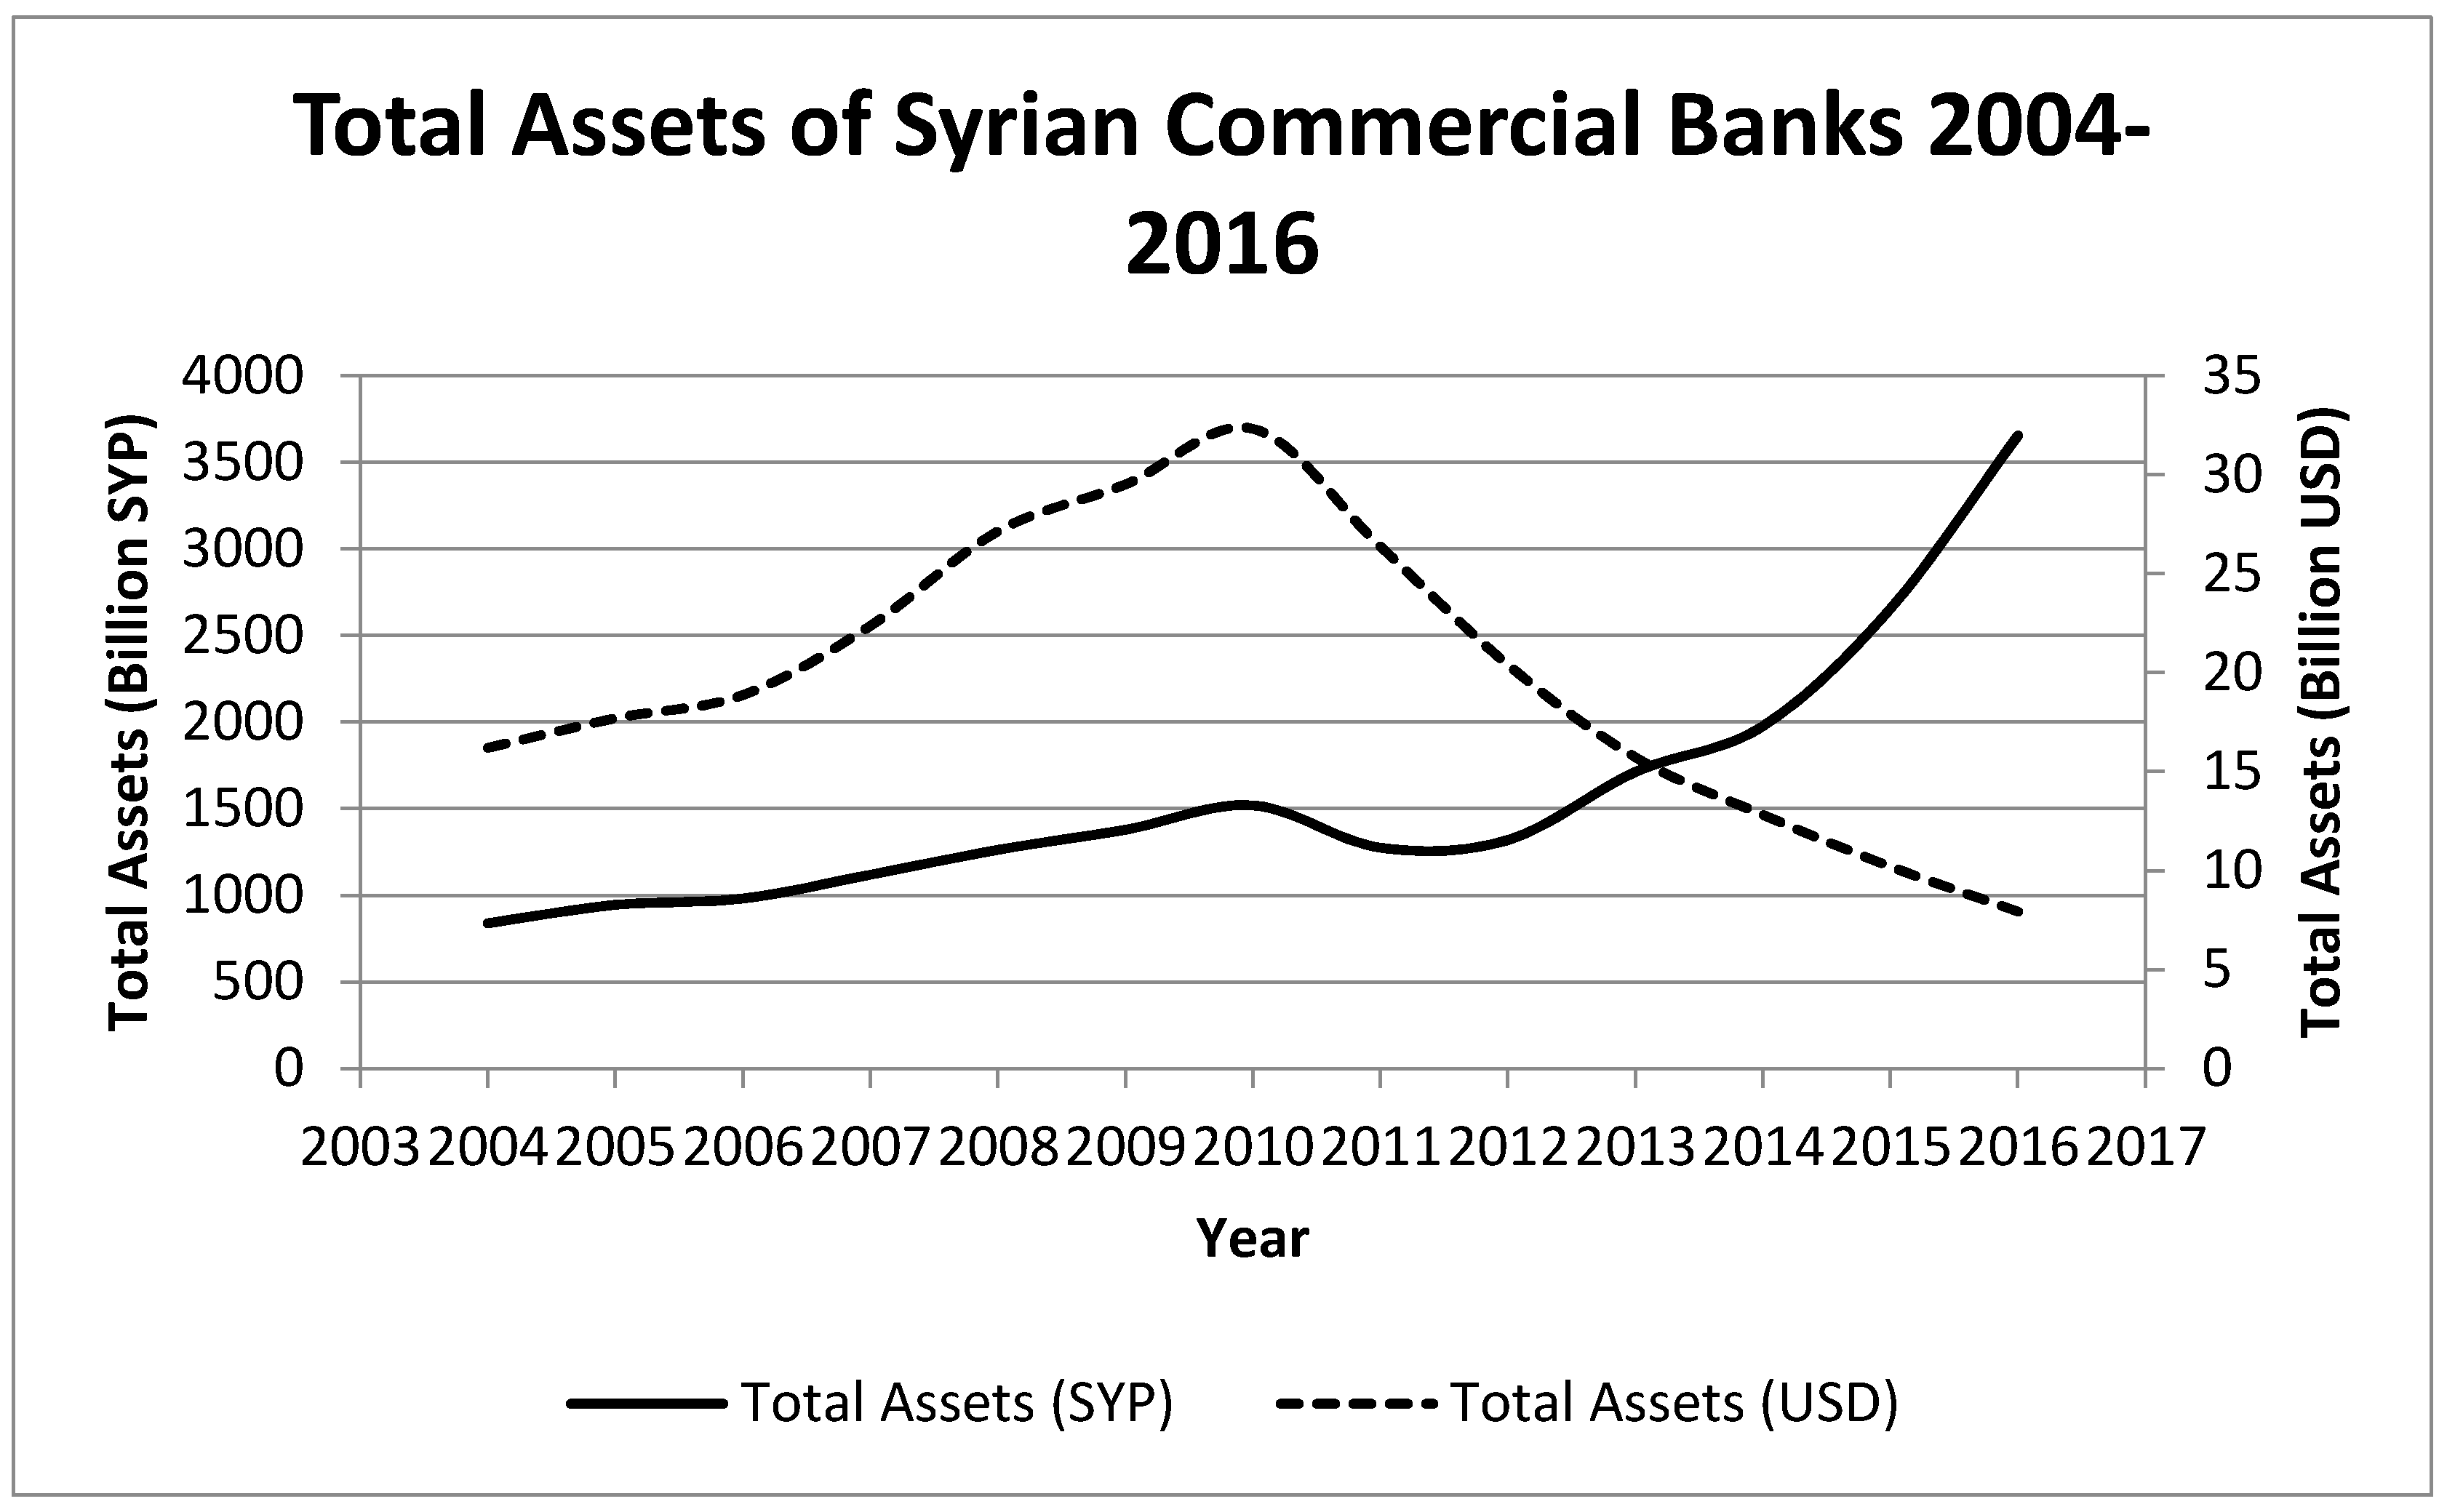
Figure 1 shows the evolution of the total assets of the banking sector in Syria between 2004 and 2016. The graph shows that the total assets of commercial banks have increased more than 4.35 times between 2004 and 2016; from 839,289 billion Syrian pounds in 2004 to 3.654 trillion Syrian pounds in 2016. Despite this increase, the real value of the total assets has lost more than 50% of its value in 2004 due to high inflation rates during wartime. It has fallen from 16.212 billion U.S. dollars in 2004 to 7.935 billion U.S. dollars in 2016.
3. Literature Review
According to the theory of liquidity creation, banks convert their liquid assets into illiquid liabilities or finance illiquid assets with liquid liabilities to create liquidity for their customers. These institutions also engage in off-balance sheet activities, such as loan commitments, to create liquidity (
Holmström and Tirole 1998;
Kashyap et al. 2002).
Granting long-term loans using customer deposits is another source of liquidity. In other words, liquidity creation is a result of the incompatibility between long-term (illiquid) assets and short-term (liquid) liabilities. Banks may also reduce their liquidity creation by increasing their cash balance through the issuance of long-term debts; however, these institutions do not create any liquidity when purchasing securities (liquid liabilities) by using customer deposits (liquid assets).
Berger and Bouwman (
2009) found the amount of liquidity created by U.S. banks increased annually between 1993 and 2003. They also revealed that banks create this liquidity through either on-balance or off-balance sheet activities. In this case, the role of off-balance sheet activities in creating liquidity is as vital as that of on-balance sheet activities.
Fungáčová and Weill (
2012) found that large banks are the most significant contributors to liquidity creation.
Steffen et al. (
2010) revealed that savings banks in Germany increased their liquidity creation from 120.7 billion euros in 1997 to 182.2 billion euros in 2006.
Lei and Song (
2013) found that the amount of liquidity created by Chinese banks increased from 22 billion RMB in 1988 to 2.463 trillion RMB in 1998 and 11.404 trillion RMB in 2008.
However, only a few studies have directly examined the relationship between liquidity creation and bank performance. For instance,
Berger and Bouwman (
2009) found that the creation of additional liquidity would increase the amount of net surpluses being shared amongst stakeholders and the non-banking public. In this way, liquidity creation has a positive influence on the value of banks. Meanwhile,
Bordeleau and Graham (
2010) found that banks could reduce their illiquid risk and probability of default by holding more liquid assets.
As a consequence, banks with a higher amount of liquid assets tend to face lower funding costs and higher net income. Following these arguments,
Tran et al. (
2016) showed that banks generally have low profitability if they have high liquidity creation and liquidity risk. However, in spite of these findings, the overall effect of liquidity creation on bank performance remains theoretically unknown.
Mohammad (
2014) used a sample of 58 Gulf Cooperation Council (GCC) countries’ banks from 1992 to 2011 and investigated and compared the amount of liquidity created by Islamic, conventional, and hybrid banks. The findings showed that Islamic banks created more liquidity than their conventional and hybrid counterparts with 12.66% of their total assets for Islamic banks compared with 3.26% for conventional banks and 3.95% for hybrid banks. (
Berger and Bouwman 2015) conducted a correlation analysis between normalized liquidity creation and bank profitability of U.S. banks over from 1984:Q1 to 2014:Q4. The analysis showed the relationship is positive for large banks but negative for medium and small banks.
Sahyouni and Wang (
2018) explored the amount of liquidity creation of BRICS and G7 (excluding the U.S.) countries’ banks spanning 2011 to 2015 and tested the effect of liquidity creation on the profitability of these banks. The results showed the banks included in the sample created 74.29 trillion USD during the sample period. The findings of the regression analysis indicated that liquidity creation significantly and negatively affected bank profitability of the entire sample (return on average assets and return on average equity), the emerging countries’ banks (return on average assets) and developed countries’ banks (return on average equity). However, the results showed that there is no effect of liquidity creation on the net interest margin (NIM) of these banks.
The review of the previous literature shows numerous research on liquidity creation has been done in the developed and emerging markets, but this is not the case in the context of undeveloped countries. The Syrian banking sector has been operating during wartime since 2011, which is a unique case has never been studied before. Thus, this study attempts to fill this gap by estimating the amount of bank liquidity creation in Syria as an undeveloped country and its relation to bank performance and also by examining the effect of the Syrian war on this relationship. This study is also expected to expand the previous literature on liquidity creation with the unique situation of Syrian banks.
4. Data and Methodology
4.1. Data
Syria has 20 banks; six state-owned banks (one of which is a commercial bank) and 14 private banks. The focus of this paper is only on the commercial banks; thus, the 5 state-owned non-commercial banks were excluded from the sample.
This study collected data from the annual reports of the banks and the Central Bank of Syria’s website, which contains a detailed financial statement of all Syrian listed banks. Macroeconomic variables and market power variables (Boone index) were obtained from the World Bank database and the data used in the
35th Bulletin (2017) published by the United Nations Economic and Social Commission for Western Asia (ESCWA) (
ESCWA 2017).
The final sample was obtained from an unbalanced panel data of 156 year-observations from 2004 to 2016. The period of this study was selected based on yearly data availability and to cover the periods before and during the Syrian war and allow a deeper understanding of the effects of the war on the factors affecting bank profitability, especially bank liquidity creation.
Table 2 lists the main regression variables and their descriptive statistics summary (number of observations, mean, and standard deviation).
4.2. Variables Selection
4.2.1. Measure of Liquidity Creation
Berger and Bouwman (
2009) classified balance sheet items (e.g., assets, liabilities and equity) and off-balance sheet activities into liquid, semi-liquid or illiquid, which were given different weights. Liquid assets and liquid liabilities were weighed at 1/2 because they contribute to the liquidity creation of the non-banking public. However, liquid assets, liquid liabilities, and equity were given a weight of −1/2 and all semi-liquid elements were given a zero weight. Moreover, the off-balance sheet elements were weighed in the same way as on-balance sheet items. Next, each item was multiplied by its weight to calculate the amount of liquidity created by each bank during the period.
Berger and Bouwman (
2009) suggested four different measurements for liquidity creation, depending on how the loans were classified and on whether it included or excluded off-balance sheet items. The first measure, called cat.fat, is based on the classification of loans by category and inclusion of off-balance sheet items. The second measure, called cat.nonfat, is based on the classification of loans by category and exclusion of off-balance sheet items. The third measure, called mat.fat, is based on the classification of loans by maturity and inclusion of off-balance sheet items. The fourth measure, called mat.nonfat, is based on the classification of loans by maturity and exclusion of off-balance sheet items.
This study is based on the first measure, cat.fat, which has been adopted widely in the literature because of its ability to classify loans according to their category and for its inclusion of off-balance sheet activities (
Berger and Bouwman 2009). Panel A of
Table 3 illustrates the classification and weighing of bank activities, whereas Panel B illustrates the calculation of cat.fat.
This study explores the amount and growth of banks’ liquidity creation and measures liquidity creation for all commercial banks operating in Syria between 2004 and 2016.
Table 4 provides the results for the amount of liquidity creation over the sample period.
The table shows the amount of liquidity destroyed by the Syrian commercial banks over the sample period is 951.7 billion SYP (approximately 7.33 billion USD), about 4.61% of the total banking sector assets. The commercial bank of Syria (CBS) is responsible for 807.43 billion SYP of this amount (84.84%). The Qatar National Bank Syria (QNBS) is the worst bank in terms of liquidity creation to total assets; its destroyed liquidity is equal to 65% of its total assets. However, Islamic banks are the biggest liquidity creators in Syria and the Syria International Islamic Bank (SIIB) is the biggest liquidity creator per asset with 21.35%.
Regarding bank type, it has been mentioned that CBS, the only state-owned commercial bank in Syria, is the biggest liquidity destroyer, destroying 84.84% of the total liquidity destroyed during the sample period. Private Banks are responsible for 144.26 billion SYP of liquidity destruction (15.16%). Moreover, the U.S. dollar figures show private banks create 3.92 billion USD of liquidity. This difference between the Syrian pound and the U.S. dollar is due to exchange rate fluctuations, especially during wartime.
Regarding the time period, Syrian banks destroyed liquidity during both sub-periods (before the war and during wartime) with 524.71 billion SYP and 426.98 billion SYP, respectively. Additionally, Syrian banks created 2.11 billion USD of liquidity during wartime.
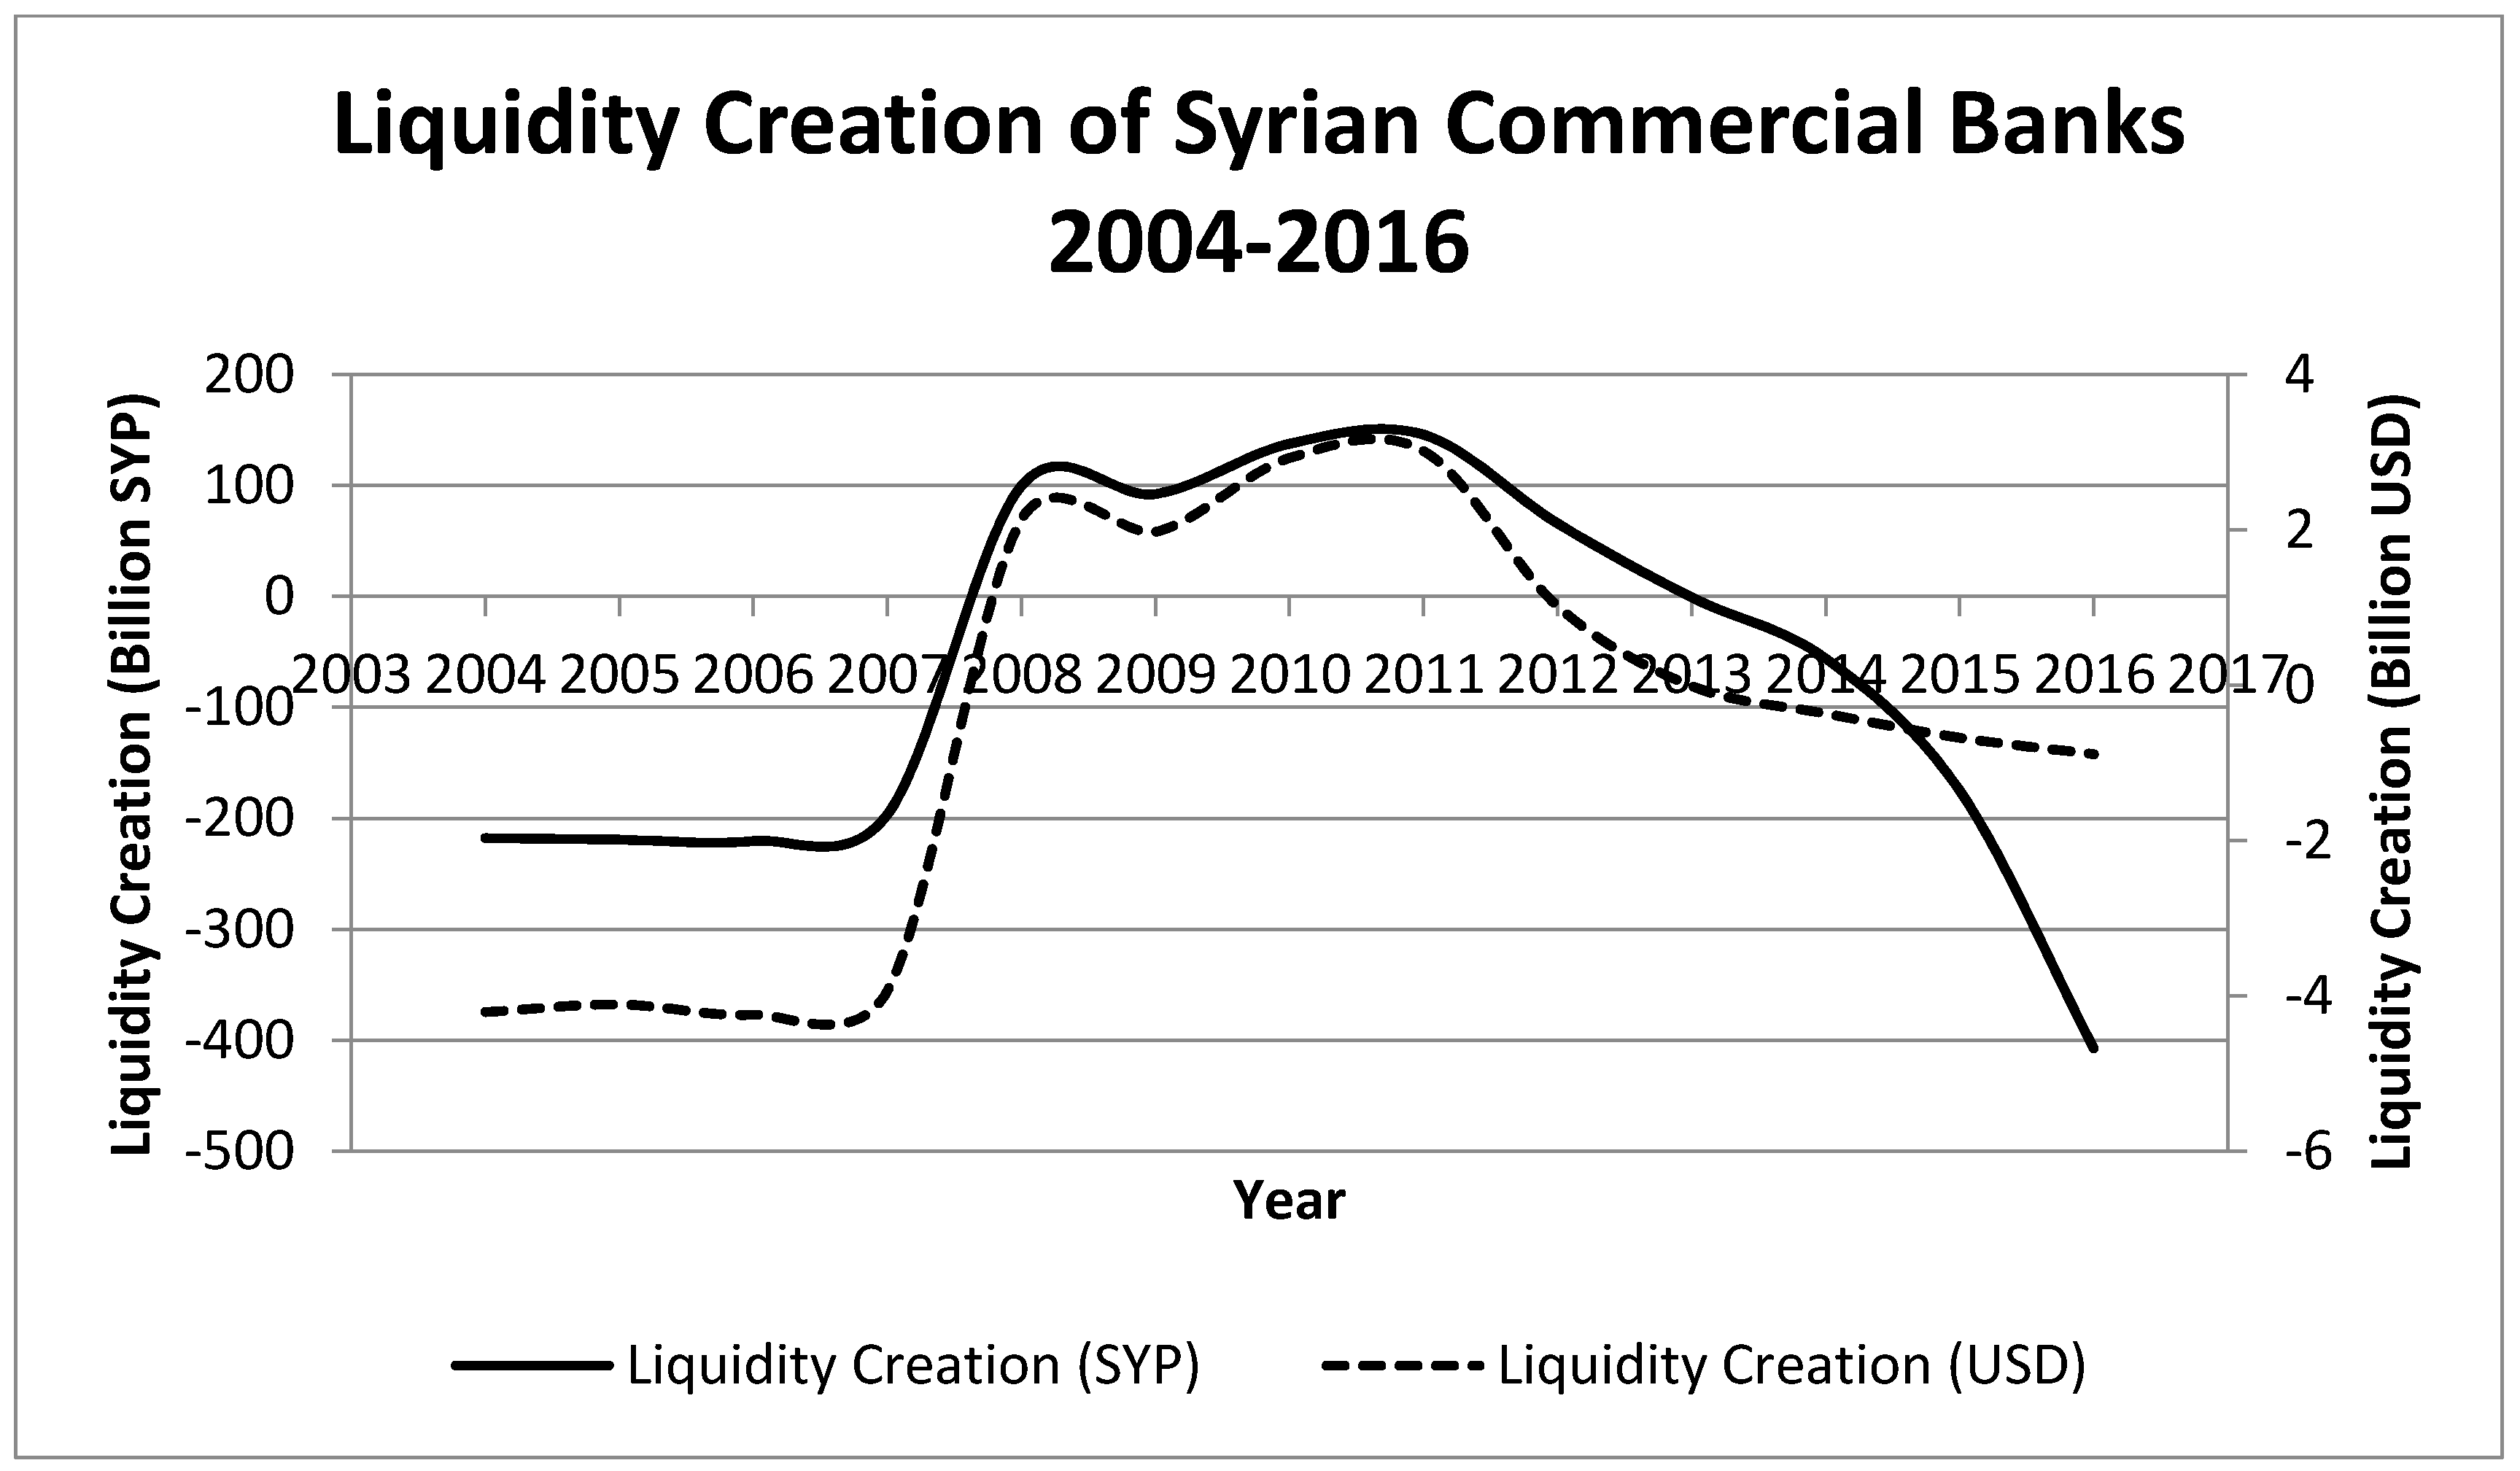
Figure 2 shows the liquidity creation of Syrian commercial banks over the sample years. The graph shows the liquidity created by Syrian banks fluctuated during that period, reaching its peak in 2012 with 145.895 billion SYP. The liquidity creation became negative (which meant Syrian banks destroyed liquidity) for the first time during the war in 2013 with −680.674 billion SYP. The figure also shows that in 2004, the only commercial bank in Syria (state-owned bank) was not creating liquidity for its customers but on the contrary, was destroying liquidity. After the entry of private banks into Syria and since 2008, the Syrian banking sector began to create liquidity for its clients, which continued until 2012. Since then, the Syrian war has affected the operations of these banks and their activities.
Later, because of the Syrian war, liquidity creation declined sharply and reached its lowest point during the sample period in 2016 with −407.282 billion SYP. Overall, the total amount of liquidity destroyed in Syria during the analysis period (2004–2016) was approximately −951.7 billion SYP (7.33 billion USD); about 4.61% of their total assets (in SYP) and 2.85% of their total assets (in USD).
4.2.2. Dependent Variable
The return on average assets (ROA) and return on average equity (ROE) are the chief accounting measures of bank profitability. The ROA is the ratio of after-tax profit over average total assets. The ROE is the return of after-tax profit over average total equity. The ROA indicates the ability of a bank’s management to generate profits from the bank’s assets. It shows the profits earned per dollar of assets as well as how effectively the bank’s assets were managed to generate revenues. The analysis of the ROE neglects financial leverage and the risk associated with it; therefore, the ROA and the ROE show how well the bank management uses the bank’s actual investment resources.
4.2.3. Control Variables
Capital:
Athanasoglou et al. (
2008) and
Iannotta et al. (
2007) used the ratio of equity to assets (capital ratio) as a measure of capital strength. Generally, they found banks with higher capital ratios were considered safer. The conventional risk-return hypothesis indicates a negative relationship between the equity to assets ratio and bank profitability. The same findings were also determined by (
Bourke 1989;
Goddard et al. 2004). However, a lower risk should increase a bank’s creditworthiness and reduce its funding cost. Moreover, banks with higher equity to assets ratio generally have a reduced need for external funding, which in turn sustains a positive influence on their profitability (
Ahokpossi 2013).
Tax: It is the ratio of total taxes over total assets and is expected to have a positive effect on bank profitability.
Market power: Market power is measured by the Boone Index (
Boone 2008) which is a measure of the level of competition based on profit-efficiency in the banking sector. It equals the elasticity of profits to marginal costs. An increase in the Boone index reveals decadence of the competitive conduct of these financial institutions. Data for this variable are obtained from the World Bank database. Bank-level Herfindahl–Hirschman index (HHI) is also used in this study as a market power indicator, which is equal to the sum of the squares of the market share of each bank as a percentage of all banks’ total assets for a specific year.
Flamini et al. (
2009) claimed that banks that have high market power could protect their profits even during bad macroeconomic conditions and they can control the operating costs and determine their revenue. However,
Ahokpossi (
2013) suggested a negative relationship. He noted that banks with high market power can reduce their price to eject other competitors.
GDP growth: considerable evidence has shown that the country-level macroeconomic and financial structure variables have a significant effect on bank profitability. A positive effect on a bank’s profitability is expected to occur, according to the literature in the field studying the relationship between economic growth and financial sector profitability (
Athanasoglou et al. 2008;
Demirgüç-Kunt and Huizinga 1999).
Inflation: Studies such as that by
Bourke (
1989) and
Molyneux and Thornton (
1992) have found a positive relationship between inflation and profitability. All the same, if inflation is not anticipated and banks do not adjust their interest rates correctly, costs may increase faster than revenues and affect bank profitability adversely. Thus, the overall effect is undetermined theoretically.
Policy interest rates: countries around the world have different policy interest rates. Usually, central banks use the policy interest rate to achieve expansive or contractive monetary policy. A rise in the interest rate is used normally to control inflation, currency depreciation, or extreme credit growth. Interest is the main nerve in the bank’s income and any change in it may affect the bank’s performance; thus, this study controls this interest rate in the regression equation.
For a summary of the definitions of dependent and explanatory variables, see
Table 2.
4.3. Methodology
This study aims to investigate the effect of liquidity creation on bank profitability for commercial banks in Syria and to test the effect of the Syrian war on this relationship. This study uses panel data analysis to achieve its objective (
Pasiouras and Kosmidou 2007;
Ahokpossi 2013).
This study runs a Hausman test where the null hypothesis is that the preferred model is random effects versus the alternative fixed effects. We reject the null hypothesis (Chi-square (8) = 102.46, p-value = 0.000 (<0.05)) which indicate that the fixed effect model is appropriate in this study.
Moreover, this study examines the null hypothesis of the Davidson–MacKinnon test of exogeneity (
Davidson and MacKinnon 1993), which states that ordinary least squares (OLS) regression is an appropriate and consistent estimator. We reject the null hypothesis at 5% significance level (F (1,125) = 5.153,
p-value = 0.0249 (<0.05)), which means liquidity creation is an endogenous regressor and an instrumental variable approach is required (OLS is insufficient).
The following equation is used to investigate empirically the effects of liquidity creation on bank performance:
where
BPit denotes the ROA or the ROE of
ith bank at time
t where
i = 1, …,
N and
t = 1,…,
T,
LIQCRit denotes liquidity creation divided by total assets and
Xi,t represents the control variables (bank size, capital, tax, market power, GDP growth, inflation, and policy interest rate).
5. Empirical Results
5.1. Correlation Matrix
Table 5 shows the correlation matrix between the dependent and independent variables and among the independent variables themselves. This table also provides the results of the variance inflation factor (VIF). The results show all the Pearson correlations are lower than 0.8, thereby suggesting there may not be a severe collinearity problem (
Hair et al. 1998). The VIF analysis also shows that the values of the VIF did not exceed 10, indicating that variables are said not to be highly collinear, leading to the same conclusion as that of the correlation matrix. (
Gujarati 2004)
5.2. Relationship between Liquidity Creation and Bank Profitability
This study applies a fixed-effect (within) IV regression for analysis.
Table 6 shows the results of the regression analysis where
LIQCR1 is used as the main independent variable. The results are reported for the ROA and ROE models.
The table shows the coefficients of liquidity creation are negative in both specifications but only statistically significant for the ROA model, thereby indicating that changing the level of liquidity creation adversely affects bank performance of Syrian commercial banks.
These results are in line with the expected bankruptcy cost hypothesis, which posits a negative correlation between the liquidity creation and profitability of banks. Liquidity creation can increase the level of illiquidity risks and subsequently reduce the profitability of banks and increase their probability of facing bankruptcy (
Tran et al. 2016).
Bank size is found to have a negative and significant effect on the ROE and a negative but insignificant effect on the ROA during the sample period. This finding confirms the findings of (
Dietrich and Wanzenried 2014) who conduct an inverse association between bank size and profits.
A tax shows a strong positive and significant effect in both the ROA and the ROE models. More taxes paid by banks are associated with more profits.
The coefficients of capital strength show banks with lower capitalization are more profitable than those with high capital ratios. These findings are consistent with the findings of (
Bordeleau and Graham 2010).
Market share indicators present a negative and significant effect on bank profitability in all specifications except in the HHI on the ROE, which is negative but statistically insignificant. Higher market competition can benefit banks to gain more profits.
Finally, all macroeconomic variables have no effect on bank profitability in both models.
5.3. Pre-War vs. Wartime Analysis
This section of the paper provides further analysis by dividing the sample period into two sub-periods (pre-war and wartime) to investigate banks’ profitability empirically and test the relationship between liquidity creation and bank profitability in each of the sub-periods.
Table 7 compares the mean value of bank profitability (both the ROA and the ROE) of both periods using a T-test. The table reveals the mean value of bank performance during wartime is statistically better than its pre-war counterpart. This result means the war does not have an inverse effect on the performance of banks. On the contrary, the banks improved their profits during wartime.
Table 8 presents the regression results on the relationship between liquidity creation and bank profitability during the pre-war and wartime periods separately.
During the pre-war period, liquidity creation had a positive effect on bank profits for both models, which means that additional liquidity created can increase bank profitability. However, the coefficients of liquidity creation are statistically insignificant in both specifications. Moreover, taxes (Boone index) are the only variable with an effect on the ROA (ROE) during the pre-war period; this effect is positive and statistically significant at the 1% significance level.
During wartime, the coefficients of liquidity creation changed their signs to negative, which indicate that changing the level of liquidity creation has an adverse effect on the performance of Syrian commercial banks. However, only the coefficient in the ROA model is statistically significant.
Regarding control variables, smaller banks are more profitable (statistically significant in the ROA model). The coefficients of capital strength show banks with higher capitalization are safer than those with low capital ratios and may face lower costs of funding because of their low potential bankruptcy costs. This result is supported by empirical evidence from
Bourke (
1989),
Demirgüç-Kunt and Huizinga (
1999); and
Berger and Bouwman (
2013). However, only the ROA specification shows a significant coefficient. Taxes show a positive effect on banks’ profits as it was during the pre-war period but with significant coefficients in both models.
The market share indicator measured by the Boone index presents a negative and significant effect on bank profitability in both specifications. Higher market competition can benefit banks in gaining more profits.
Unlike the pre-war period, the interest rate policy has a negative effect on the performance of banks during wartime and is significant in both models. Hence, the central bank’s policy of setting interest rates has a negative effect on the profitability of banks.
Finally, GDP growth and inflation variables have no effect on bank profitability in both periods and both models.
6. Robustness Test
This study conducts several robustness checks to confirm the findings mentioned earlier.
6.1. An Alternative Measure of Liquidity Creation
This study uses LIQCR1, which denotes liquidity creation (according to cat.fat) divided by total assets, as the primary independent variable in the principal analysis. By contrast, it uses LIQCR2, an alternative measure of liquidity creation that is computed by dividing liquidity creation (according to cat.nonfat) by total assets, as the main variable in the robustness test.
These results are shown in
Table 9 and suggest the main findings are robust to
LIQCR2 liquidity creation measure. The relationship between liquidity creation and bank profitability is negative and significant in the ROA model. The sign and significance level of the control variables also remained the same.
6.2. Excluding Islamic Banks
Islamic banks differ from conventional banks in that they operate under Islamic jurisprudence (Sharia) which prohibits the payment or receipt of interests (Riba), speculation, excessive risk-taking (Gharar), and financing of illicit sectors (e.g., alcohol, pork, drugs, and weapons). Islamic jurisprudence also forces Islamic banks to operate according to a profit and loss (risk) sharing principle, according to which “all transactions have to be backed by a real economic transaction that involves a tangible asset” (
Beck et al. 2013). These fundamental differences lead Islamic banks to have significantly different balance sheets from conventional banks; therefore, all observations of the three Islamic banks were excluded and only the regression for the traditional banks was rerun.
These results are shown in
Table 10 and are similar to our primary outcomes. The relationship between liquidity creation and bank profitability is negative and significant in the ROA model but is statistically insignificant in the ROE model. The sign and significance level of most of the control variables also remained the same.
6.3. Excluding CBS
In this robustness check, we exclude the observation of the CBS to confirm the main findings on the negative association between liquidity creation and bank performance. The reason behind this exclusion is that CBS is the largest bank in Syria with more than 60% market share in 2016 and the results of the regression could be driven by its observation; hence, excluding it to confirm the previous findings is logical.
These results are shown in
Table 11 and are similar to our primary outcomes. The relationship between liquidity creation and bank profitability is negative and significant in the ROA specification, and is statistically insignificant in the ROE model. However, the coefficients of some control variables lose their significance.
7. Conclusions
The theory of liquidity creation posits that, aside from transforming risks, banks also create liquidity as one of their most important functions. This study explores the liquidity creation of commercial banks in Syria between 2004 and 2016 and examines the relationship between liquidity creation and bank profitability of these financial institutions. This study is a pioneering one in that it examines the liquidity creation function of Syrian banks. The Syrian banking sector has been operating during wartime since 2011, which is a unique case that has not been studied before. Thus, this study is expected to expand previous literature on liquidity creation with the unique situation of Syrian banks.
The results show that Syrian commercial banks destroyed 951.7 billion SYP (7.33 billion USD), during the study period using the “cat fat” measure, which is equivalent to 4.61% of its total assets. The liquidity creation was negative in 2004, but the liquidity crisis began to decline as banks in Syria grew. Since 2008, banks have begun to create liquidity for their customers, but they have returned to liquidity destruction since 2014 after the extension of the war and its expansion to multiple areas in Syria.
The results of the regression analysis on the relationship between the liquidity creation and bank performance indicate the liquidity creation has a negative and significant effect on bank performance for the ROA model in the entire sample and during wartime. However, this relationship was statistically insignificant during the pre-war period.
The war observation supports the bankruptcy cost hypothesis, which posits the existence of a negative correlation between liquidity creation and profitability of banks. Liquidity creation can increase the level of illiquidity risk and subsequently reduce the profitability of banks and increase their probability of facing bankruptcy. The study performs many robustness checks and finds consistent results.
In summary, when making decisions, bank managers must reach a trade-off between the advantages and disadvantages of liquidity creation and consider the negative relationship between liquidity creation and bank performance.


