1. Introduction
According to Capital Market Theory, the Market Portfolio—made up of all the assets in the market—is the most mean-variance-efficient portfolio and investors make up their own portfolios, according to their appetite for risk, through investing more or less amounts in the Market Portfolio, with borrowing or lending. Such investment styles are known as passive. Real markets are not efficient, many imperfections exist, such as taxes, dealing charges; information is not simultaneously available to all participants, investors do not have homogeneous expectations and all assets are not equally scrutinised. Investment styles which exploit market imperfections and the opportunities therefrom, via mispriced assets, are classified as active, in contrast to the passive style.
Hedge funds have rapidly evolved as investment vehicles for active strategies, and are much sought after by investors, either for investment in themselves or as part of a portfolio. They were first created in 1949 and represent an alternative asset class that is closely related to mutual funds but exhibit some major differences. Hedge funds are not regulated as strictly as mutual funds which gives them the possibility to invest in traditional, as well as, alternative and more risky securities and derivatives. Furthermore, hedge funds are eligible for short-selling and leverage.
Another important characteristic of a hedge fund is that they generally invest in less liquid assets, compared to mutual funds. This can be done by generating “lockup periods” for investors. During these specified periods investors cannot redeem their investment. As a result of the specific characteristics and a high minimum investment (usually between US
$500,000 and US
$1million), access to hedge funds is limited to sophisticated investors, such as institutions or wealthy individual investors (
Barclay Hedge 2018b). Nowadays, hedge fund assets can vary from traditional products, such as equities, bonds, real estate to alternative assets, such as paintings, artefacts, antiques, and other exoticities.
The hedge fund industry has been growing rapidly—from only US
$118 billion in 1997 to over US
$3 trillion in 2016 (
Barclay Hedge 2018a). Many economies faced a crisis in 2007–2009, in the aftermath of the sub-prime mortgage market crash. Between 2007 and 2008, the beginning of the financial crisis, assets under management by hedge funds, worldwide, dropped by 25%, when many funds had to close (
Barclay Hedge 2018a). As hedging has the meaning of adopting a strategy to reduce risk, it becomes meaningful to analyse the performances of hedge funds, during and after the crisis.
The aim of this research is, thus, to gain a deeper understanding of the risk-adjusted performance of major hedge fund strategies in different market conditions and then to ascertain which risk frameworks are most reliable for evaluating performance. To the best of our knowledge, such a study covering the last ten years has not been published.
To achieve the aim of this research, a literature review is first conducted in
Section 2. The literature review covers a broad overview of hedge funds and their major strategies; this is followed by a summary of empirical research on hedge funds, a critical discussion of performance measurement models, persistence in performance, and alternative reward risk ratios. In
Section 3, the methodology, data accessed and other relevant issues to this research are described. In
Section 4, the, monthly performance data of ten major hedge fund strategies from 2007 to 2017 is analysed from various perspectives, with the S and P 500 as the market benchmark. Correlations of the different strategies with the entire market, and the results of Carhart’s four factor model are studied. Persistence in performance is tested statistically and the reward-risk characteristics of the various hedge fund strategies are analysed in different periods, within traditional and downside risk frameworks. The findings are also discussed in this section. Finally,
Section 5 concludes the paper and gives some ideas for further research on this topic.
2. Literature Review
2.1. Characteristics of Major Hedge Fund Strategies
A short definition of hedge funds and the main characteristics have been given in the introduction.
Travers (
2012) defines hedge funds as “an investment pool that can invest in physical securities and derivatives markets”. The most important and unique characteristic of hedge funds is the possibility to employ leverage and short selling, and their aim to generate absolute returns (
Travers 2012). Different hedge fund strategies use a different approach to reach the aim. The major strategies, as indicated by Credit Suisse’s Hedge Index database, will briefly be explained in the following.
2.1.1. Convertible Arbitrage
Convertible arbitrage strategies aim to generate profit on price discrepancies of convertible securities, such as callable bonds. A common way to do so is to build a long position on the convertible security and short the stock or option of the underlying company. The goal, usually, is to hold the number of shares that makes the combined position market neutral. This way it will not fluctuate with the price of the underlying stock and profits are solely based on the price discrepancy (
Credit Suisse 2018).
2.1.2. Emerging Markets
Emerging Markets strategies typically invest in the securities of emerging or developing countries, such as China, India, Latin America, Southeast Asia, parts of Eastern Europe, and parts of Africa. These countries are not yet developed, and managers believe they are able to find arbitrage opportunities in these markets (
Credit Suisse 2018).
2.1.3. Equity Market Neutral
Equity market neutral strategies invest long and short in equities and try to keep their exposure risk neutral (matching long and short for 0 beta). Other methods include keeping the portfolio dollar neutral or factor neutral. This way managers can exploit opportunities in a specific group of stocks, without risk exposure to the broad stock market (
Credit Suisse 2018).
2.1.4. Event Driven
Event driven strategies focus on special events, like mergers and acquisitions, liquidation, bankruptcy or spin-outs. The strategy can be divided into three sub-strategies: Distressed, Multi Strategy, and Risk-Arbitrage.
Distressed managers trade credit securities of below-investment-grade companies. They profit from the high yields of these securities, as they usually trade at discounts. For this strategy it is crucial to investigate all available securities, across a company’s capital structure, to identify the best risk/reward potential.
Multi Strategy event driven presents a mixture of event driven equity and credit strategies. Managers aim to take advantage of shifts in economic cycles by investing in different asset classes.
The event driven risk arbitrage strategies want to profit from the changing company value and spreads, related to mergers and acquisitions. The manager will typically buy shares of the company that is announced to be merged, and short sell shares of the corresponding acquirer in order to isolate the spread, while being market neutral (
Credit Suisse 2018).
2.1.5. Fixed Income Arbitrage
Fixed Income Arbitrage Managers aim to generate positive returns by identifying price anomalies in fixed income securities. They build up a long position in an undervalued security, while shorting a related overvalued one. A market neutral or interest rate neutral position could be created to reduce total volatility (
Credit Suisse 2018).
2.1.6. Global Macro
Global Macro strategies attempt to quickly react to changing market dynamics, to profit from the market movements. Managers employ top-down market analysis to exploit global market opportunities, by forecasting effects of political and macroeconomic trends. They go long if they expect bullish markets and short in bearish market conditions. Leverage is often applied to enhance the effect (
Credit Suisse 2018).
2.1.7. Long/Short Equity
In long/short equity strategies, managers try to exploit pricing inefficiencies, by investing long in undervalued equities and short in overvalued equities. The short portfolio can, therefore, be seen as a way to generate more returns or to hedge the long portfolio (
Travers 2012).
2.1.8. Managed Futures
Managed futures are often referred to as commodity trading advisors (CTAs). Investment decisions are made on global trends and historical price data. Managers can make use of many financial securities, such as equity, commodity futures or currency markets. A high degree of leverage can be applied (
Credit Suisse 2018).
2.1.9. Multi Strategy
Multi Strategy funds have the ability to diversify their capital, over several strategies. This leads to reduced volatility and smoothed returns. Managers aim to generate positive return, independent of directional movements in the markets (
Credit Suisse 2018).
2.2. Empirical Studies on Hedge Fund Performance
When public interest in hedge funds started to increase in the 1990s, more studies on hedge fund risk and return characteristics were published.
Fung and Hsieh (
1997), as well as
Schneeweis and Spurgin (
1997), focused on the correlation between hedge funds and standard asset classes. They observed a low correlation profile and concluded that alternative investments provide diversification and improve risk adjusted returns. Similar results are shown by
Brown et al. (
1999),
Liang (
1999), and
Do et al. (
2005), and more recently by
Jordao and De Moura (
2011), who analysed Brazilian hedge funds.
Amenc et al. (
2003) attribute the positive diversification effect to the various risk factors that hedge funds are exposed to.
Brown et al. (
1999) found that offshore hedge funds show a low correlation to U.S stock markets and show positive risk-adjusted returns. However, they attributed the positive returns to style effect rather than manager skills.
Ackermann et al. (
1999) compared risk adjusted performance of hedge funds and mutual funds and showed that hedge funds are able to consistently outperform mutual funds, but not the market indices. They also show that hedge funds are more risky than mutual funds and market indices. In contrast to that,
Liang and Kat (
2001), looking at data from 1990 to 1999, finds higher volatility in the market benchmark (S&P500) than in hedge funds. He attributes the lower volatility of hedge funds to the cross-style diversification. Consistent with other research,
Liang and Kat (
2001) concluded that hedge funds provide better risk-adjusted returns. However, this finding is challenged by later research conducted by
Amin and Kat (
2003). The authors’ results show that hedge funds improve the portfolios risk return profile, when mixed with the S and P 500, but fail to do so as a standalone investment.
Brown et al. (
2001) observed that hedge funds tend to decrease volatility, following good performance in the first half of the year and increase volatility, following bad performance.
Liang and Kat (
2001),
Capocci and Hübner (
2004),
Strömqvist (
2009),
Schaub and Schmid (
2013), had a closer look at hedge funds, during crises periods and financial distress.
Liang and Kat (
2001) showed that hedge funds were strongly affected by the economic crises in 1998 but concluded that this does not necessarily mean that hedge funds did not contribute as a trigger to the crisis. In case of the financial crisis in 2008,
Strömqvist (
2009) was unable to find any evidence of hedge funds having a greater impact on the crisis than other investors.
Schaub and Schmid (
2013) indicated that liquidity plays a crucial role in hedge fund performance, during crises periods. Their study showed that hedge funds with illiquid portfolios had lower returns and alphas, compared to hedge funds with more liquid portfolios, during crisis periods.
Capocci and Hübner (
2004) and
Stoforos et al. (
2016) analysed hedge fund performance during crises. Both concluded that hedge funds suffered from losses and could not reach their goal of higher absolute returns.
Capocci (
2002) identified Relative Value Arbitrage and Foreign Exchange as the only sub-strategies that benefited from the Asian crisis.
Do et al. (
2005) studied data on the Australian hedge fund market (2001–2003) and advised that hedge funds included as a part of a portfolio, improved returns, irrespective of strategy. A study by
Jordao and De Moura (
2011) on the Brazilian hedge fund industry found that hedge funds were not able to generate significant alphas, under conditions of high volatility and financial stress. Data on the research by
Boasson and Boasson (
2011) on US hedge funds (1972–2005) showed that hedge funds have significant correlations with the market (high for all strategies, except Global Macro and Fixed Income), although they concluded that investments in hedge funds offer the benefits of diversification.
Stoforos et al. (
2016) studied US hedge fund data on thirteen hedge fund strategies, for a period of 19 years (1995–2014), and found that the average dynamic correlations increased for hedge funds in crisis periods, a finding confirmed by Forbes and Rigobon (2002) and Guesmi et al. (2014). Their data also showed that dynamic correlation coefficients decreased significantly in the non-crisis period, only for Global Macro and Short Selling strategies. They concluded that most hedge fund strategies (with the exception of Global Macro and Short selling) were not able to outperform the S and P 500, during crisis periods and could, therefore, not protect their investors, like the S and P 500.
2.3. Performance Measurement Models
Measuring the performance of an investment is essential in evaluation. The Sharpe ratio (
Sharpe 1966), which measures the excess return over the risk-free rate in relation to total risk, is the most widely known performance measure (
Eling and Schuhmacher 2007). It is used by
Ackermann et al. (
1999),
Liang and Kat (
2001) and others, to measure hedge fund performance. However, since it assumes normally distributed returns and does not account for hedge funds’ special characteristics, it is criticised as an inadequate measurement for hedge fund performance (
Eling and Schuhmacher 2007;
Capocci 2002). This is also stated by Brooks and Kat (2002),
Amin and Kat (
2003), Mahdavi (2004) and Murguia and Umemoto (2004), on the basis that Hedge fund returns typically have asymmetric distributions.
To solve this issue,
Sortino and Price (
1994) developed the Sortino ratio, which divides the excess return on a portfolio, with respect to a minimum acceptable return (MAR), by a term called the downside deviation (deviation of returns below the MAR). Later on, Sortino,
Sortino et al. (
1999) developed the Upside Potential ratio, which divides the positive excess returns of the portfolio by the downside deviation. Sortino et al. (2001) claimed that the downside risk framework was able to overcome the problems in ranking skewed return distributions, and found that the Upside Potential ratio was a more accurate evaluator than the Sharpe ratio, particularly when the strategies included the use of options. Studies by
Rosenberg et al. (
2004), and
Scherer (
2004), found the Sortino ratio to be a superior performance ratio compared to the Sharpe ratio.
Chaudhary and Johnson (
2008) in a simulation study of skewed distributions, also found that the Sortino ratio is a superior performance measure to the Sharpe ratio.
To analyse fund performance, in terms of various attributes, factor models were created over time. The models can broadly be divided into two categories—linear multi factor models and non-linear multi factor models.
Linear multi factor models were created by
Sharpe (
1992),
Fama and French (
1993) and
Carhart (
1997). They identified several factors to explain performance and returns (
Capocci 2002).
Sharpe (
1992) implemented the asset class factor model that allows for style analysis. The model includes twelve asset classes and the degree of exposure to each asset class is used to explain the variation of returns in the specific period. Unfortunately, Sharpe’s model can only be applied to funds pursuing a long-only strategy, while many hedge fund strategies use short selling and leverage. In 1993, Fama and French built their three-factor model. It expanded the Capital Asset Pricing Model (CAPM) by considering size (small and large cap) and value (book to market ratio) factors.
Kothari and Warner (
2001) consented to the improvement of the CAPM, by including the new factors, however, they criticised the Fama and French model by pointing out that it detects abnormal results that do not exist. Building up on this,
Carhart (
1997) came up with a four-factor model. He included momentum, which made his model superior to the CAPM, as well as the Fama and French. Linear multi factor models are used to measure hedge fund performance in several studies, like
Schneeweis and Spurgin (
1999),
Capocci (
2002) or
Jordao and De Moura (
2011). Despite the application to hedge fund performance, the linear models are more suitable to evaluate traditional funds because they fail to capture hedge fund characteristics like time variation (
Stafylas et al. 2017). Furthermore,
Slavutskaya (
2013) concluded that linear factor models are not suitable for hedge funds as they lead to over-parameterisation, because many hedge funds have a life of three years.
Non-linear multi factor models include the asset factor model by
Fung and Hsieh (
1997,
2001) and models by
Agarwal and Naik (
2000) or
Huber and Kaiser (
2004).
Fung and Hsieh (
1997) extend the asset class factor model by
Sharpe (
1992) to make up for major hedge fund investment styles and consider hedge funds as option portfolios. In 2001, they used the trend-following strategy, to model hedge fund returns and demonstrated that the returns resemble lookback straddle returns.
Huber and Kaiser (
2004) arrived at the same conclusion.
Agarwal and Naik (
2000) introduced a general asset class factor model that is optimised for passive option-based strategies and buy-and-hold strategies.
Agarwal and Naik (
2004) later focussed on hedge funds that use these strategies and their risk exposure. Their findings suggest that hedge funds have a significant exposure to the Fama and French three-factor model and Carhart’s four-factor model. More recently,
Gregoriou et al. (
2016) analysed hedge funds’ returns and cross-sectional dispersion, using the
Fama and French (
1993) model, as well as
Fung and Hsieh (
1997,
2001) factors.
Although non-linear multifactor models can explain hedge fund returns in a more detailed way and account for special characteristics of hedge funds, they might not be best for investors’ performance evaluation. This is mainly due to the fact that exposures are not static and, therefore, need to be adjusted and that the models and factors are complicated to replicate (
Stafylas et al. 2017).
In another study,
Fung and Hsieh (
2004) attempted to model hedge fund returns in terms of seven asset-based style (ABS) factors—two equity ABS factors (market risk and the spread between small-cap stock returns and large-cap stock returns), two fixed income ABS factors (10-year treasury yields, change in the yield spread between 10-year T-bonds and Moody’s Baa bonds), and three trend-following ABS factors (portfolios of lookback straddles on bonds, on currencies and on commodities), as an alternative to other models. Although they report success with high R-squares, it could be argued that introduction of too many factors introduces an arbitrariness in the analysis, which might not be robust when market conditions change. Moreover, there may be other factors which have a higher explanatory power over short horizons and such factors can change with time, making it burdensome to identify them.
2.4. Persistence in Performance
Persistence in performance is a sought-after metric by Fund Managers and investors.
Brown et al. (
1999), using annual returns of offshore hedge funds, found virtually no persistence in their sample.
Agarwal and Naik (
2000) used a multi-period framework for evaluating persistence as a measure of evaluating manager skills, since fund managers might exhibit a different degree of persistence at different return horizons. They found maximum persistence at a quarterly horizon, indicating that persistence among hedge fund managers is short-term in nature. They also find that persistence, whenever present, is unrelated to the type of strategy (directional or non-directional) followed by the fund.
Boyson (
2003) finds that a portfolio of funds selected on past performance, alone, shows no persistence, but a portfolio that is long low-tenure/past good performers and short high-tenure/past poor performers, displays a quarterly persistence. Consistently poor performance among high-tenure/past poor performers drives this finding.
Capocci (
2002), on the other hand, concluded that there is no evidence of persistence in low performing and high performing hedge funds, but limited evidence of persistence for medium performing funds.
Baquero et al. (
2005) find positive persistence in hedge fund returns at the quarterly level, after correcting for investment style, however, with weak statistical significance.
Manser and Schmid (
2009) studying the performance persistence of equity long/short hedge funds find that funds with the highest raw returns in the previous year, continue to outperform over the subsequent year, although not significantly, and there is no persistence in returns, beyond one year. In contrast, they find performance to be persistent, based on risk-adjusted return measures, such as the Sharpe Ratio, and in particular, also with an alpha from a multifactor model. Funds with the highest risk-adjusted performance, continue to significantly outperform in the following year. The persistence does not last longer than a year, except for the worst performers.
Sun et al. (
2016) constructed two performance measures: Downside Returns and Upside Returns. After controlling for the overall hedge fund market return and risk, and other fund characteristics, they find that hedge funds in the highest Downside Returns quintile, outperform funds in the lowest quintile, by 5%, in the subsequent year, whereas funds with better Upside Returns do not outperform subsequently.
2.5. Performance Rating Measures
Fund performance has been earlier evaluated by the measures developed by
Sharpe (
1966), Treynor (1965) and Jensen (1968). The Sharpe ratio of a portfolio (Sp) measures the excess return of portfolio, relative to the risk-free rate divided by its standard deviation, and is defined as
The Sharpe measure takes into account the total risk of returns, whilst the Treynor and Jensen measures rate a fund, just on its market risk. More recently, to account for asymmetricities in returns and not only the market risk, alternative reward-risk evaluation measures, such as the Sortino ratio (
Sortino and Price (
1994)), and Upside Potential ratio (
Sortino et al. (
1999)) were proposed.
The Sortino ratio of a portfolio is defined as
where Rpi is the return of the portfolio at time i, MAR is the minimum acceptable return, and
is the Downside risk (DR).
The Upside Potential ratio of a portfolio is defined as
The upside potential ratio divides the average of the excess positive returns, compared to the minimum acceptable return (MAR), by the downside risk (DR).
3. Methodology
3.1. General
In this research, a deductive approach was used. Quantitative data on hedge fund performance was collected in the form of monthly returns of the major hedge fund strategies, between June 2007 to January 2017. The performance of each strategy, value-wise, was first visually inspected and then return data were analysed. The correlations of hedge fund strategies with the benchmark S and P 500 was also studied.
To ascertain explanatory factors for the performance of the various hedge fund strategies and the extent to which the strategies incorporate market risk, the strategies were tested via Carhart’s four-factor model (1997). The four-factor model was chosen as it can provide additional explanations for performance over the traditional CAPM and
Fama and French (
1993) three-factor model, explained earlier. The four-factor model was an extension of the
Fama and French (
1993) model and included four risk factors to explain returns (excess market return, excess return of small cap over big cap stocks (SMB), excess return of value stocks over growth stocks (HML), and the excess return of the stocks that went up minus the stocks that went down (UMD) (
Fama and French 1993;
Carhart 1997).
Regressions were estimated as follows:
To obtain further insights into the strategies which hold value for investors, tests for persistence and risk-reward rankings were also conducted. The traditional Sharpe ratio had been a useful metric to rank fund strategies, on the basis of reward and risk. Given asymmetricities in the returns of hedge funds, evaluation of performance was also made in a downside-risk framework, with reward-risk ratios, such as the Upper Potential Ratio and the Sortino Ratio.
Investors look at persistence in performance at two levels—consistent positive performance and consistent performance better than the market. While a lot of work has been done by various authors on the subject of persistence in performance of Hedge Funds, this research relied on the work of
Agarwal and Naik (
2000), who after extensive analysis of quarterly, half yearly and yearly returns, found maximum persistence at the quarterly horizon.
Taking these considerations into account, persistence tests were devised as follows:
- (i)
To test for persistence, t-tests were conducted, over a three-month rolling window.
- (ii)
The total number of statistically significant negative performance windows were subtracted from the total number of statistically significant positive performance windows, and the different strategies were ranked for persistent positive performance on this basis, then tested against the ranked total performance of the various strategies, to test for any relationship between persistence in positive returns and actual performance. A non-parametric test was used for this test.
- (iii)
The procedures in (i) and (ii) were repeated for excess performance, over the return of the S and P 500, for the whole period, during and after the crisis.
- (iv)
To test for any relationship between total performance and alternative reward-risk ratios, the Sharpe ratio, Upside Potential ratio (UPR), and Sortino ratios were computed for the different strategies, then ranked and tested in comparison with actual performance. The t-bill rate was taken as the minimum acceptable return (MAR) in these calculations. A non-parametric test was used for this test.
3.2. Data
To begin with, it is very important to mention that hedge fund performance data was provided on a voluntary basis and available to persons depending on the country only. Many hedge funds, however, do publish their monthly performance to inform existing clients and attract new investors. According to
D’Alessio (
2015), the top five online hedge fund databases are Barclay hedge, Eurekahedge, Hedge Fund Research and Hedge Index. Hedge Index is sponsored by Credit Suisse, and with over 9500 funds, it offers a reliable, large database of reporting funds.
For the purpose of this study, qualitative hedge fund performance data accessed from the Hedge index was used. Reasons for this were the large database, as mentioned above, as well as the easy accessibility. Hedge index defines ten major strategies, namely Convertible Arbitrage, Emerging Markets, Equity Market Neutral, Event Driven, Fixed Income Arbitrage, Global Macro, Long/Short Equity, Managed Futures, Multi Strategy and Short Biased. The indices are asset-weighted and created by Credit Suisse Hedge Index LLC. Hedge funds are chosen from the Credit Suisse Hedge Fund Database, which includes around 9500 funds. All funds feature a minimum twelve-month track record, a minimum of US
$50 million, under management, and are able to provide an audited financial statement. The indices reflect net performance and are rebalanced and calculated on a monthly basis. Survivorship bias is limited, by including all funds in the index, until they are fully liquidated or unable to meet the financial reporting requirements. Fees including (but not limited to) management and incentive fees, as well as transaction costs, are considered in the return calculations (
Credit Suisse 2018).
Data for the Carhart four-factor model was obtained from the website of
French (
2018). The four factors Mkt-Rf (market risk), SMB (Size), HML (Value) and UMD (Momentum) were created from six size/book-to-market benchmark portfolios. These portfolios neither include hold ranges nor transaction costs. The market return was represented by the value-weighted return on all NYSE, NASDAQ and AMEX stocks, obtained from CRSP. To calculate the excess return of small cap stocks over large cap stocks (SMB) the average return on three big portfolios was subtracted from the average return on three small portfolios (value, neutral and growth). The variable HML (high minus low) measured the excess return of the value stocks, over the growth stocks and was calculated by subtracting the average return on the two growth portfolios, from the average return on the two value portfolios (small and big). To calculate the momentum factor (UMD), French used “six value-weighted portfolios formed on size and prior (2–12) returns” (
French 2018). UMD equalled the average return on the two high prior return portfolios, minus the average return on the two low prior return portfolios. Portfolios were updated monthly and rebalanced quarterly.
3.3. Market Performance and Risk-Free Return
To evaluate the performance of the different hedge fund indices, a benchmark is needed. From an investor’s perspective, in Capital Market Theory, the Market portfolio offered the best reward-risk performance in an efficient market. The S and P 500 has been used as a proxy for the Market Portfolio in many hedge fund studies. Examples are the studies performed by
Liang and Kat (
2001),
Amin and Kat (
2003) or
Stoforos et al. (
2016).
Capocci (
2002) used a value-weighted portfolio of all stocks on the NYSE, Amex and Nasdaq, instead of only using the largest 500. The risk-free rate (rf) is represented by the one-month Treasury-bill rate from Ibbotson Associates. The Standard and Poor’s index is a value-weighted index and consist of stocks issued by 500 large cap companies listed on the NYSE or NASDAQ. Due to its large proportion of total market value, it widely reflects the entire U.S. equity market and the economic health of the United States (
Nasdaq 2018). As a result of globalisation in the financial markets the S and P, furthermore, reflects international events, to a large extent (
Stoforos et al. 2016).
4. Data Analysis, Findings and Discussions
In this section, data was analysed with various methods and the results of the tests are interpreted and discussed. The data consists of monthly returns of each of the 10 strategies mentioned, the risk-free rate and the market benchmark. It ranged from June 2007 to January 2017.
4.1. Descriptive Statistics, Visual Inspection, Other Diagnostics and Correlations
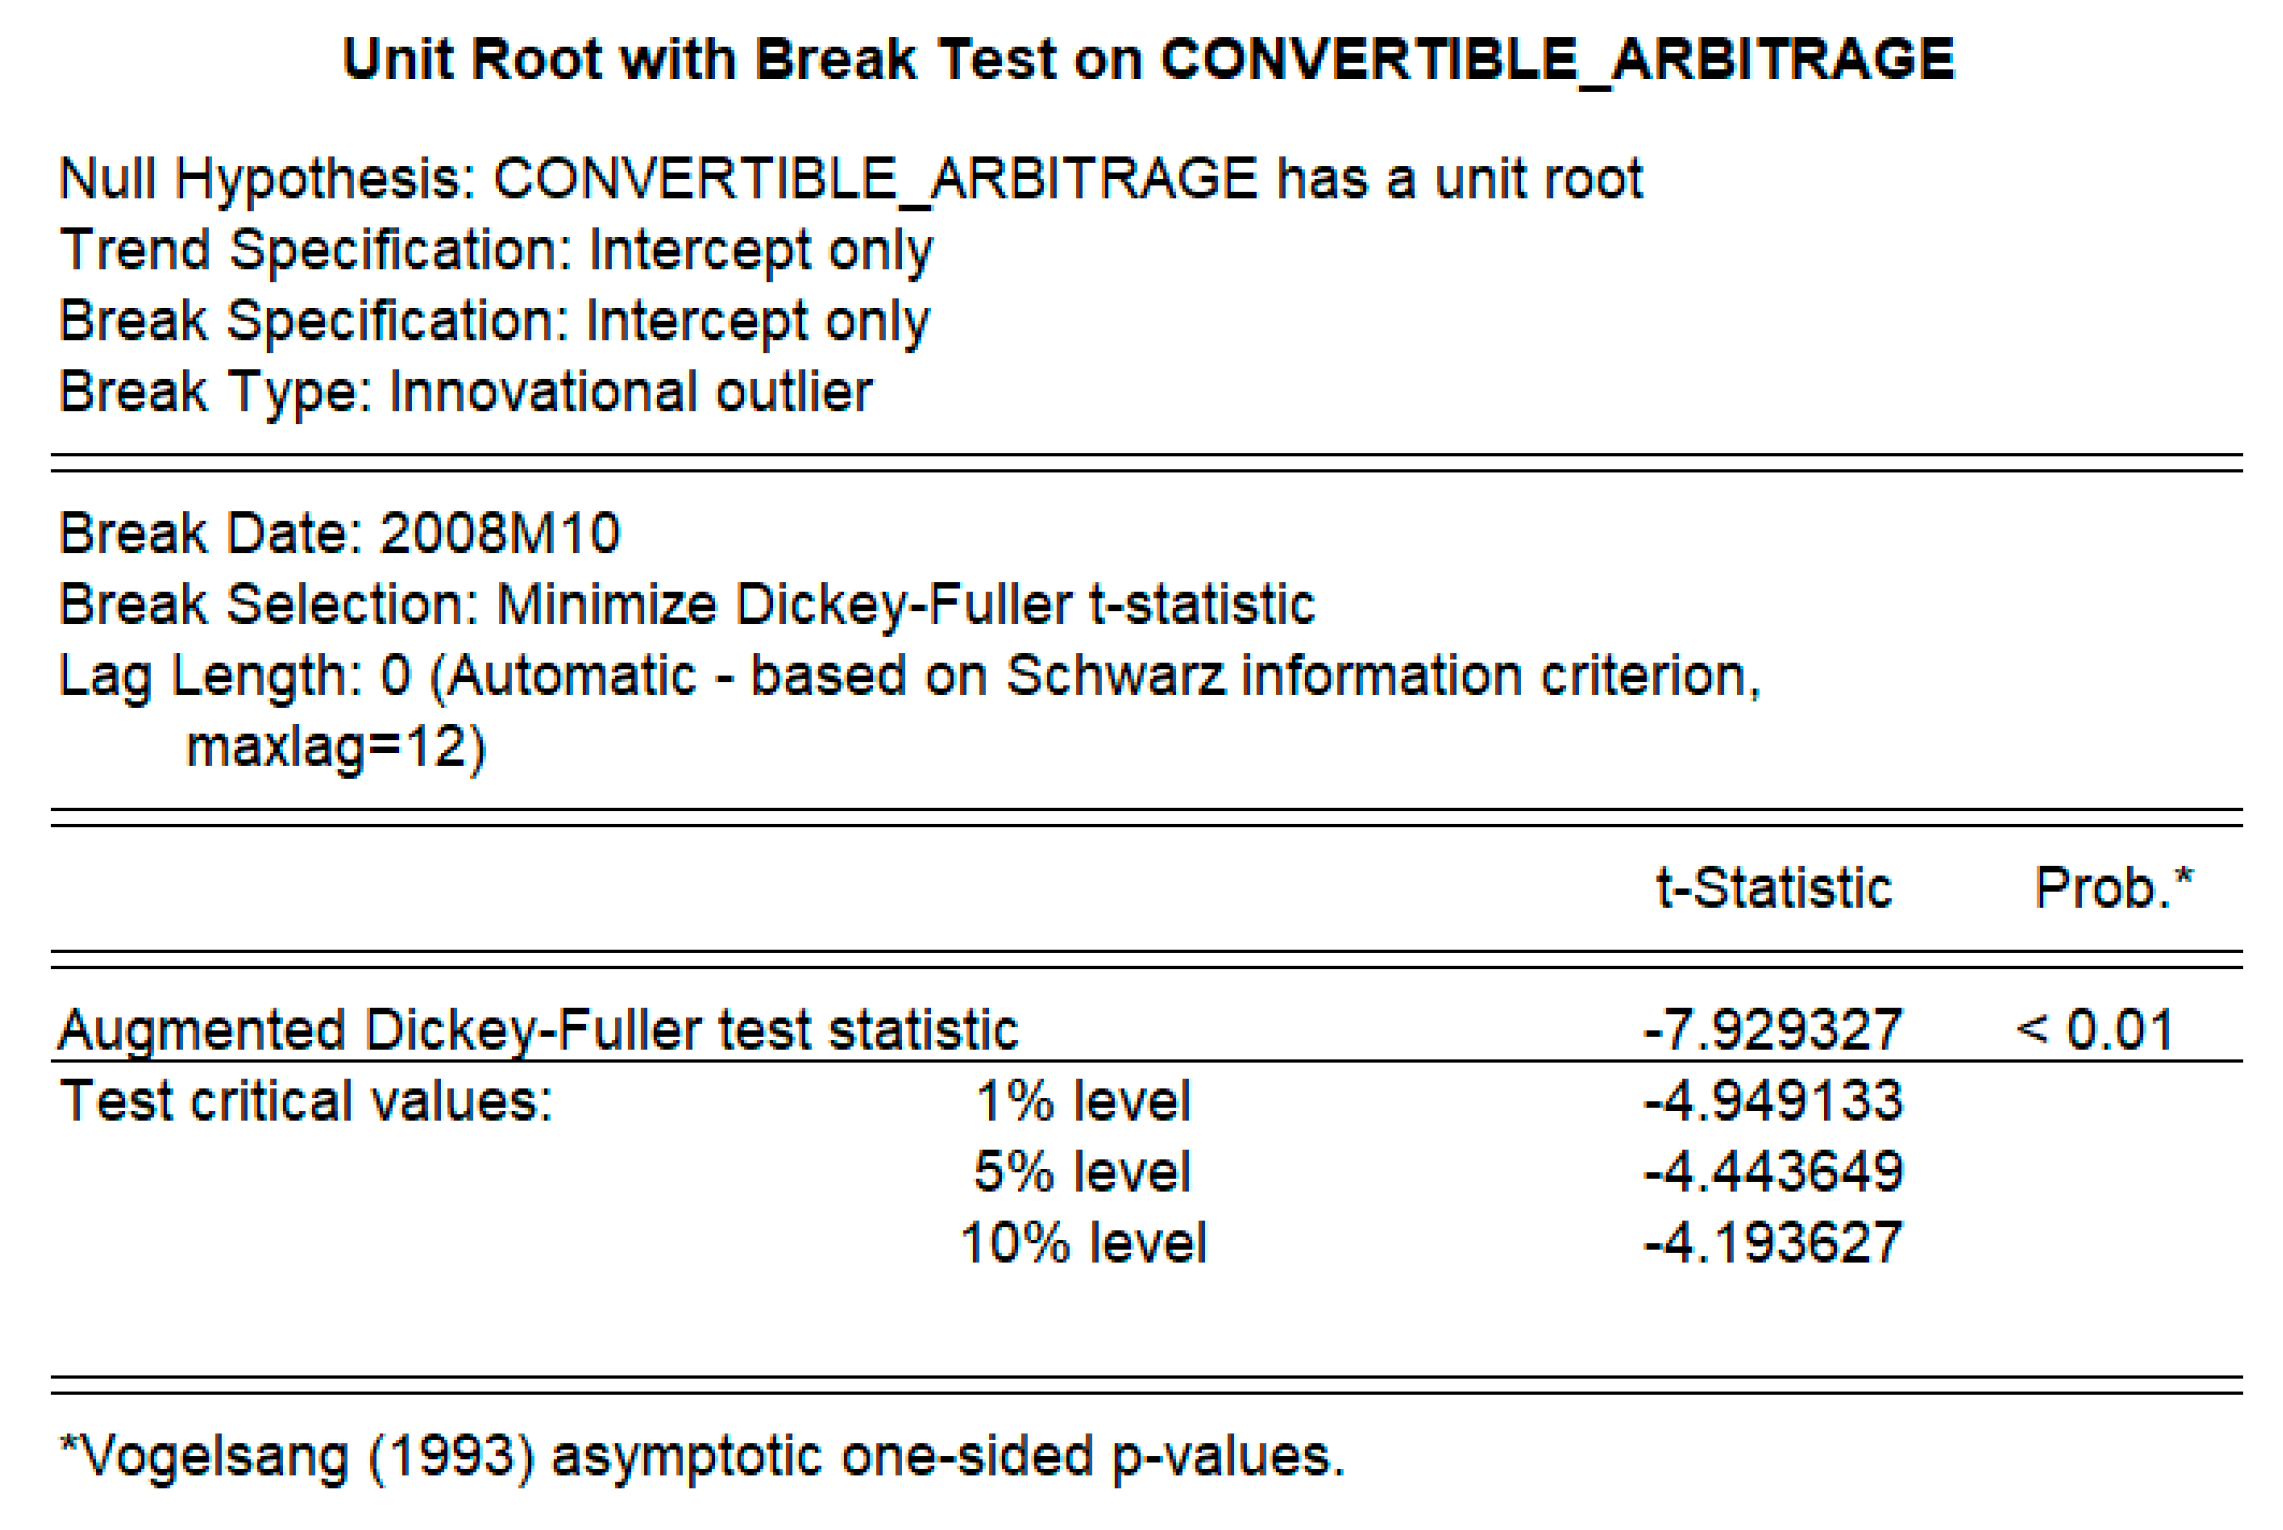
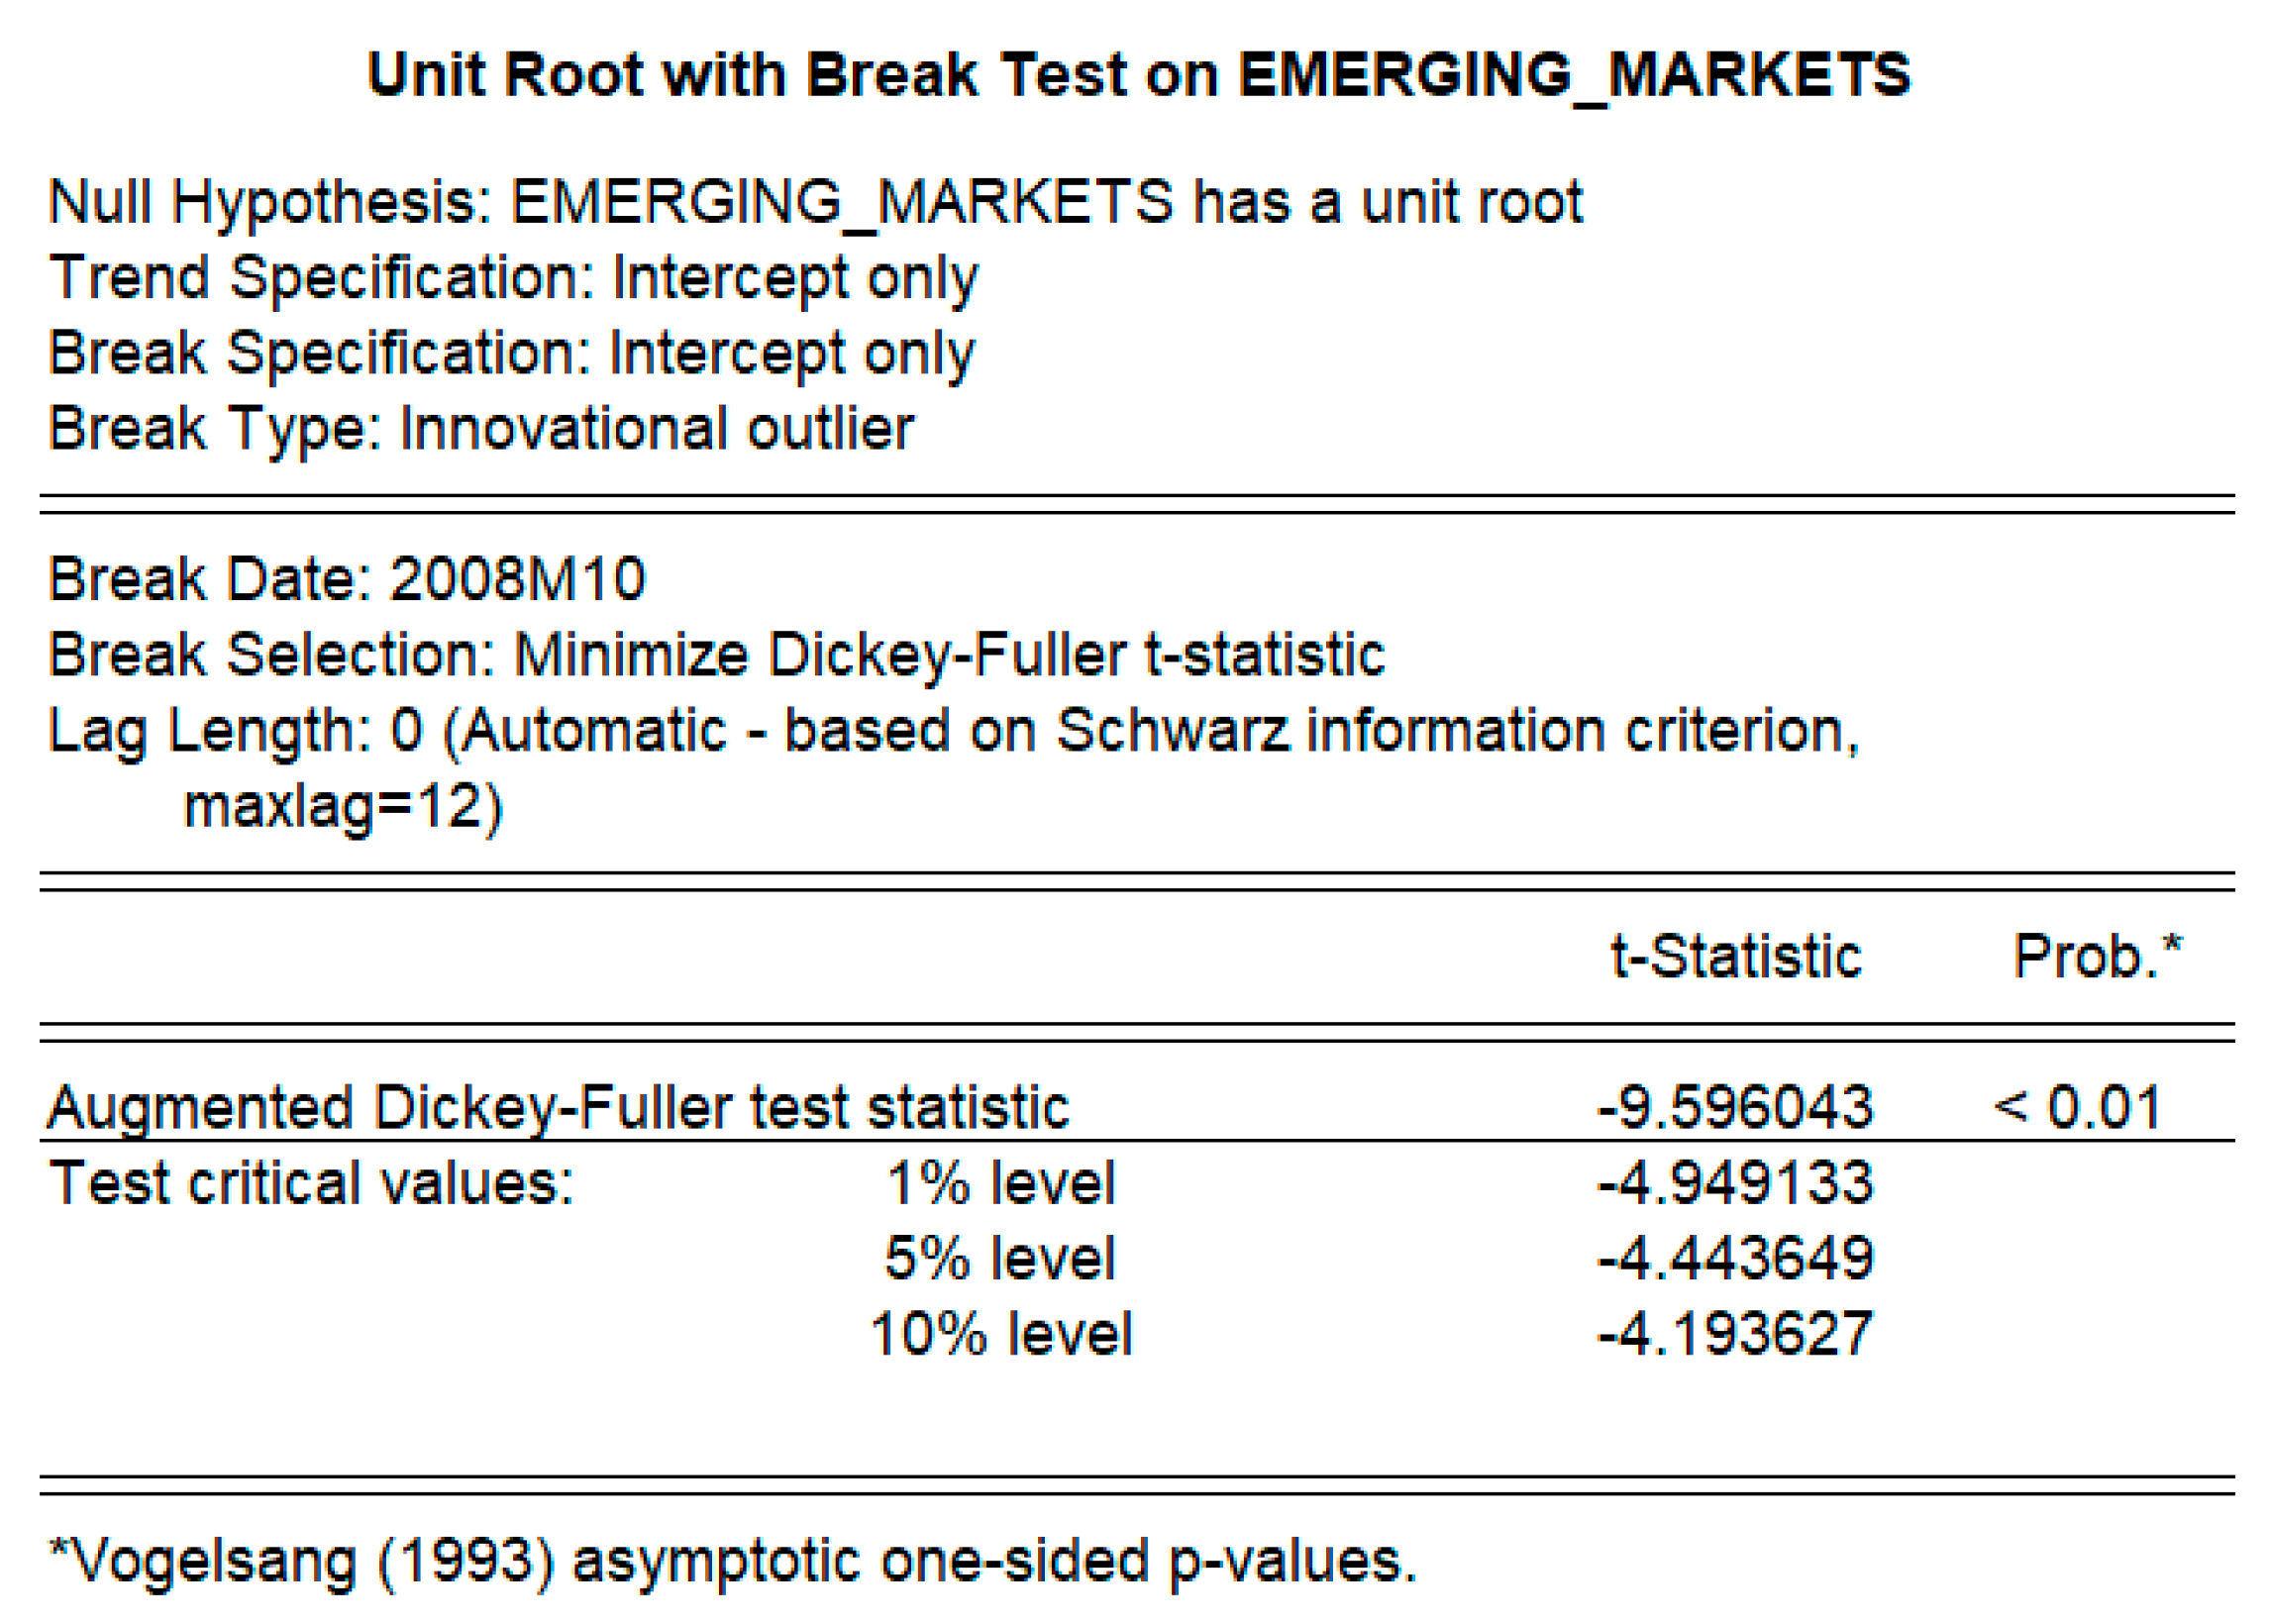
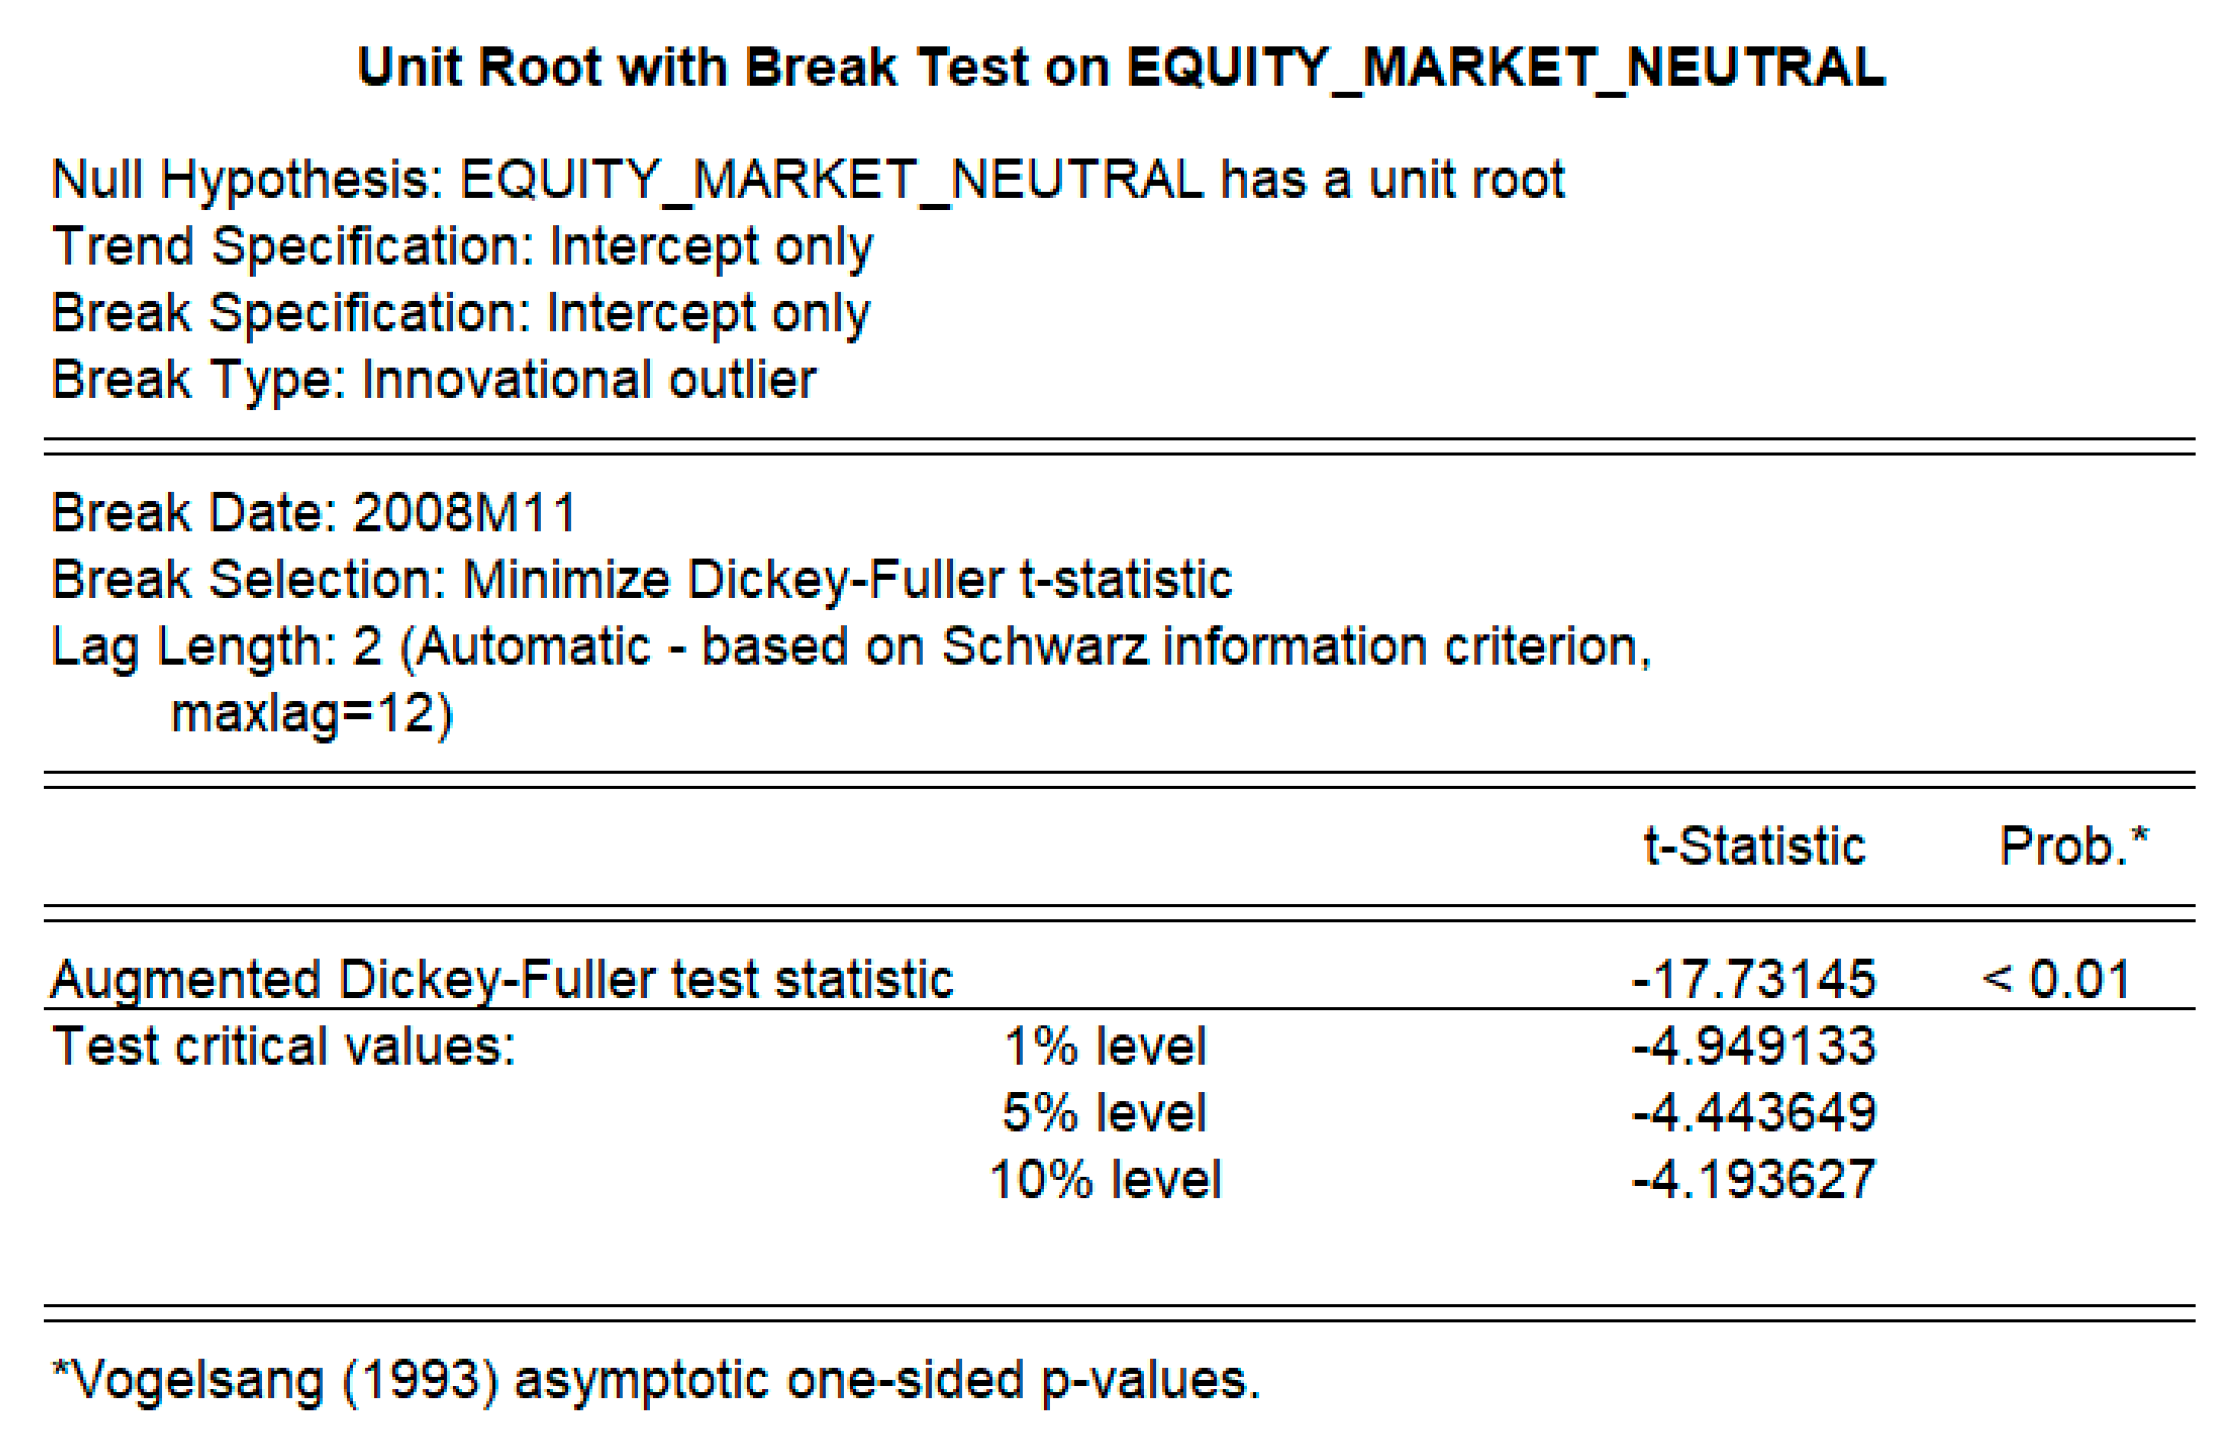
(a) Tests for stationarity and distribution of the returns
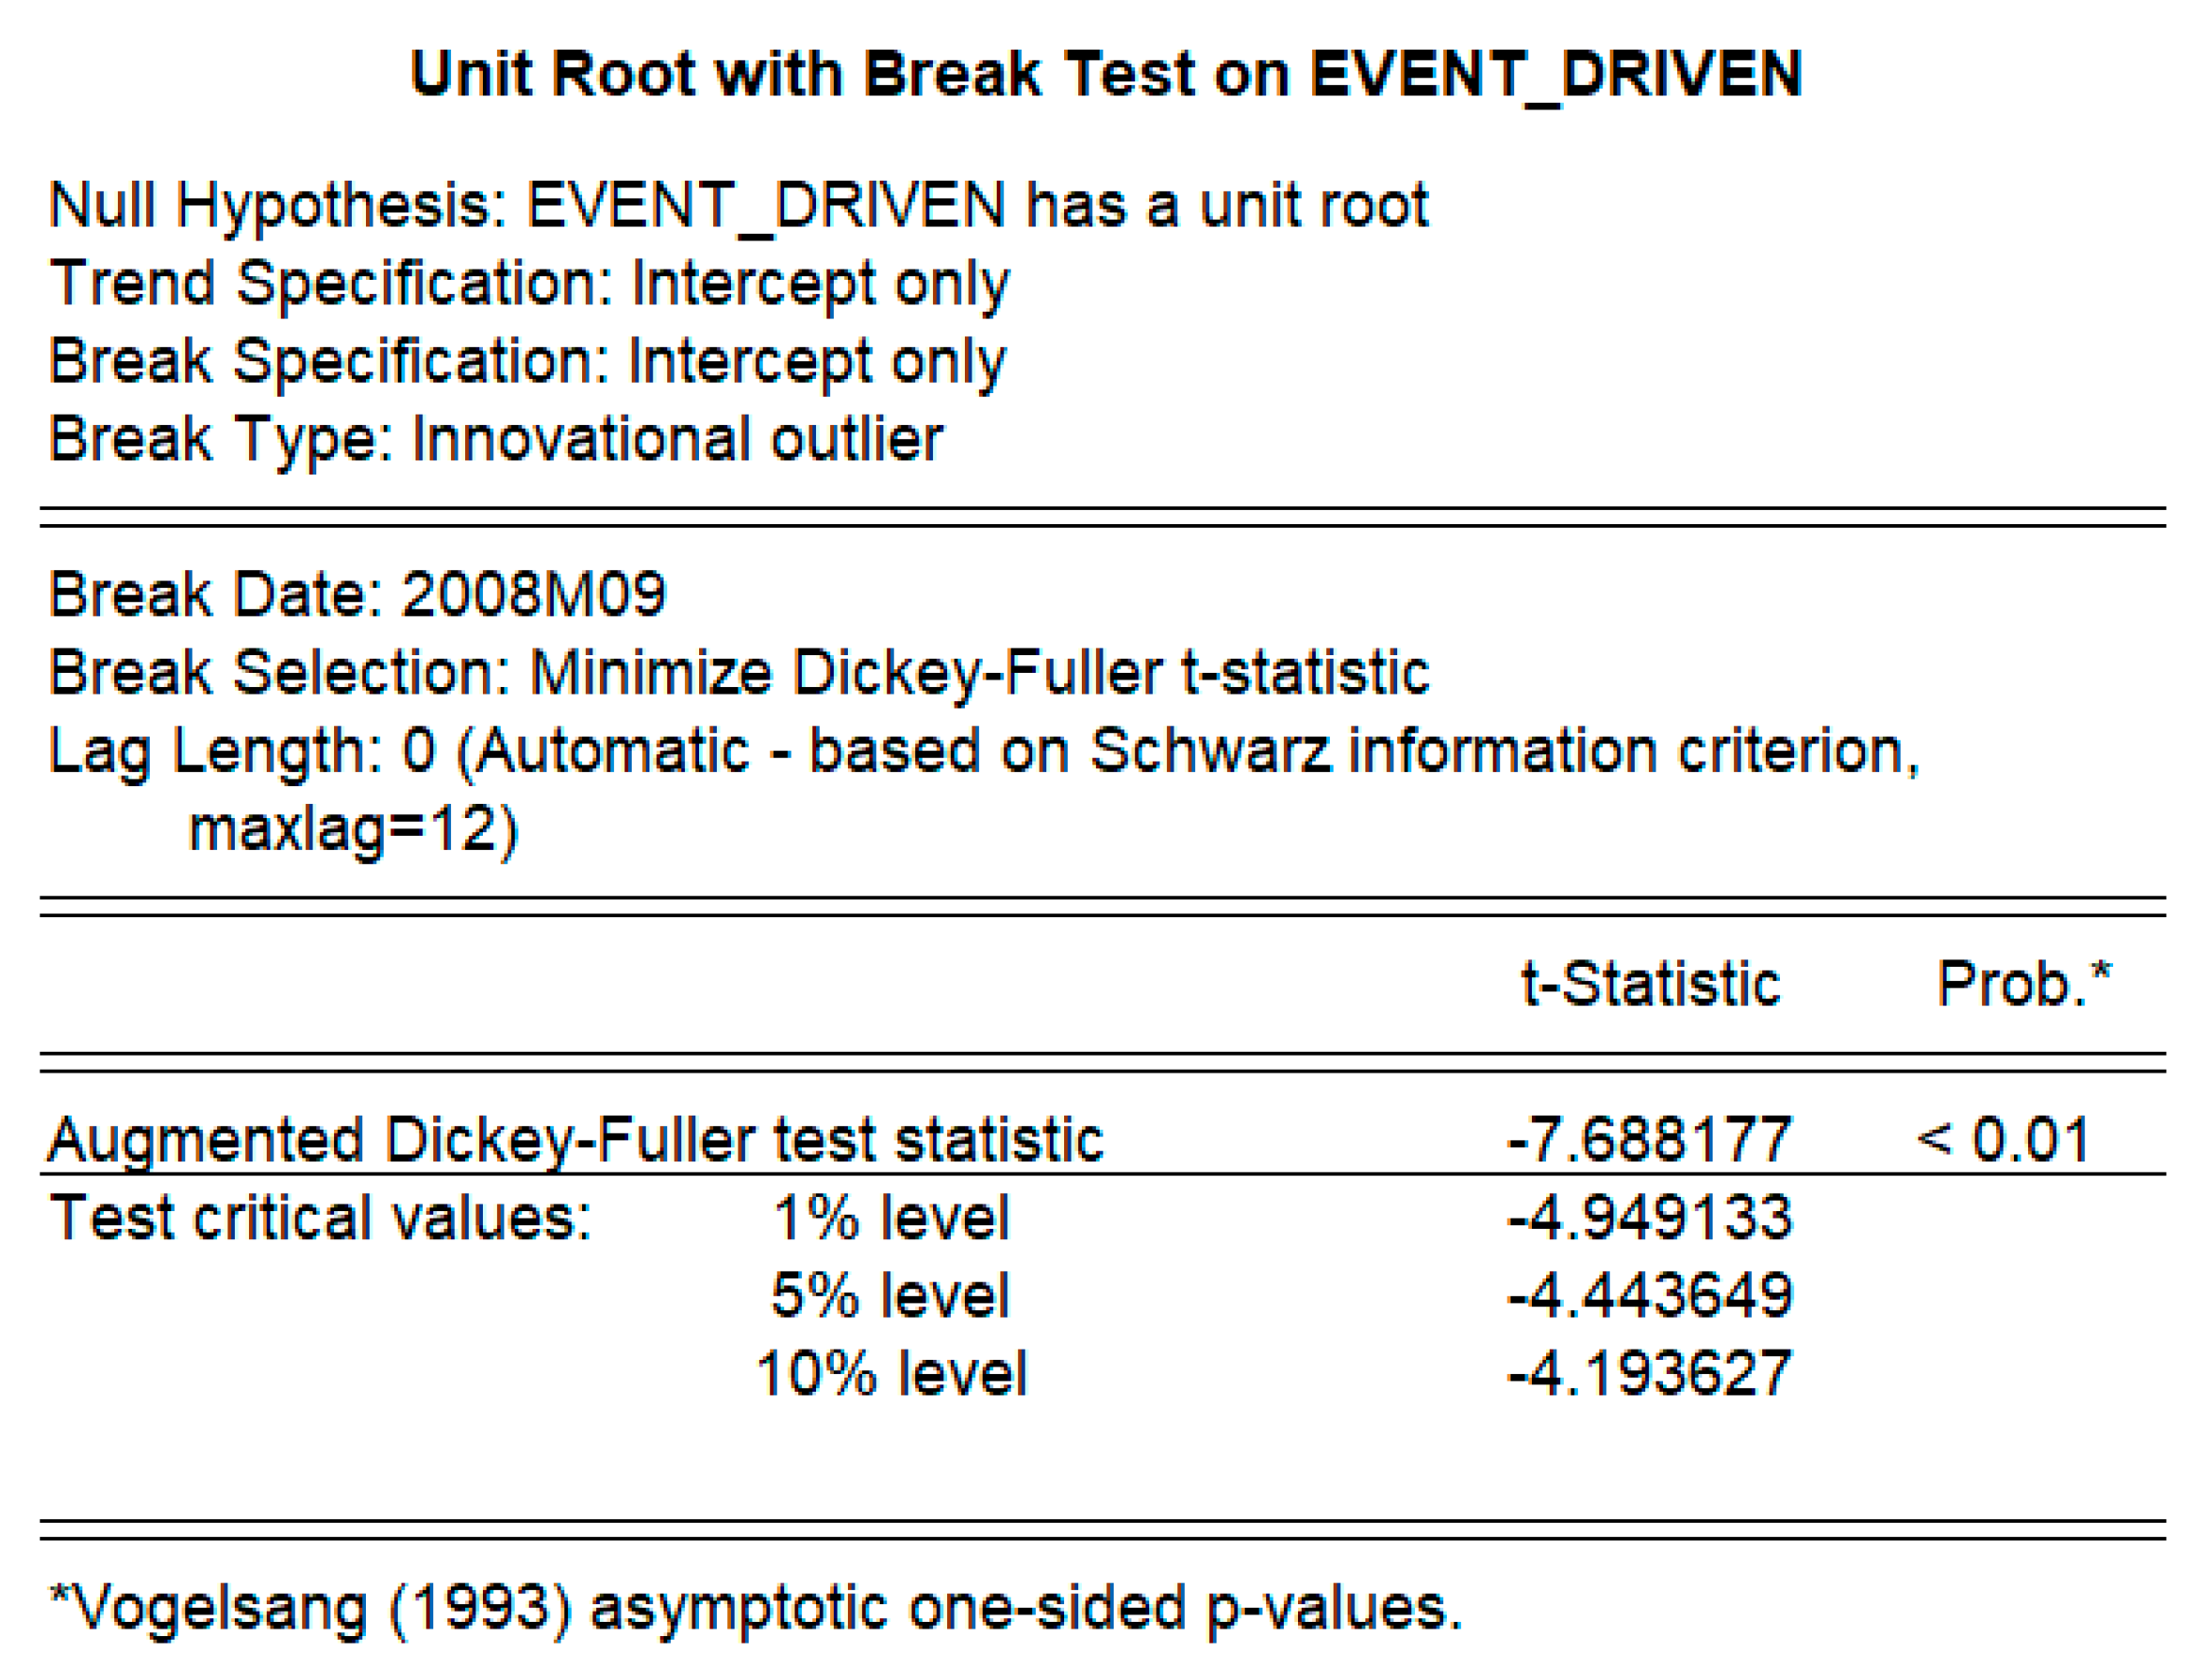
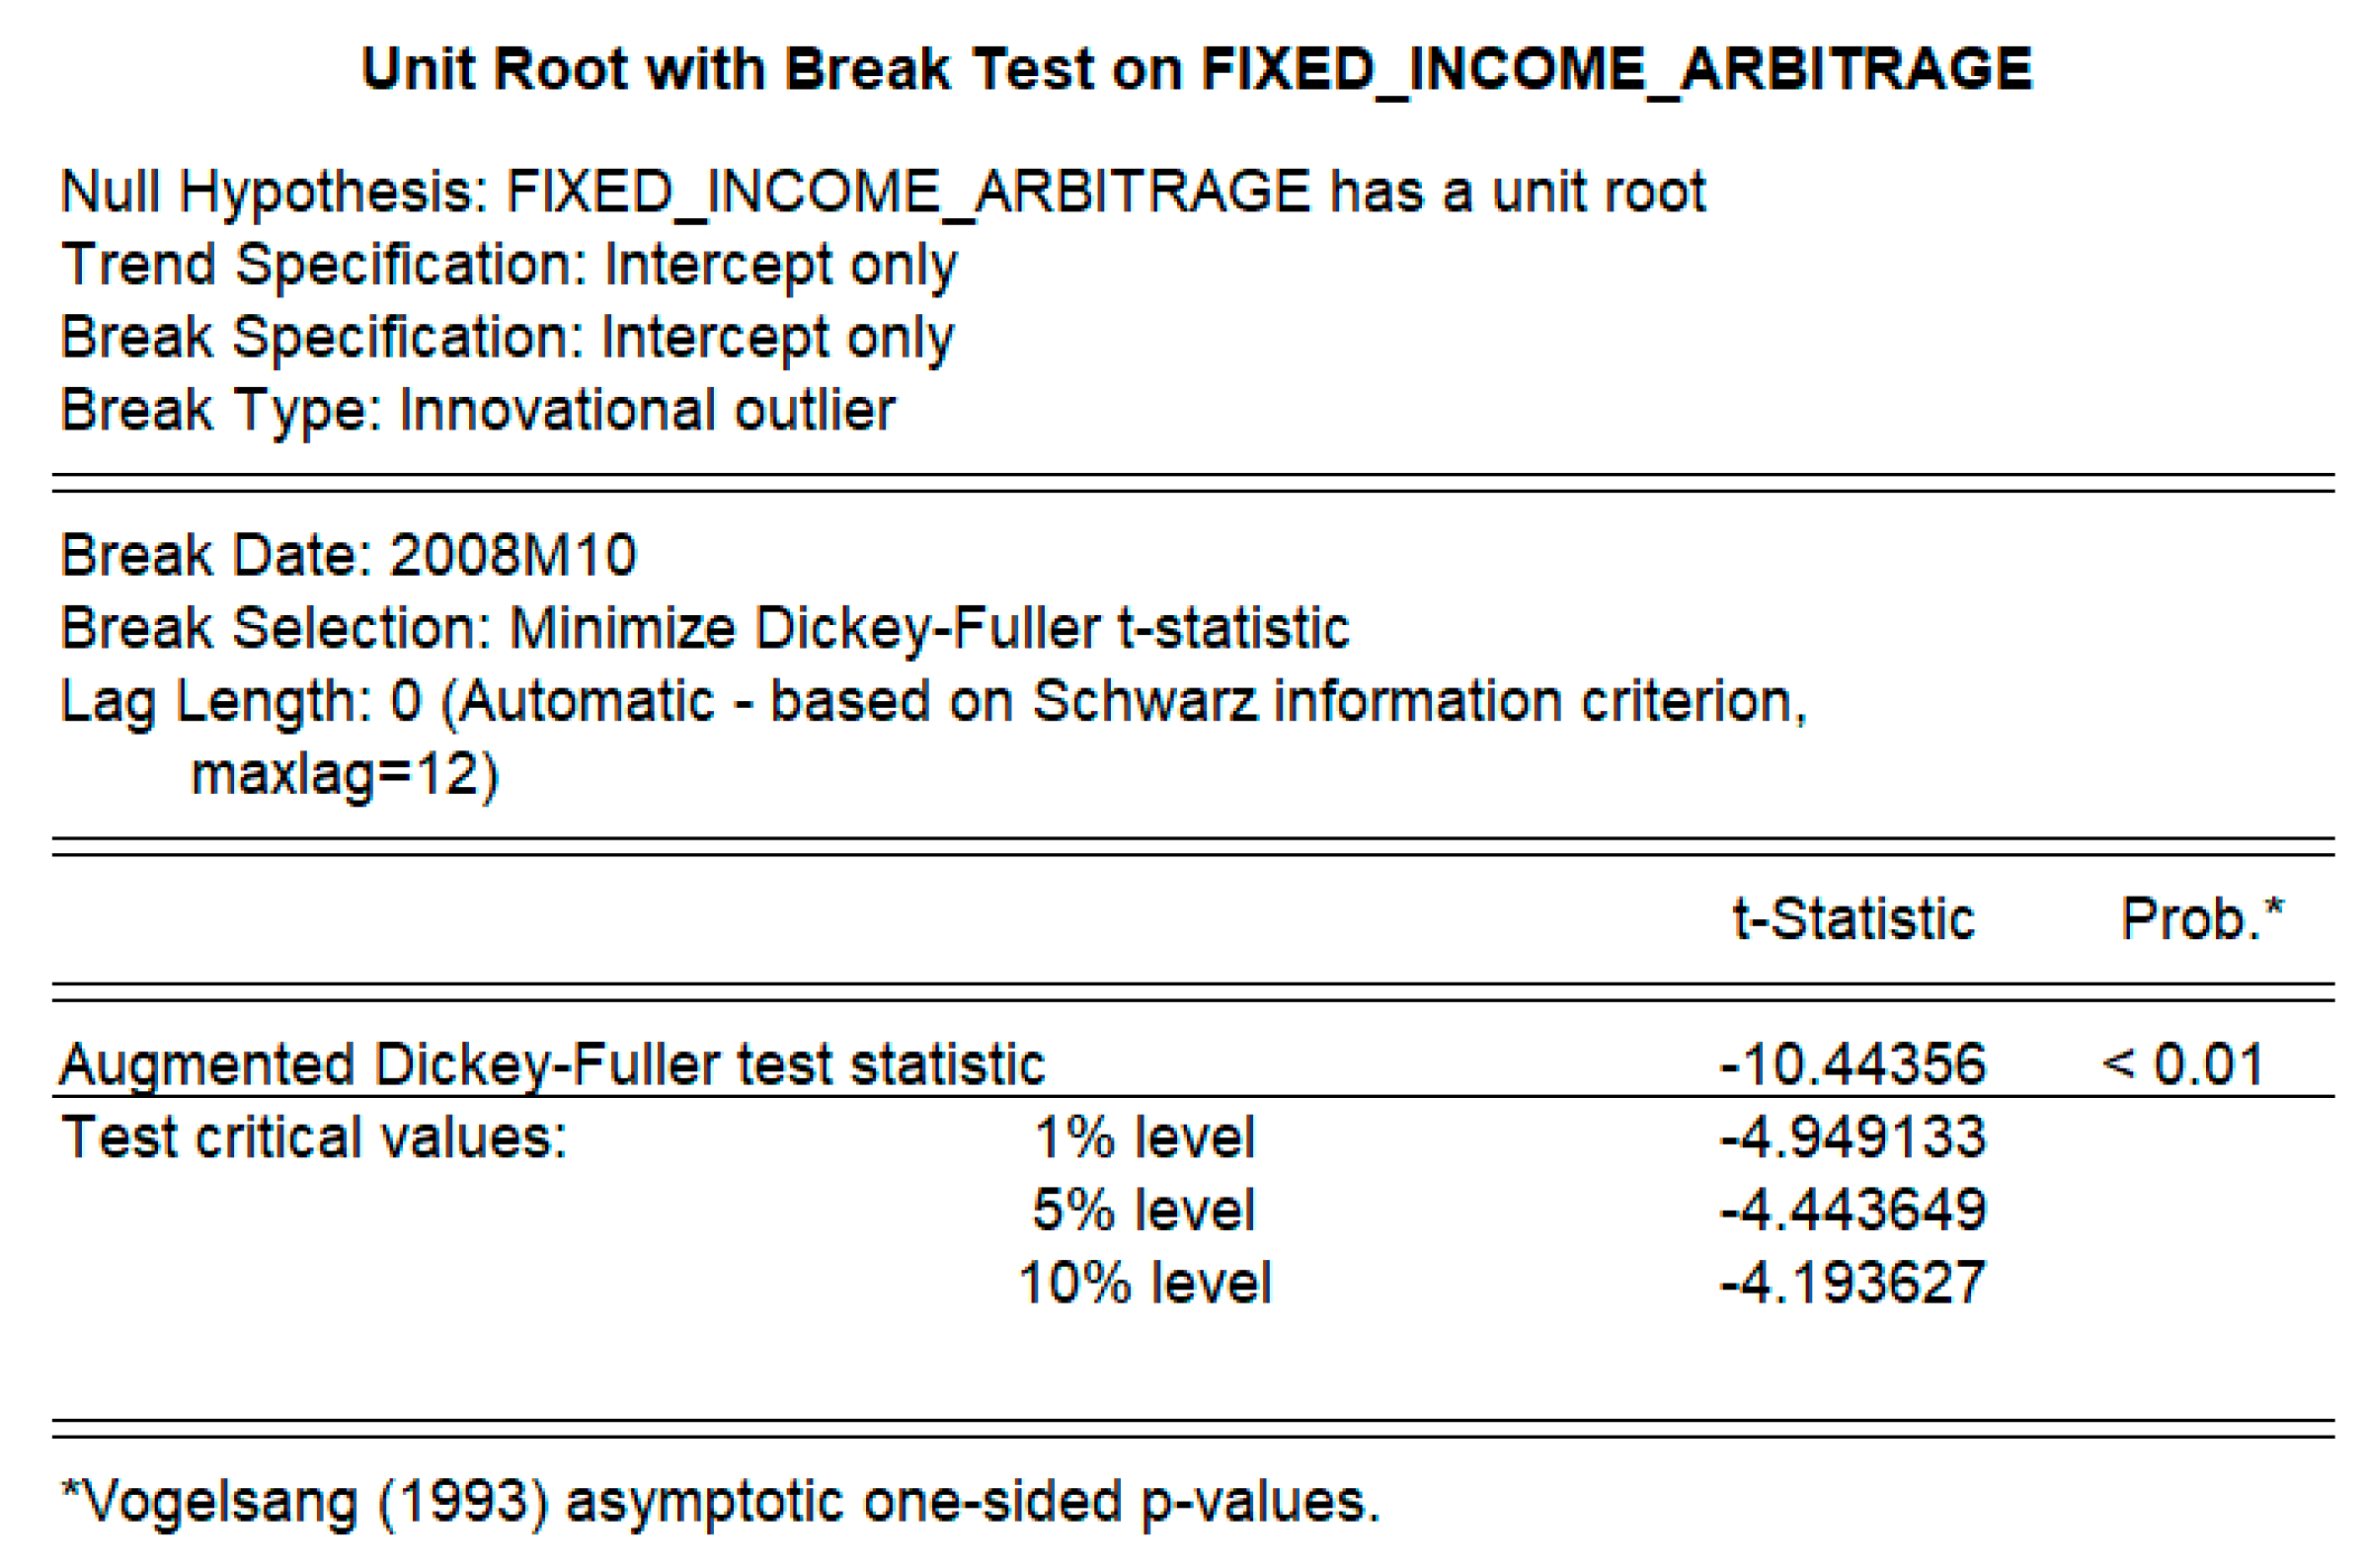
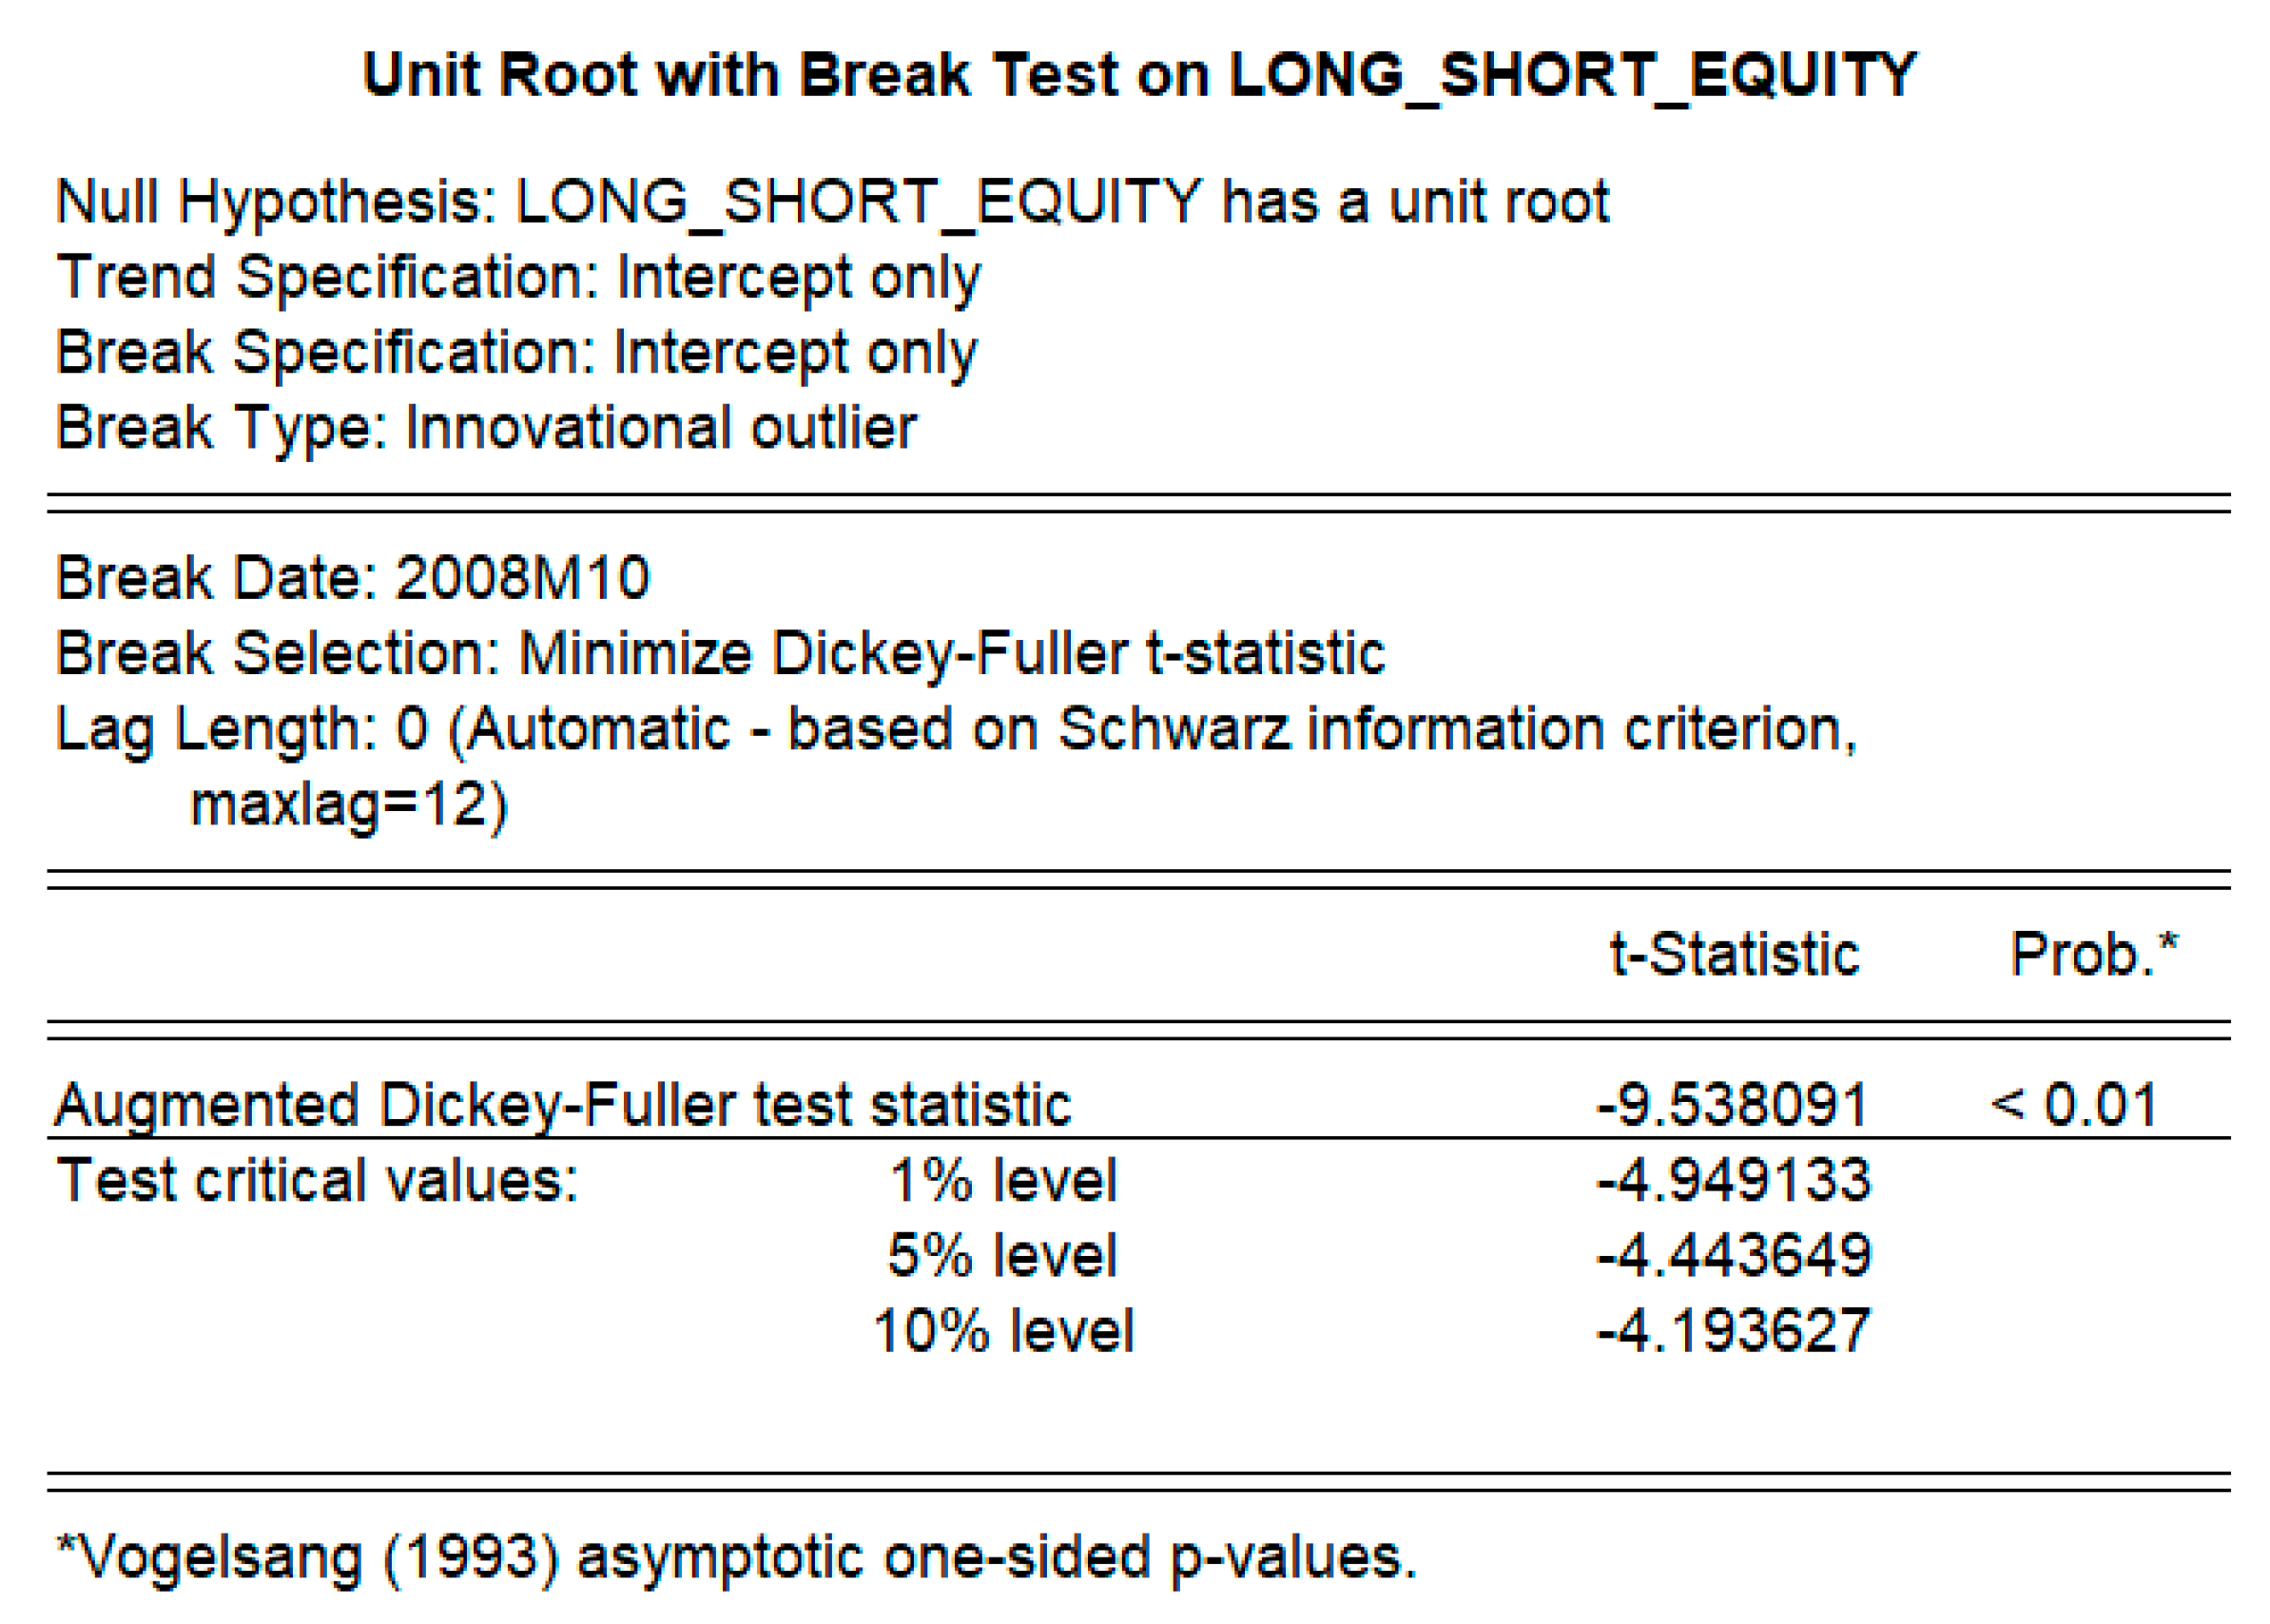
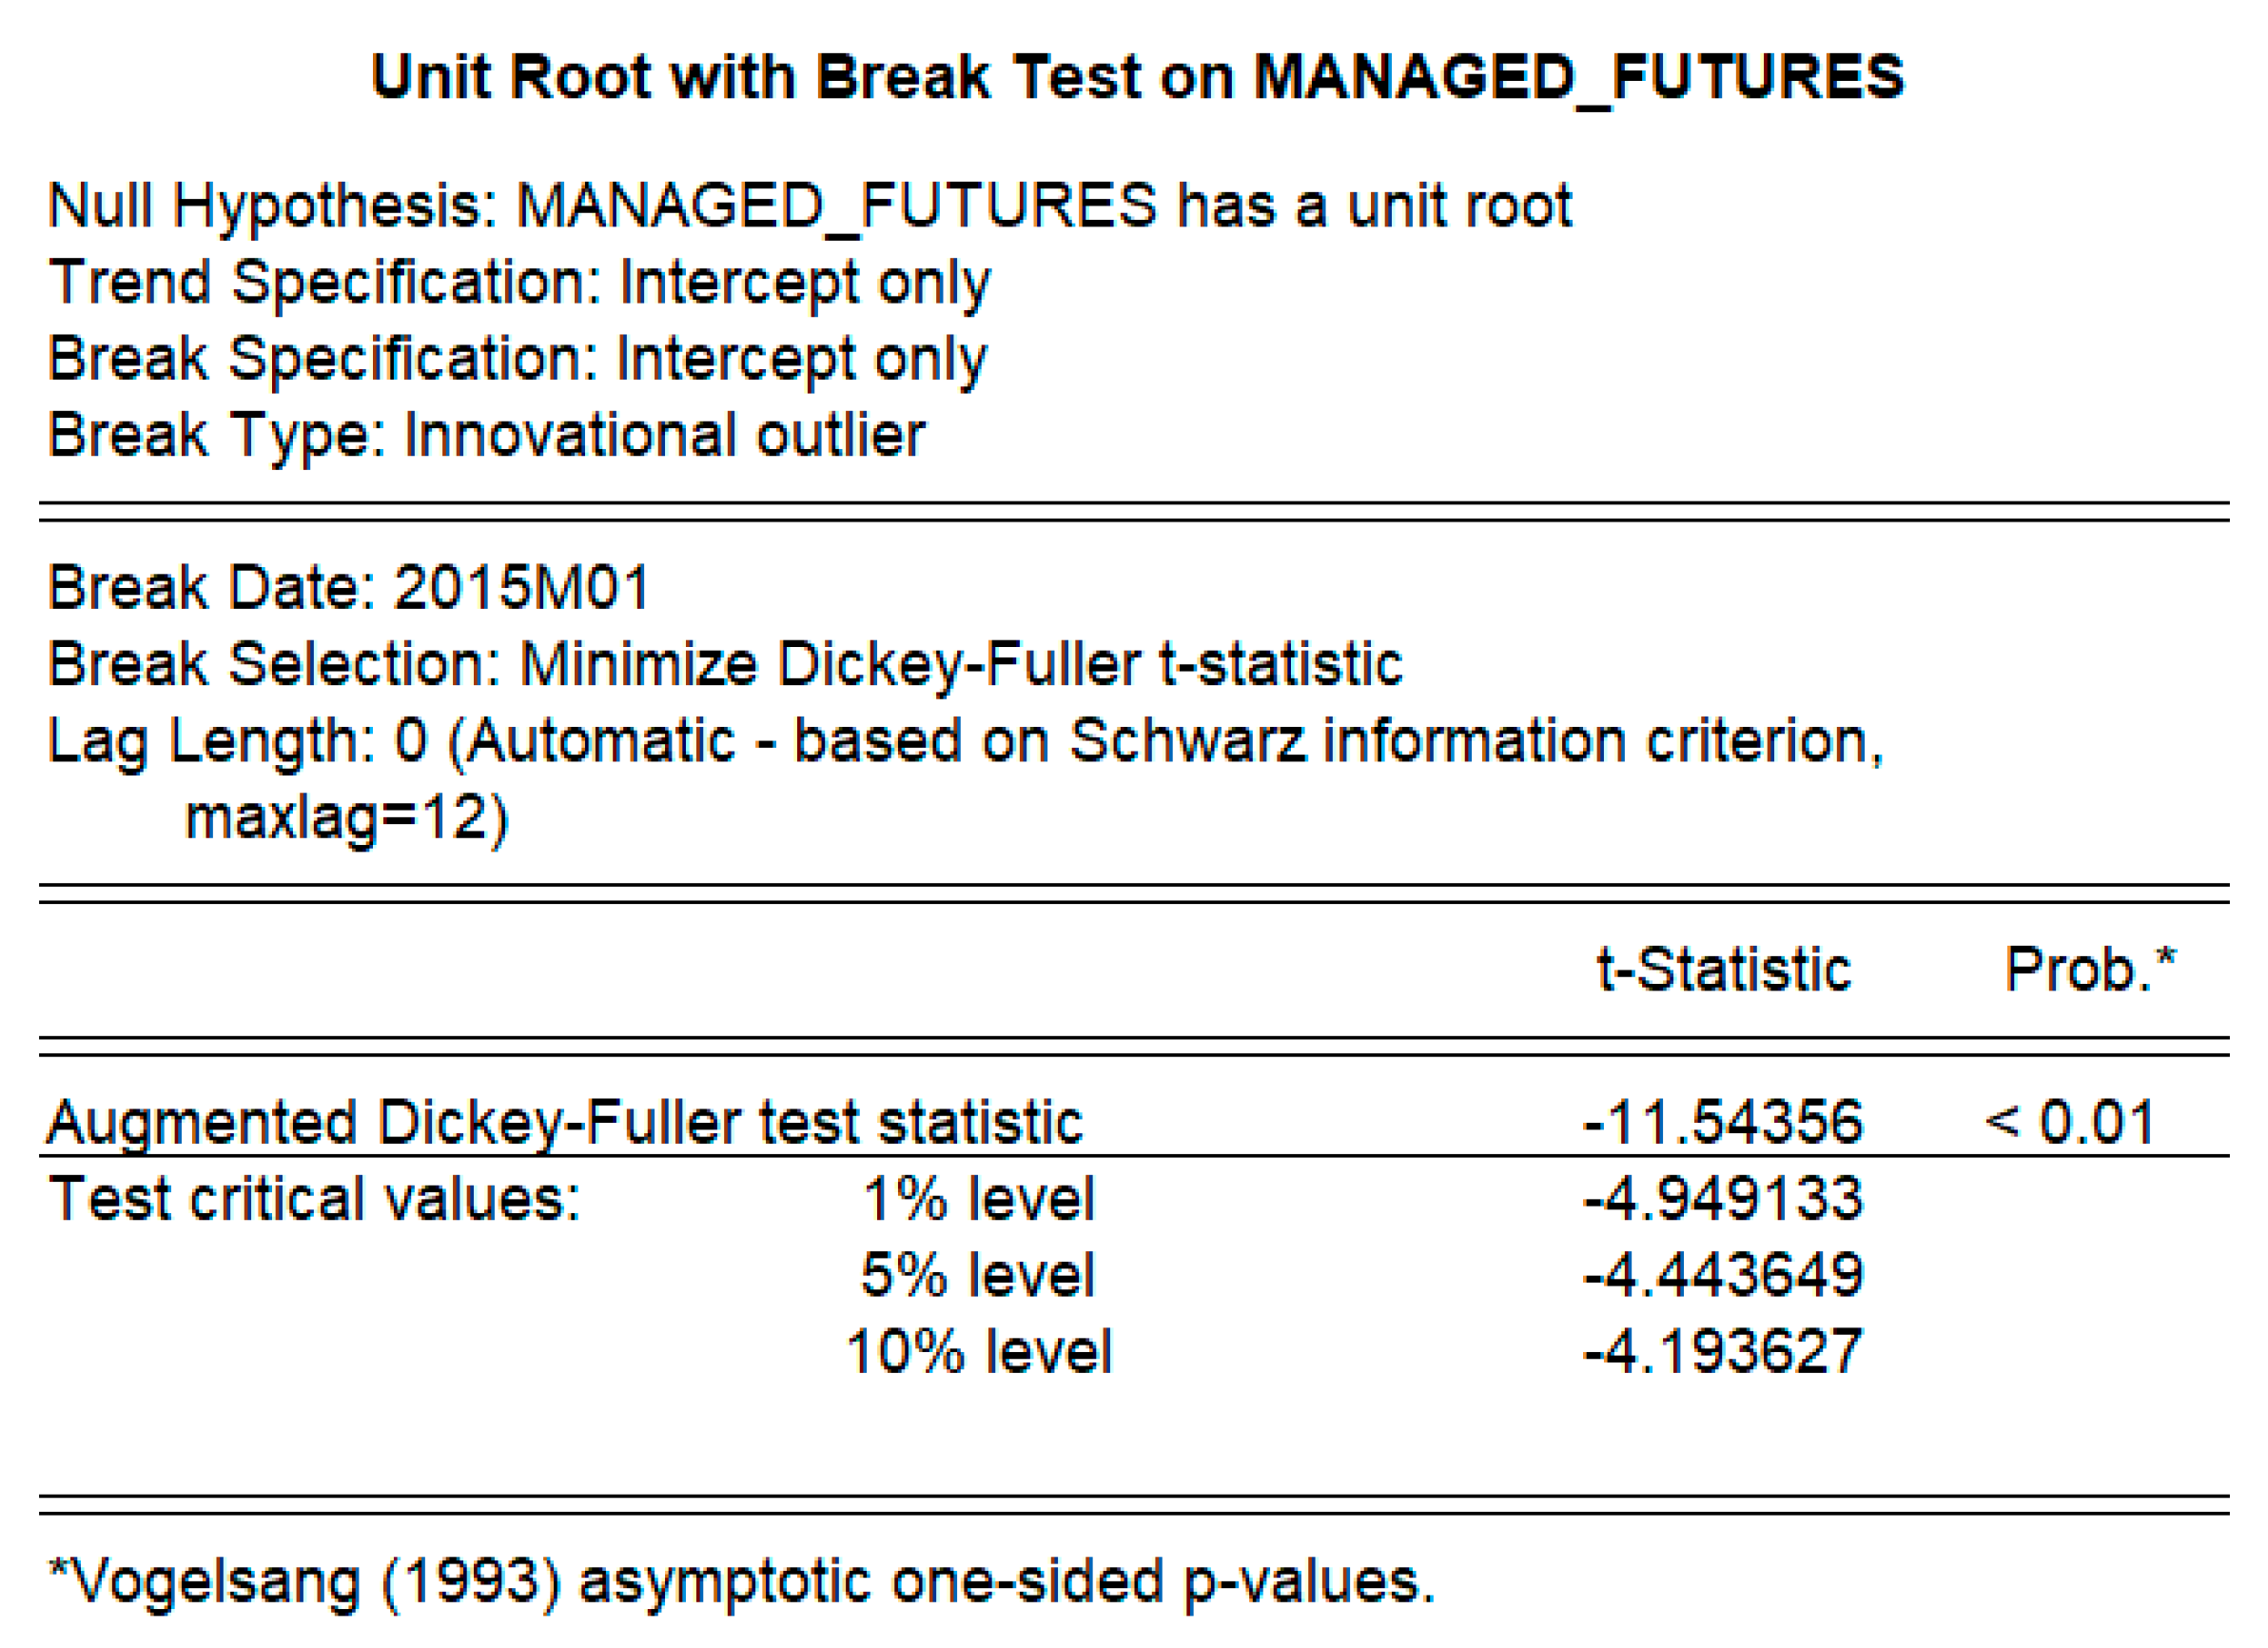
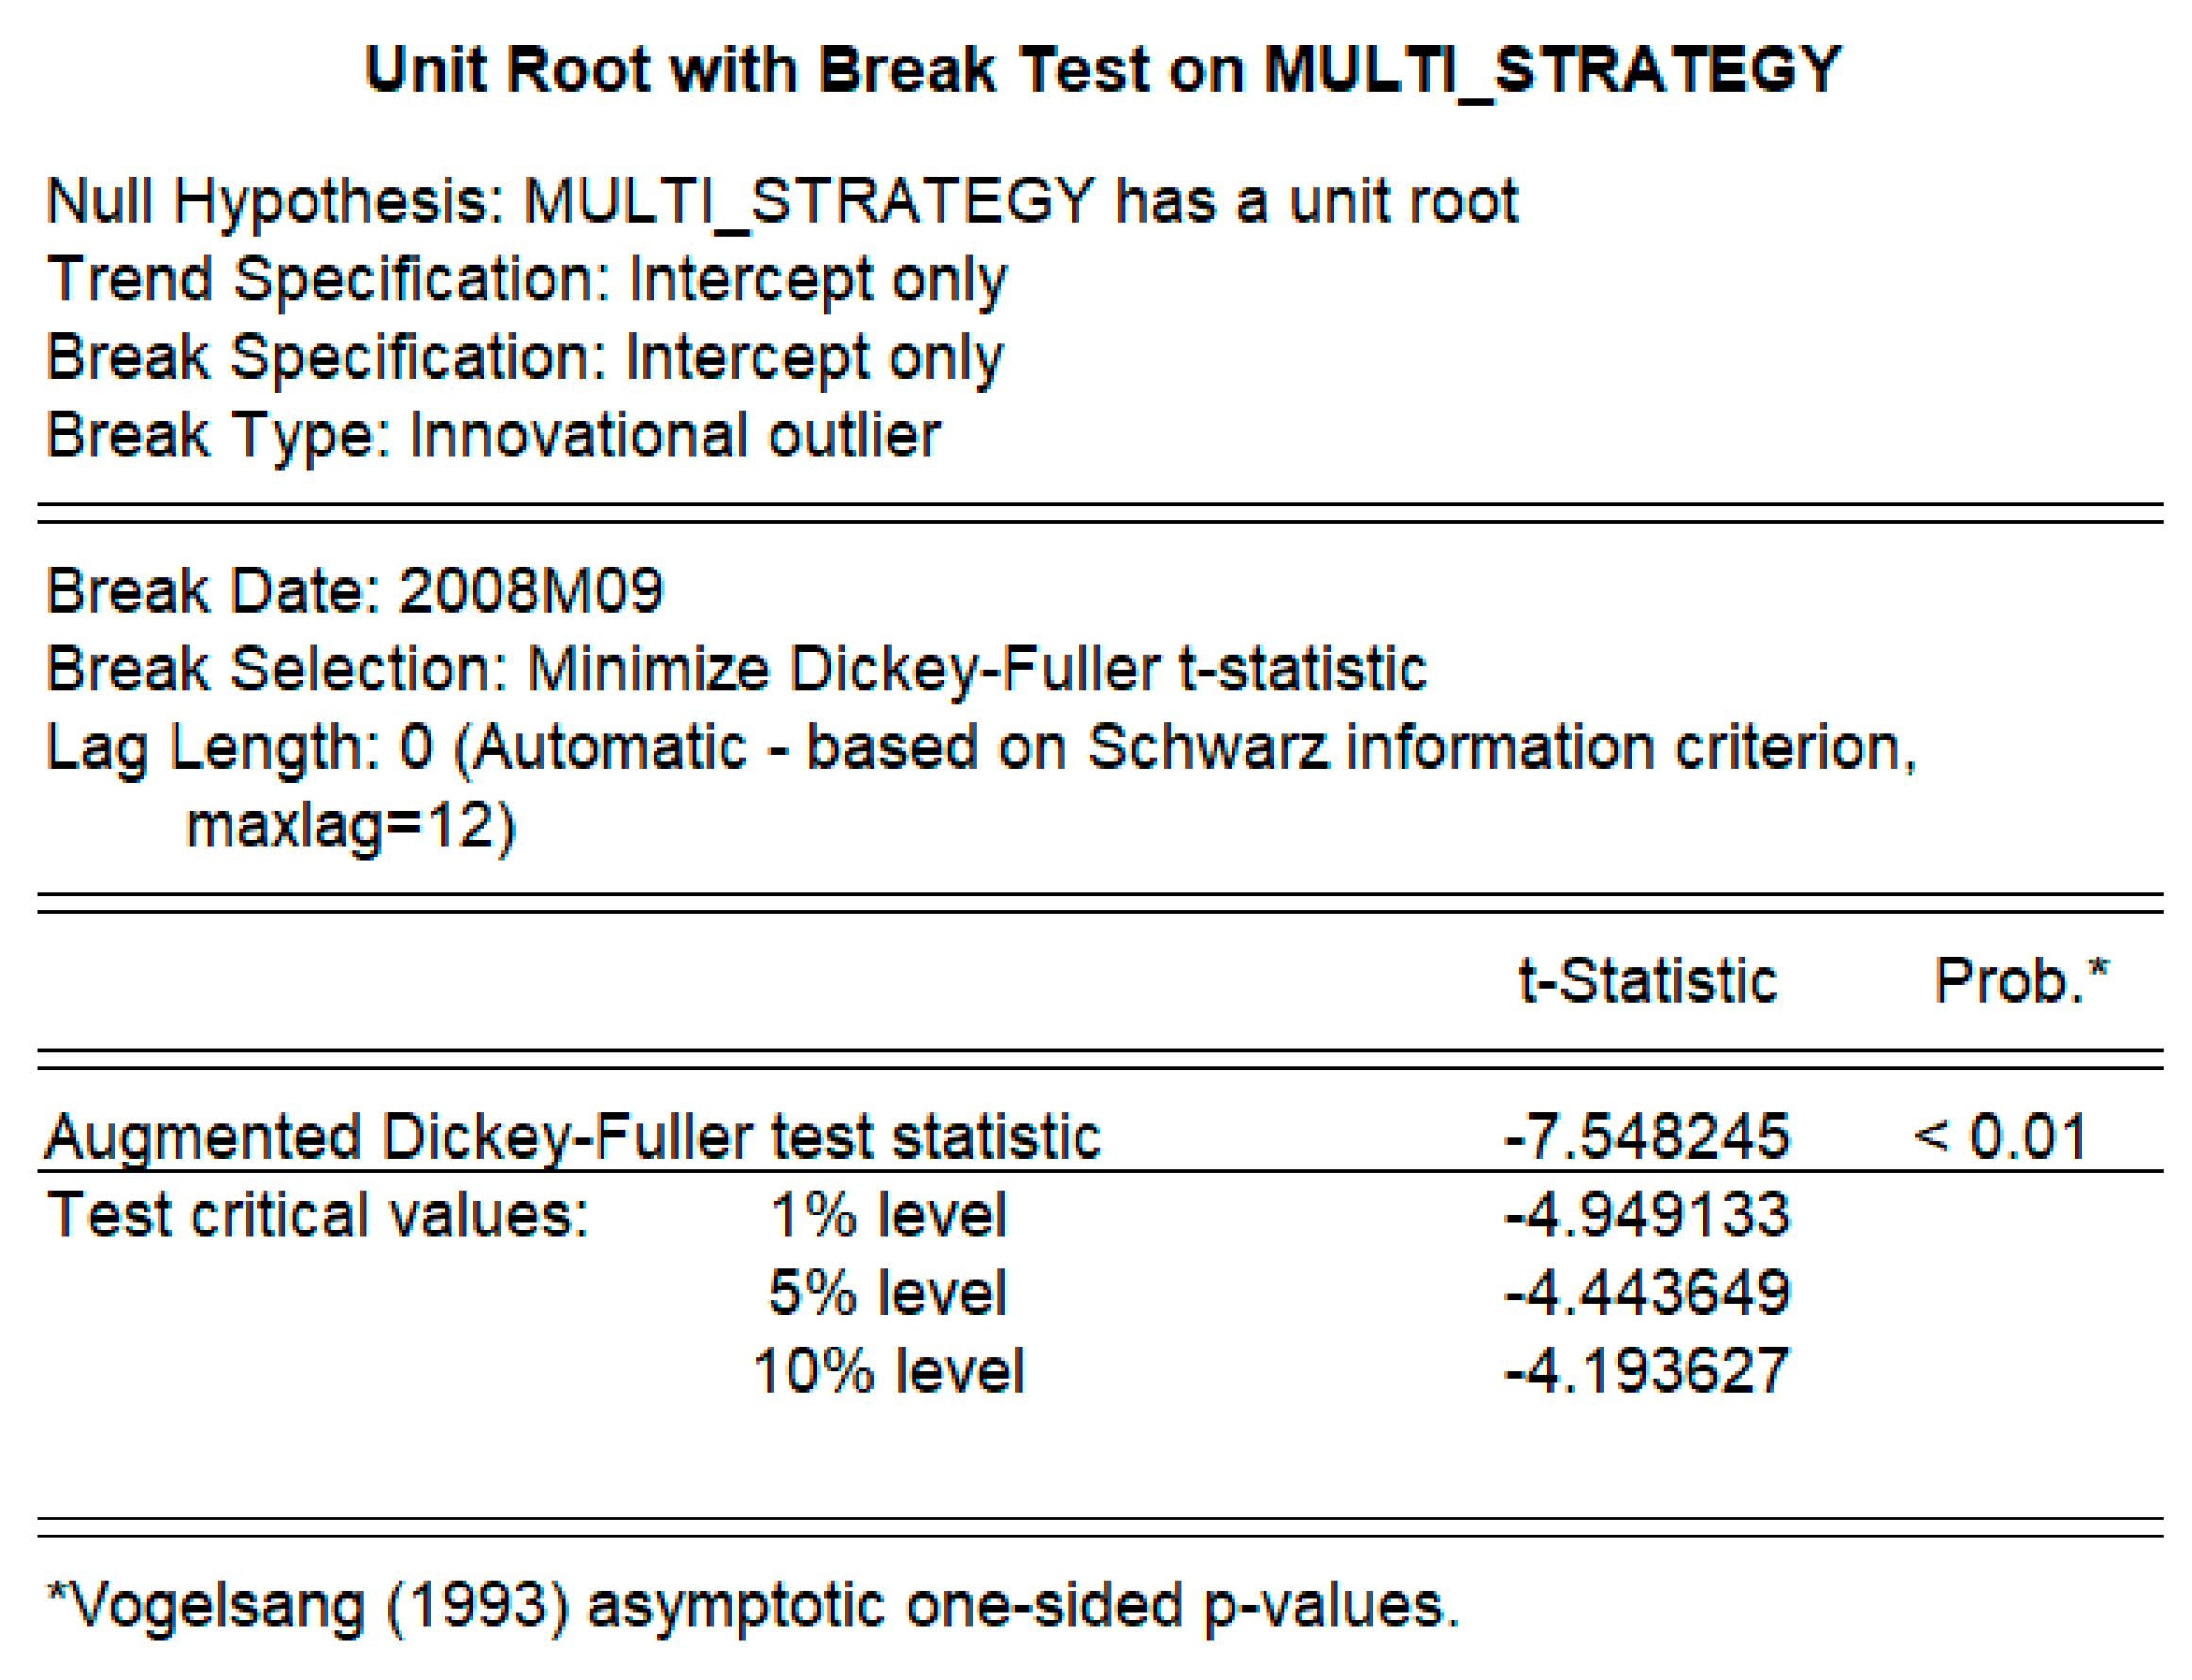
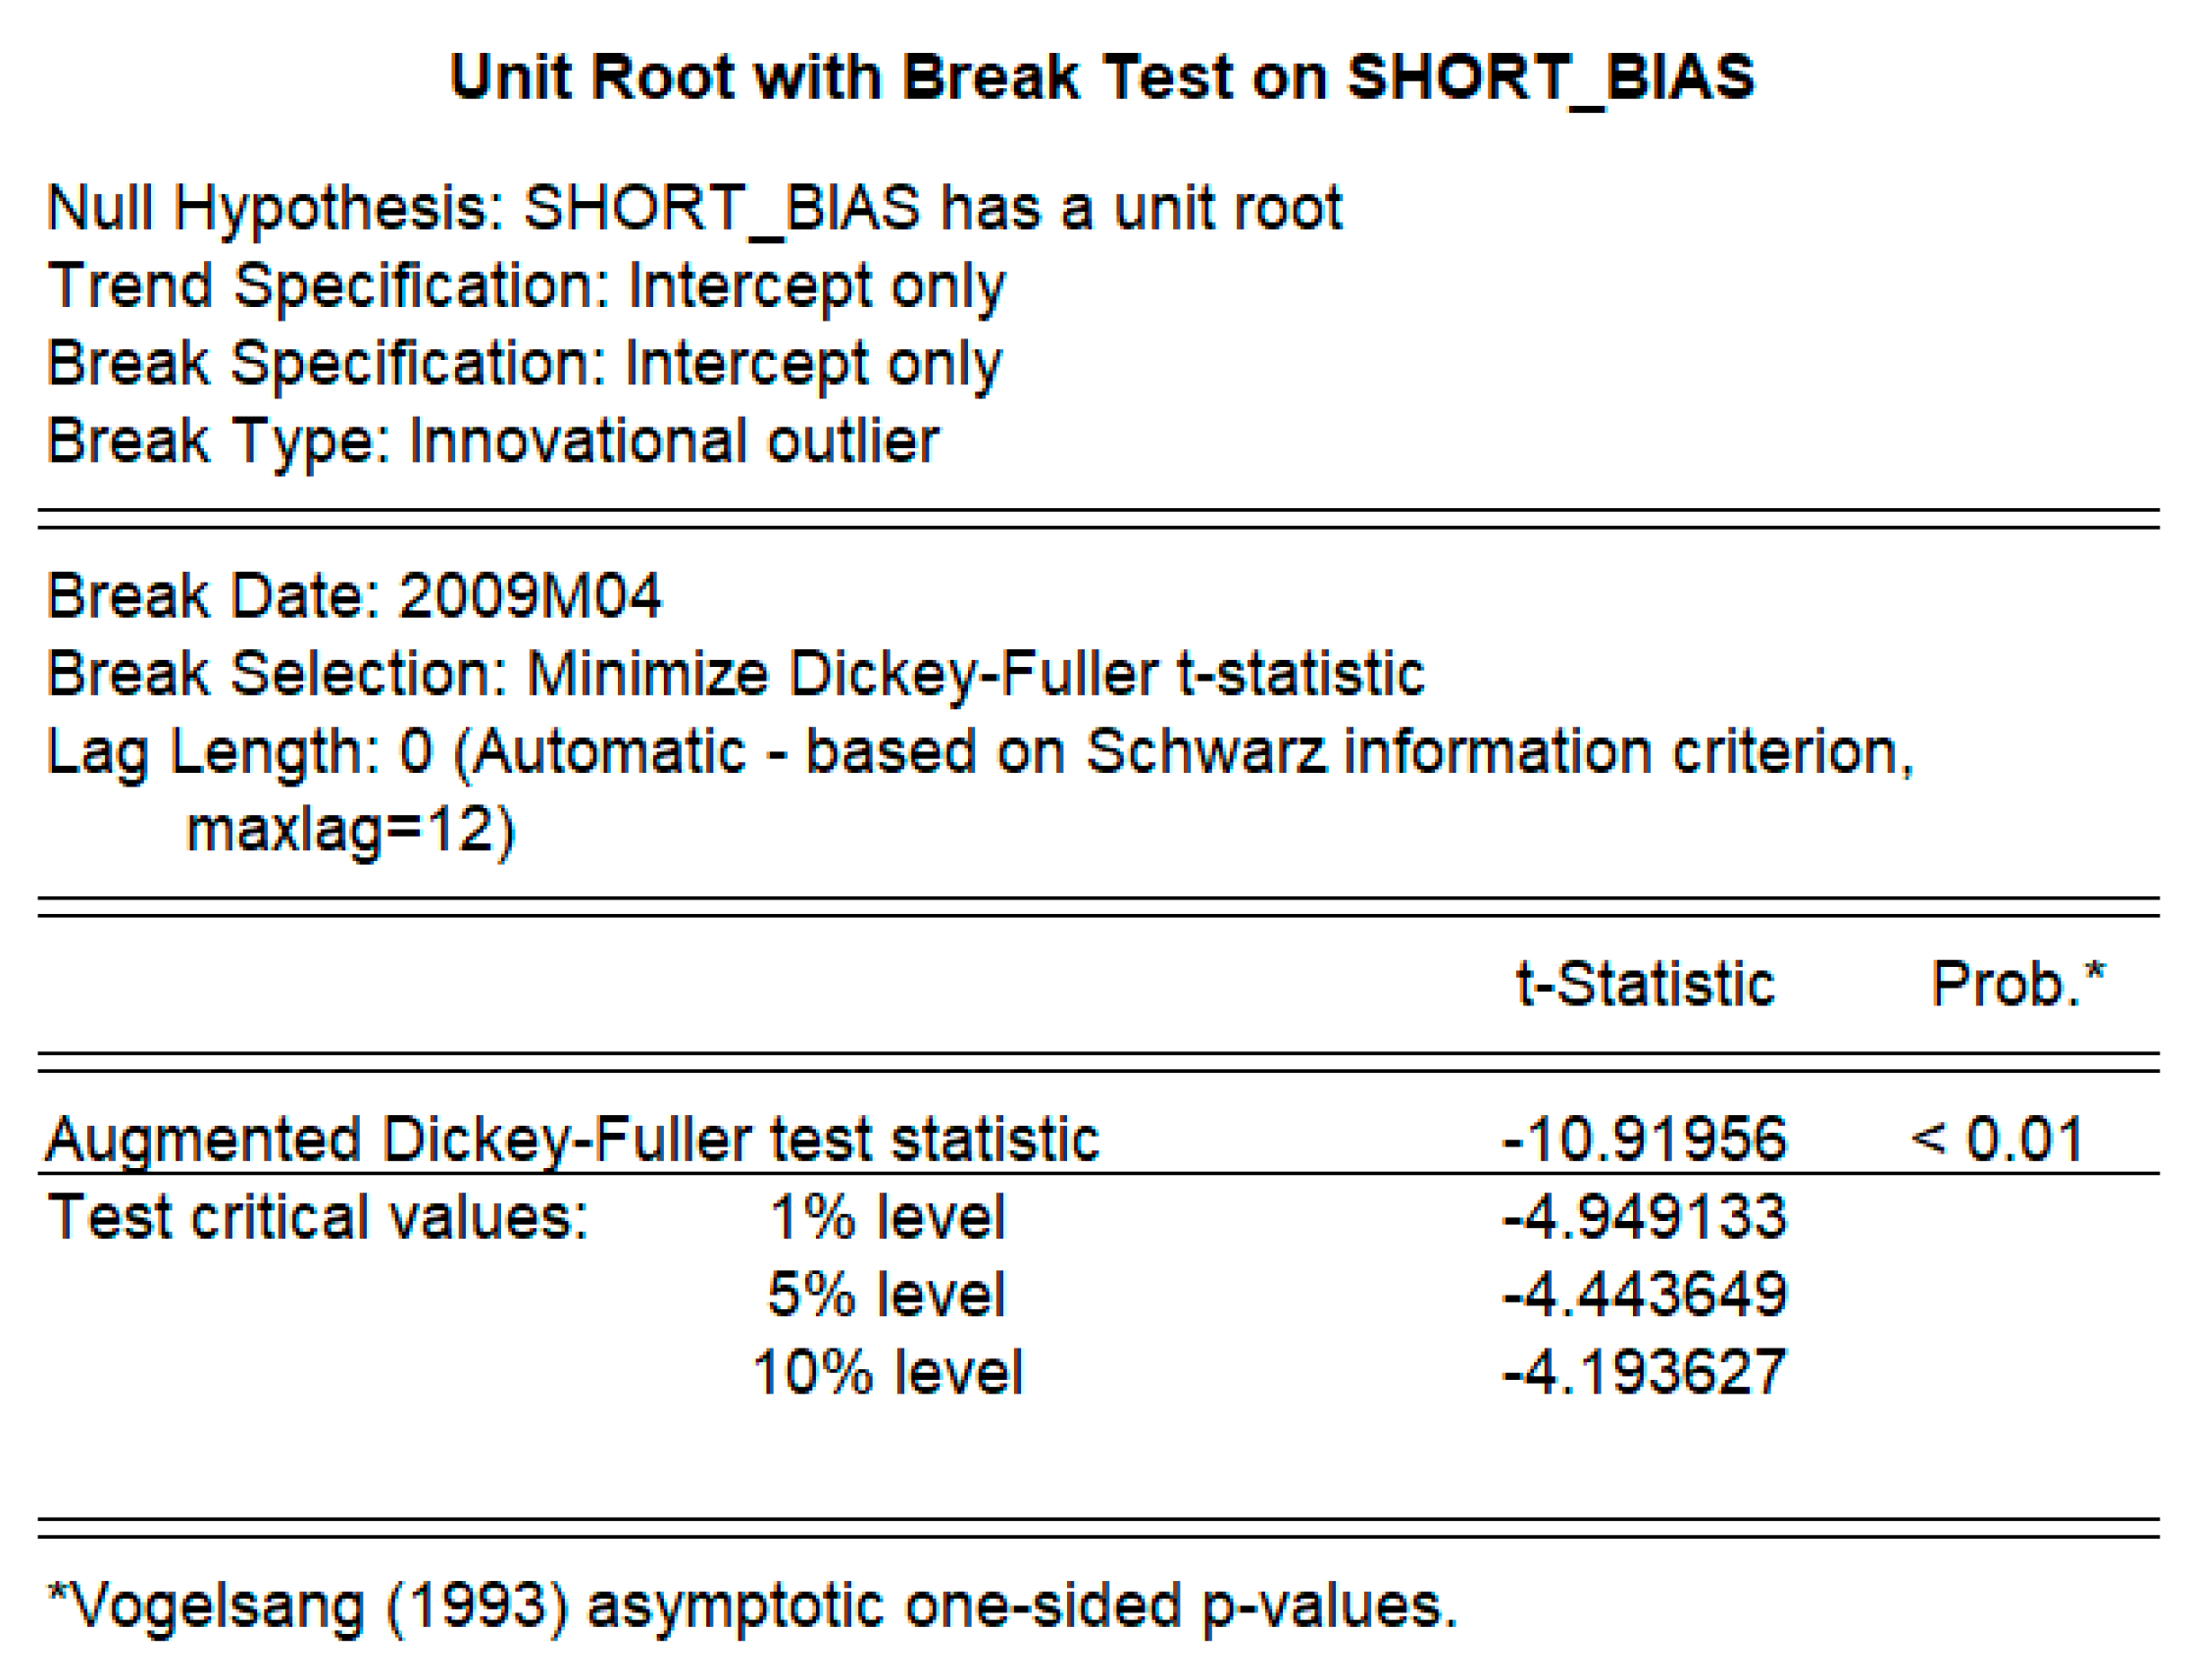
As regressions were to be performed later, the data was first tested for stationarity. Results of the test for the presence of a unit root are summarised in
Table 1 (details
Appendix A). The null hypothesis of a unit root being present in the return series was rejected at the 1% level.
Table 2 below summarises the descriptive statistics on the various hedge fund strategies (10) and the benchmark of S and P 500.
The mean return, standard deviation, median, minimum return and maximum return of each of the ten strategies, is stated in the table above, and can be contrasted with that of the benchmark SP 500 over the whole data period (June 2007–January 2017). The null hypothesis of normality of returns distribution was rejected at the 5% level, for all but two of the strategies (Short Bias and Managed Futures). There was evidence of negative skewness and leptokurtosis (kurtosis > 3), for nine of the eleven series tested.
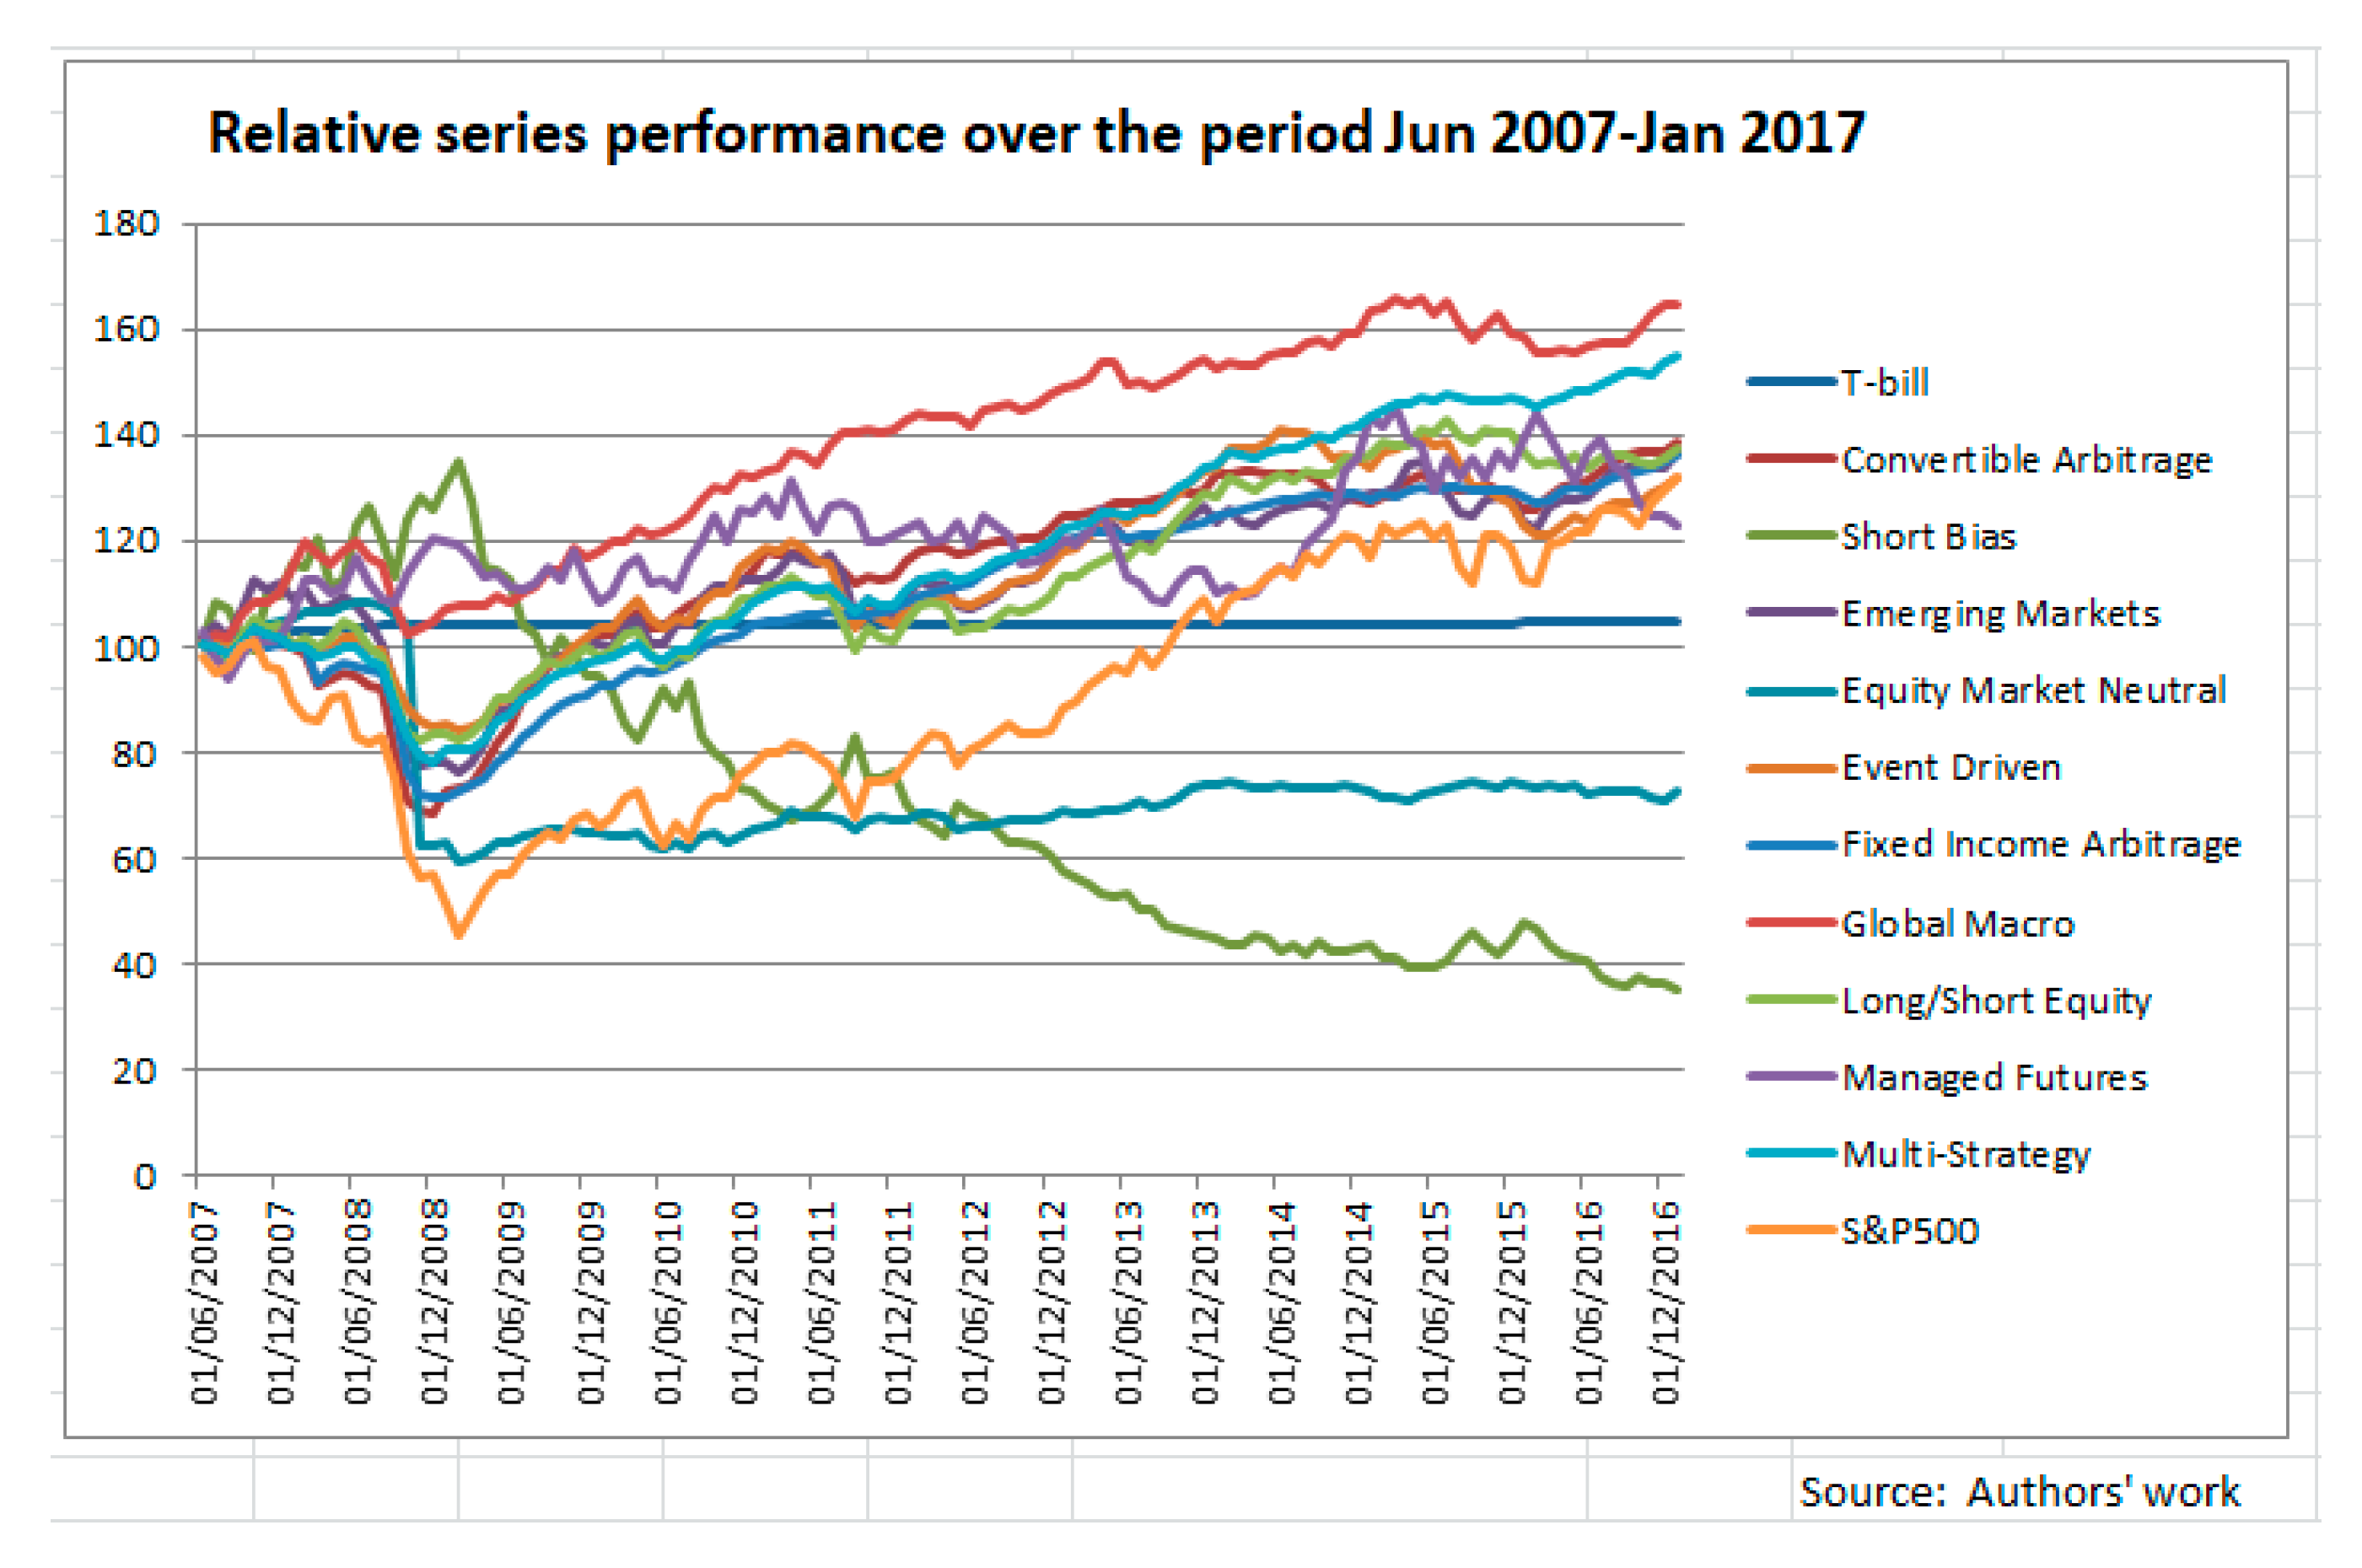
(b) To visualise the performance of the different strategies in the period of the study (June 2007–January 2017), the value of all series on the various strategies, indexed at 100 at the beginning of the series, is plotted below in
Figure 1:
Visual inspection of the performance of the various strategies over the period of 2007–2017, shows that there was a downturn in 2008 and that there were clearly two different periods to analyse—a period of downturn from the middle of 2007, up till the end of the first quarter of 2009, and then on an upturn, up till the first month of 2017. Therefore, it was decided to study the entire period of June 2007 to January 2017, in two split periods (a) crisis period—June 2007–March 2009 (b) after crisis—April 2009–January 2017, and also the whole period.
The gross performance of the various strategies in each period, i.e., a value of
$100 invested in a particular strategy, at the beginning of the period (whole period, during crisis and after crisis) are summarised in
Table 3 below:
- (i)
Over the entire period, seven strategies performed better than the S and P 500: The Global Macro, Multi Strategy, Emerging Markets, Long/Short Equity, Event Driven, Convertible Arbitrage, and the Fixed Income Arbitrage; with Short Bias and Equity Market Neutral and Managed Futures doing much worse than the benchmark S and P 500.
- (ii)
In the crisis period (June 2007–March 2009), the S and P 500 was the worst performer, with an investment of $100 falling down to $49.42; while all the other strategies did better; the best performers being Managed Futures, Global Macro and Short Bias, with values above investment in the risk-free rate.
- (iii)
After the crisis: April 2009–January 2017; the worst performer was Short Bias while the S and P 500 was the best performer with the value of an investment of $100 at the beginning of the after-crisis period rising to $266.85; the next best being Multi Strategy, Convertible Arbitrage and Fixed Income Arbitrage.
To get a detailed overview of the strategies’ performance, in the various periods,
Table 4 contains the mean return and standard deviation in each period.
Table 4 shows that over the whole period, the highest mean return was achieved by Global Macro (0.44%) and Multi Strategy (0.39%), with the S and P 500’s return being the third highest (0.34%). The lowest mean return was generated by the Short Bias strategy (−0.79%). The benchmark and Short Bias strategies exhibited a much higher standard deviation, compared to the other strategies in the sample. The table above gives further insights into the return risk profile of the strategies, during and after the crisis. Again, during the crisis, the benchmark S and P 500 had the lowest mean return and next highest standard deviation, with Short Bias having the highest mean return and third highest standard deviation. In the after-crisis period, Short Bias had the lowest return and highest standard deviation, while the benchmark S and P 500 had the highest return and next highest standard deviation.
Ackermann et al. (
1999) found that hedge funds were riskier than the market indices. These results could not be confirmed by the findings of this study. Over the ten-year period of 2007–2017, the benchmark (and inversely, the Short Bias strategy) had the highest standard deviation and therefore, the highest risk. This was consistent with a study by
Liang and Kat (
2001) who found higher volatility in the market benchmark (S and P 500). He attributed the lower risk of hedge funds to the cross-style diversification. A major area of interest was the correlation of hedge fund strategies with the benchmark S and P 500.
Table 5 sets out the correlation of returns between the various strategies, in the whole period and during and after the crisis.
Three strategies showed a positive correlation above 0.7, over the whole period. During the crisis, two strategies showed a high correlation (>0.7) with the S and P 500 (Emerging Markets and Long/Short Equity). After the crisis, Emerging Markets, Event Driven and Long Short Equity, showed a high positive correlation with the benchmark, while Short Bias showed a high negative correlation. The lowest positive correlations, over the whole period and the benchmark, were Global Macro and Equity Market Neutral; while Short Bias and Managed Futures showed a negative correlation.
Although
Fung and Hsieh (
1997) or
Schneeweis and Spurgin (
1997) found that hedge funds exhibit a low correlation to the benchmark, the findings of this study were different. A test for difference of means in the correlation values, during and after the crisis showed that there was no significant difference (
Appendix B). This meant that some strategies had increased their correlation with the S and P 500 after the crisis, whilst others had decreased, but overall, there was no significant difference. In sum, the results implied that some alternative investments provide diversification and can improve risk-adjusted returns, as stated in the literature.
4.2. Estimating Performance Using Carhart’s Four-Factor Model
The Carhart Four Factor Model was used to analyse performance over all three periods.
Over the entire period (
Table 6), all models estimated were statistically valid with a
p-value of the F statistic < 0.05. Looking at the performance over the whole data set (June 2007–January 2017) in
Table 6, it is obvious that first almost all strategies had a significant positive degree of market risk, the highest being the Emerging Markets (0.47) and the Long/Short Equity (0.46); while Short Bias had a significant negative amount of market risk (−0.69) and Managed Futures were the exception. Only two strategies were able to generate a significant alpha over the whole period. These strategies were Global Macro and Multi Strategy. Both of them have a low significant positive correlation to the market and low significant negative correlation with the HML factor, which measures the return of value stocks, minus that of growth stocks. The negative sign of the HML coefficient shows that the portfolios were short in value stocks and long in growth stocks.
In the crisis period (
Table 7), seven models estimated were found to be statistically valid (
p-value < 0.05), while three were not (Equity Market Neutral, Global Macro and Managed Futures). These strategies show a lack of relationship with the entire market, in this time. During the financial crisis (June 2007–March 2009) period, six strategies (Convertible Arbitrage, Emerging Markets, Event Driven, Fixed Income Arbitrage, Global Macro, Long/Short Equity and Multi Strategy) continued to bear a significant positive amount of market risk, whilst Short Bias had a significant negative amount of market risk (−0.55), and Equity Market Neutral and Managed Futures continued to have an insignificant amount of market risk. None of the ten strategies analysed were able to produce a significant alpha. Moreover, the relationship with the HML factor was significantly negative for many of the strategies (Convertible Arbitrage, Emerging Markets, Event Driven, Fixed Income Arbitrage, Global Macro and Long/Short Equity) showing the negative relationship to the return from Value stocks, compared to the Growth stocks.
In the after-crisis period (
Table 8), all models estimated were statistically valid (
p-value of F statistic < 0.05). The period after the financial crisis (April 2009–January 2017) was characterised by rising market prices. At this stage, almost all strategies had a significant positive amount of market risk (highest being the Long/Short (0.47), followed by the Emerging Markets (0.41)), with Short Bias continuing to have a significant negative amount of market risk (−0.81). Four out of ten strategies were able to generate a significant alpha, during this period (Convertible Arbitrage, Fixed Income Arbitrage, Global Macro and Multi Strategy) with Fixed Income Arbitrage being the highest (0.54%). Two of the strategies with significant positive alphas (Convertible Arbitrage and Fixed Income Arbitrage) had a significant negative UMD coefficient, showing that these strategies had a negative momentum factor—short in winners and long in losers.
Analysis with the Carhart model, yielded several insights. Only two strategies were able to generate significant alphas, over the whole period. These strategies were the Global Macro and Multi Strategy. During the crisis, none of the strategies yielded positive alphas. After the crisis, Global Macro and Multi Strategy continued to show positive alphas. The strategies which were the most successful had low but significant betas. Over the whole period, almost all strategies showed significant amounts of market risk to different degrees (except Short Bias which was significantly negative). The HML factor showed significant negative correlation to the strategies that were able to generate positive alphas, over the whole period, and also during the crisis, implying the underlying portfolio of these strategies were short in value stocks and long in growth stocks. The relationship with the HML factor was significantly negative for many of the other strategies, as well at different times. Although the SMB and UMD factors did not have an explanatory value for the better performing strategies, the SMB factor had a significant negative correlation with Short Bias, over the whole period and after the financial crisis, suggesting this portfolio was short on small stocks and long in large stocks; the UMD factor had a significant positive value for Managed Futures, over the whole period and after the financial crisis, suggesting that these portfolios invest in momentum stocks.
Consistent with the findings of
Capocci (
2002) and
Stoforos et al. (
2016), the study showed no fund manager was able to generate a significant alpha over the crisis period. However, market beta was significant for all strategies, except Equity Market Neutral and Managed Futures, in this period. It meant that the other strategies were not able to completely hedge against the market risk in the crisis period. In the after-crisis period, all strategies had a significant positive market risk, except Short Bias; although the ones with significant alphas also had the lowest market risk.
While the estimations using Carhart’s model afford several insights, they do not provide an overall evaluation of the return versus the risk on the various strategies. Due to this, it is relevant to compare the strategies’ performances using alternative measures, such as persistence in performance and reward-risk payoffs.
4.3. Analysing Performance for Persistence and Its Relationship with Total Performance
(i) Persistent Positive Returns
As stated in previous sections, persistence in performance is an attribute sought after by investors. Here, all eleven strategies were analysed for persistence in positive performance, and the results are presented in
Table 9. The strategies are ranked in ascending order, in the column titled NETPP (Net persistent positive performance), following the procedure explained in the section on methodology.
Fixed Income Arbitrage had the highest rank for persistent performance rate with Multi Strategy being the next, over the whole period; in the crisis period, Global Macro and Equity Market Neutral Managed Futures had the highest rank; in the after-crisis period, Fixed Income Arbitrage had the highest rank, with Multi Strategy being the next. In the columns titled Performance, the strategies were ranked in ascending order, based on the end value of $100 invested at the beginning of the period. In the last row, the rank correlation coefficient was computed and showed a significant positive correlation between persistence in performance and total performance, only in the after-crisis period. Moreover, over the whole period, Global Macro, Multi Strategy, Fixed Income Arbitrage and Convertible Arbitrage had the highest net persistent positive performance (NETPP) and were well above the S and P 500, on this measure.
(ii) Persistent Returns above S&P500
In
Table 10, the net persistent positive performance over the S&P500 is presented. Over a quarterly horizon, none of the strategies had a positive figure for net persistent performance (NETPOS), over the S&P500, either over the whole period or in the after-crisis period; though all strategies had a net persistent performance over the S&P500, during the crisis period.
The analysis showed that rankings on persistence in performance for performance over the benchmark S&P500, had a significant correlation with overall performance of that strategy in the after-crisis period (0.885), near significant correlation (0.721) over the whole period, but not in the crisis period (0.212).
4.4. Analysis of the Risk-Adjusted Performances (Sharpe Ratio) and Actual Performances
At first, the performance of all strategies on the Sharpe ratio, were ranked in ascending order, in the different periods (
Table 11).
Over the whole period, seven strategies had done better than the benchmark S and P 500 (Convertible Arbitrage, Emerging Markets, Event Driven, Fixed Income Arbitrage, Global Macro, Long/Short Equity and Multi Strategy); in the crisis period, all ten strategies did better than the benchmark; finally, after the crisis period, four strategies had done better than the benchmark S and P 500 (Convertible Arbitrage, Fixed Income Arbitrage, Global Macro and Multi Strategy). Of these strategies, the Global Macro and the Multi Strategy were able to outperform the S and P 500, over the whole period.
Unlike
Stoforos et al. (
2016), the findings of the study showed that the mean risk-adjusted return of each strategy was above the mean risk-adjusted return of the benchmark, during the financial crisis. Every strategy was able to outperform the market. This meant that investing in hedge funds rather than the broad equity market (S and P 500) could have saved investors from higher losses.
Although many previous studies have used the Sharpe ratio to evaluate performance (
Ackermann et al. (
1999);
Liang and Kat (
2001)),
Eling and Schuhmacher (
2007), criticised the Sharpe ratio as being inadequate to explain hedge fund performance, as it does not account for hedge funds’ special characteristics. This was also stated by Brooks and Kat (2002),
Amin and Kat (
2003), Mahdavi (2004) and Murguia and Umemoto (2004), on the basis that Hedge fund returns typically have asymmetric distributions.
4.5. Assessment of the Reliability of Alternative Reward-Risk Ratios in Risk-Adjusted Performance Evaluation
Keeping in mind the asymmetry of returns in hedge funds, in the next part of this section, the Sharpe ratio, Upside Potential ratio and the Sortino ratio were compared for all strategies, for the whole period; the crisis period and the after-crisis period, ranked in each period and compared with the overall strategy performance in that period, as a test of reliability of these ratios.
Over the whole period, the Global Macro had the highest Sharpe ratio with Multi Strategy being ranked the next highest. The Sortino ratio ranking was similar and different from the Upside Potential ratio. The rank correlation coefficient showed a significant relationship at the 1% level, with both the Sharpe ratio rankings and the Sortino ratio rankings (
Table 12).
During the crisis period, Short Bias and Managed Futures had, the highest Sharpe and Sortino ratios and, overall, there was a high degree of correlation for all three measures, with the Sortino ratio having the most significant relationship with the overall strategy performances (
Table 13).
In the after-crisis period, Fixed Income Arbitrage had the highest Sharpe ratio, while Convertible Arbitrage had the highest Upside Potential and Sortino ratios. Only the Sharpe and Sortino ratios had a significant correlation with the overall strategy performance, for all periods (
Table 14).
In summary, in all periods, only the Sortino ratio ranking had a significant relationship with the ranking in performances, making it the most reliable ratio. Such results were also confirmed by other researchers (Sortino et al. (2001);
Rosenberg et al. (
2004) and
Scherer (
2004);
Chaudhary and Johnson (
2008)). This emphasised the superiority of the downside risk framework in analysing hedge fund returns.
5. Conclusions
Using a large database of over 9500 hedge funds available from the Hedge Index, performances of ten major strategies, during and after the financial crisis, were investigated in this study. After visual inspection, the ten-year data-sample was divided into two sub-periods (June 2007–March 2009 and April 2009–January 2017) and was analysed for correlations, risk and return, persistence in performance, return attribution using Carhart’s four-factor model (
Carhart 1997) and reward-risk ratios.
Analysis with Carhart’s model, showed that no strategy was able to produce a significant alpha during the financial crisis. It became obvious that the market was not the most efficient during the financial crisis, though it might well have been so, in the after-crisis period when the S and P 500 was the best performer. During the financial crisis, each hedge fund strategy offered risk-adjusted performance that was superior to the S and P 500’s risk-adjusted performance. After the financial crisis, although four strategies (Convertible Arbitrage, Fixed Income Arbitrage, Multi Strategy and Global Macro) were able to outperform the S and P 500, in risk-adjusted terms, in absolute terms, the S and P 500 was the best value performer.
All strategies did better than the benchmark S and P 500, during the crisis, and over the whole period, seven strategies did better than the benchmark S and P 500 (Convertible Arbitrage, Emerging Markets, Event Driven, Fixed Income Arbitrage, Global Macro, Long/Short Equity, Multi Strategy). This meant that, for an investor, it is important to forecast downturns for a continued better performance than the benchmark S and P 500.
All this brings up an evaluation of whether hedge funds deliver better value for investors, which was one of the main aims of the current research. Correlations of various hedge fund strategies with the benchmark S and P 500, showed different behaviour in the during -crisis period versus the after-crisis period; the correlations of Emerging Markets, Equity Market Neutral, Global Macro, Long/Short/Equity and Multi Strategy and Managed Futures, increased in the after-crisis period; the strategies which showed a fall in correlation with benchmark S and P 500 in the after-crisis period, were the Convertible Arbitrage, Fixed Income Arbitrage and the Shortbias. The Carhart Model provided tremendous insights on which strategies generated positive alphas, the extent of market risk, strategies have, or had advantageous attributions to the SML, HML and UMD factors. Strategies which generated significant positive returns were related to a better overall performance, though none of the strategies were able to persistently perform better than the S and P 500, in a rising market. Of the reward-risk ratios, the Sortino ratio appeared to be the most reliable, as strategies ranked in this way, within a downside risk framework were significantly correlated with the ranking of performances of the strategies, either over the whole period, or during or after crisis. In falling markets, Short Selling and Managed Futures had a clear advantage for opportunities of better returns, just as in rising markets, Convertible Arbitrage and Fixed Income Arbitrage do. In rising markets, Managers of these strategies see ‘arbitrage opportunities’ through shorting shares for the related convertible, or locating underpriced bonds, as the yield curve changes are brought on by Central Bank interventions; though, of course, these are still speculative, under the strict definitions of ‘arbitrage’, as they bet on a rising market or increasing interest rates. By definition, Short Selling and Managed Futures result in a better predictable outcome than the benchmark, only in falling markets.
If hedging is about hedging against market risk (i.e., the risk of the S and P 500), all strategies did better than the S and P 500, in the crisis period; thereby, better conserving value for investors over passive investment in the S and P500. Global Macro with its top-down approach, and Multi Strategy, Long/Short Equity and Event Driven, with their active strategies, appeared to be the best performers. Emerging Markets was the fourth best performer over the whole period and also did better than the S and P 500 by offering diversification and risk reduction (higher Sharpe and Sortino ratios in the crisis and whole periods). However, over the whole period, only Global Macro and Multi Strategy had superior performances with positives alphas, and lowest positive correlations with the S and P 500, through active exploitation of opportunities, either in the same or alternative markets than the universe of the S and P 500.
Unlike previous studies, the conclusions of this research are that hedge fund strategies can generate superior returns over passive investments in the Market Portfolio (proxied by the S and P 500), particularly in crisis times, and depend on Investors’ ability to forecast and select the appropriate strategy for that time. Furthermore, the downside risk framework is superior to the conventional one for evaluating reward-risk characteristics of Hedge Fund strategies.
6. Limitations and Further Research
The current research was done using the Hedge Index data base of over 9500 funds. These data agglomerated the performances of many individual hedge funds within the 9500 fund base and classified them by strategy. This raised the issue of caution in generalising results. Within each strategy, there are Managers who are better-performing or worse-performing than the average performer in that strategy. Again, with globalisation on the increase every year, it can be expected that correlations between markets will increase. So, it would be useful to micro-analyse individual hedge fund performances for more insights into what contributed to their particular performance. Analysis of hedge fund performance in different crisis scenarios, like the crisis in 1929 or the Asian crisis in 1997, also helps. By comparing the results in each crisis, it would be possible to find patterns and filter out strategies that can offer superior performance, in each crisis scenario. Furthermore, simulations for possible future crisis scenarios could be made to investigate how the strategies would perform. This is important, since past performance might not be a good indicator for future performance, especially in turbulent crisis scenarios.


