“After End-2008 Structural Changes in Containership Market” and Their Impact on Industry’s Policy
Abstract
:1. Introduction
2. Aim of the Paper
3. Structure of Paper
4. Literature Review
5. Data Used and Methodology Adopted
6. An Overall Picture of the CM
6.1. Scrapping
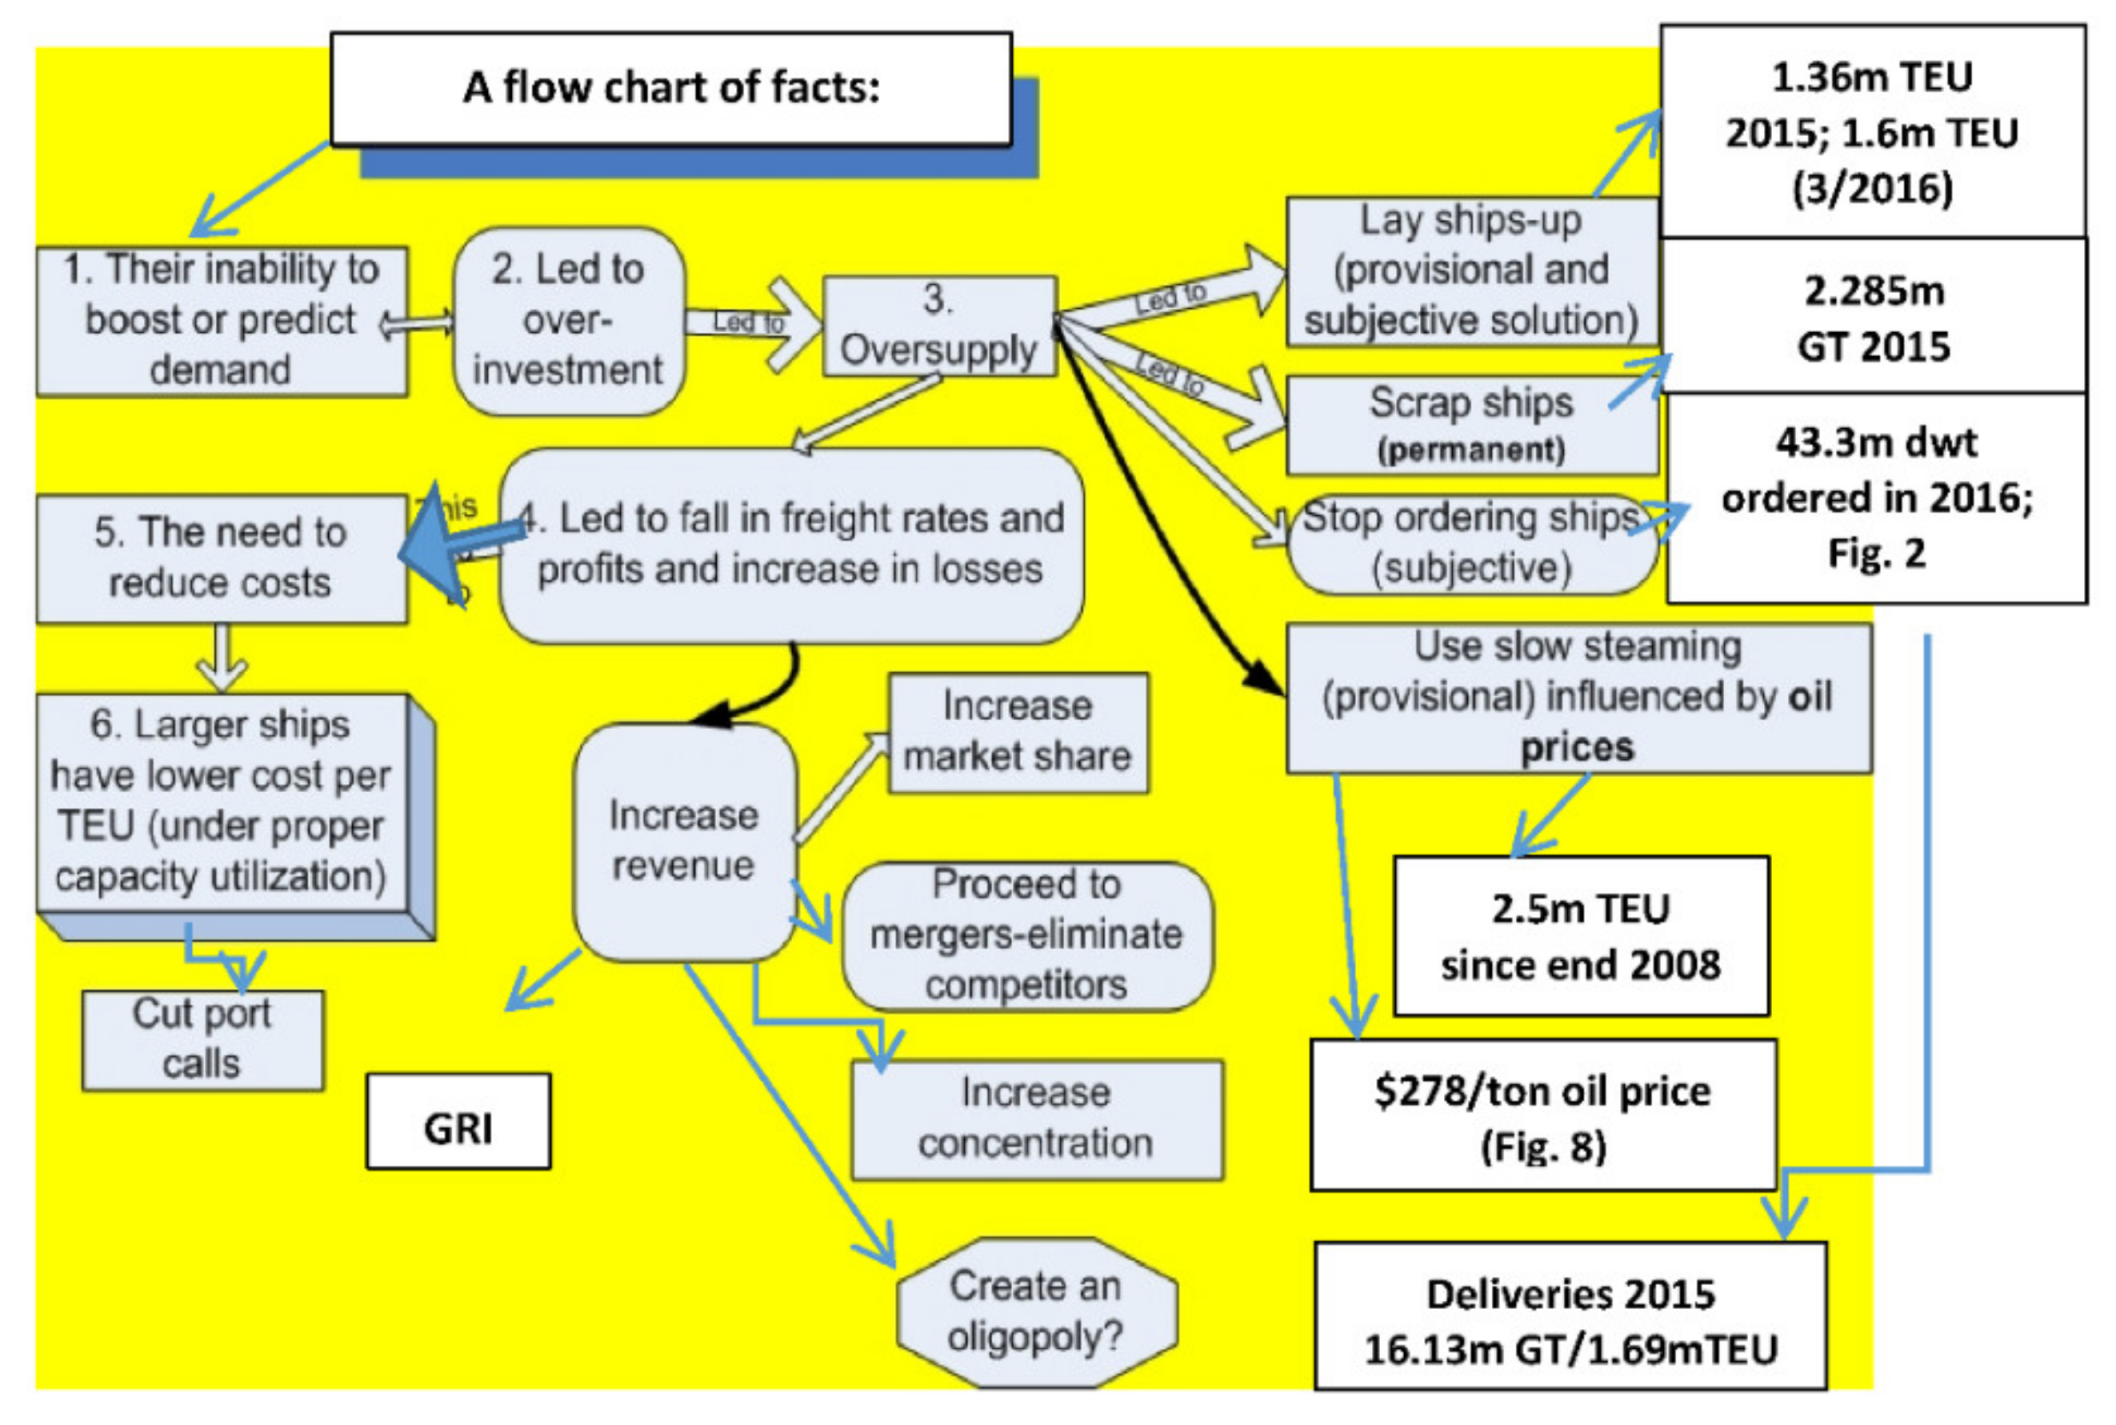
6.2. Lay-Up and SS
7. Imbalance of Demand and Supply
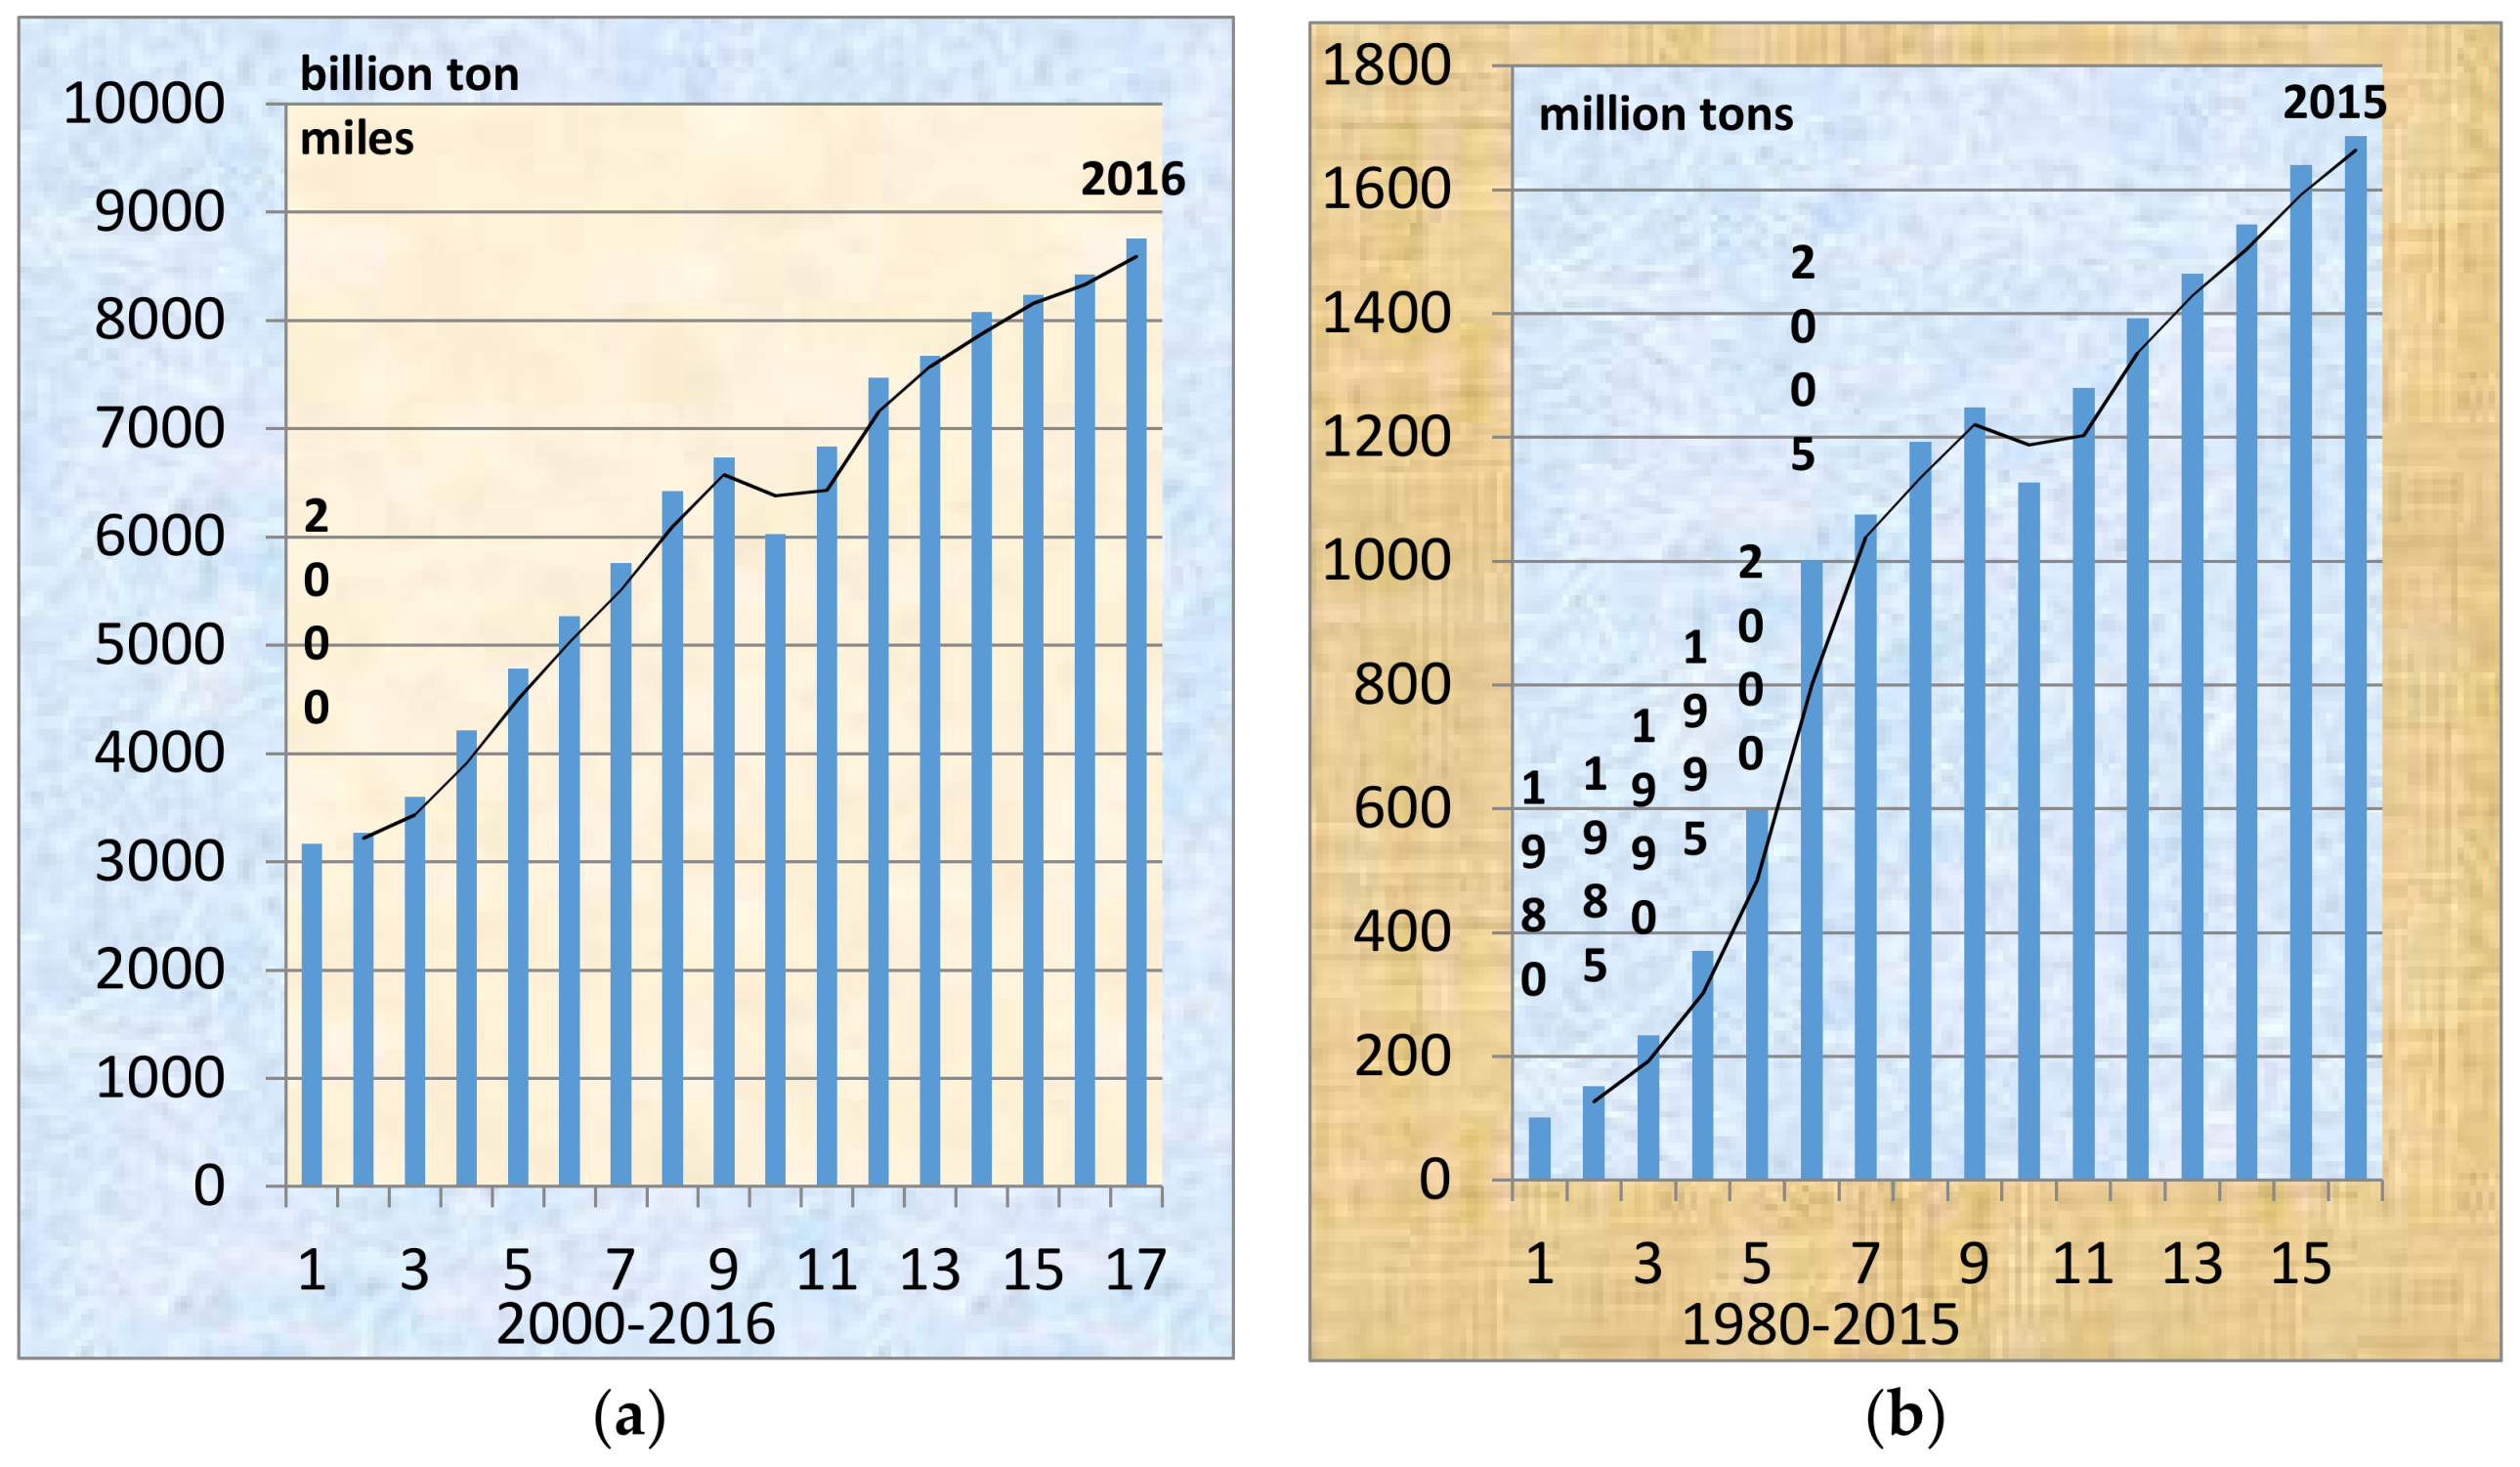
7.1. Value of Containerized Trade
7.2. Volume of Containerized Trade
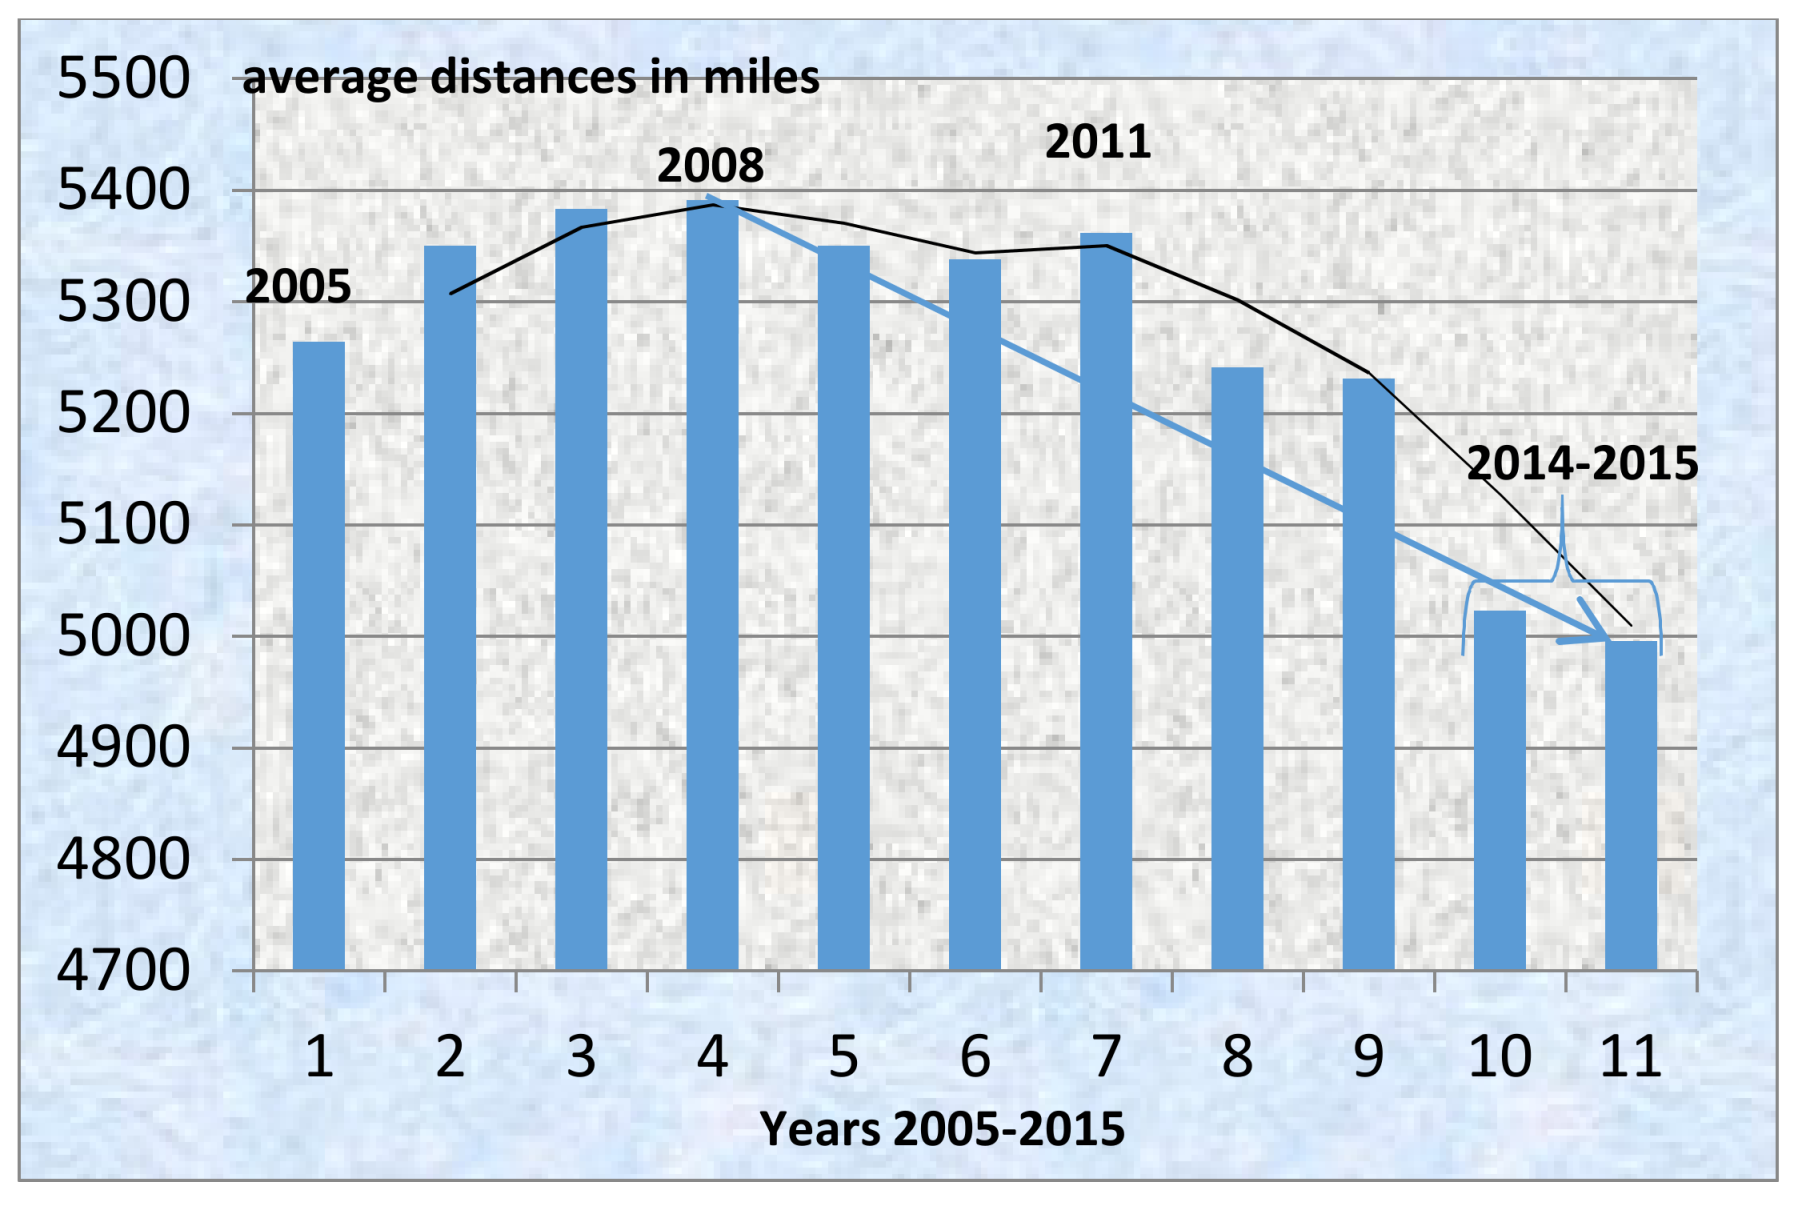
7.3. Distances
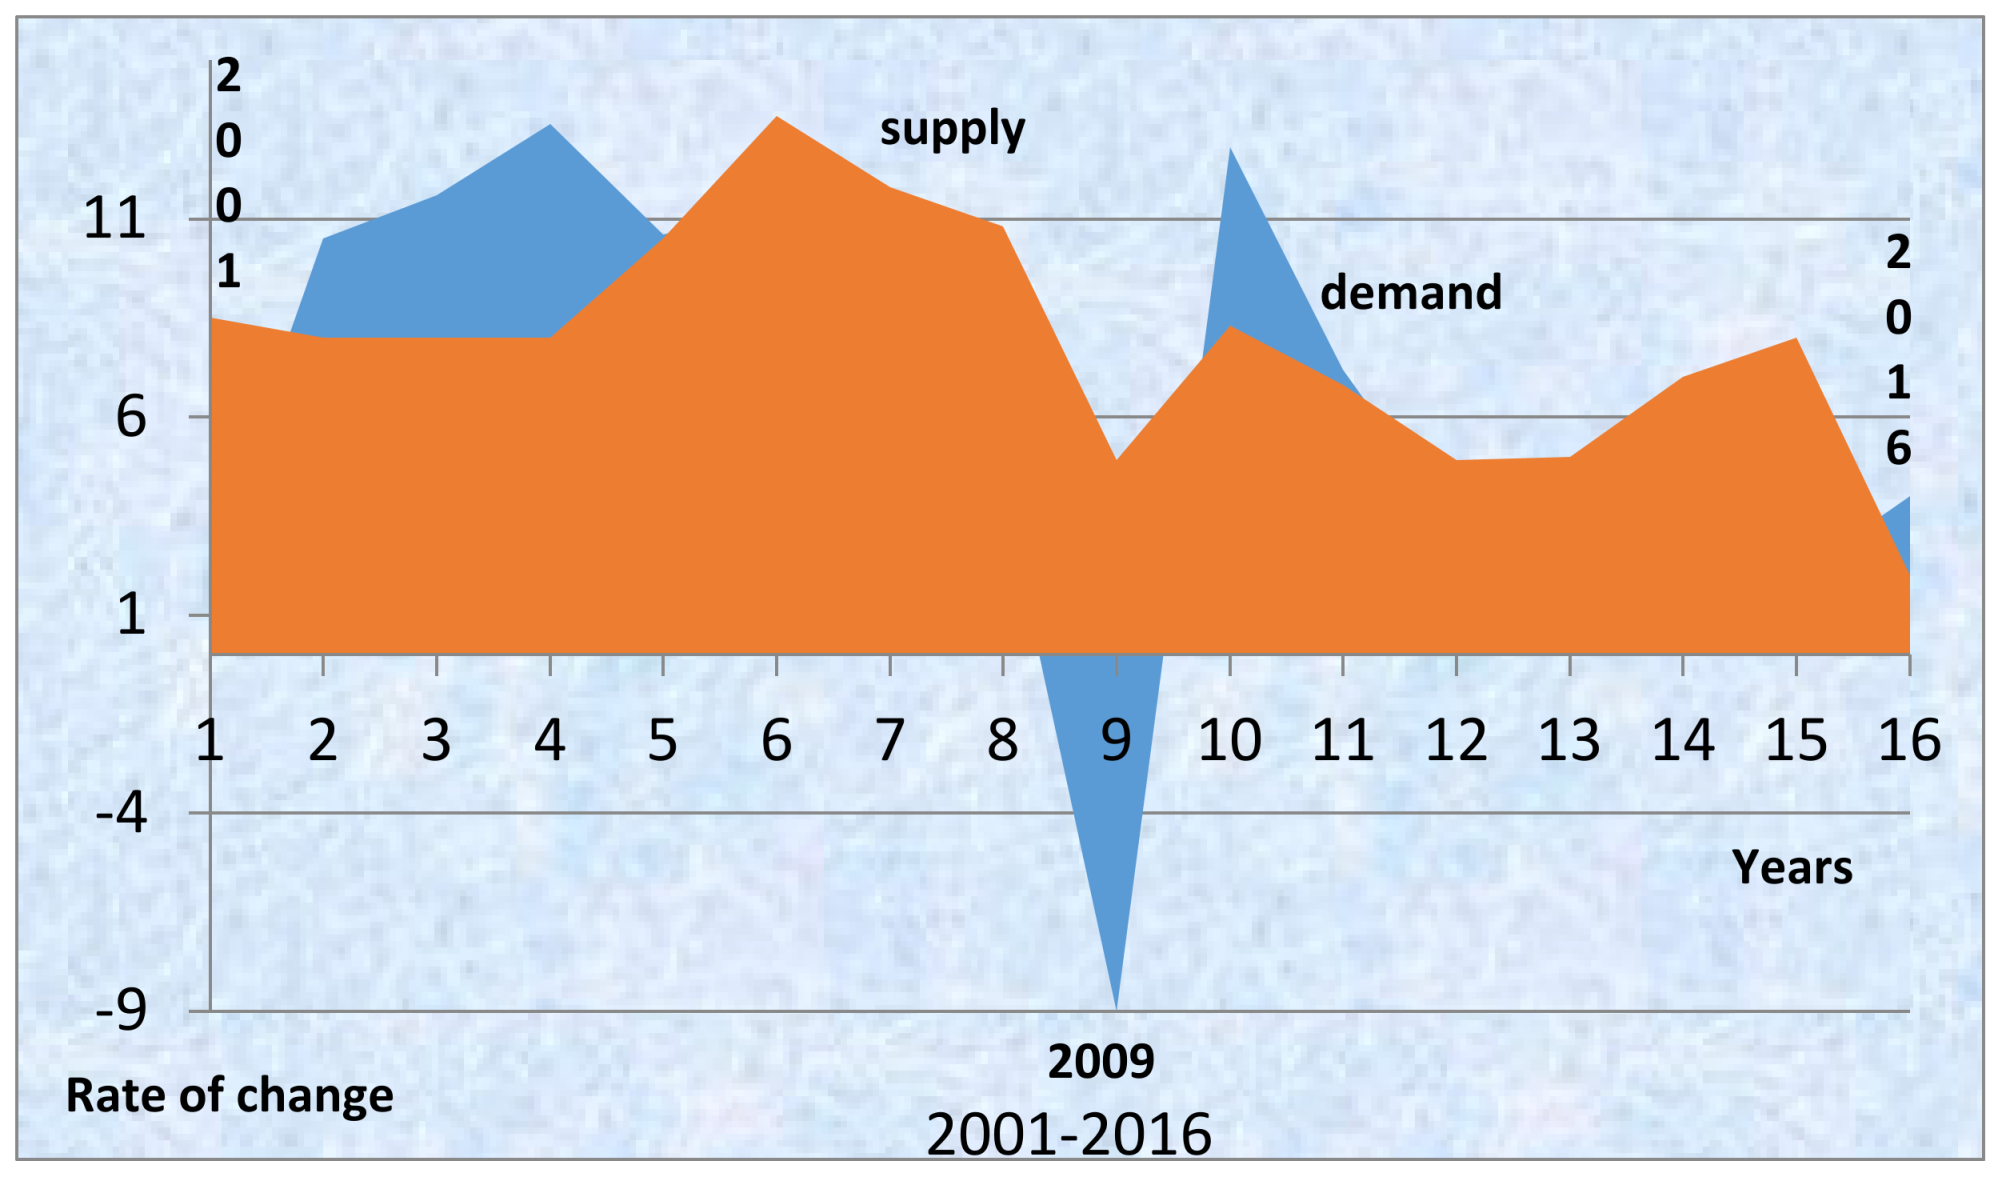
7.4. Balance of Supply and Demand
8. Strategy of Economies of Scale during a Depression
8.1. Apparent Paradox
8.2. Economies of Scale (ES)
8.3. Costs Due to Size
9. Market Structure of CM
9.1. Is CM Contestable?
9.2. Can “Concentration” Help Containership Companies’ Profits?
9.3. The Herfindahl Index51
9.4. Lerner’s Index
10. Managing the Costs of Operation
11. A Model of Oligopoly66 and… Competition
12. Conclusions
Conflicts of Interest
Appendix A. Lerner’s index
References
- Bae, Min Ju, Ek Peng Chew, Loo Hay Lee, and Anming Zhang. 2013. Container transshipment and port competition. Maritime Policy & Management 40: 479–94. [Google Scholar]
- Baumol, William J., John C. Panzar, and Robert D. Willig. 1982. Contestable Markets and the Theory of Industrial Structure. New Yore: Harcourt Brace Jovanovich. [Google Scholar]
- Besanko, David, David Dranove, Mark Shanley, and Scott Schaefer. 2013. Economics of Strategy, 6th ed. Hoboken: Wiley. [Google Scholar]
- Borenstein, Severin. 1989. Hubs and high fares: Dominance and market power in the US Airline industry. Rand Journal of Economics 20: 344–65. [Google Scholar] [CrossRef]
- Chamberlin, Edward H. 1933. The Theory of Monopolistic Competition. Cambridge: Harvard University Press. [Google Scholar]
- Cullinane, Kevin, and Paul Tae-Woo Lee. 2002. Contemporary research in global shipping and logistics. Maritime Policy & Management 29: 203–8. [Google Scholar]
- Dixit, Avinash. 1979. A model of duopoly suggesting a theory of entry barriers. Bell Journal of Economics 9: 1–17. [Google Scholar] [CrossRef]
- Drewry Shipping Consultants Ltd. 2010. Container Forecaster, 2Q 2010, Quarterly Forecasts of the Container Market. London: Drewry Shipping Consultants Ltd. [Google Scholar]
- Ducruet, César, Theo Notteboom, Daniele Ietri, Arnaud Banos, and Céline Rozenblat. 2010. Structure and dynamics of liner shipping networks. Paper presented at IAME Conference, Lisbon, Portugal, July 7–9. [Google Scholar]
- Ferrari, Claudio, Francesco Parola, and Alessio Tei. 2015. Determinants of slow steaming and implications on service patterns. Maritime Policy & Management 42: 636–52. [Google Scholar]
- Furuichi, Masahiko, and Natsuhiko Otsuka. 2015. Proposing a common platform of shipping cost analysis of the Northern Sea Route and the Suez Canal Route. Maritime Economics & Logistics 17: 9–31. [Google Scholar]
- Fusilo, Mike. 2003. Excess capacity and entry deterrence: the case of ocean liner shipping markets. Maritime Economics & Logistics 5: 100–15. [Google Scholar]
- Gharehgozli, Amir, Joan P. Mileski, and Okan Duru. 2017. Heuristic estimation of container stacking and reshuffling operations under the containership delay factor and mega-ship challenge. Maritime Policy & Management 44: 373–91. [Google Scholar]
- Goulielmos, Alexander M. 2017. Containership market: A comparison with Bulk Shipping & a proposed Oligopoly model. SPOUDAI-Journal of Economics and Business 67: 47–68. [Google Scholar]
- Hirshleifer, Jack, and Amihai Glazer. 1992. Price Theory and Applications, 5th ed. Upper Saddle River: Prentice Hall Int., ISBN 0-13-721671-8-p. [Google Scholar]
- Holloway, Stephen. 2003. Straight and Level: Practical Airline Economics, 2nd ed. Farnham: Ashgate. [Google Scholar]
- Jacobson, David, and Bernadette Andréosso-O’Callaghan. 1996. Industrial Economics and Organization: A European Perspective. London: McGraw-Hill, ISBN 0-07-707889-6. [Google Scholar]
- Koopmans, Tjalling Charles. 1939. Tanker Freight Rates and Tankship Building. Haarlem: De Erven F. Bohn. [Google Scholar]
- Kou, Ying, and Meifeng Luo. 2016. Strategic capacity competition and overcapacity in shipping. Maritime Policy & Management 43: 389–406. [Google Scholar]
- Lam, Jasmine S. L., Wei Yim Yap, and Kevin Cullinane. 2007. Structure, conduct and performance on the major liner shipping routes. Maritime Policy & Management 34: 359–81. [Google Scholar]
- Lin, Dung-Ying, Chien-Chih Huang, and ManWo Ng. 2017. The coopetition game in international liner shipping. Maritime Policy & Management 44: 474–95. [Google Scholar]
- Lorange, Peter. 2009. Shipping Strategy: Innovating for Success. Cambridge: Cambridge University Press, ISBN 978-0-521-76149-9. [Google Scholar]
- Maloni, Michael, Jomon Aliyas Paul, and David M. Gligor. 2013. Slow steaming impacts on ocean carriers and shippers. Maritime Economics & Logistics 15: 151–71. [Google Scholar]
- Martin, Stephen. 2010. Industrial Organization in Context. Oxford: Oxford University Press, ISBN 978-0-19-929119-9. [Google Scholar]
- Munim, Ziaul Haque, and Hans-Joachim Schramm. 2016. Forecasting container shipping freight rates for the Far East-Northern Europe trade lane. Maritime Economics & Logistics 19: 106–25. [Google Scholar]
- Niamié, Octave, and Olivier Germain. 2014. Strategies in Shipping Industry: A Review of “Strategic Management” Papers in Academic Journals. ESG UQAM. Quebec City: University of Quebec. [Google Scholar]
- Notteboom, Theo E. 2002. Consolidation and contestability in the European container handling industry. Maritime Policy & Management 29: 257–69. [Google Scholar]
- Reid, Walter, and David Roderic Myddelton. 2005. The Meaning of Company Accounts, 8th ed. Gower: Gower Pub Co., ISBN 0-566-08660-3. [Google Scholar]
- Robinson, Joan. 1933. The Economics of Imperfect Competition. London: Macmillan. [Google Scholar]
- Sanchez, Ricardo, and Lara Mouftier. 2016. The Puzzle of Shipping Alliances in July, 2016. Port Economics. Bergamo: IAME. [Google Scholar]
- Song, Dong-Wook, and Photis M. Panayides. 2002. A conceptual application of cooperative game theory to liner shipping strategic alliances. Maritime Policy & Management 29: 285–301. [Google Scholar]
- Spence, A. Michael. 1977. Entry, capacity, investment and oligopolistic pricing. Bell Journal of Economics 8: 534–44. [Google Scholar] [CrossRef]
- Strandenes, Siri Pettersen. 2012. Maritime Freight Markets. In The Blackwell Companion to Maritime Economics, 1st ed. Edited by Wayne K. Talley. Hoboken: Blackwell Publ. Ltd. [Google Scholar]
- Sys, Christa. 2009. Is the container liner shipping industry an oligopoly? Transport Policy 16: 259–70. [Google Scholar] [CrossRef]
- Sys, Christa, Hilde Meersman, and Eddy Van De Voorde. 2011. A non-structural test for competition in the container liner shipping industry. Maritime policy & Management 38: 219–34. [Google Scholar]
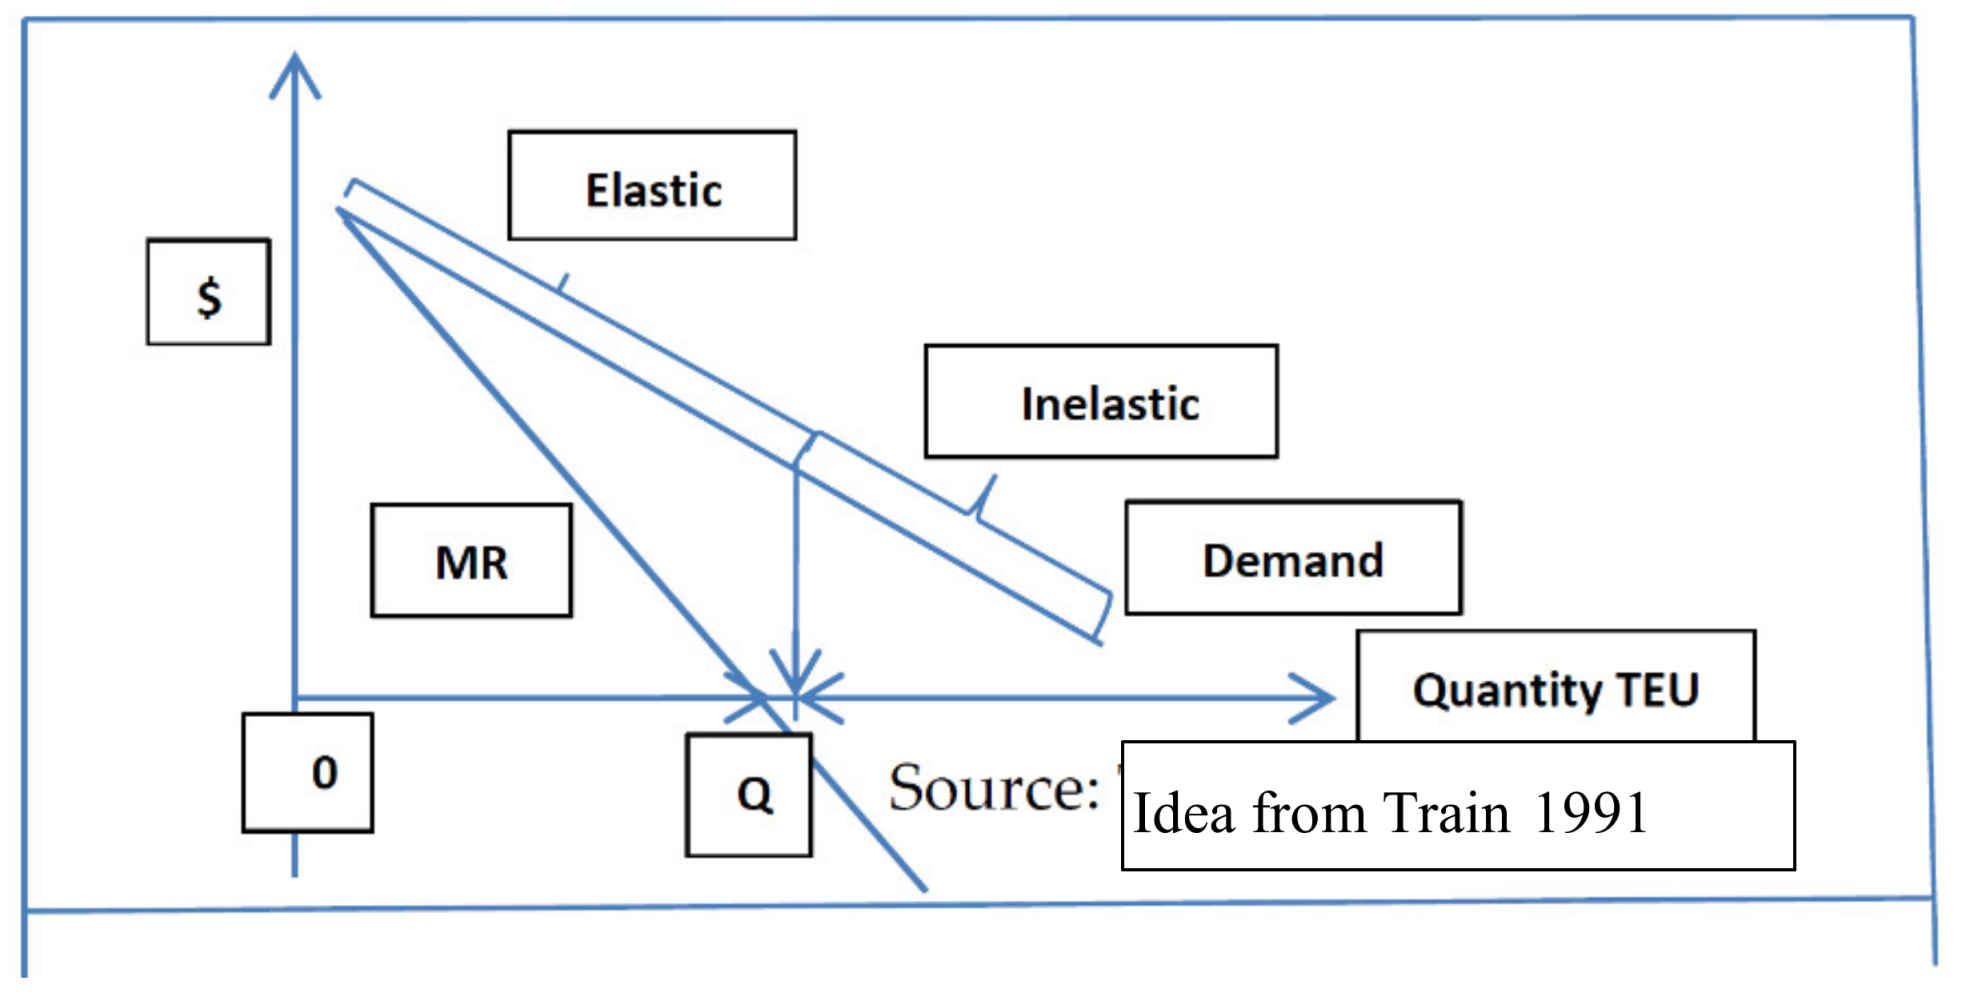
- Train, Kenneth E. 1991. Optimal Regulation: The Economic Theory of Natural Monopoly. Cambridge: The MIT Press, ISBN 0-262-20084-8. [Google Scholar]
- The United Nations Conference on Trade and Development (UNCTAD). 2016. Maritime Transport Review. Geneva: UNCTAD. [Google Scholar]
- US Department of Justice. 2006. The Herfindahl-Hirschman Index. Available online: www.usdoj.gov/atr/public/testimony/hhi.htm (accessed on 20 September 2017).
- Wang, Shuaian, Zhiyuan Liu, and Xiaobo Qu. 2017. Weekly container delivery patterns in liner shipping planning models. Maritime Policy & Management 44: 442–57. [Google Scholar]
| 1 | A branch of maritime microeconomics covering ports, ships, and shipbuilding. |
| 2 | Sys (2009) mentioned four sources (1991–2003). The last one, in 2003, was from the Japanese shipowners association: “Comments on consultation paper of council regulation 4056/1986” http://www.jsanet.or.jp/e/. |
| 3 | Game theory applied to industrial organization by Spence (1977) and Dixit (1979) to model the conduct of firms. By 1996 appeared in almost all journals. In 2002 appeared in maritime journals. It also appeared in IAME conferences since 1999 (Halifax; Santiago de Chile; Taipei). Kou and Luo (2016) mentioned another 6 maritime papers and one PhD (in Singapore)—between 1989 and 2013—using game theory; one appeared also in maritime journals (Fusilo 2003). |
| 4 | This lower quality understood by certain carriers, who tried to preserve regularity by bypassing smaller ports and/or by adding additional ships (e.g., COSCO). |
| 5 | Structure-conduct-performance. |
| 6 | On: “Transpacific”; “Europe-Far East” and “Trans-Atlantic” trade routes. |
| 7 | A.P. Moller-Maersk tried (end-2006) to boost profitability, at the expense of a larger market share, abandoning a “Transpacific” route (Lorange 2009). Many liner operators did this. The “Far East–Europe” route was considered most profitable. |
| 8 | Goulielmos (2017) confirmed this. |
| 9 | Fewer calls indicate higher concentration over ports; this is shown by “port production” per carrier (Goulielmos 2017). |
| 10 | Maersk Line stated that the fuel cost represented 50% of the total in May, 2008, while a few years prior, this was only 10% (Lorange 2009). |
| 11 | Average freight rates fell, after April 2008, from a high ~$1700 to ~$1400 in April 2009 for Trans-Atlantic; from ~ $1550 to ~$1100 for Transpacific and from ~$1400 to ~$1180 for Far-East–Europe (Ferrari et al. 2015). |
| 12 | One should not be surprised by lower profits given the rationality of game theory (prisoner’s dilemma). |
| 13 | This is a “cooperative competition” based on game theory (J.F. Nash in 1944). |
| 14 | It started this strategy with the 3E https://www.maersk.com/en/explore/fleet/triple-e, Evergreen, 2008. |
| 15 | Seaspan ordered 42 containerships in 2008 of an estimated value of $3.9b, at higher prices. Other independents were: Peter Dohle, MPC Group, C.P. Offen, Nord capital, B. Rickmers, and others. |
| 16 | The motives of Independents were: to expand fleet, have a steady cash flow, and achieve advantageous finance terms (from lenders and equity markets) (Lorange 2009). |
| 17 | |
| 18 | On data available. Term used by UNCTAD. |
| 19 | Given that the liner freight rate was ~10%—on average—on the value of cargo transported, carriers should have earned €684b revenue in 2015. This % has been calculated from data coming from UNCTAD on ratios of liner freight rates to prices of about 10 selected commodities in 1975, 1990 and 2015. The €/$ exchange rate at the end of 2014 was 1.21. |
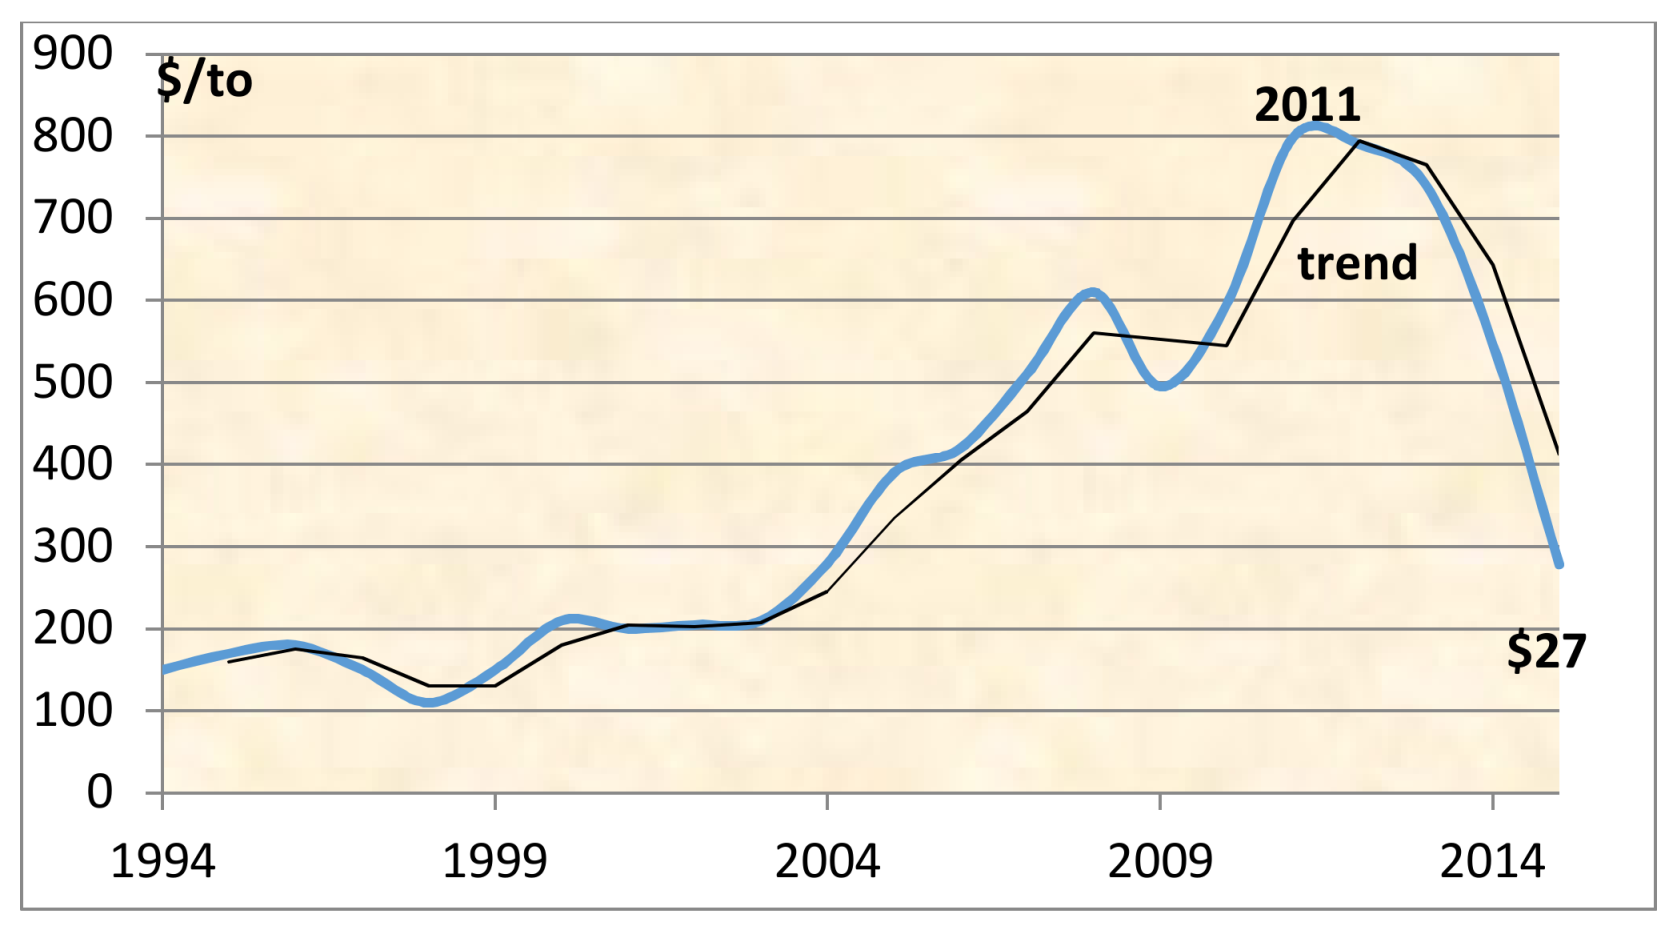
| 20 | According to our experience from bulk trades a shipowner needs a maximum of 3 years to be convinced to lay a ship up. |
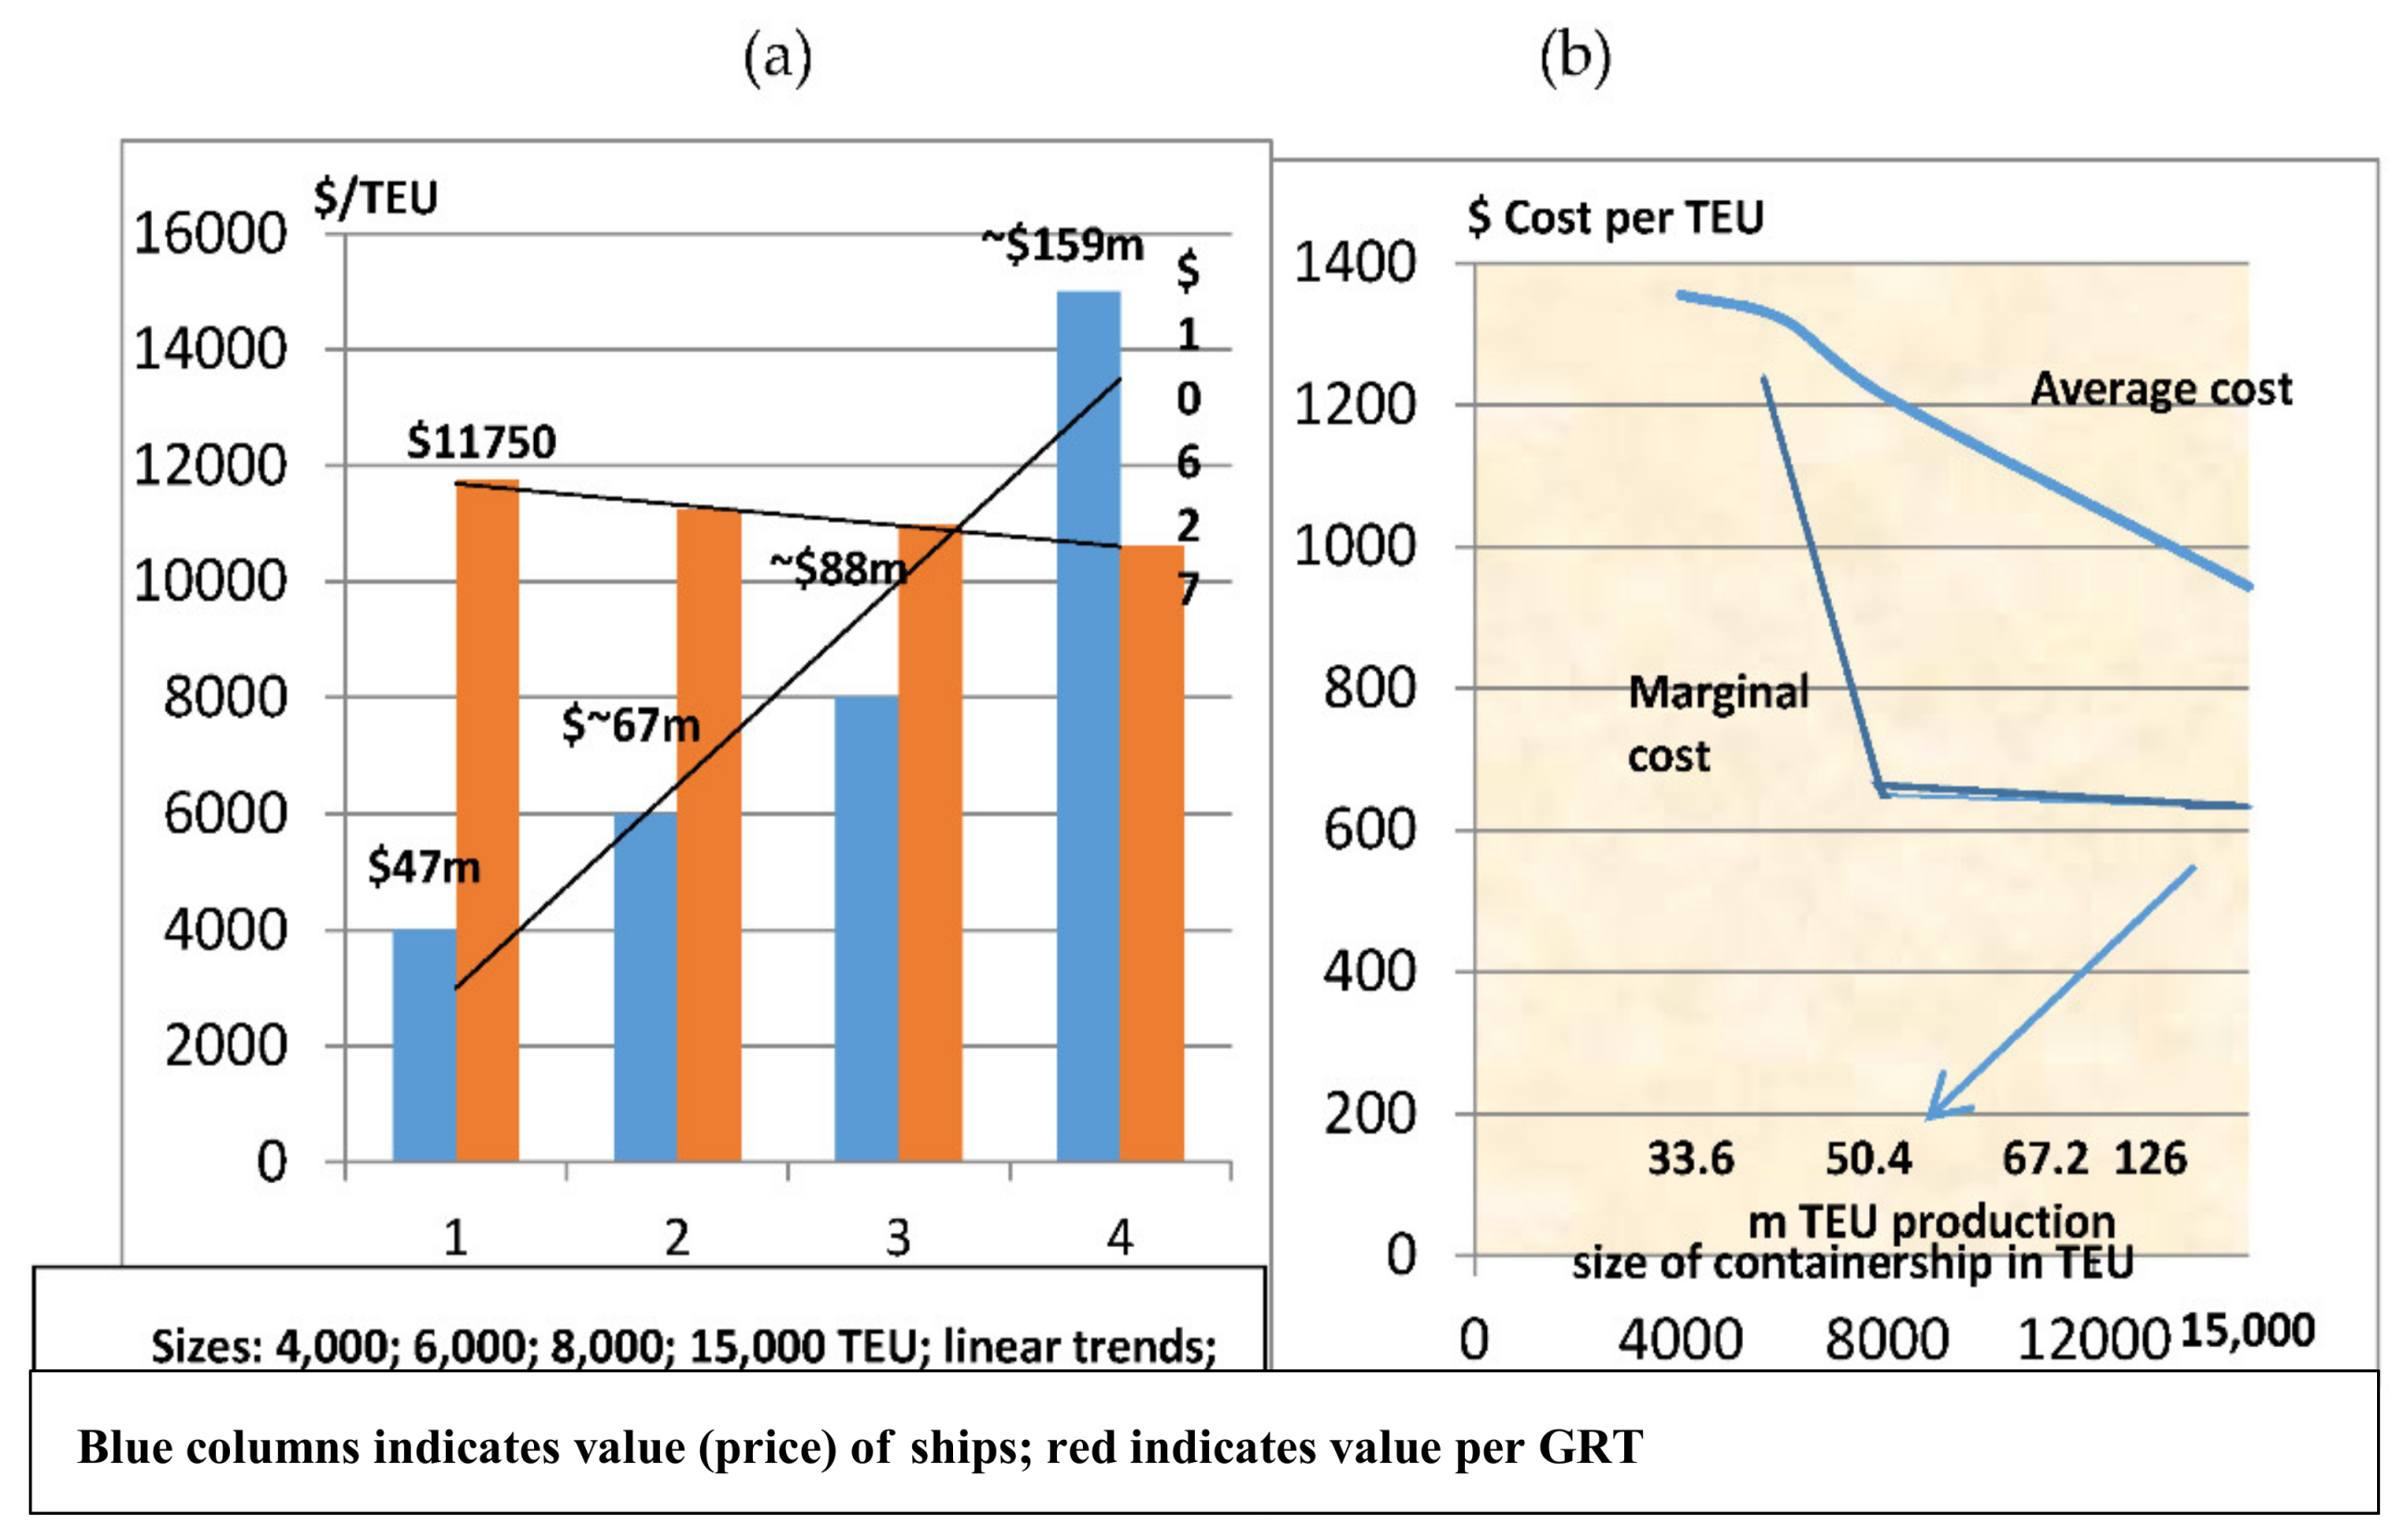
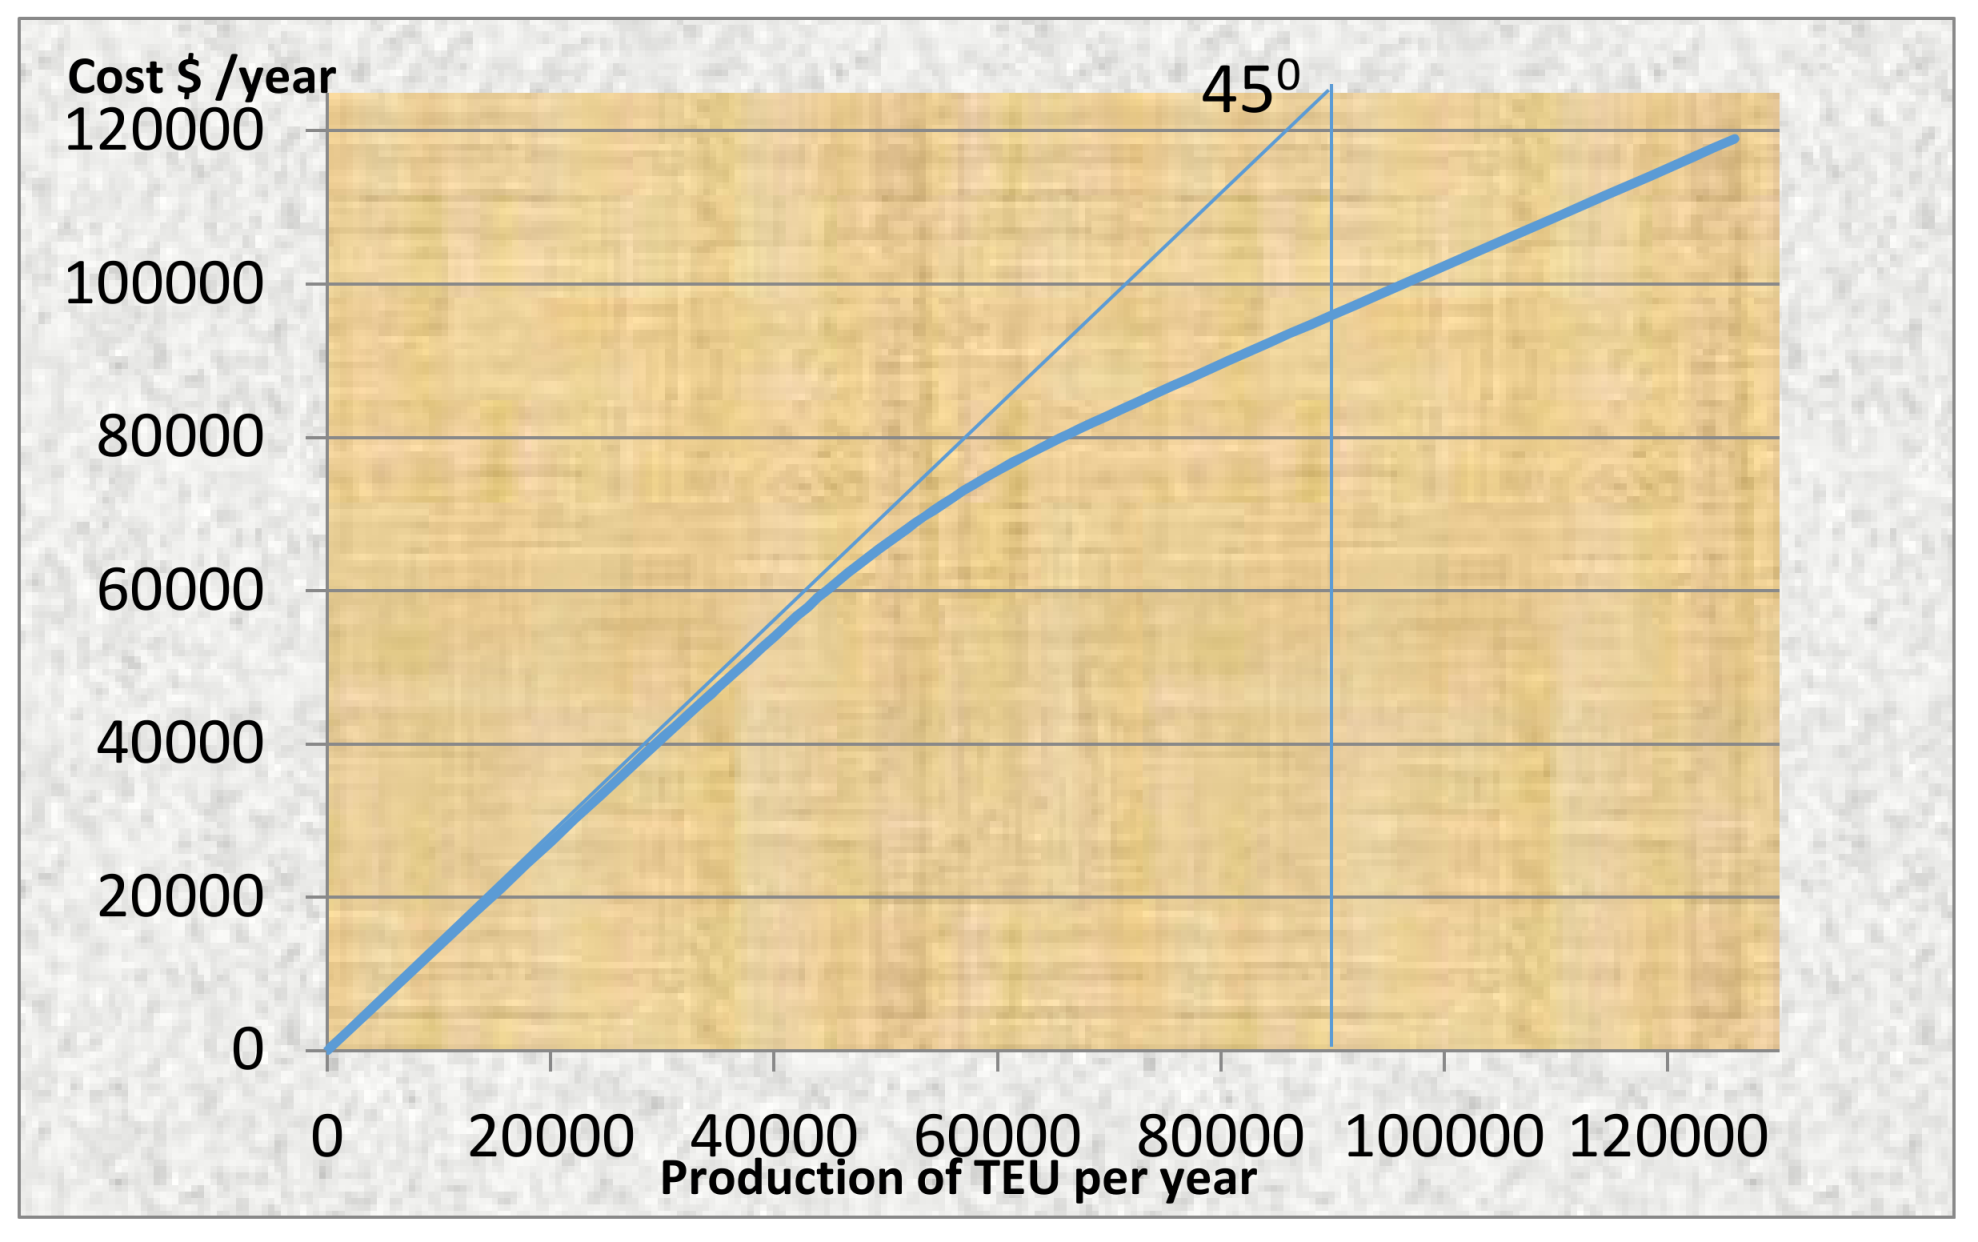
| 21 | Marginal cost is calculated by dividing the rise in total cost by additional production (TEUs). |
| 22 | Data from Furuichi and Otsuka (2015). |
| 23 | |
| 24 | Through ‘capacity control’, and/or cost advantage. |
| 25 | Data: from (Furuichi and Otsuka 2015). |
| 26 | A capital cost of $159.4m is calculated by Furuichi and Otsuka (2015) per year at an interest rate 7% over 15 years for a ship of 15,000 TEUs. |
| 27 | Fuel consumption per distance unit is proportional to the sailing speed squared (Furuichi and Otsuka 2015). |
| 28 | Port dues etc., historically, conceived in a partnership understanding that ports contribute to ships’ revenue, so they are entitled to withhold part of it by setting port rights on volume. Volume of cargo was, historically, determined by GRT, later by NRT, and even later by GT, and in certain ports in France by dwt. NRT replaced GRT, as the former includes ship’s closed spaces that bring-in nothing. Moreover, dwt includes bunkers, water etc., which too bring no revenue, but they represent a cost. Boxes, we believe, should pay port dues on their content value. The recent move of IMO (*) to know box weight may help, if it is extended to the value of the contents of the box. (*) On 1 July 2016, in SOLAS, there was an amendment for the mandatory verification of the gross mass of containers. Certain ports have recognized this issue and provided volume discounts in confidential contracts. However, our contribution is to put this matter in a way that will persuade ports to revise port expenses etc., to encourage ship sizes to become bigger. |
| 29 | Ship’s size entails certain costs for ports: longer quays, deeper draft, more spacious yards etc. The new ‘charging port policy’—favoring size—can be designed to make transshipment redundant, we believe. |
| 30 | Density matters because of fixed costs. These are the ruthless enemy of firms; it is the cost that is insensitive to the level of production, and it must be paid, even when production is nil. Certain industries have high fixed costs, like shipbuilding. Shipping has 50% of total costs fixed (mainly in new buildings). Fixed costs can be made more sensitive to production by reducing AFC-average fixed costs. The enemy of fixed costs is economies of scale. |
| 31 | |
| 32 | E.g., “low-cost” airlines. Borenstein (1989) found that monopoly routes had higher fares. However, contestability was not responsible for the competitive rates, as believed, but only for lower ones. A CM company can exit from a trade route, but remain in the market. Contestability has to be sought after within a trade route. |
| 33 | This ended the exemption of liner conferences from EU competition rules (EU CR 4056/1986). |
| 34 | In the Europe-Far East route, CR4 was 40% in 2002; 52% for Transatlantic. Some argue that concentration has no important effect on high prices, and the sharpest increase occurs at a concentration ratio ≥50% (Martin 2010). |
| 35 | Maersk = 15.15%; Med. Ship. Co = 13.4%; CMA CGM = 9.22% and China Ocean Ship. (Group) Co = 7.83%. |
| 36 | This is based on the market shares (%) of the 50 leading liner shipping companies in total shipboard capacity deployed in TEUs (UNCTAD 2016). The CR4,1998–2002—in slot capacity—found (rounded) (Lam et al. 2007): 43% (1998), 43% (2000), and 41% (2002) in Transpacific; 37%, 43%, and 39.5% in Europe–Far East; and 44%, 45.5%, and 52% in Transatlantic. So, Transatlantic should have higher freight rates, due to higher concentrations among the 3 main traders, but this did not happen, as between 1998 and 2002, Transpacific (eastbound, but not westbound) achieved the higher freight rates among all trades: $1400; $2200; $1500. |
| 37 | |
| 38 | In 5 US industries, in 1986, the CR4 varied from 62% to 93%. |
| 39 | Geithman-Marvel and Weiss in 1981, quoted by Hirshleifer and Glazer (1992). |
| 40 | Concentration in CM is not continuous. |
| 41 | During a depression expenses should be reduced, showing also the efficiency of carriers. |
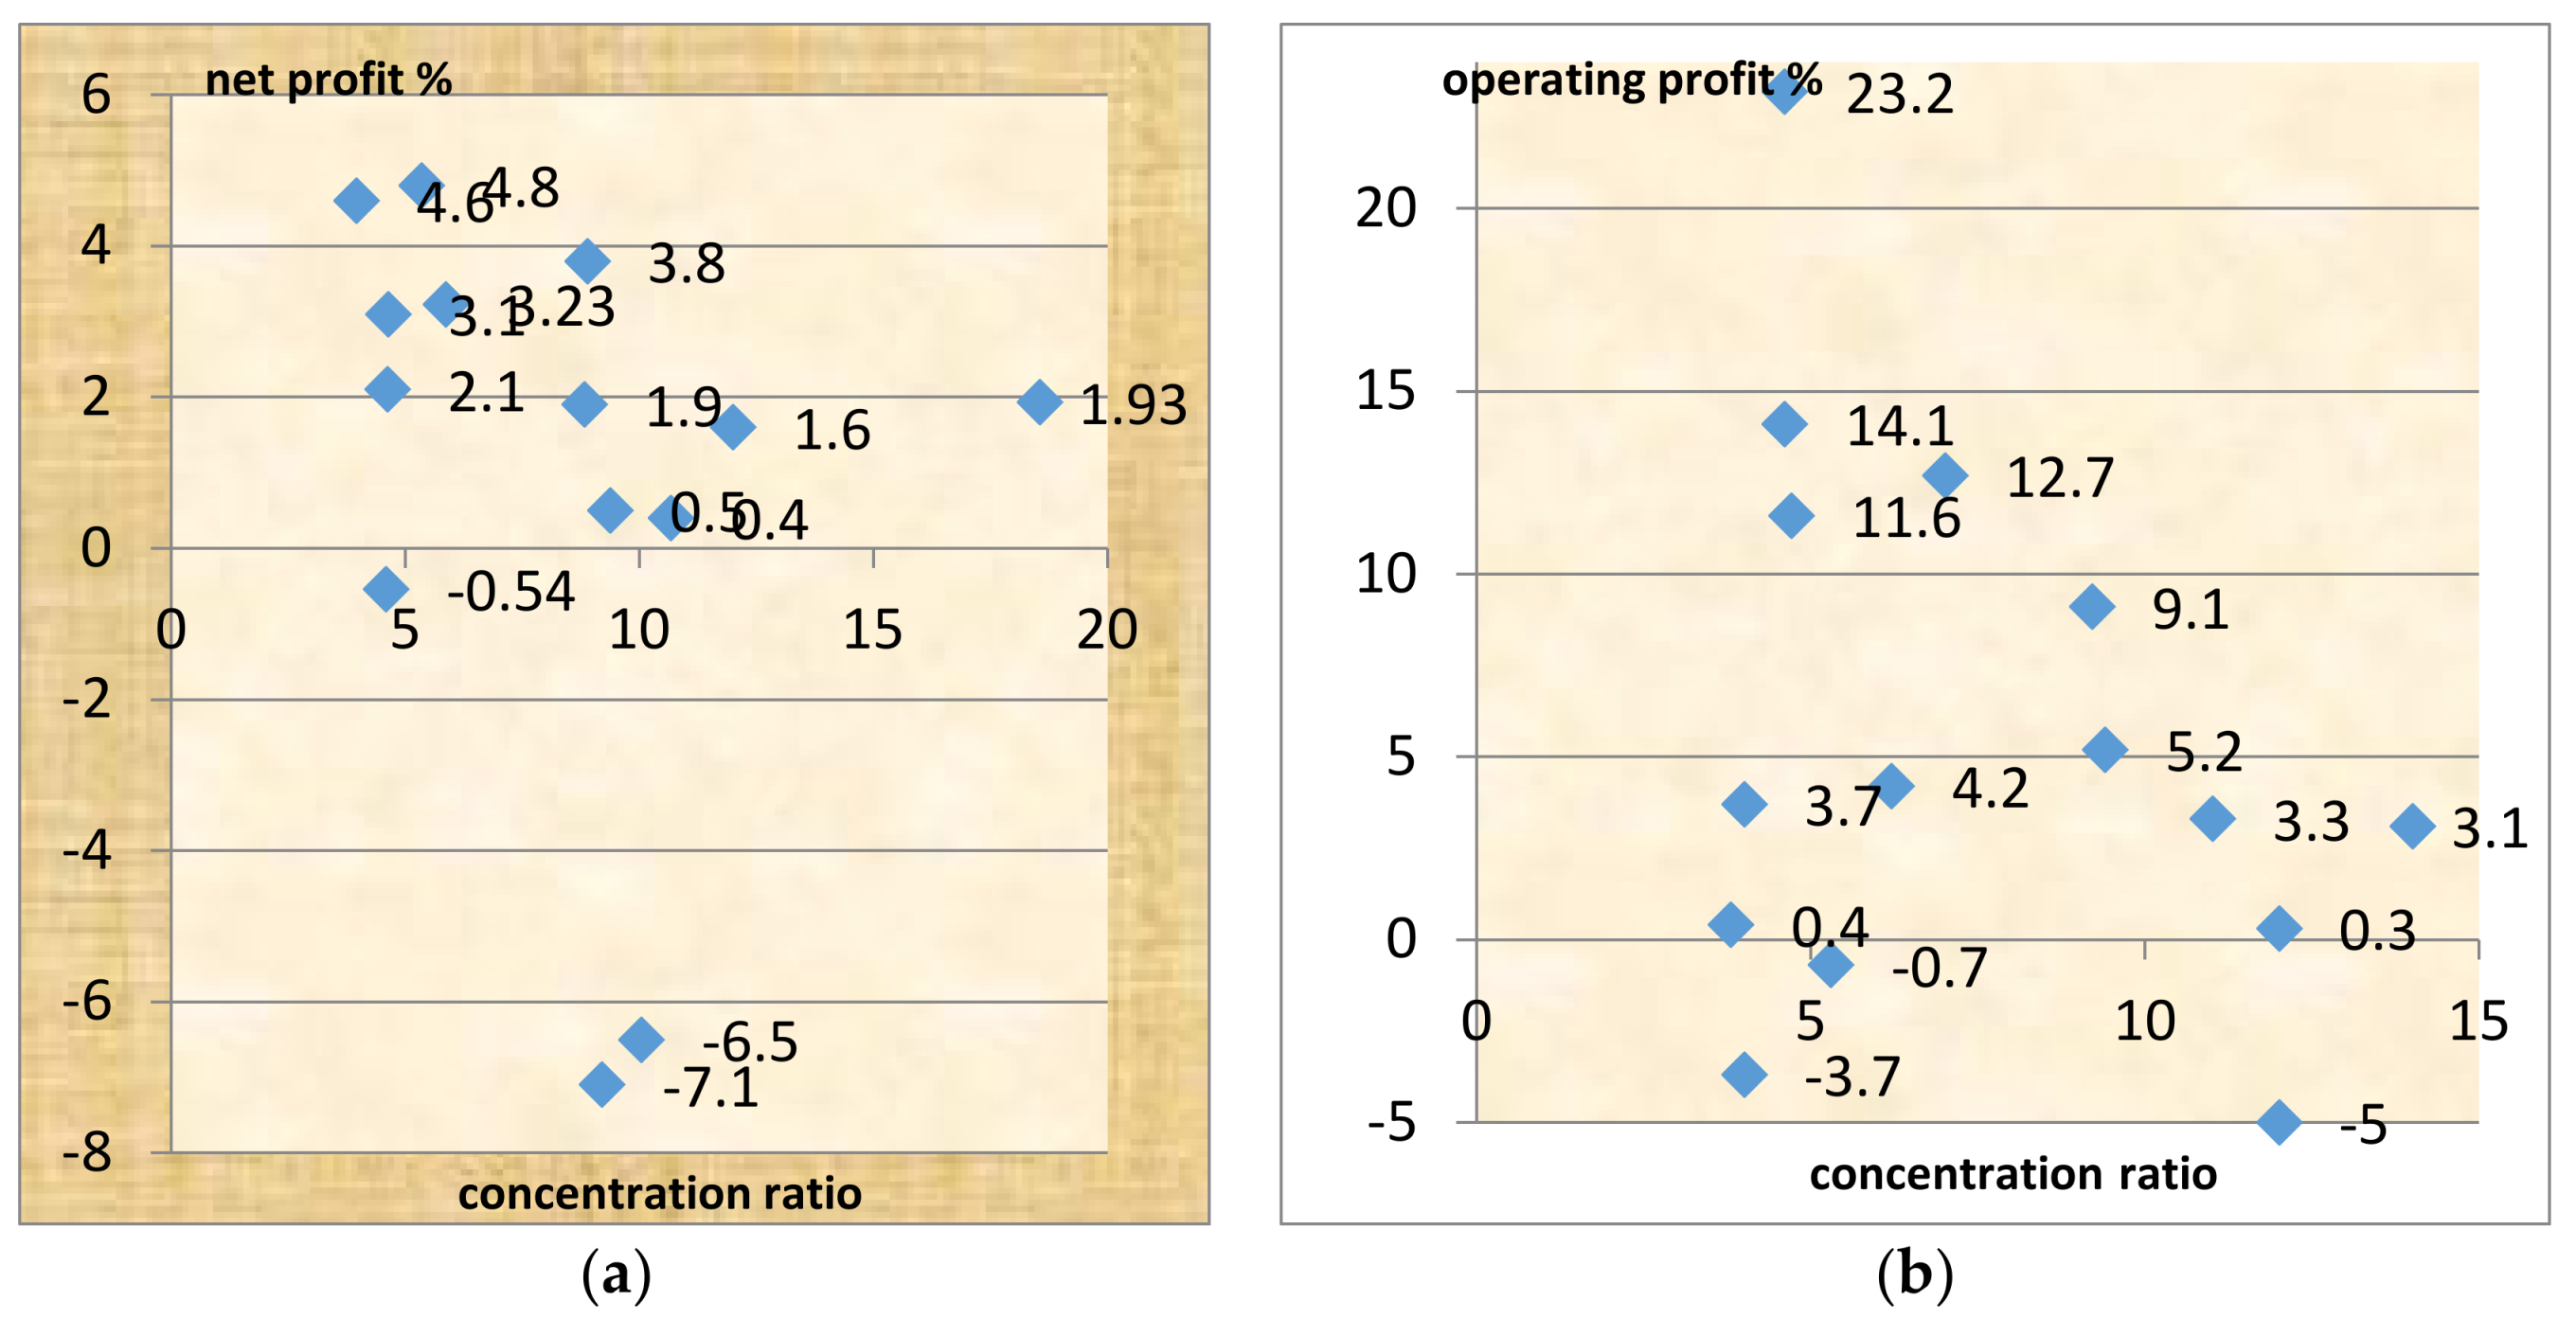
| 42 | Exceptions are the firms: CPS; and PON (PONL) and APL, which had losses. |
| 43 | CPS (CP ships) had 18.5% (high) in CR4 in Transatlantic in 2002, and ‘net profit’ of only 1.93% or $52m on a $2.7b turnover… |
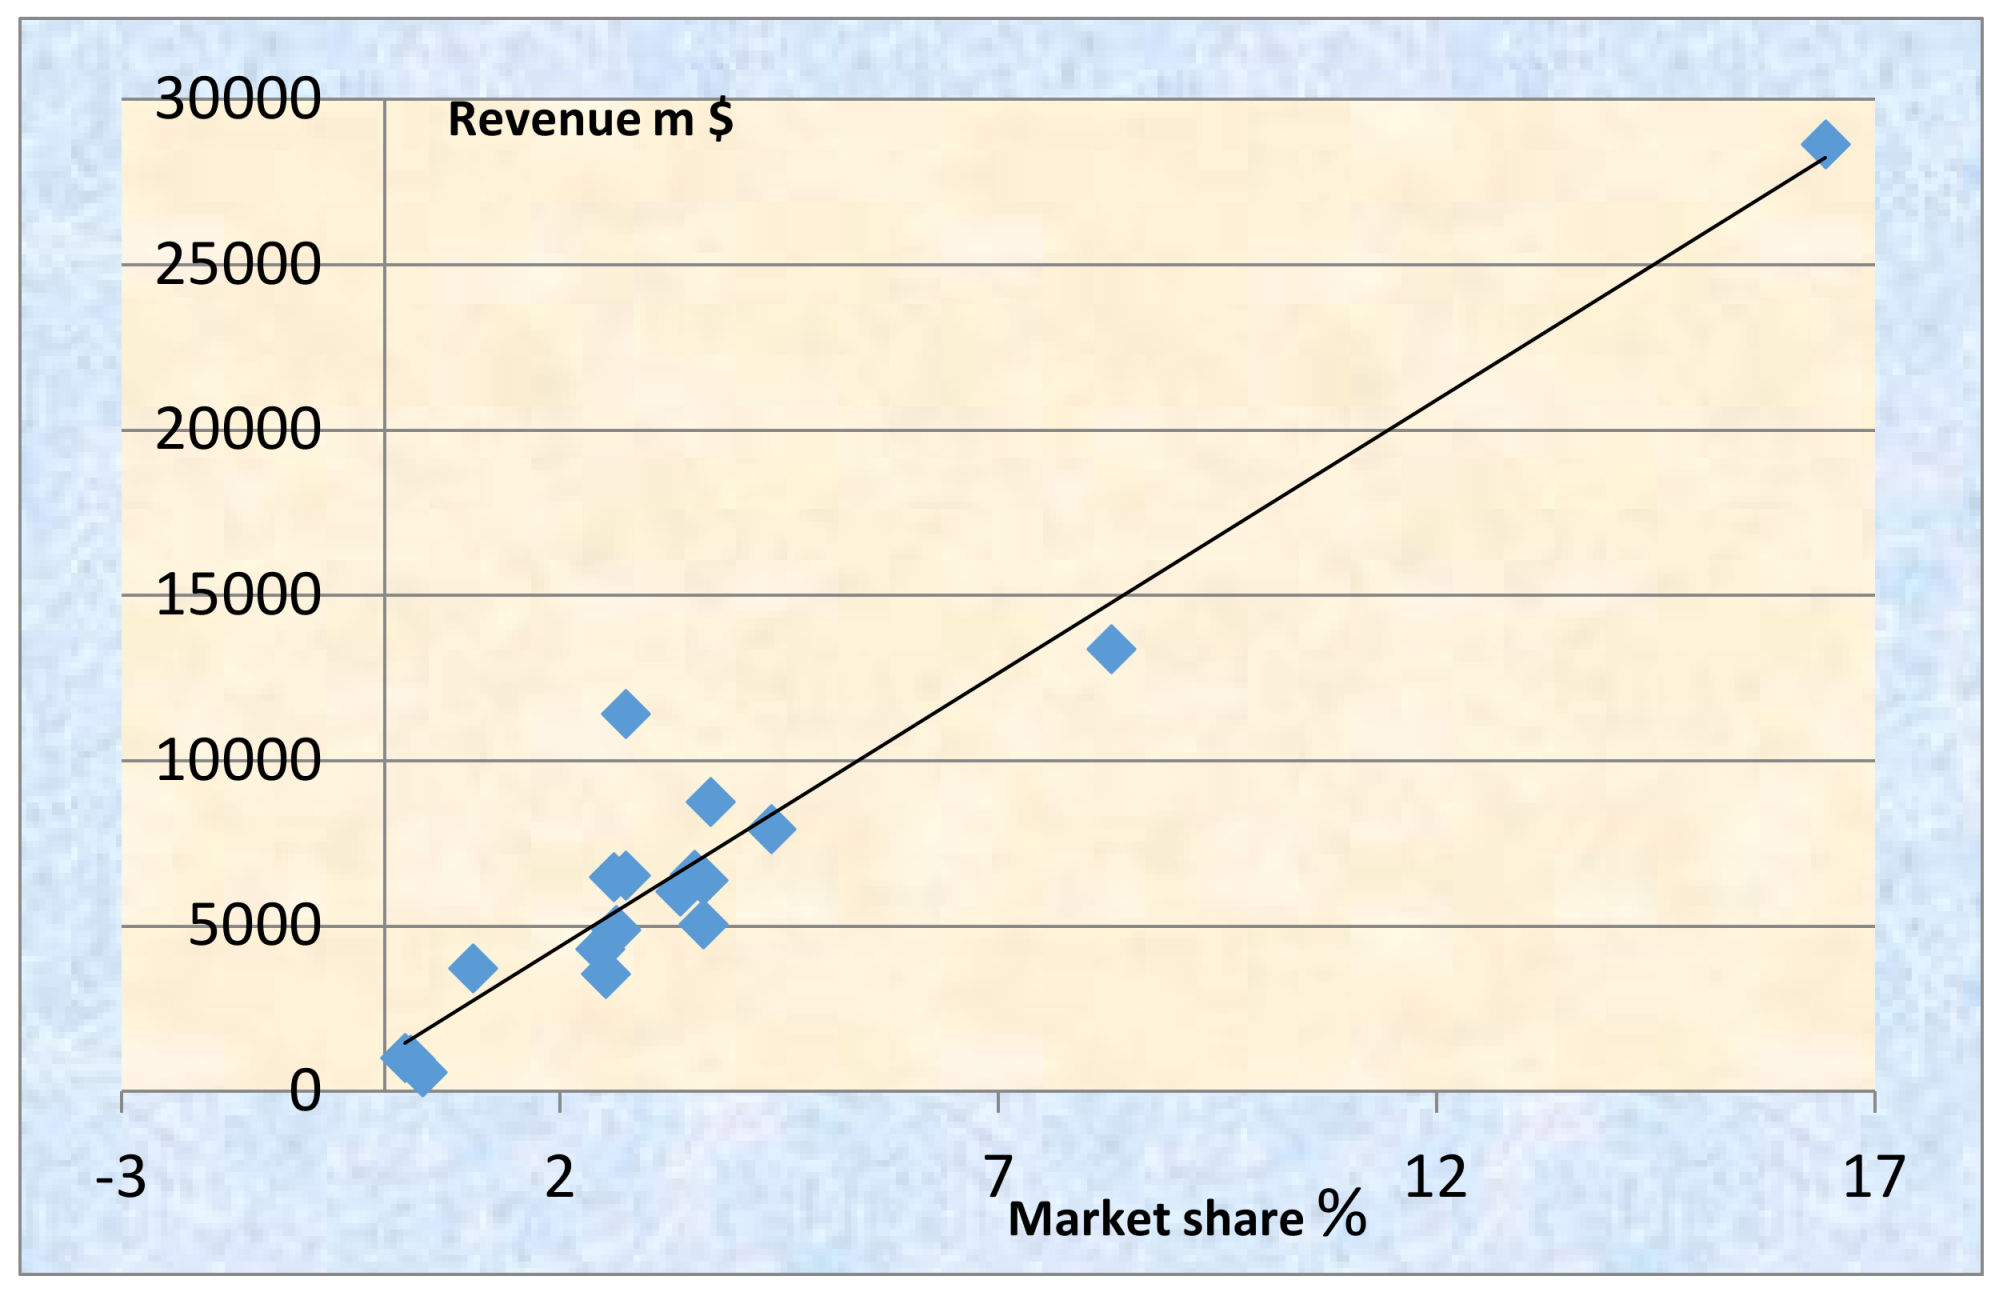
| 44 | Pearson product-moment coefficient of correlation: . The 14 carriers presented (Figure 9a) belong to a group of 16 ‘major’ carriers having ~$55b turnover in 2002, perhaps 25% of total. The coefficient does not indicate also causality, but only a degree of association between the two variables. |
| 45 | The Transpacific eastbound, in 4th quarter 1999, provided a freight rate of $2200/TEU; Transpacific westbound paid $710. |
| 46 | Besanko et al. (2013) argued that a necessary first step in identifying monopolies is the ‘market definition’ or ‘competitor identification’. The US Dept. of Justice argues that if a merger among competitors would lead to a small (say 5–10%), but significantly non-transitory (12 months at least), increase, in price, and then this market is well defined. This is known as the “SSNIP” criterion; Martin (2010). |
| 47 | Chamberlin (1933) and Robinson (1933) were dissatisfied with the two polar cases of monopoly and perfect competition as a description of reality (Appendix A). |
| 48 | Sys et al. (2011) using an unbalanced panel of data of a sample of 18 major liner operators (1999–2008) rejected the: neoclassical monopoly, collusive oligopoly or the conjectural variations of short-run oligopoly by the power of the “Panzar & Rosse H-statistic” in 1987. It suggests that the CM operates in a monopolistic competitive environment… |
| 49 | The CR4 for liner companies in slot capacity increased from 24% in 2000 to 39% in 2009; this remained steady after 2006, at 38–39%, till 2009 (Sys 2009). |
| 50 | CR4,2007: Transatlantic/eastbound ~61%; India–US ~63%; Med–North America ~66% (eastbound); US–India ~62%; North America–Latin America (Southbound.) ~70%; US–M East ~69% and M East–US ~84%. So, trade lanes reveal true concentration. |
| 51 | HHI < 1000 indicates no concentration; from 1001 to 1799 shows a moderate one; from 1800 and over shows high concentration. |
| 52 | The index is named after (Orris) Herfindahl, and this is a product of his doctoral thesis for steel industry at Columbia University. It is also named after Hirschman; so the index frequently is denoted by HHI. In fact there is a dispute of who is the father of the index. |
| 53 | |
| 54 | Sys (2009) found HHI2009~575 for liner total in slot capacity and CR4~39%. For total turnover she found CR4,2006 = ~50%. Lam et al. (2007) found in Transpacific HHI1998–2002: 703; 650; and 646 (rounded); in Europe–Far East: 577, 666, and 644; and in Transatlantic: 674, 780, and 891. |
| 55 | Taking revenue of 38 carriers in 2008; taking 24 carriers, the HHI2009–2010 increased to 1609 and 1777.50; 29 carriers had HHI = 1132 (2008). Data: from Drewry Shipping Consultants Ltd. (2010). |
| 56 | According to Besanko et al. (2013). |
| 57 | Our assumption is that if $1449 = price; then $1449 − $645.50/$1449 = LI = 0.5545. MC = $645.50. |
| 58 | Shanghai to N Europe-S America (Santos)-Australia/New Zealand (Melbourne). |
| 59 | |
| 60 | In CM we cannot rely on the equality of LI to inverse of elasticity of demand due to existing disequilibrium. |
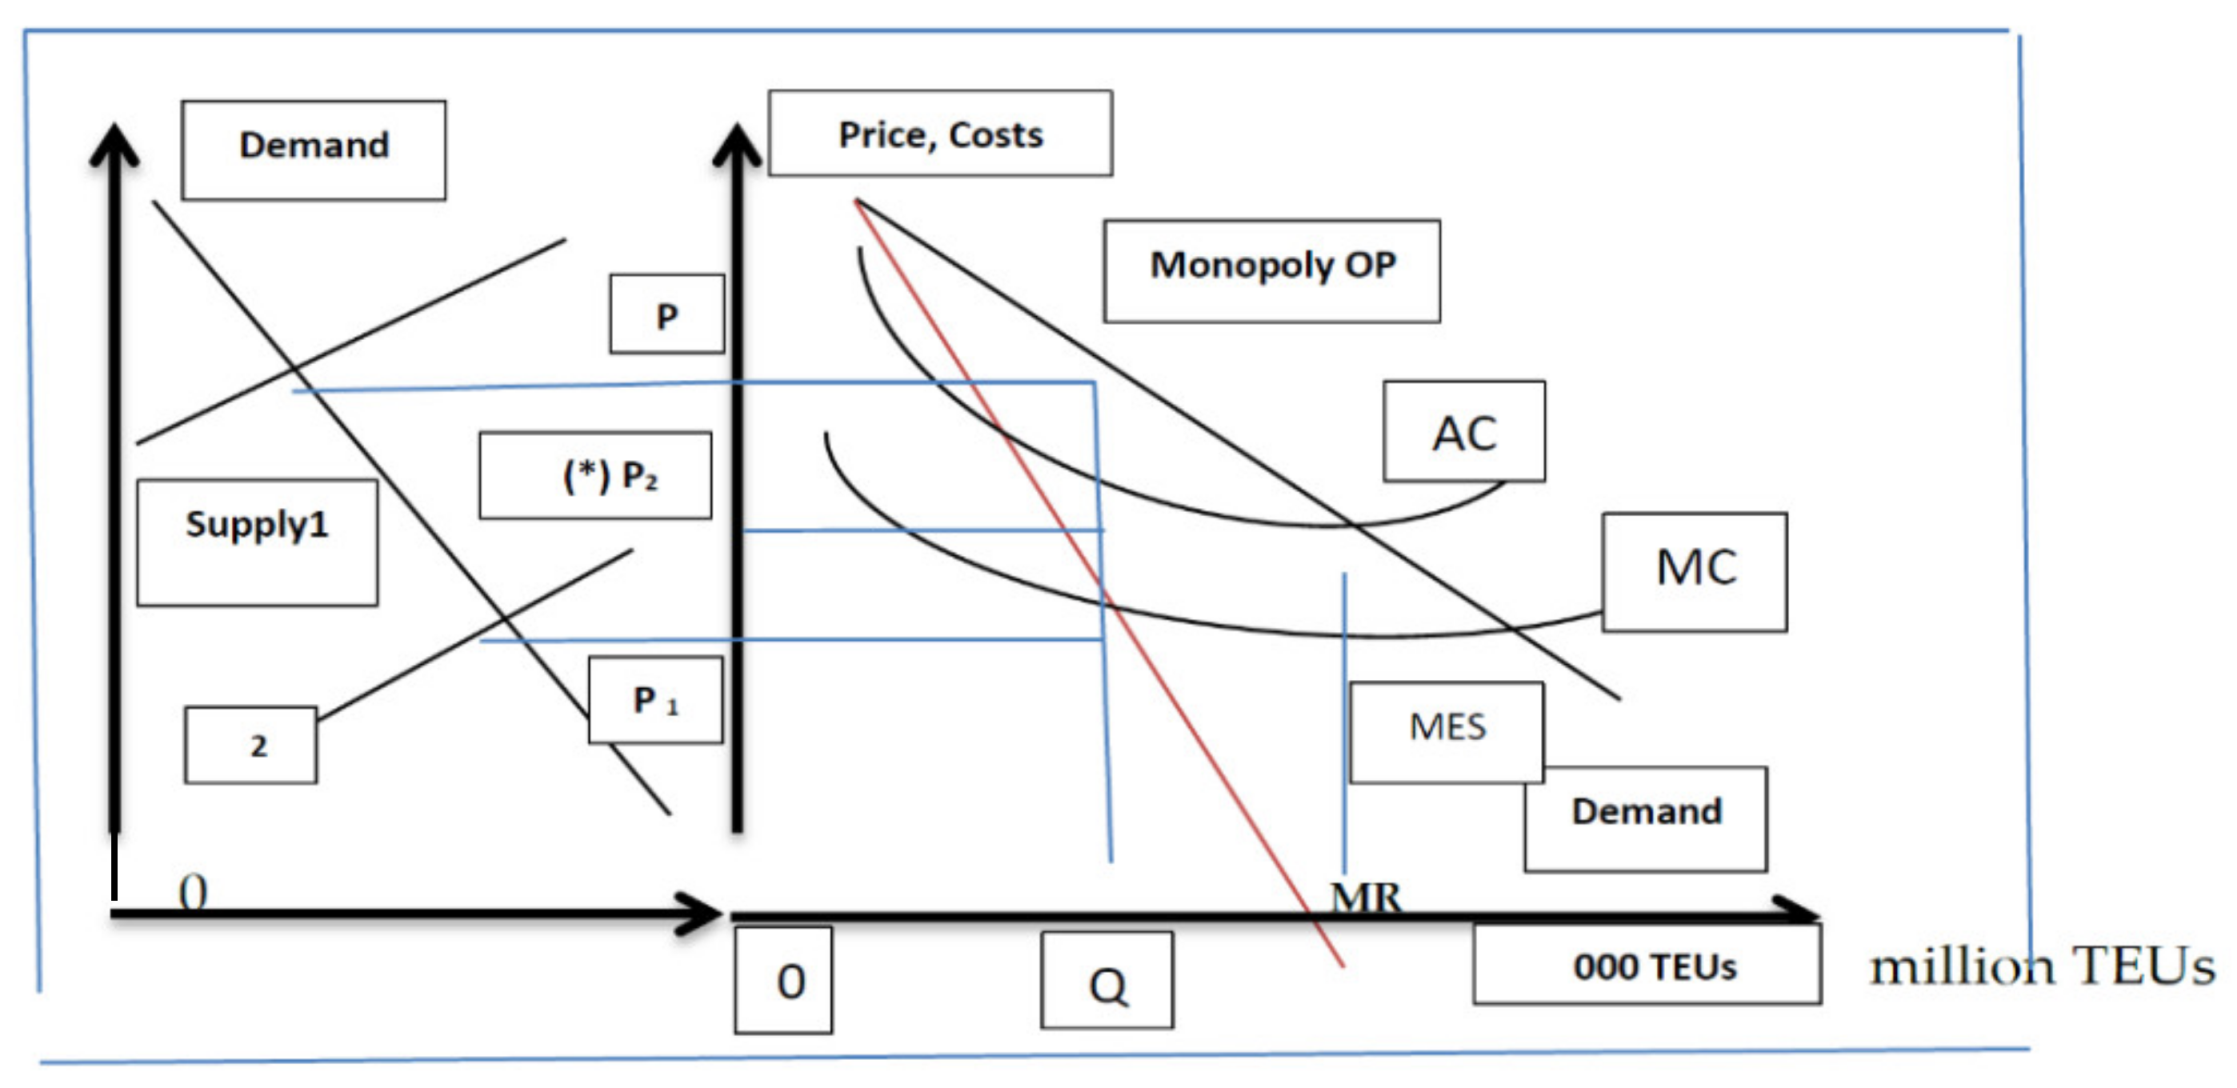
| 61 | Firms that pursue economies of scale, approaching their MES—say at 40,000 TEUs ships—create a cost advantage over smaller ones. |
| 62 | Proof: ; dividing by P, then , as , or , or . |
| 63 | |
| 64 | Proof: , and : replacing and . |
| 65 | One of the strange matters on this planet is the tolerance of governments of the cartel of OPEC; this is excluded because it is made up of governments. |
| 66 | An earlier version is presented in Goulielmos (2017); see also: (Martin 2010, p. 213; Besanko et al. 2013). |
| 67 | |
| 68 | |
| 69 | One may distinguish alliances among them. |
| 70 | Data from Drewry Shipping Consultants Ltd. (2010). |
| 71 | Despite the 68.3% orders on existing fleet in 10 March 2008. |
| 72 | This means the ability to choose the most profitable routes, the frequency of service and to eliminate competitors etc. |
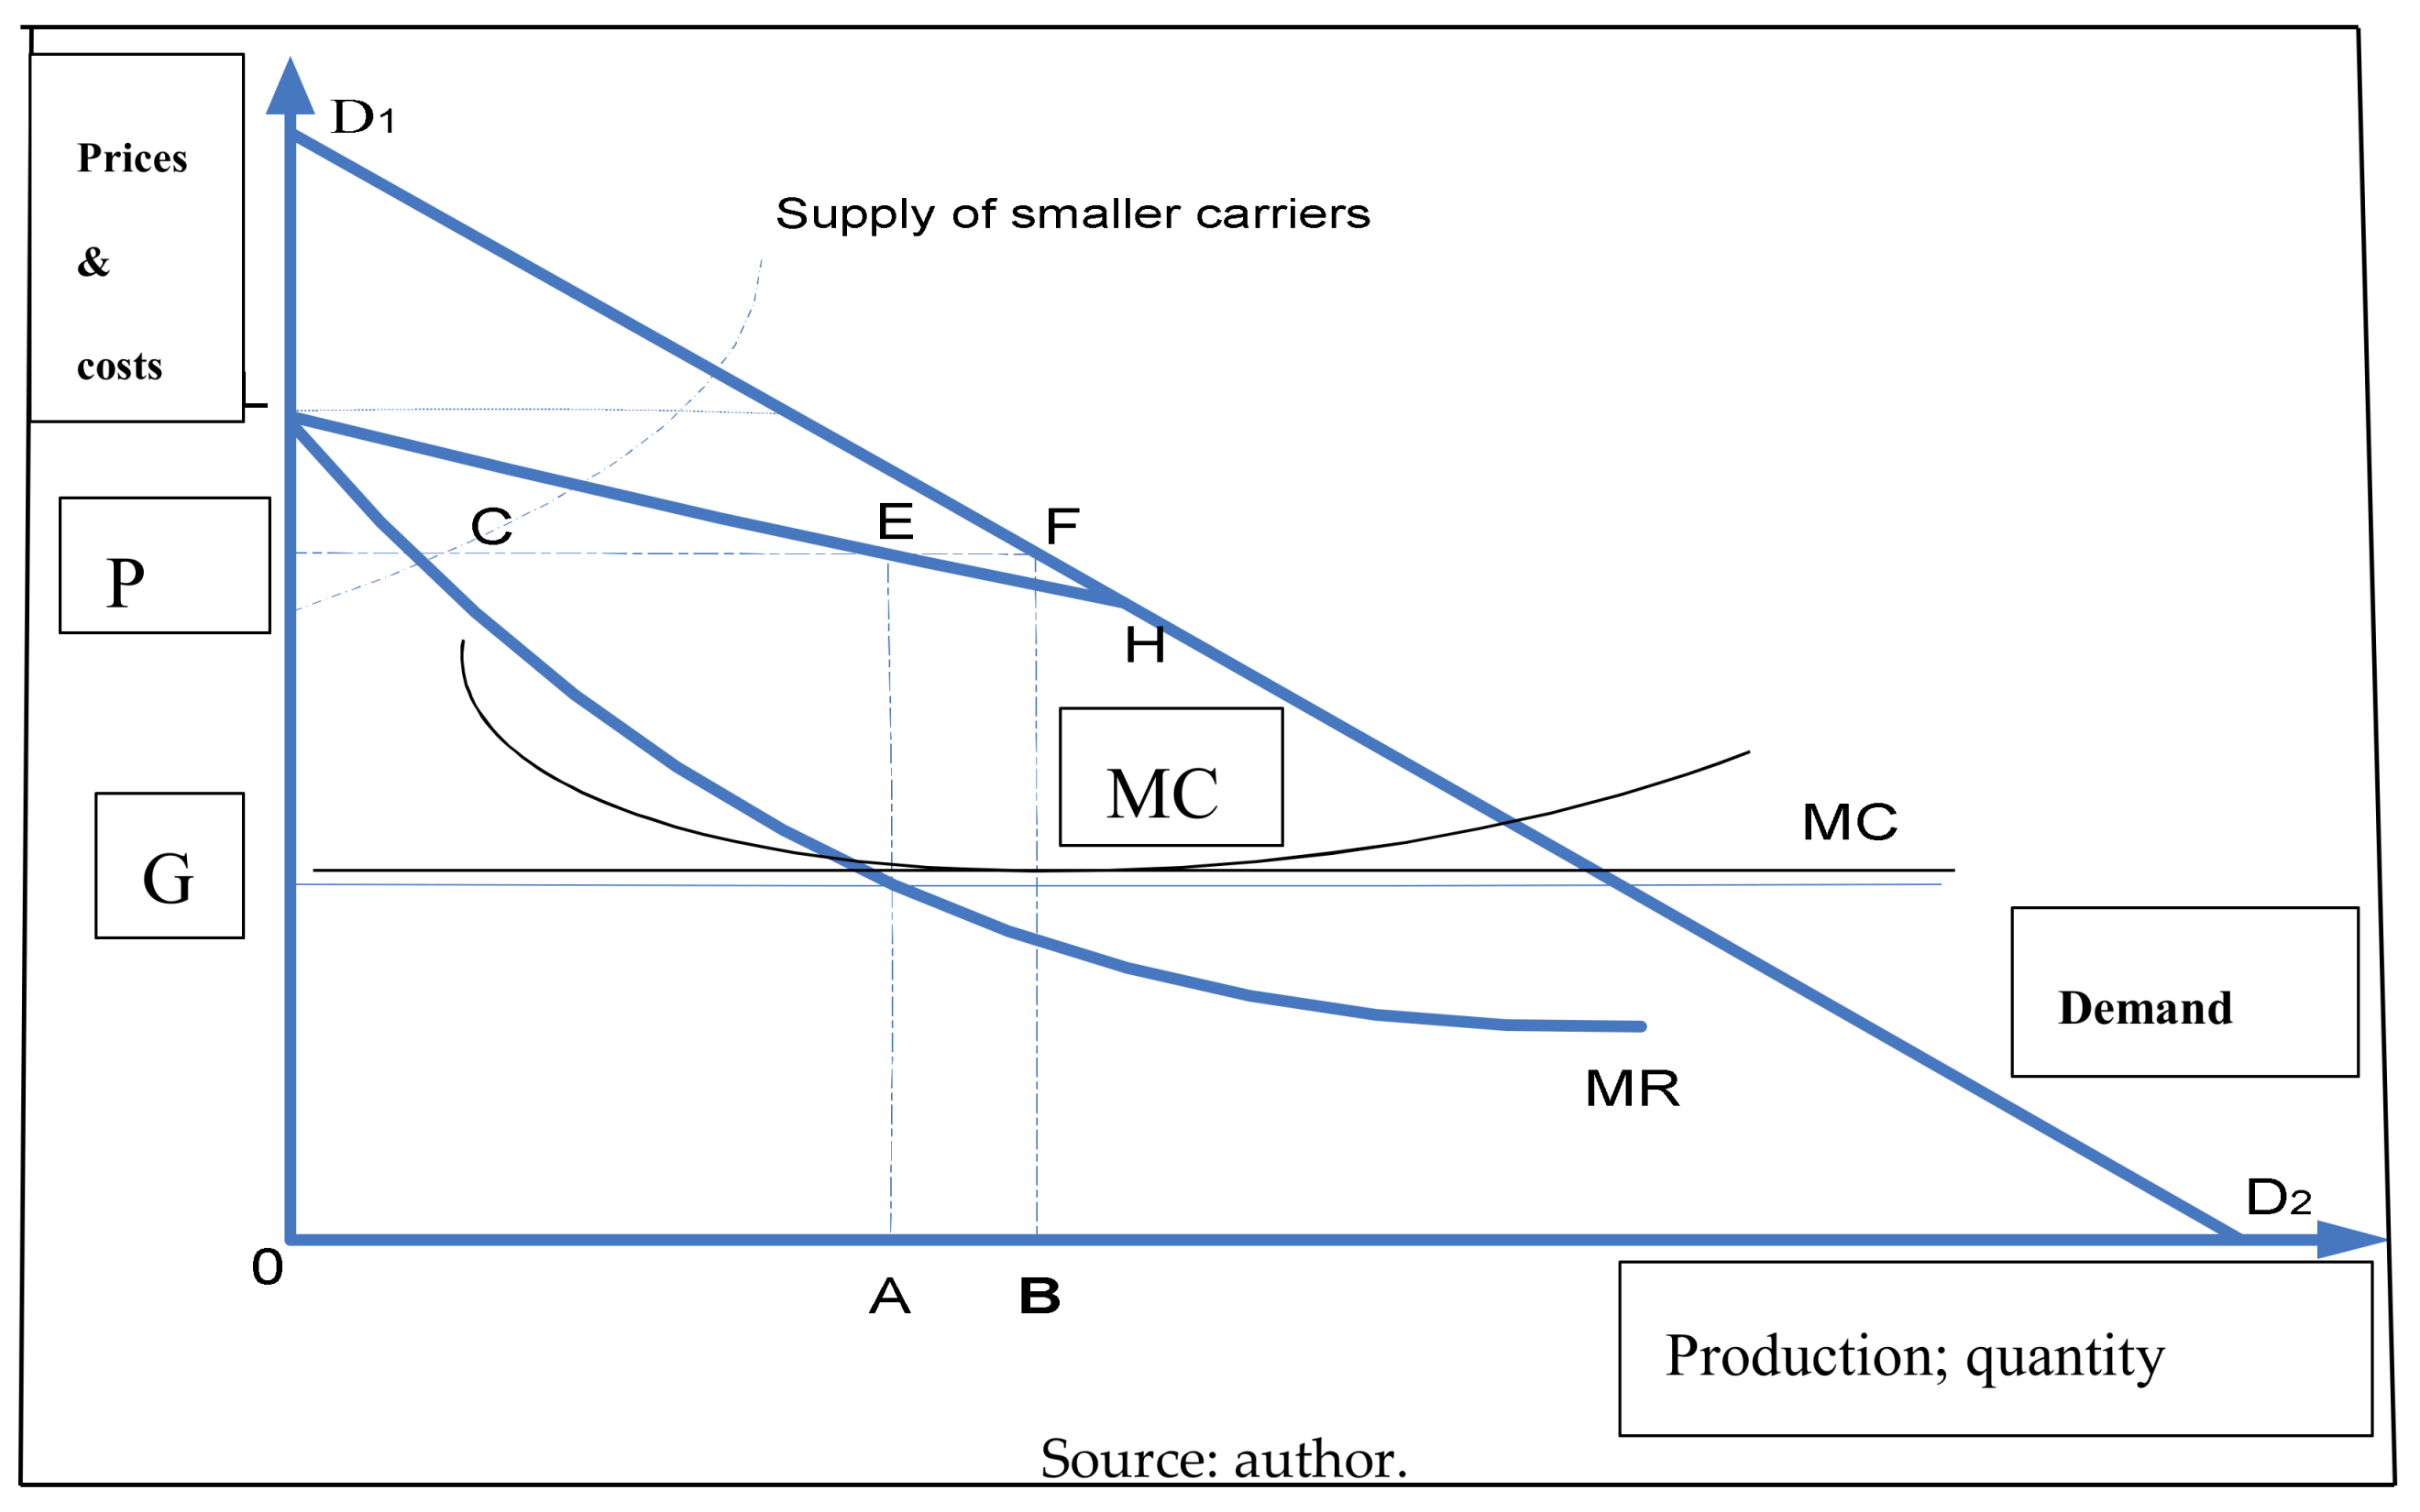
| 73 | The price-leader makes each firm give-up its pricing autonomy and passes control over group’s pricing to one single firm. |
| 74 | The 2nd half of 2007 witnessed an explosion of orders. In four months, as many ships were ordered as in the previous three years (Lorange 2009). |
| 75 | AP Moller-Maersk (end 2006) resisted the urge to the purchase of new tonnage. |
| 76 | Far East–Europe? |

| Concentration49 | Industry’s Structure | Industry’s Structure | Industry’s Structure |
|---|---|---|---|
| The industry is increasingly concentrated; done by consolidation | Loose oligopoly found in the 53% (8/15) of trade routes (2007); if CR4 = 25–60% = effective competition with a reasonably easy entry | The 7/1550 (47%) trade lanes were a tight oligopoly: CR4 > 60%; i.e., oligopoly whose market characteristics facilitate the realization of supernormal profits for a long time with high barriers to entry | Chain oligopoly |
| Given the variations in market shares, CM is neither symmetric nor asymmetric, but between | Competitive. Fragmented: HHI < 1000. Stable competition | Firms belong to oligopolistic sub-groups | A trend towards a tacitly collusive market with important operational agreements |
© 2018 by the author. Licensee MDPI, Basel, Switzerland. This article is an open access article distributed under the terms and conditions of the Creative Commons Attribution (CC BY) license (http://creativecommons.org/licenses/by/4.0/).
Share and Cite
Goulielmos, A.M. “After End-2008 Structural Changes in Containership Market” and Their Impact on Industry’s Policy. Int. J. Financial Stud. 2018, 6, 90. https://doi.org/10.3390/ijfs6040090
Goulielmos AM. “After End-2008 Structural Changes in Containership Market” and Their Impact on Industry’s Policy. International Journal of Financial Studies. 2018; 6(4):90. https://doi.org/10.3390/ijfs6040090
Chicago/Turabian StyleGoulielmos, Alexandros M. 2018. "“After End-2008 Structural Changes in Containership Market” and Their Impact on Industry’s Policy" International Journal of Financial Studies 6, no. 4: 90. https://doi.org/10.3390/ijfs6040090
APA StyleGoulielmos, A. M. (2018). “After End-2008 Structural Changes in Containership Market” and Their Impact on Industry’s Policy. International Journal of Financial Studies, 6(4), 90. https://doi.org/10.3390/ijfs6040090


