Abstract
Systemic risk events constitute an important issue in current financial systems. A leading course of action used to mitigate such events is identification of systemically important agents in order to implement the prudential policies in a financial system. In this paper, a bi-level cross-shareholding network of the stock market is considered according to direct and integrated ownership structure. Furthermore, different systemic risk indices are applied to identify systemically important companies in an early warning system. Results of application of these indices on cross-shareholding data from Tehran Stock Exchange show that integrated network indices produce more reliable results. Moreover, results of statistical analysis of the networks indicated the existence of scale-free characteristics in the TSE cross-shareholding network.
JEL:
C6; E44; G10; G18; G32
1. Introduction
Systemic risk is related to inter-connection and correlation of different parts of a market. In systemic risk events, a financial crisis occurs when an initial failure is transmitted to the whole market [1]. Accordingly, control and mitigation of systemic risk is an important consideration in the financial markets. In terms of systemic risk, companies are different in the extent of their contributions to the systemic events. In many countries, systemically important companies are identified by financial regulatory bodies and these authorities apply the prudential policies in the financial systems. In the recent systemic risk studies [1,2,3], size, interconnectedness and the correlation of companies are introduced as the main factors of systemic risk. Some studies have claimed that large size companies are more vulnerable to systemic risk and introduced the “too big to fail” notion. In the other studies, Interconnectedness and correlation have a huge impact on the companies’ exposure to each other by causal and balance sheet relations and co-movement of companies over the same time period [3].
In recent years, network theory has been widely applied for analysis of financial systemic risk and financial crisis [4,5]. Financial network studies can be categorized in to three main groups. In the first group, contagion theory is applied to financial systems in order to simulate the behavior of a financial system under different network setups [6]. The focus of the second group is on the correlation-based networks and the analysis of the structure of a financial market in different time periods [7,8]. Most research in the field falls into the third group that analyzes the structure of inter-bank debt networks in different countries and proposes various prudential policies to mitigate financial systemic risk and its associated costs [9,10,11,12]. In this type of studies, inter-bank debt networks are introduced as scale-free networks that also have the “small world” characteristics. These financial networks are also “robust to fragile”, which means that they operate as a risk sharing mechanism to increase stability of a financial system at the pre-crisis period. Conversely, interconnectedness would serve as a shock propagation mechanism during a crisis period and would thus increase the probability of system failure [1].
Even though cross-shareholding networks are one of the main types of financial networks, application of cross-shareholding networks in the analysis of financial systemic risk has scarcely been reported. In other words, most systemic risk publications have analyzed interconnectedness in inter-bank debt networks. An exception is the study of Pecora and Spelta [1], which reports use of the cross-shareholding network of European banks to analyze systemic risk. Because of the limited availability of information on bilateral exposure between different companies, such as inter-bank debts, cross-shareholding data could be applied as an appropriate proxy for information on interconnectedness. In addition to systemic risk analysis in banking systems, application of cross-shareholding information makes systemic risk analysis to be possible for other companies in a financial market. Although a cross-shareholding network could have an important role to maintain the stability in a financial system, no particular analysis has applied the stock market cross-shareholding network to analyze systemic risk.
In this paper, the cross-shareholding network of the stock market is applied as a bi-level network. A bi-level cross-shareholding network means that the network contains companies listed in the stock market as well as external shareholders of companies and the shareholder’s shareholders and their relationships. For this purpose, the emerging market of Tehran Stock Exchange (TSE) was considered for analysis (the recent cancellation of international sanctions has stimulated the interests from both internal and external investors). Based on the available cross-shareholding information, the direct and integrated cross-shareholding network of TSE is represented and different systemic risk indices are applied and statistically appraised. Moreover, the most systemically important companies and sectors are determined in accord to different indices.
Results show that the cross-shareholding network is a good proxy for analysis of interconnectedness and systemic risk in financial markets. Consideration of integrated ownership in a cross-shareholding network leads to a more reliable network and better understanding of the systemic risk importance for different companies. Moreover, results of statistical analysis of these networks show that cross-shareholding network of TSE has a power-law distribution. The power-law distribution amplifies the hypothesis that the network can be “robust yet fragile” and is fertile for crisis in the case of systemic risk events.
2. Literature Review
Even though most financial network studies are categorized into the three above-mentioned groups, only a few studies have reported on application of cross-shareholding networks to analyze ownership structure and control flow [13]. The main focus of these studies has been statistical analysis of cross-shareholding networks and control flow in different countries. For example, Battiston and Glattfelder [14] applied the principles of network theory in a cross-shareholding network to analyze ownership control structure in the world financial system. Glattfelder and his co-workers showed that the cross-shareholding network has a bow-tie structure. The bow-tie structure is a core-periphery structure with a central part known as strongly connected component (SGC) and two input and output sectors [14,15]. In another study, Battiston [16] compares the descriptive characteristics of cross-shareholding networks in Milan, New York and London stock exchanges. Ma, Zhuang and Li [17] analyzed mutual investment in the Shanghai Stock Exchange. A degree-equivalent measure was introduced for weighted directed cross-shareholding network and analysis of statistical characteristics of the network in terms of corporate, sector and province was reported. In addition to the above, there have been several other studies on the application of cross-shareholding (for example, see [18,19,20,21]). In conclusion, although little studies have been done on application of cross-shareholding networks, no specific paper has yet been published on application of the cross-shareholding network for systemic risk analysis.
3. Data and Methodology
3.1. The Dataset
In this paper, the cross-shareholding network of the Tehran stock exchange, as an emerging market, is applied. The shareholding data from 386 listed companies for the years 2013–2015 was extracted from the Tehran Stock Exchange dataset [22]. Because many listed companies had a small amount of market value, the dataset was limited to the shareholding data of 118 listed companies that have more than 0.1 percent share of the total market value. The missing data of the cross-shareholding structure are directly extracted from the annual reports of the companies. A general summary of the companies, industrial sectors and their market share is represented in Table 1. As shown in Table 1, these companies are categorized into 27 different sectors. The completed list of the companies and sectors has been represented in Appendix A. For the sake of simplicity, the dataset consists of shareholders which have more than one percent of the listed companies. Moreover, as a significant number of listed companies had external shareholders, the dataset contained shareholders’ data and their shareholder’s shareholder in a bi-level network.

Table 1.
General summary of the selected dataset.
3.2. Methodology
3.2.1. Network Notation
A network is a set of related nodes. In graph theory, networks are represented as a set of vertices and edges. Generally, a network N = (V, E) is represented as a set of vertices V and edges E, which the set of edges can be shown as an adjacency matrix. The matrix elements show the existence of a relation between the nodes i and j and each element can be 0 or 1. If there is a relation between i and j, is 1 and 0 otherwise. If the network is an indirect network, the adjacency matrix is symmetric. In weighted networks, .
The number of edges for each node i is called the degree of node i and is represented as . For directed networks, there is a difference between input and output arcs. The number of input and output arcs for each node i is known as and , respectively. As ownership relations in cross-shareholding networks are asymmetric, these cross-shareholding networks are represented as a weighted directed network.
In addition to the above-mentioned notations, for each node in network N, there are values such as that represent an intrinsic value of a node and are not relevant to the structure of a network. In a cross-shareholding network, could be the market value or the operational revenue of each company. A simple representation of a cross-shareholding network as a weighted directed network is represented in Figure 1.
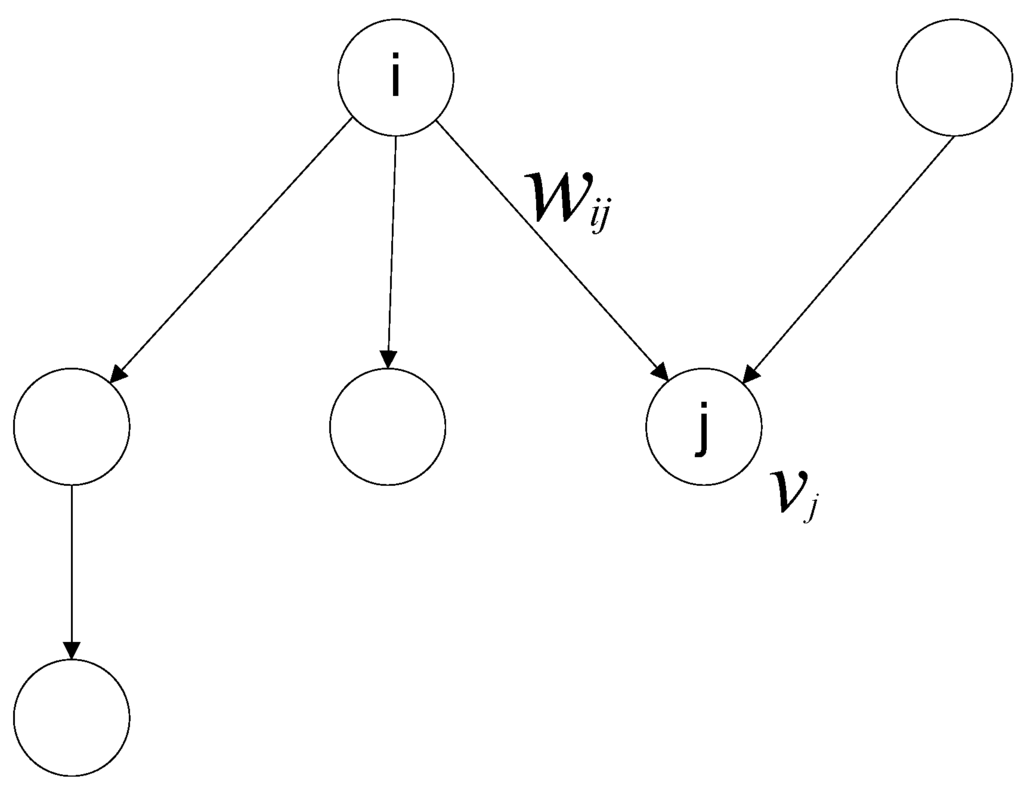
Figure 1.
Representation of a cross-shareholding network as a weighted directed network.
3.2.2. Networks Based Systemic Risk Indices
One of the main challenges of network analysis for many researchers is how to determine the importance of each node rather than others in a network. In the literature related to systemic risk, the importance of nodes can be described as the contribution of nodes in occurrence of a systemic risk event. For this purpose, there are many measures mentioned in network literature [23,24,25] termed as “centrality measures”. The two main centrality measures that are widely developed in the literature of network theory are the degree measure and the eigenvector or feedback-based centrality measure.
Degree Centrality Measure: The degree of each node in a cross-shareholding network is the number of companies with an ownership relation with the node. , as the out-degree of node i, is the number of companies that are shareholders of i. Conversely, as the in-degree of node i, is the number of companies belonging to the investment portfolio of company i. Therefore, it could be noted that is a proxy for the level of integration of company i in the other companies and is the degree of portfolio diversification for company i.
Micro-investors are excluded in the estimation of and for each company. Even though this might cause a bias in and estimation, but because this is the case for estimation of all companies, the bias effect could be ignored at the comparative analysis of companies.
In addition, if represents the market value of company i, is introduced as the portfolio value of company i and considered as a systemic risk index in [19].
where is the percent of company j that is owned by company i and is the market value of company j.
Since the cross-shareholding network is a weighted network, it is required to consider the weights in order to calculate centrality as well as systemic risk importance for companies. In-degree and out-degree indices can also be presented in weighted networks. For the first time, Newman [26] introduced the degree of each node in a weighted network as the strength of a node. Then, a mixed index for centrality based on strength and degree of each node was introduced by Opsahl and their co-workers [27]. Although the literature reports that such indices are used widely, they cannot be applied in this case because of the nature of weights in cross-shareholding networks. Therefore in this paper, the two represented measures of Battiston have been applied to measure weighted in-degree and out-degree measures [16]. , which is an in-degree equivalent centrality measure, represented as follows:
where shows the number of inward arcs to the node j. In other words, calculates the effective number of companies owned by company j. On the other hand, is introduced as an equivalent out-degree measure and described as follows:
which shows the amount of control that company j has on company i, is calculated as follows:
In other words, shows the importance of company i within the companies that belong to company j. measures the total importance of company i for companies that have invested in company i and accordingly shows the effective number of investors of company i.
Eigen Vector Centrality Measure: Eigen vector centrality measures are based on the concept that importance of each node is related to the importance of its neighbors. This concept leads to a series of equations that should be solved simultaneously. In a weighted directed network, the Hubbell measure [28] is the most familiar Eigen vector measure. In this measure, each node could have an intrinsic importance, such as and importance is related to existing relations to other nodes. The following relation shows the Hubbell index:
where is the Hubbell centrality measure and A is the adjacency matrix of the network. The solution of Equation (5) is represented as:
The above solution is obtained, if the matrix is invertible or equivalently none of the eigen values of A is equal to 1. Therefore, choosing the parameters and in a cross-shareholding network, the Hubbell measure could be used to determine companies that are systemically important. In this paper, market values and the integrated market values are chosen as and .
3.2.3. Integrated Market Value and Integrated Cross-Shareholding Matrix
In this section, centrality and importance of each company in a cross-shareholding network is evaluated based on integrated ownership of companies. According to Brioschi [29], integrated ownership is determined by aggregated amounts of direct and indirect ownership of a shareholder on an asset. Figure 2 illustrates a simple comparison of direct and indirect ownership in a cross-shareholding network.
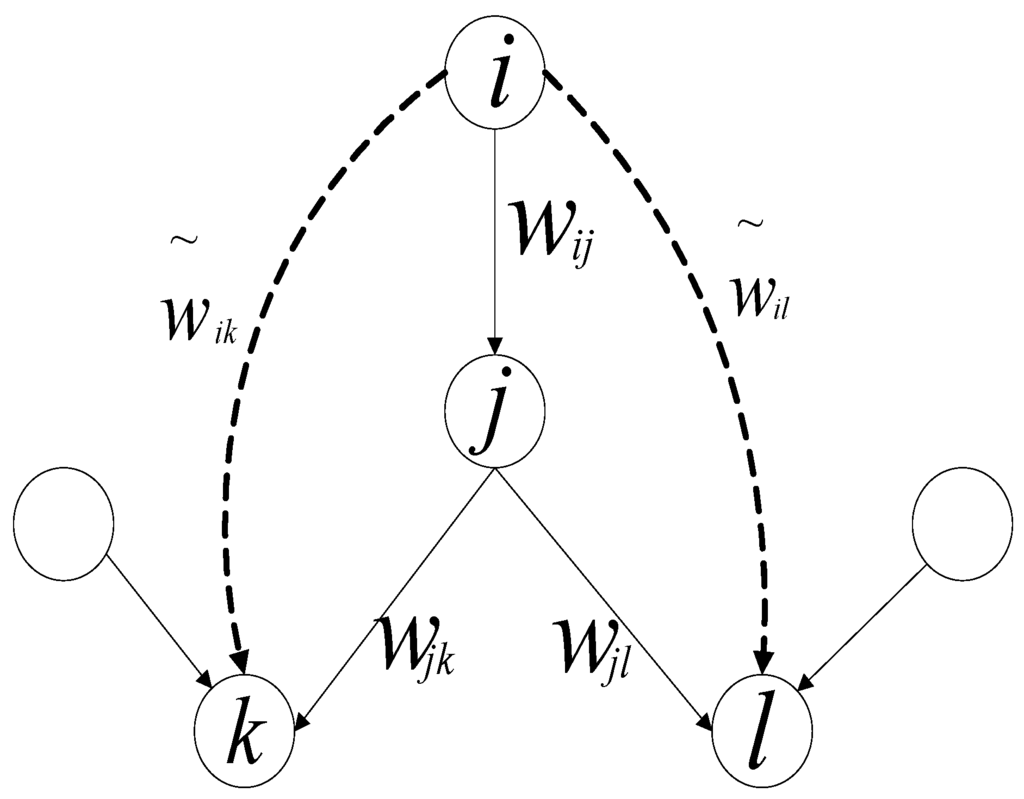
Figure 2.
Representation of direct and indirect ownership in a cross-shareholding network.
As financial agents in a stock market can be categorized into listed companies and external shareholders, the portfolio value of a listed company is calculated as Equation (7).
where shows the percent of company j that is owned by company i, is the set of neighbors of company i and is the market value of company j. The matrix representation of Equation (7) could be represented as follows:
where shows vector of portfolio values, is an n × n adjacency matrix, is the vector of market values and n is the number of listed companies. Conversely as the main external shareholders of the listed companies are considered in this study, the portfolio value of an external shareholder k is represented as follows:
where m is the number of external shareholders, represents market values of the listed companies and is the ownership fraction of external shareholder k on the listed companies. The matrix representation of the value of external shareholders portfolio is determined from Equation (10).
When the cross-shareholding network is shown as a combination of external shareholders and listed companies, the following matrix A is represented:
where is a zero matrix and A is a (m + n) × (m + n) matrix. Accordingly, the integrated market value of each company could be calculated as a combination of intrinsic values and amounts of interconnectedness as follows:
where and show intrinsic market values and the integrated market values of companies, respectively. The solution of Equation (13) is as follows:
The , as the integrated values of companies could be applied as a systemic risk index that shows importance in terms of systemic risk. If in the Equation (6), the and , it is obvious that the is a kind of Hubbell centrality measure.
However, the integrated ownership matrix can also be represented as follows:
where considers all direct and indirect paths to calculate amounts of integrated ownership. For example, the integrated percent of company j that is owned by company i is represented as follows:
The solution of the Equation (14) is as follows:
According to the above-mentioned equations, it is possible to reach a dual relation for each company as the Equation (17), where each side of the equation shows the integrated portfolio values of companies.
The , which is a complement for the portfolio value indices (), can been used as another systemic risk index.
4. Results and Analysis
4.1. Direct Cross-Shareholding Network
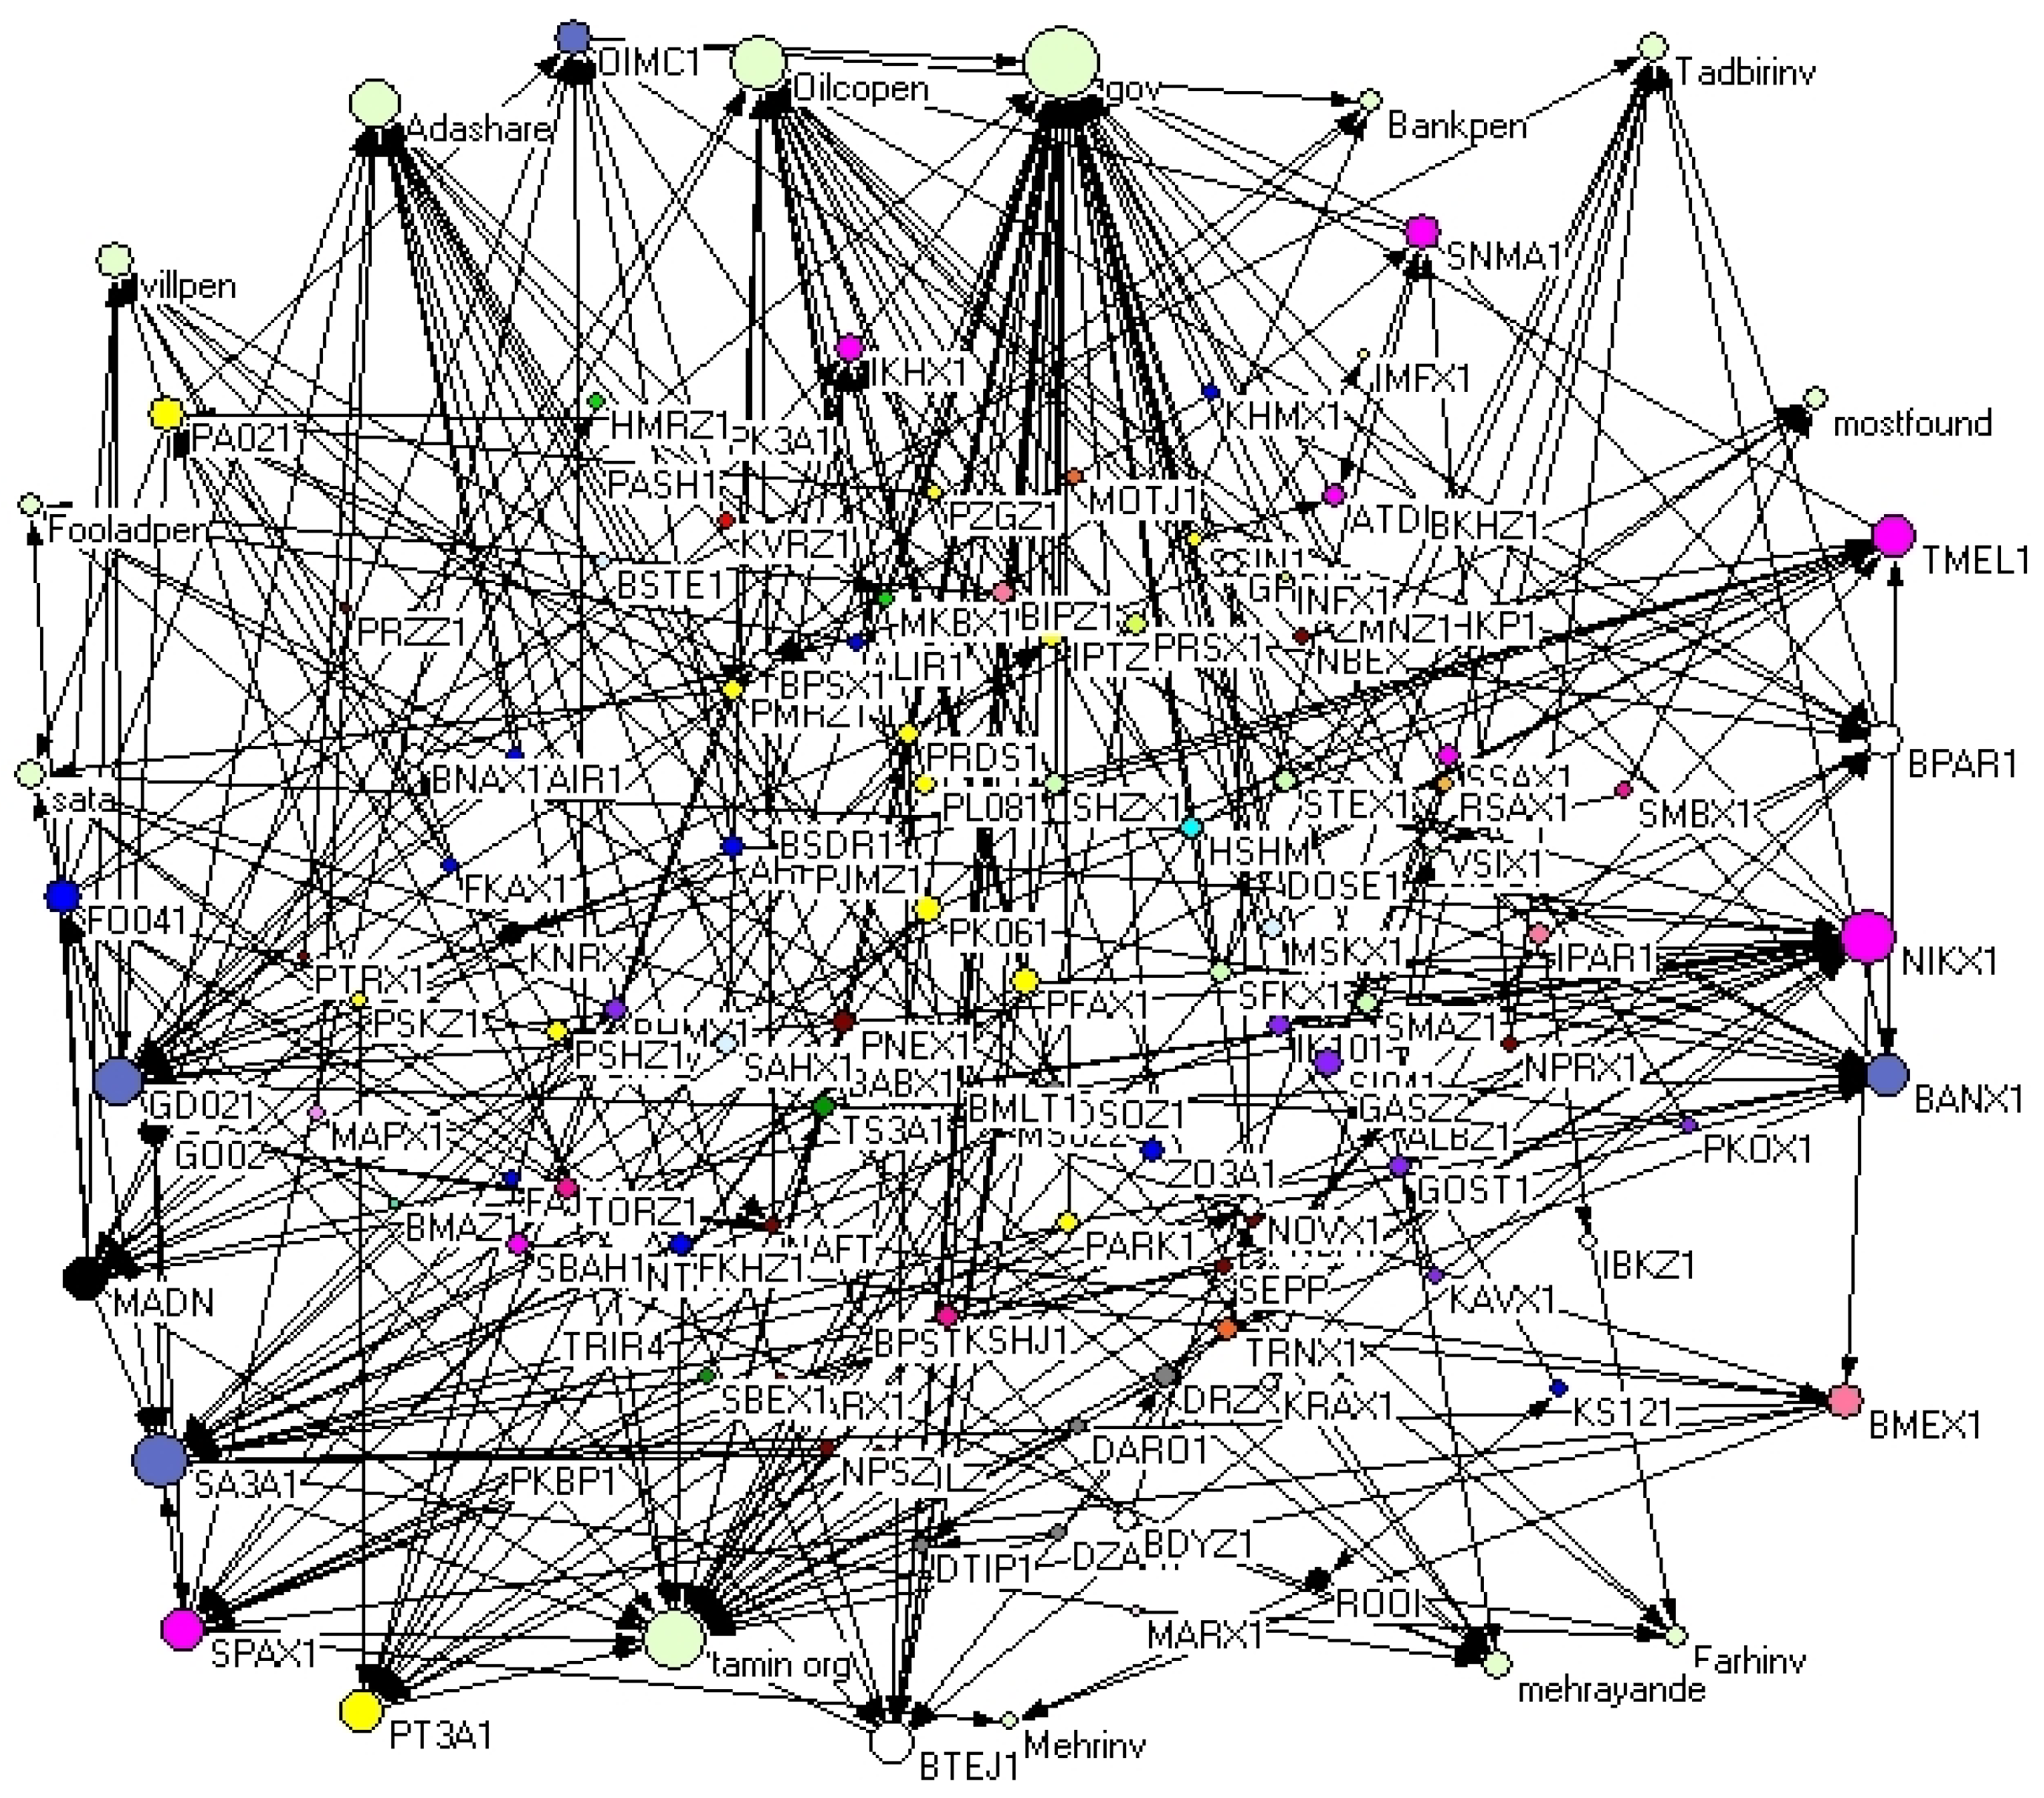
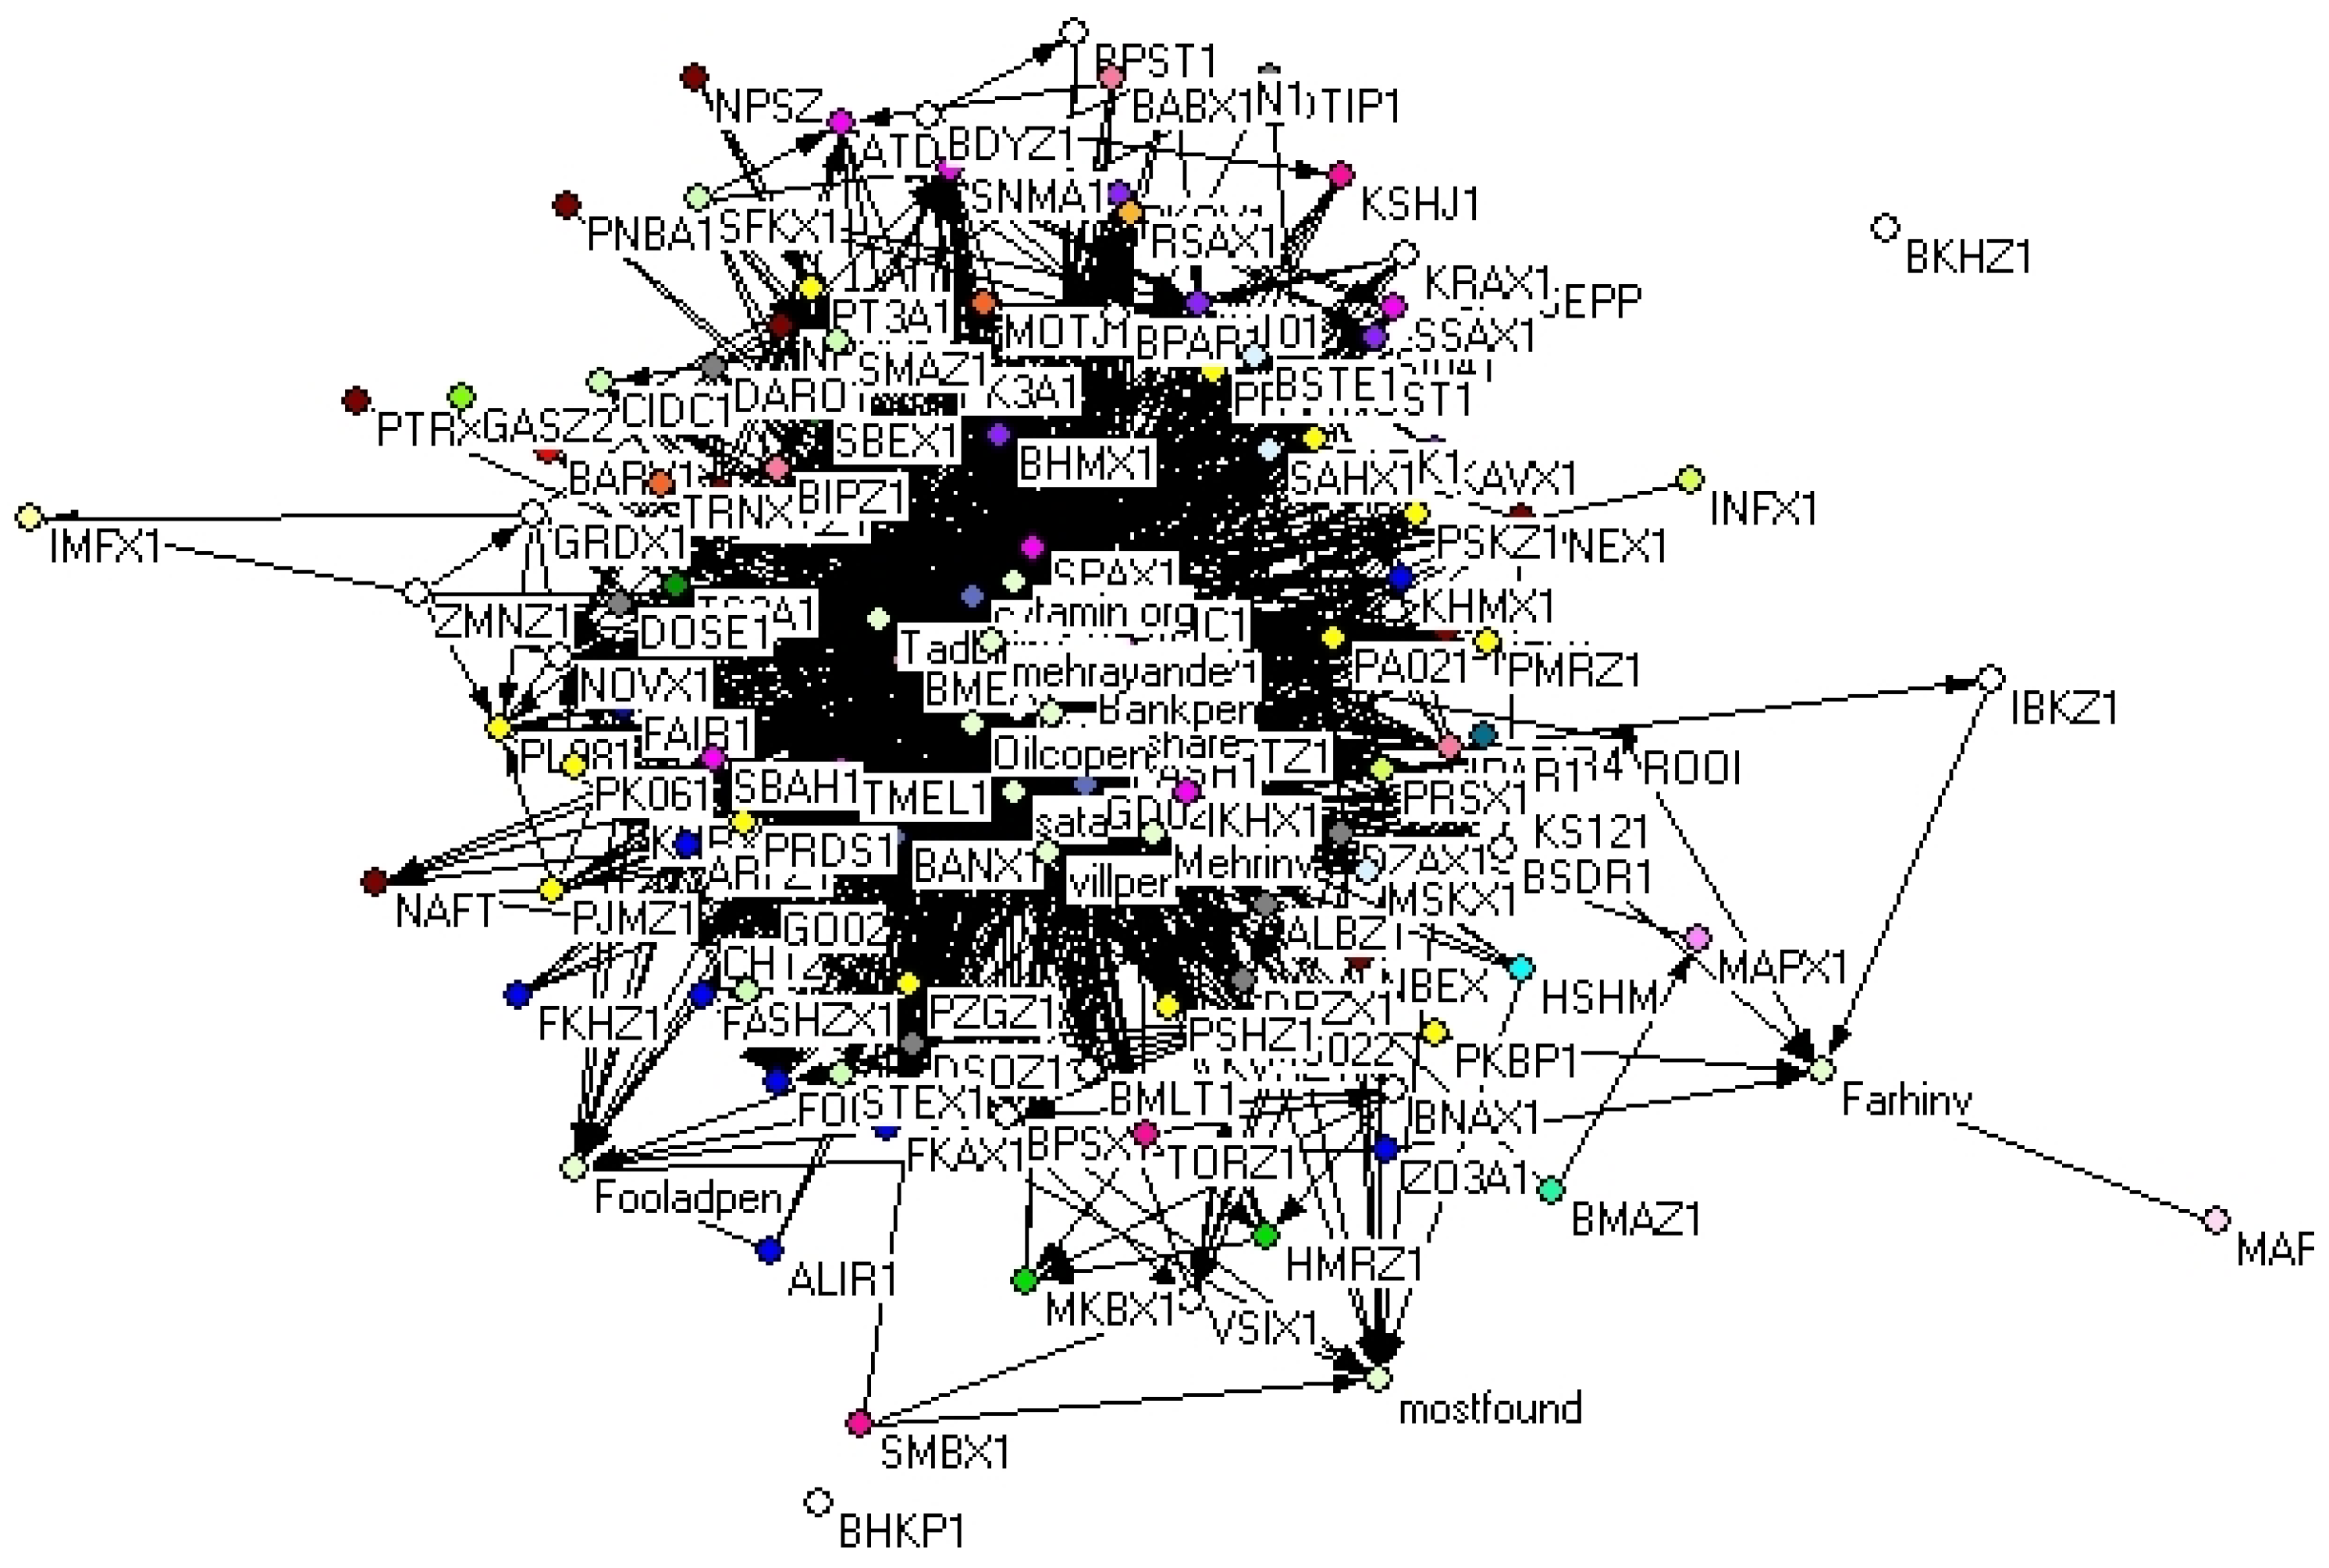
Using network theory and Pajek software, a representation of cross-shareholding network of companies listed on the Tehran Stock Exchange is shown in Figure 3. As it is obvious, nodes are representative of listed companies and external shareholders. According to the sector classification of TSE, the considered companies are categorized according to 27 different sectors distinguished by colors. As can be seen in Figure 3, there are some companies and external shareholders that have more ownership relations with the other agents. The size of node (Figure 3) represents the amount of a node’s degree, where the “government”, “Tamin organization” and the “national pension fund” ranked highest with 40, 31 and 27 arcs, respectively.

Figure 3.
Representation of cross-shareholding network of Tehran Stock Exchange. The size of nodes is related to the degree of each node and the degree is the sum of in-degree and out-degree of nodes.
Although it is not possible to recognize the general structure of the TSE cross-shareholding network, the existence of a bunch of nodes with many in-degree and out-degree as well as some nodes with only inward arcs and outward arcs shows that the existence of a bow-tie structure in the TSE is likely.
Table 2 represents a summary of the statistical analysis of the direct cross-shareholding network and the relevant systemic risk indices in the company and sector level. As shown in Table 2, there was no significant difference between the top five companies for degree, in-degree, and in the direct cross-shareholding network; however, the difference of these indices is more evident in the lower order companies. Except for difference in the order of companies, the only variation was according to existence of “Adalat Shares” in the top five companies based on and , which indicates that even though the “Adalat Shares” has only a few relations with the other companies, it has a significant share in its own companies. Sector analysis shows some differences between the four indices.
Table 2.
Comparison of different systemic risk indices of direct network in the Tehran Stock Exchange.
However, comparison of the out-degree and indices shows that although these indices are introduced as equivalent measures to represent the level of diversification in a company, results of the top five companies and sectors were not similar. This was because there are companies with many outward arcs that have small shares in their own companies. These companies had high ranking according to the out-degree index and an intermediate rank according to . For example, it is evident that according to the out-degree index, the insurance sector, which had the top rank according to , was ranked in the top five companies.
As mentioned in Section 2, the in-degree and show the degree of integration and the out-degree and represent the degree of portfolio diversification of each company. Elliot et al. (2014) [30] in their paper show how the probability of cascades depends on two aspects, integration and diversification of cross-holding network. Integration refers to the level of exposure of companies to each other and the diversification refers to how the cross-holding is spread out. As integration increases, the dependence of organization to each other increases and so the systemic risk become more possible. On the other hand, the increase in integration level causes the companies to be less dependence on their own assets. Thus, although when an initial failure occurs, the integration can increase the likelihood of systemic risk, it can also lessen the probability of the initial failure. With regard to diversification, low diversification level causes companies to be more sensitive to each other, but the cross-holding network is disconnected and the level of systemic risk is limited. As the diversification increases to an intermediate level, the network is connected enough to extend the level of failure and create a great systemic risk. In the high levels of diversification, company’s portfolios are sufficiently diversified so that there are not sensitive to any particular company’s failure.
Elliot et al. (2014) [30] showed that integration and diversification have different, non-monotonic effect on the extent of systemic risk. They showed that there are two conditions to occur systemic risk. The first is that integration is intermediate: each organization holds enough of its own assets that the idiosyncratic devaluation of those assets can spark a first failure, and holds enough of other organizations for failures to propagate. The second condition is that organizations are partly diversified: the network is connected enough for cascades to spread widely, but nodes do not have so many connections that they are well-insured against the failure of any counterparty.
Considering and as integration and diversification indices, the more systemically important companies are those with an intermediate level of and . Figure 4 illustrates the relation of and for different companies in the TSE. It is obvious that most of the nodes have low levels of integration and diversification which are not considered as systemically important companies. There are also some companies with medium level of and low level of or medium level of and low level of , which present threats to the financial market according to integration and diversification, respectively. The main point in accord to the Elliot et al. (2014) [30] analysis is that there is limited number of companies which have an intermediate level of both and and are the most systemically important companies in the Tehran Stock Exchange.
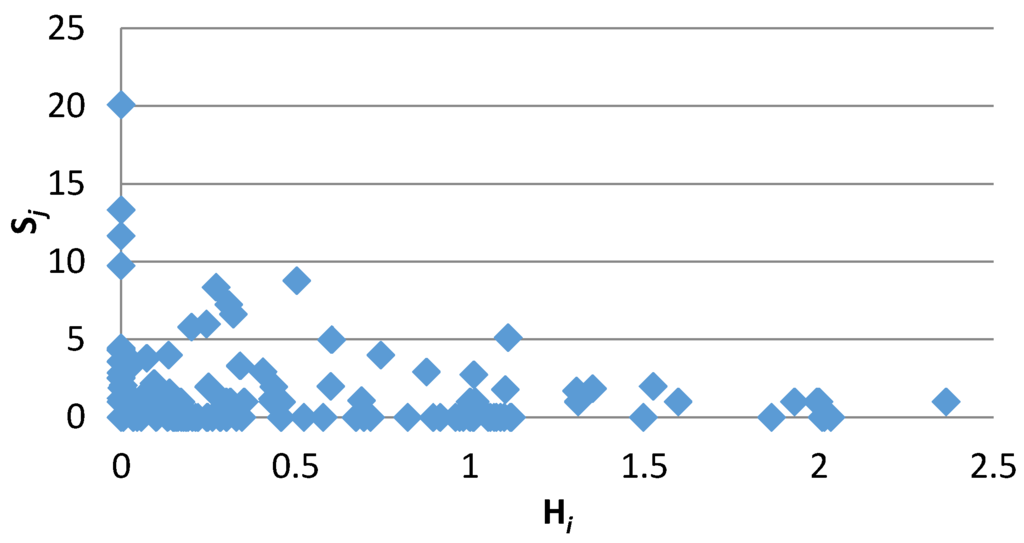
Figure 4.
versus relationship.
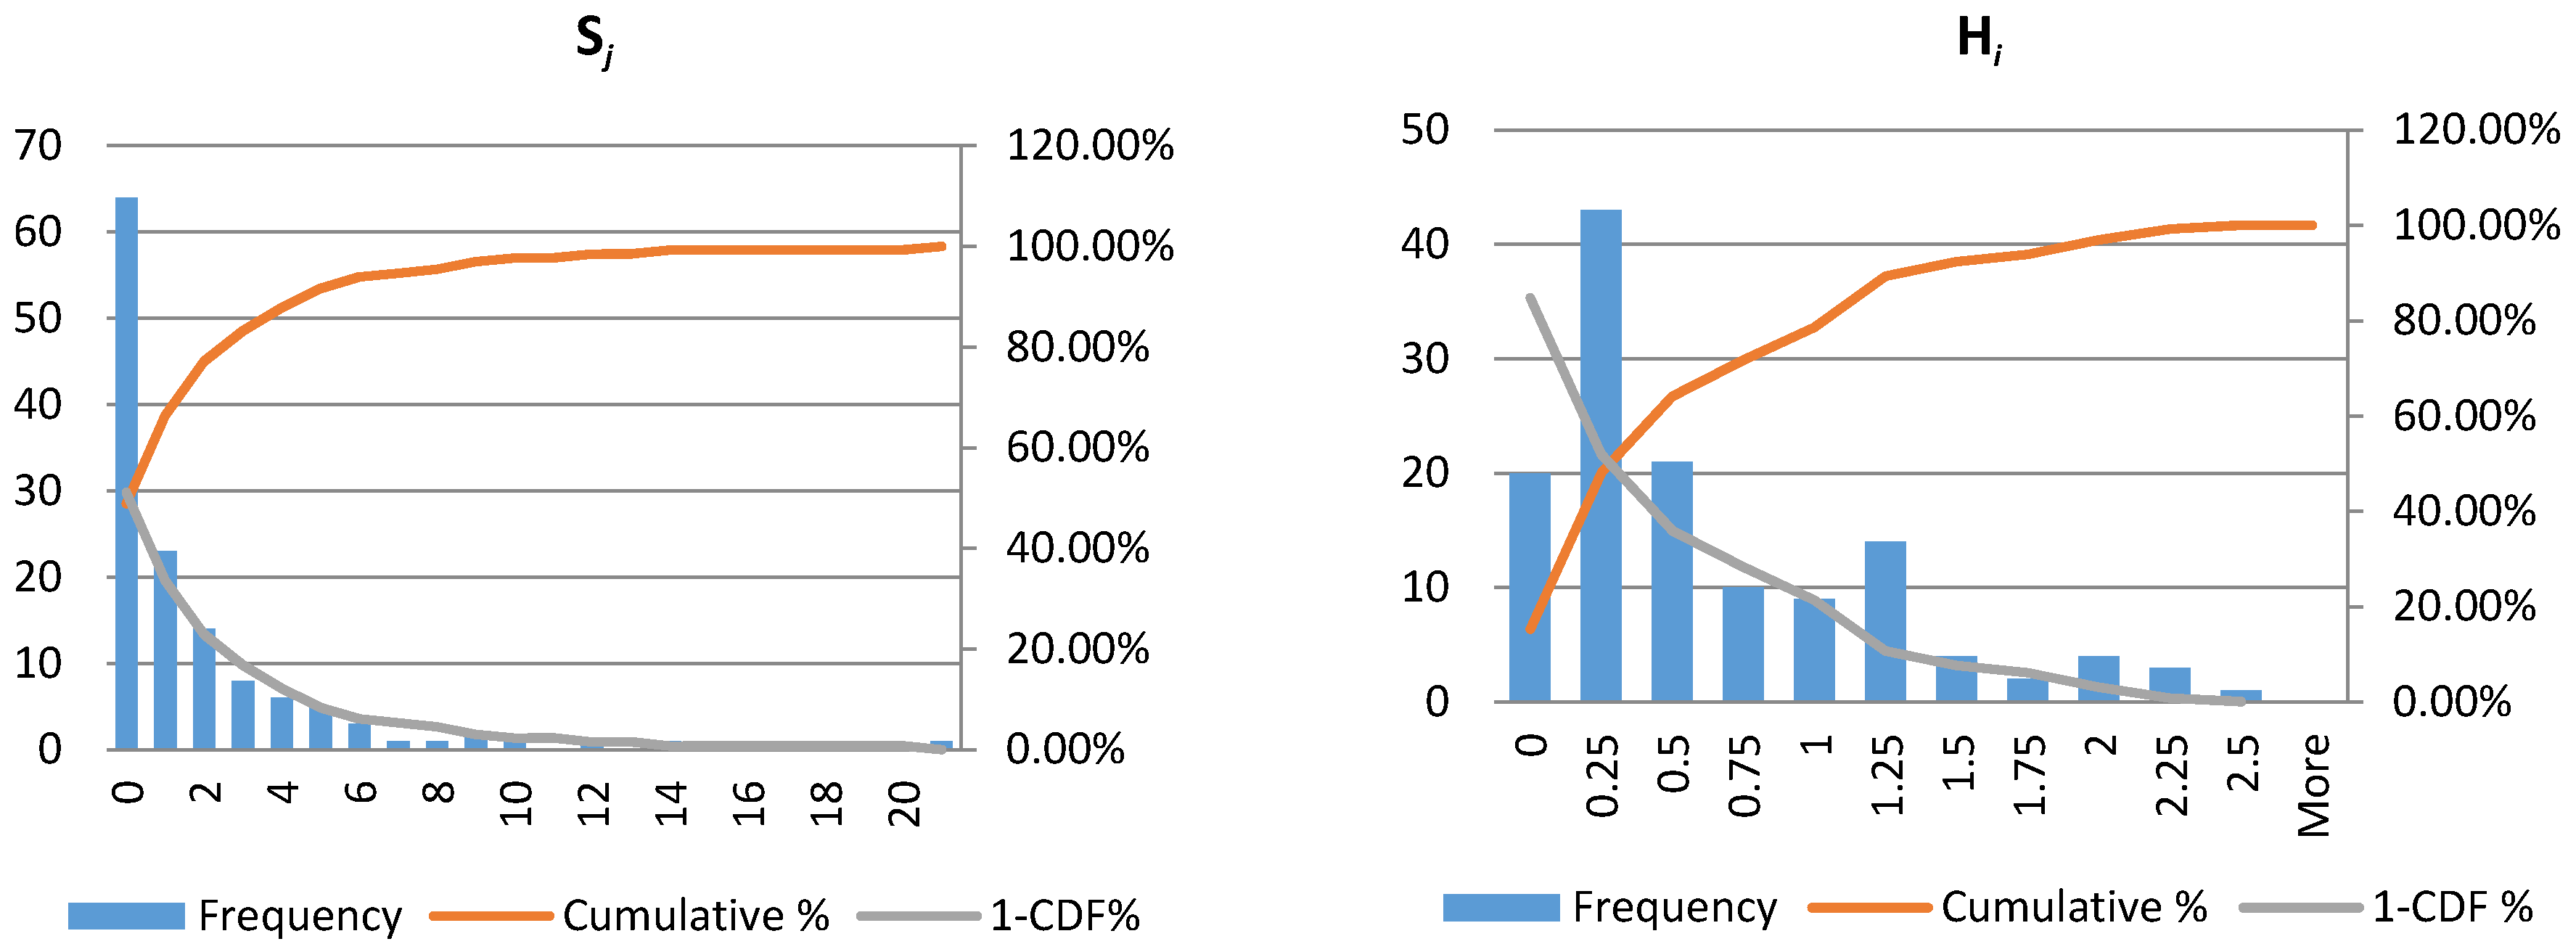
However, in order to comprehend the geometric characteristics of the TSE cross-shareholding network, the statistical distribution of and will be analyzed in this section. as the complement of cumulative distribution represents the probability that is greater than or equal to a determined value . To analyze the hypothesis of power-law distribution for , can be proportional to as follows:
Therefore, probability densities function of can be represented as the following equation:
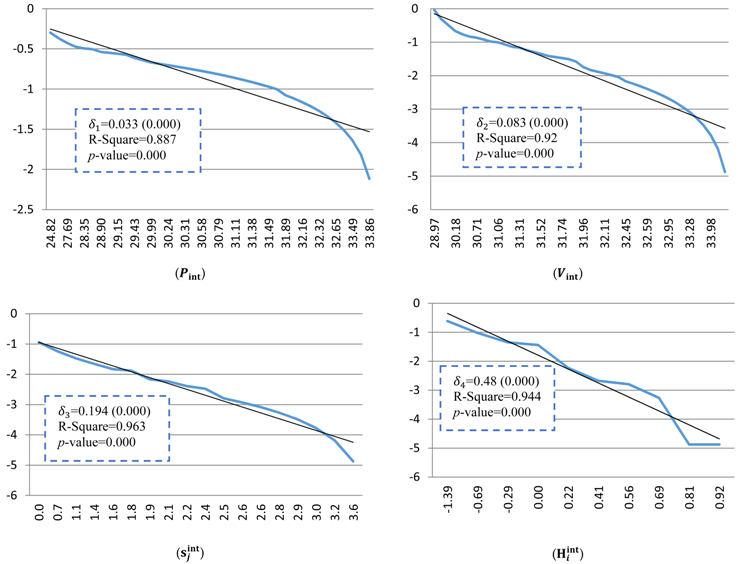
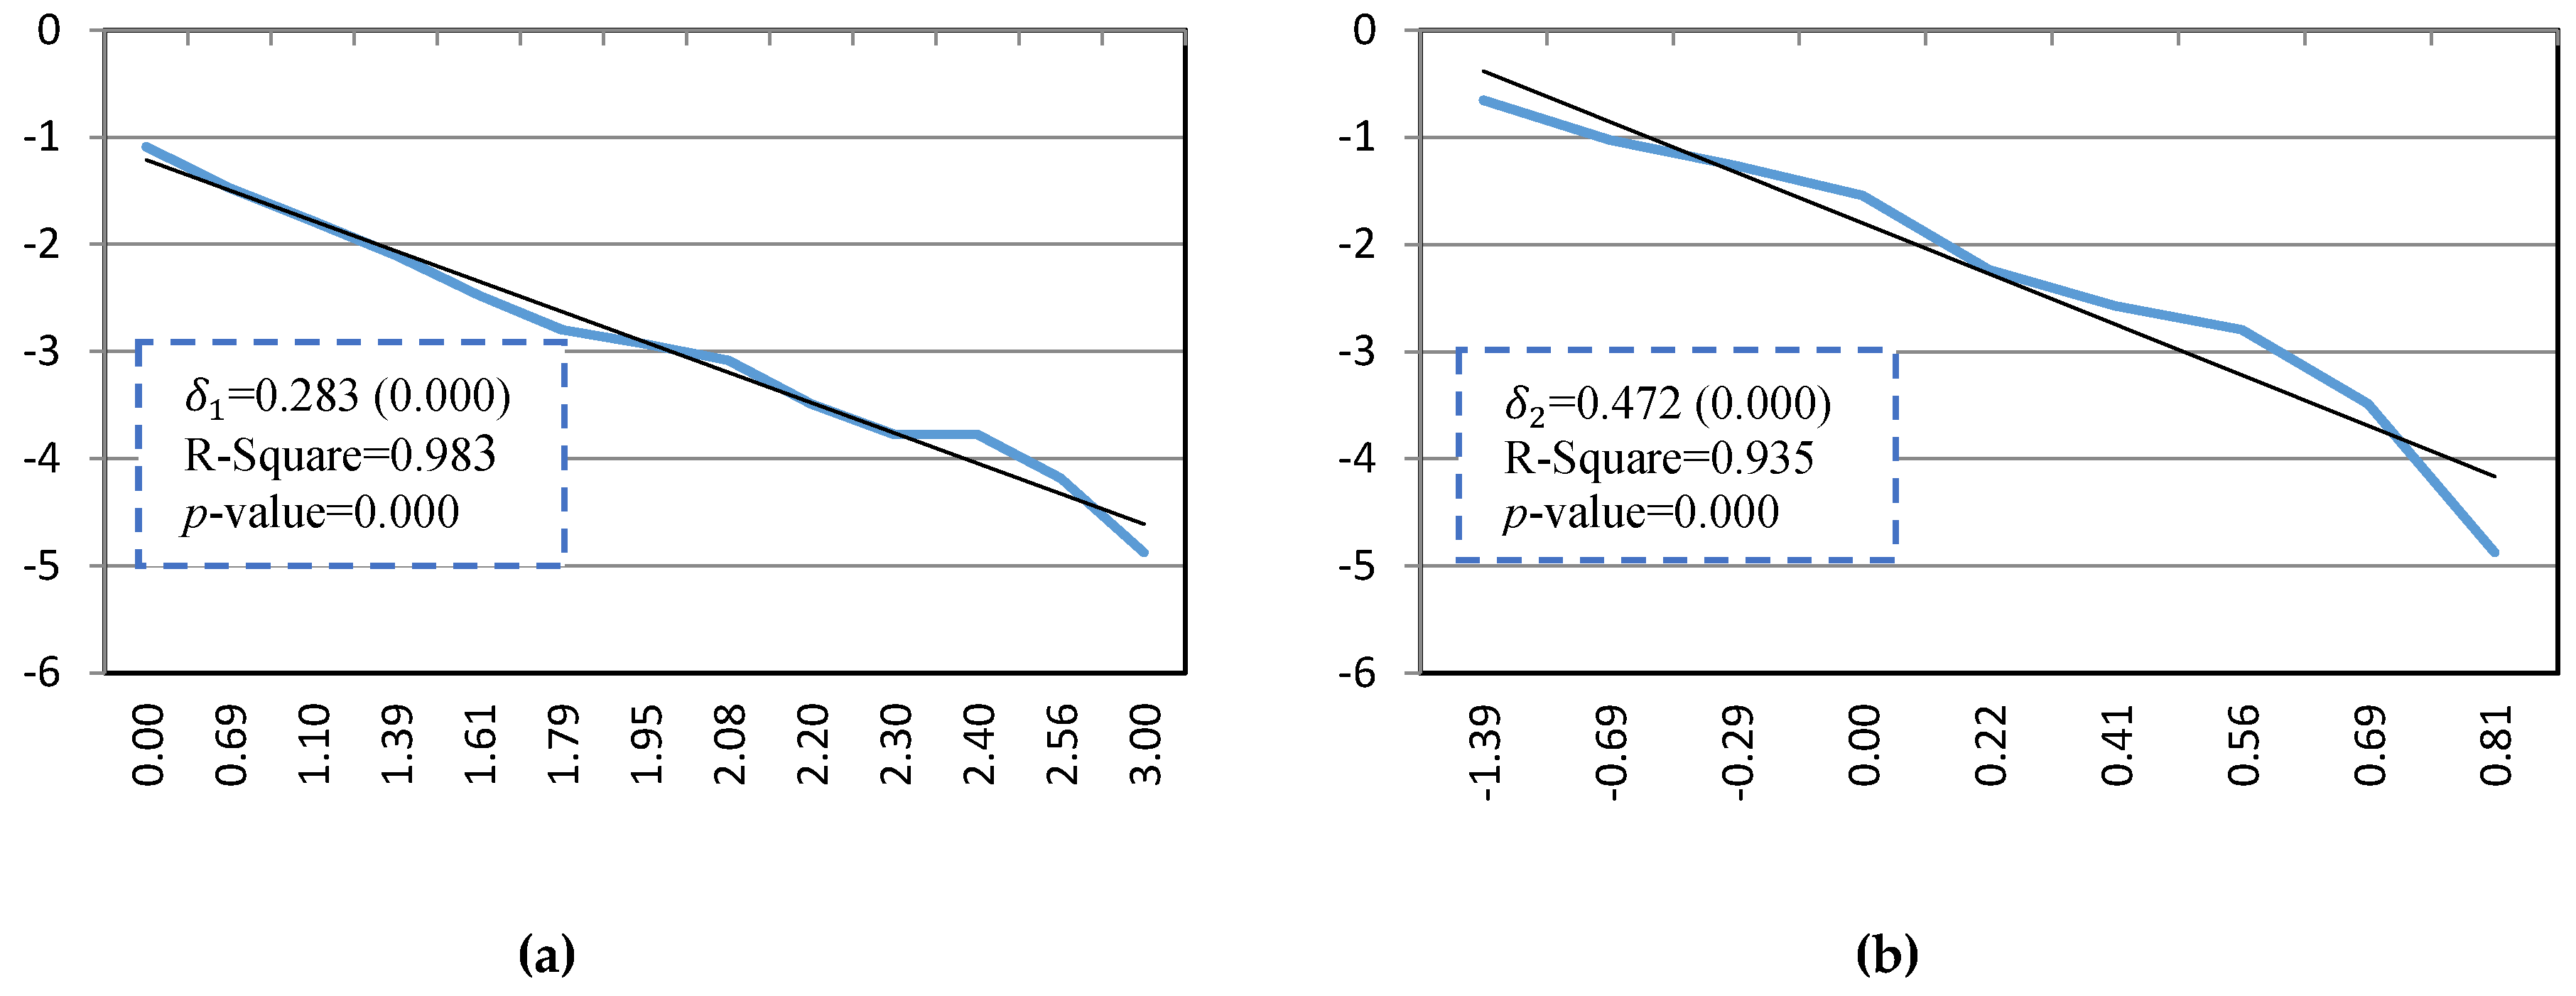
Similar analysis can be represented for the index. Figure 5 shows the frequency and the cumulative distribution of and . For more details, Figure 6a,b show the complement of cumulative distribution of and in a log-log scale. The values of are calculated using linear regression and the hypothesis that the cross-shareholding network is scale free is tested. As can be seen in the figures, the results of the test in 95% significance level show that there is no evidence to reject the null hypothesis that the cumulative distributions follow the power-law distribution and consequently, the cross-shareholding network of TSE is a scale free network.

Figure 5.
Histogram, cumulative distribution and complement of cumulative distribution of and .

Figure 6.
(a) Cumulative distribution of ; and (b) cumulative distribution of .
4.2. Integrated Cross-Shareholding Network
Using the integrated ownership matrix, the integrated cross-shareholding network of TSE is represented in Figure 7. It is clear that the number of network relations is increased significantly; it shows a rise from 385 arcs in the direct network to 1422 arcs in the integrated network. Similar to the direct network, the integrated network has also a strongly connected component that shows the existence of Bow-Tie structure is likely. In this section, the integrated market value () and integrated portfolio value () are applied as the systemic risk indices to determine systemically important companies. Furthermore, and measures are also adjusted according to the integrated matrix as and to evaluate the systemic risk importance based on the interconnectedness of network. Table 3 summarizes results of these indices in TSE.
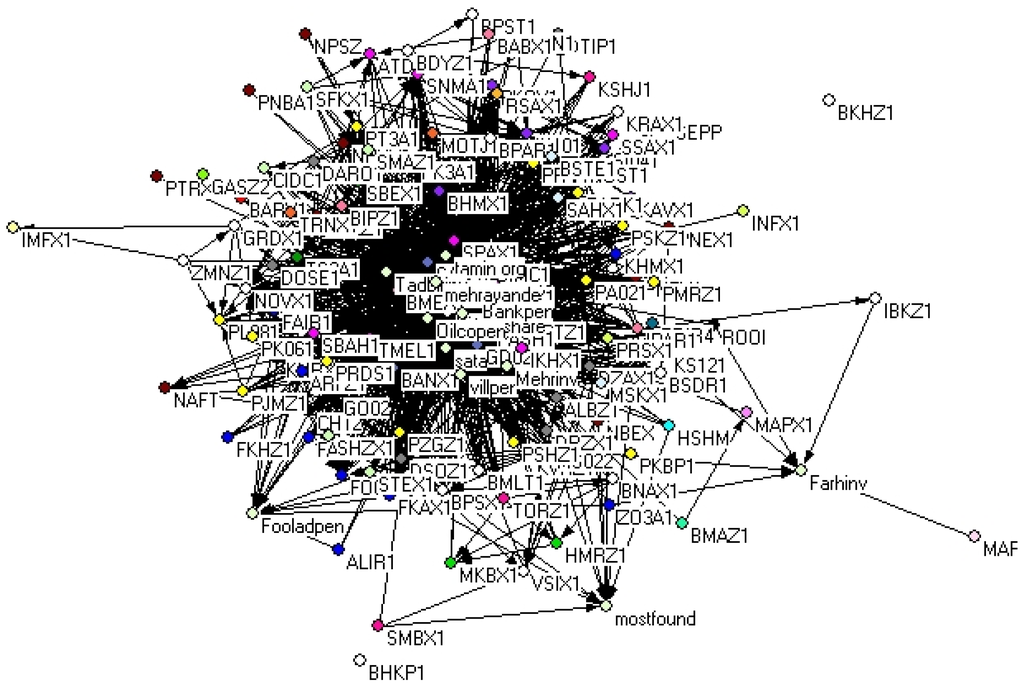
Figure 7.
Representation of the cross-shareholding network of Tehran Stock Exchange based on the integrated ownership matrix.
Table 3.
Comparison of different systemic risk indices of integrated network in the Tehran Stock Exchange.
As can be seen in Table 3, although some differences in ranking of companies are detected, there are no differences in the top five companies of systemic risk according to and . it should be noted that the difference of these indices is deepened in the lower orders. In the sector analysis, there are some variations in the results of the two indices. For example, as engineering services companies in TSE do not have a diversified portfolio in other listed companies and consequently have a lower level of , their considerable intrinsic market values made a high level of . On the other hand, comparison of and indices with and shows that integrated cross-shareholding network has a significant effect on results of the top five companies. These results indicate that consideration of integrated ownership leads to a more reliable analysis of companies that are systemically important. Similar analysis of the integration and diversification level shows that companies with an intermediate level of and are exposed to minimum level of systemic risk.
The analysis of the statistical characteristics of the integrated share-holding network of TSE represents that the cross-shareholding network is a scale free network according to , and .
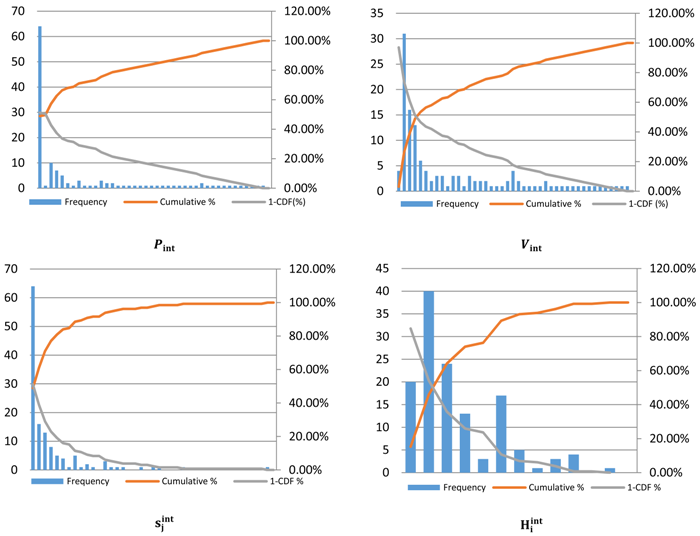
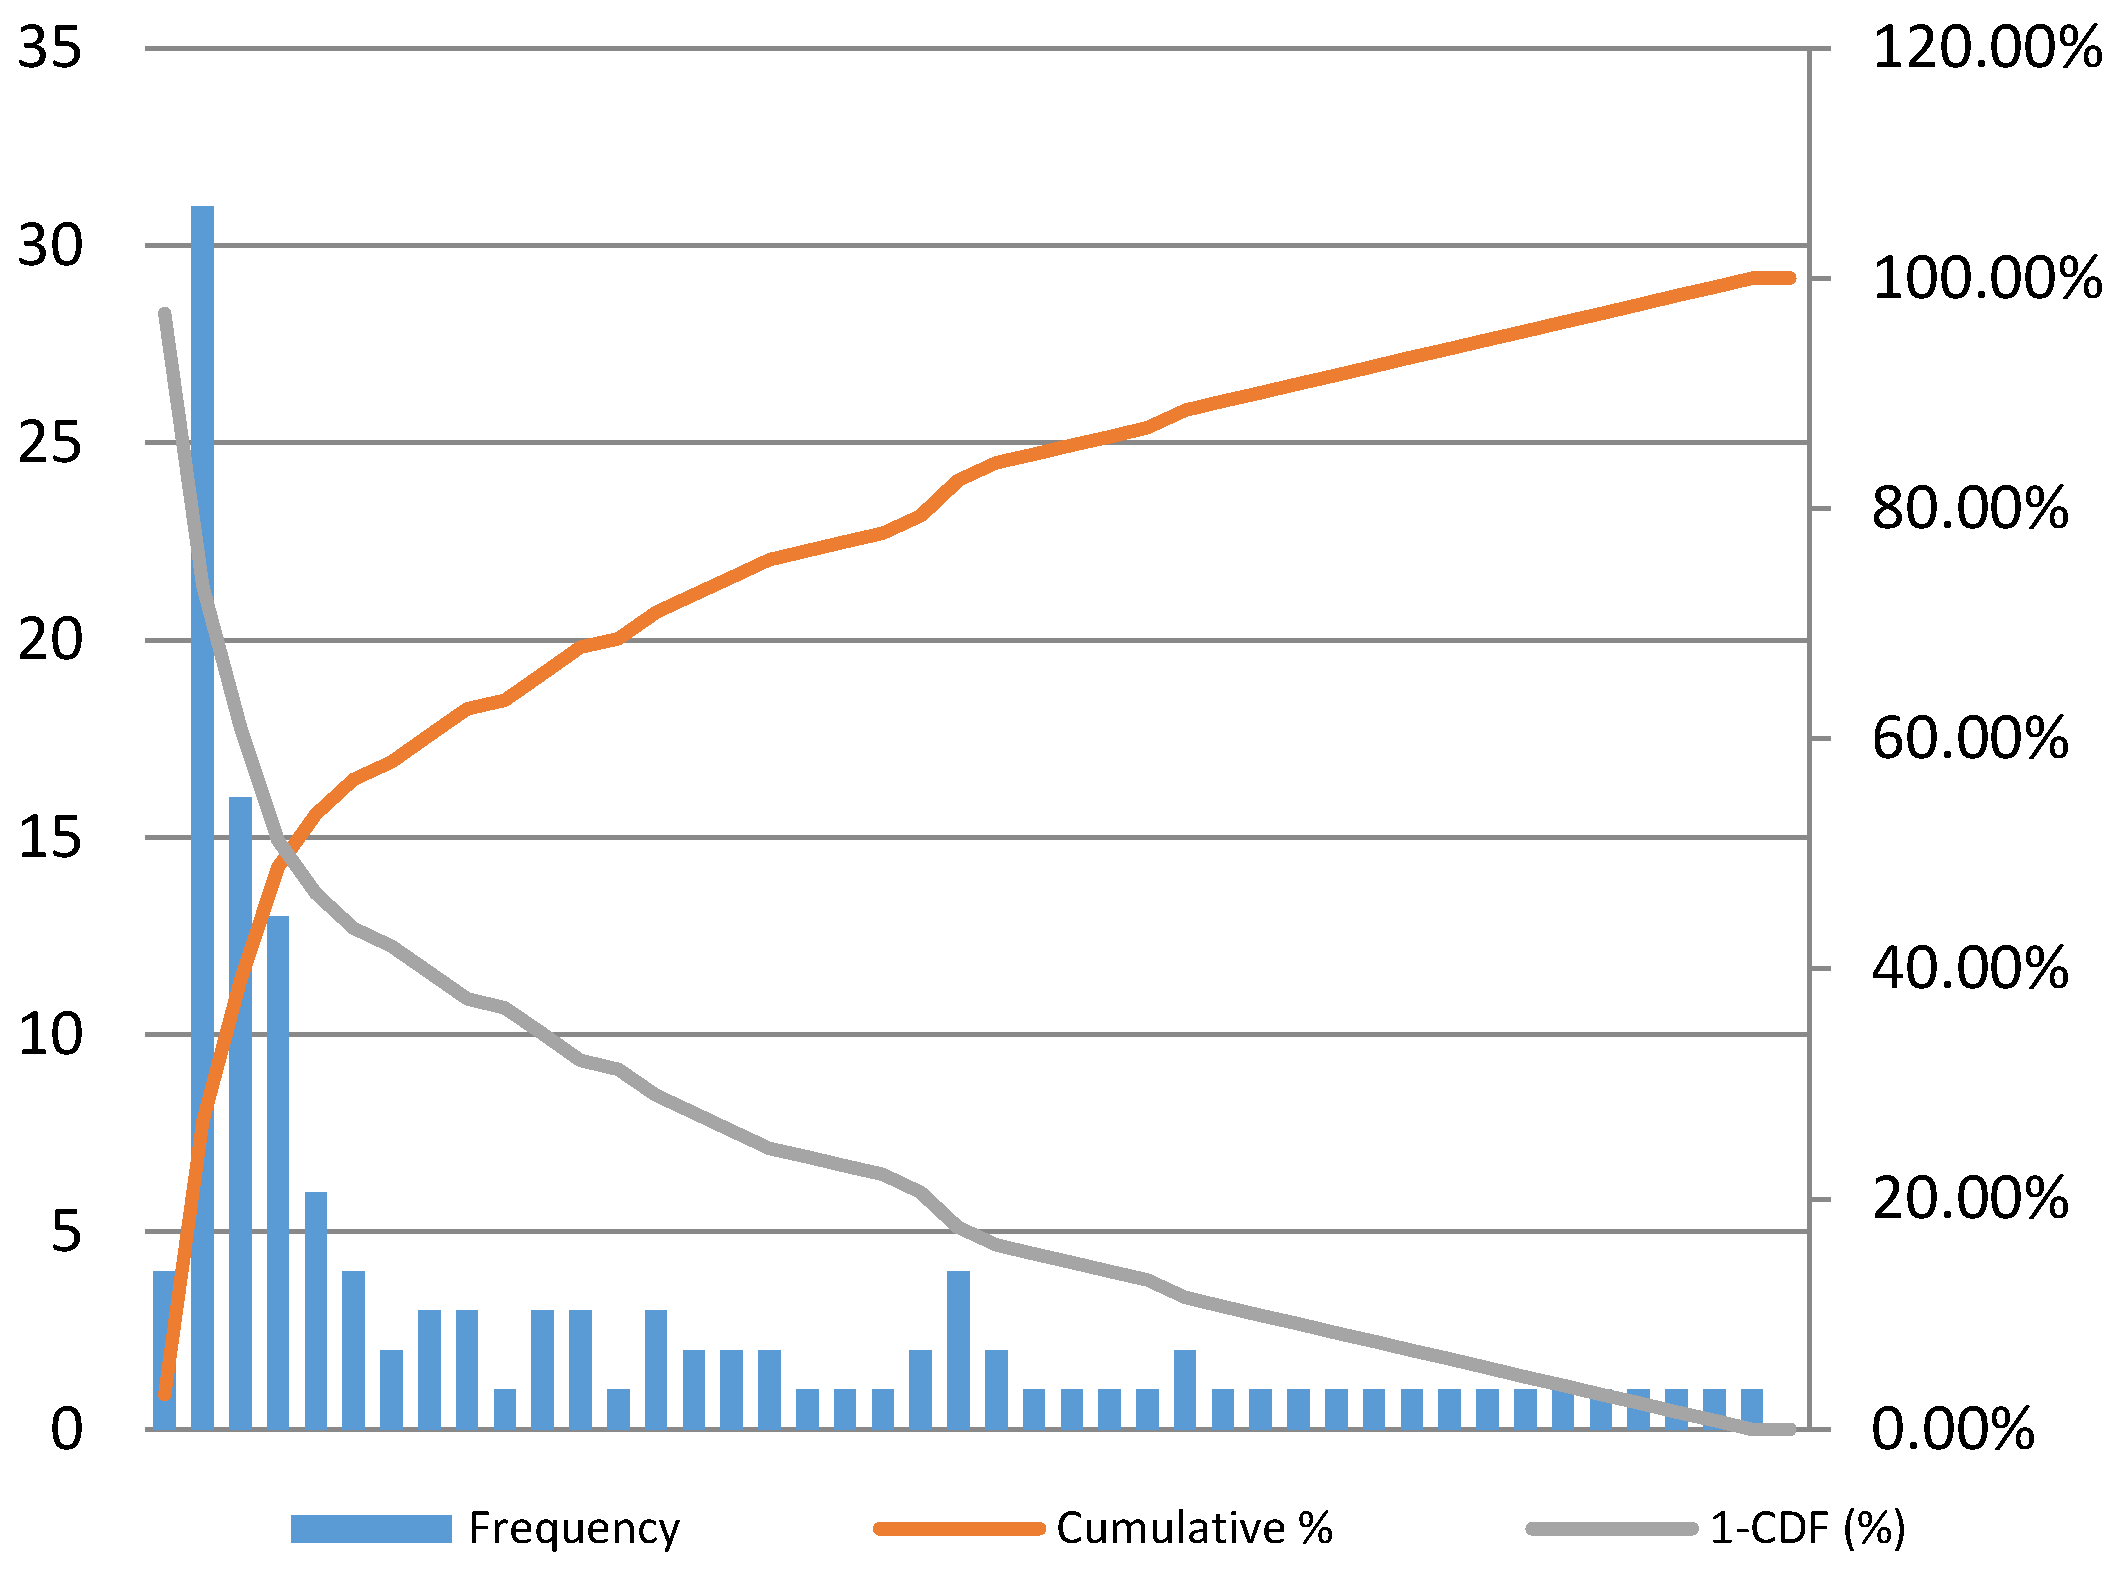
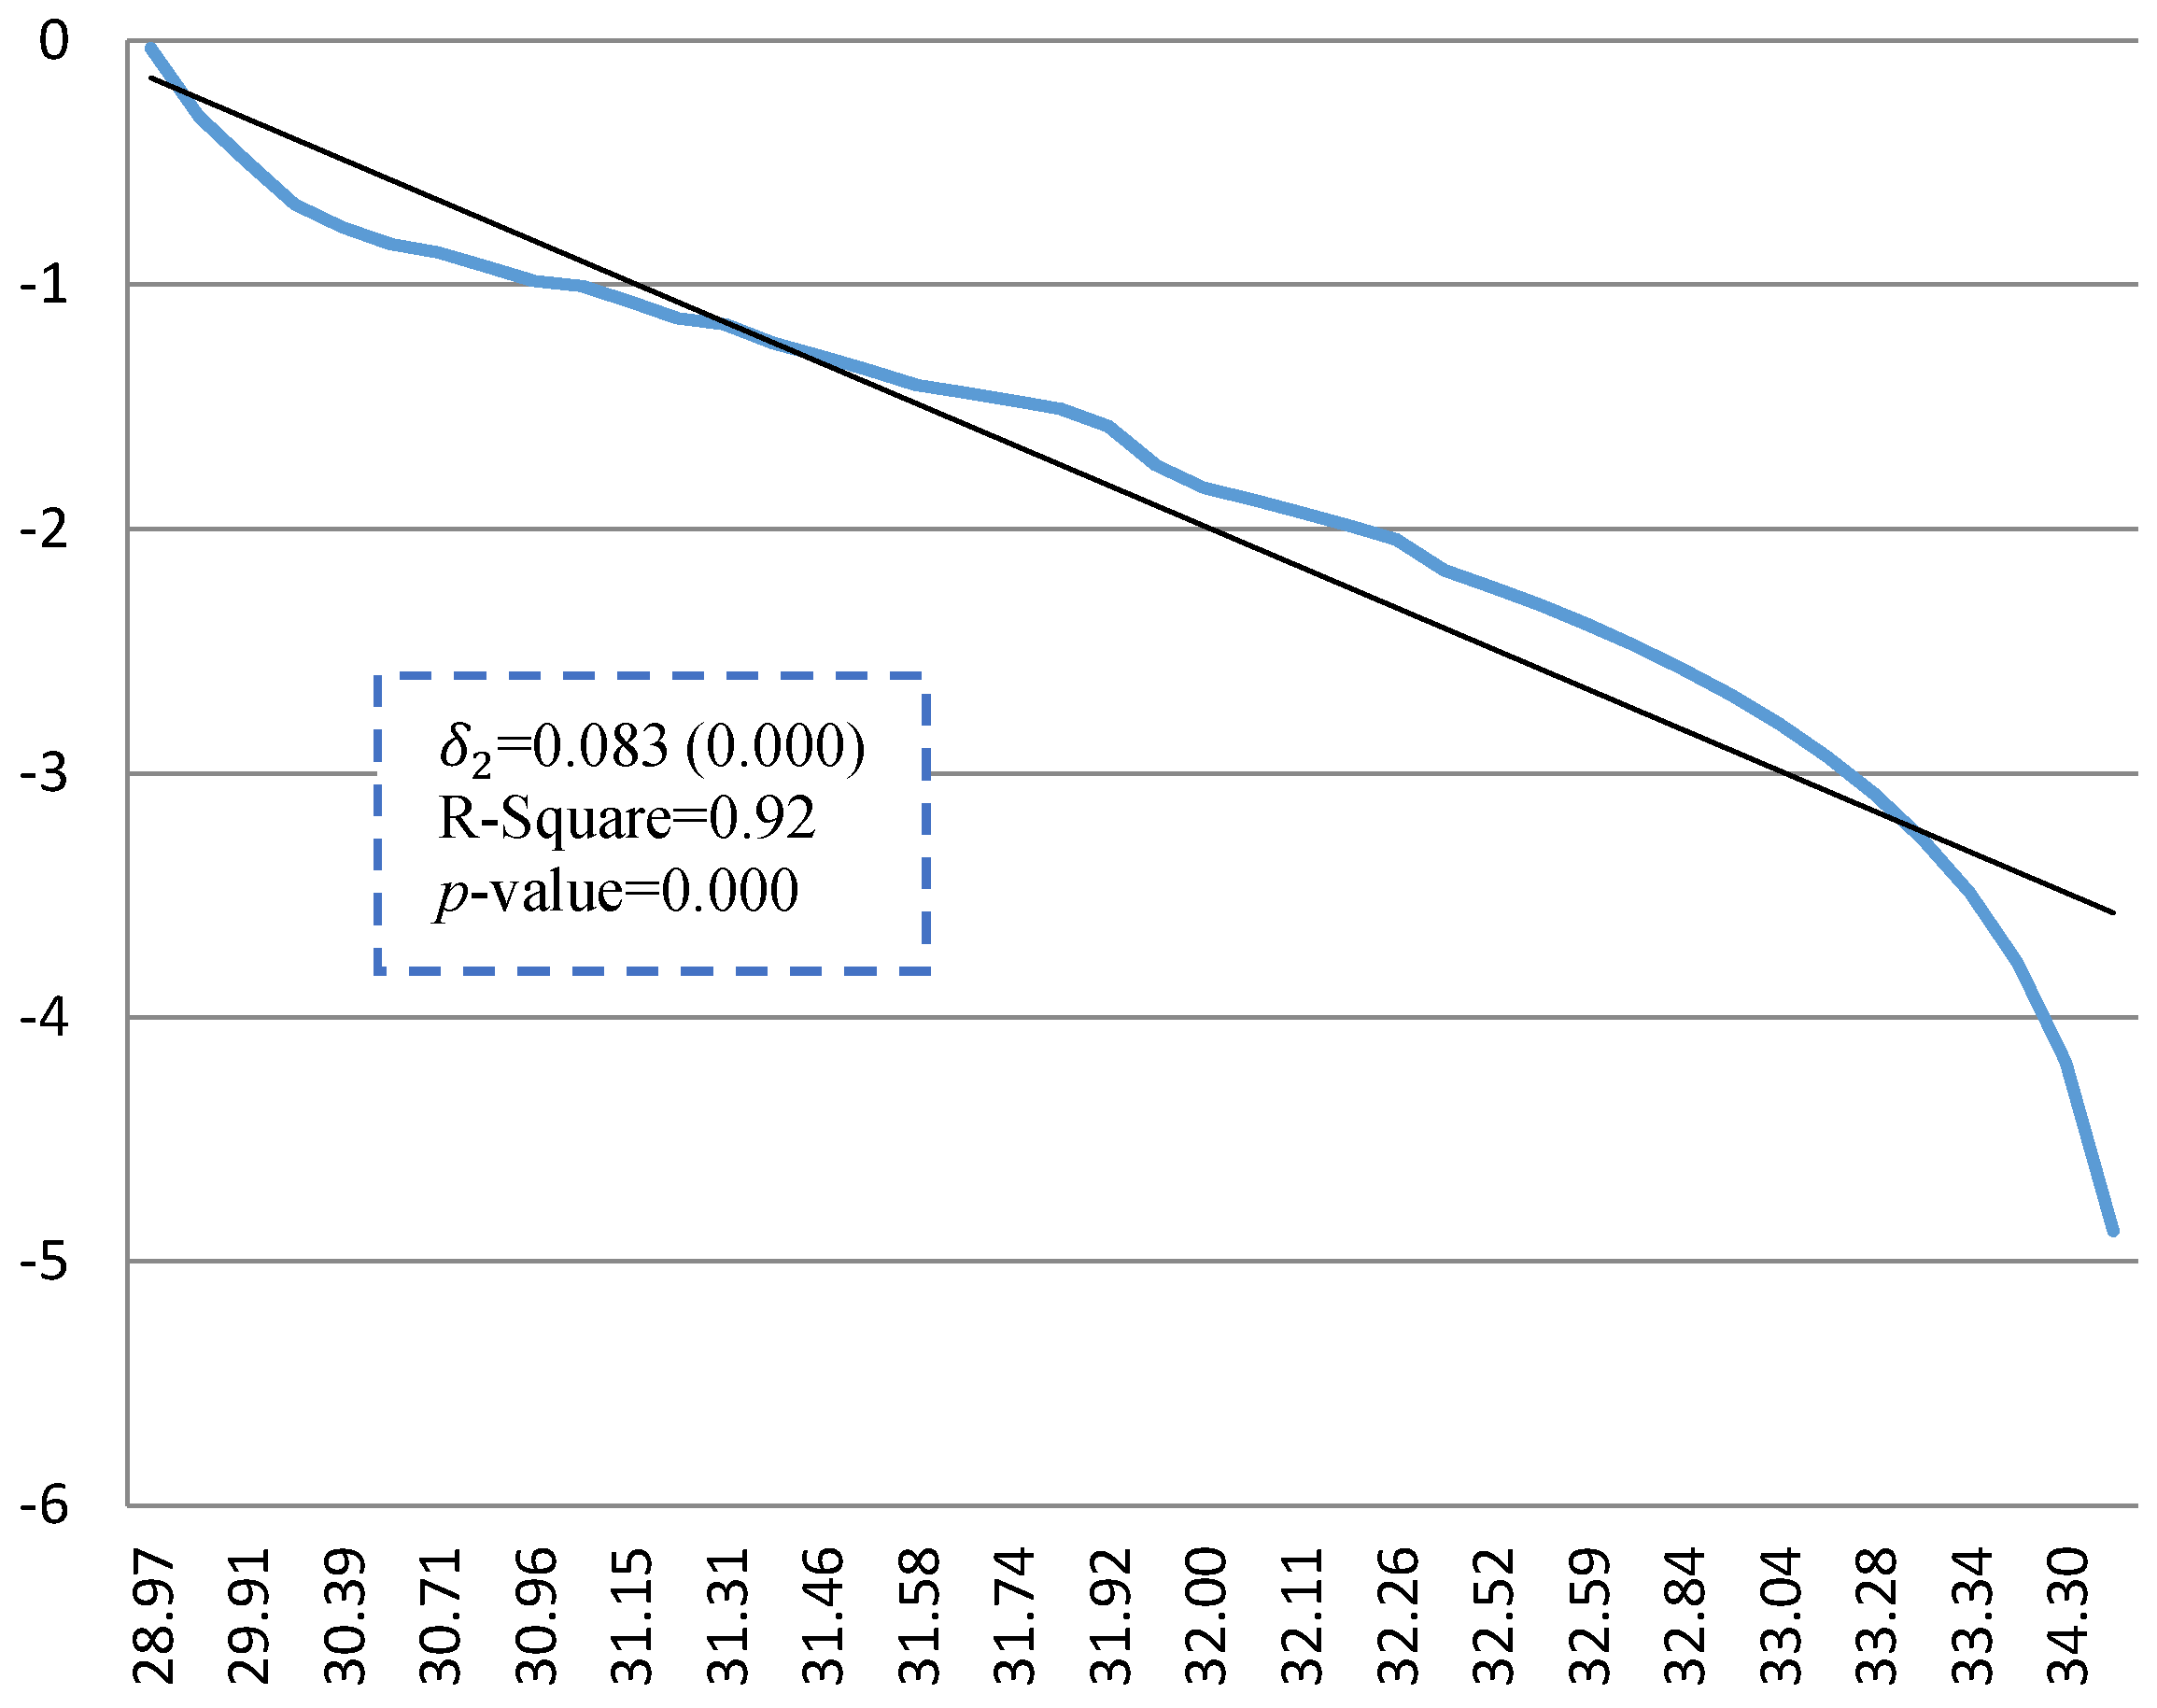
Figure 8 illustrates the histogram and cumulative distribution and Figure 9 illustrates the complement of cumulative distribution of integrated market values () in a log-log scale, respectively. The histogram and complement of cumulative distribution of and are represented in Appendix B and Appendix C. The results of a linear regression for the variables show statistically significant values for at 95% significant level and the results show that there is no evidence to reject the null hypothesis that the cumulative distributions follow the power-law distribution.
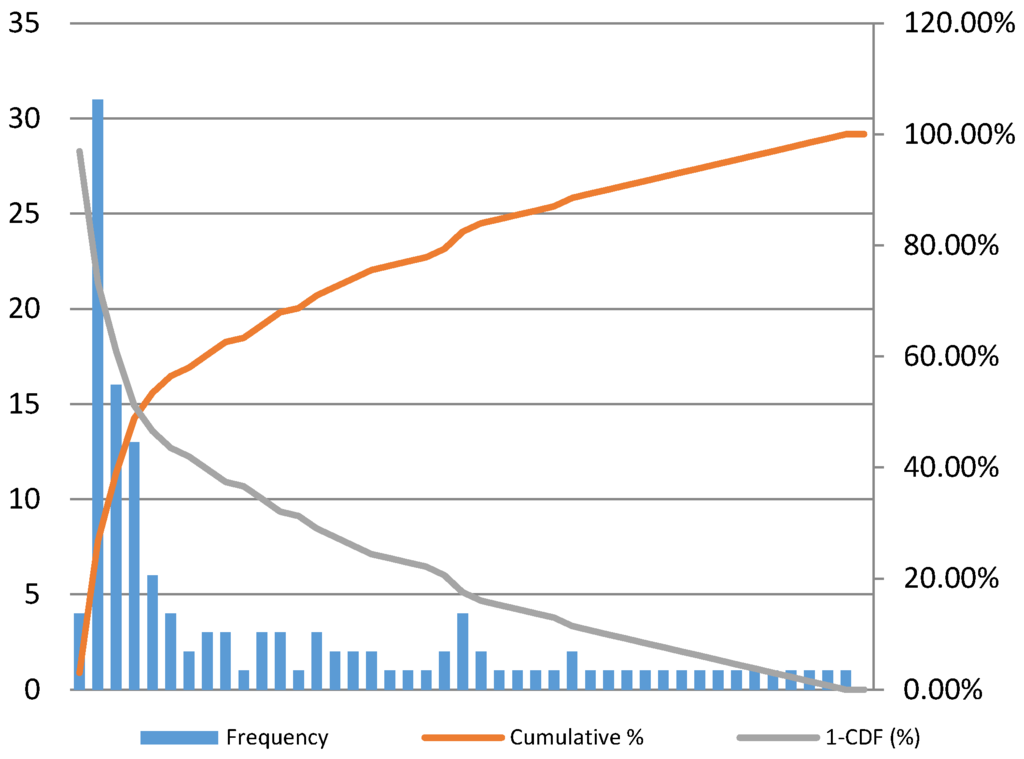
Figure 8.
Histogram, cumulative distribution and complement of cumulative distribution of .

Figure 9.
Cumulative distribution of , and .
In an economic point of view, the results show that the most systemically important agents of the Iranian economic systems are the external shareholders, which among them, the government has the main role. In fact, since most of the other external shareholders, Industrial holding and investment companies are under the management of government, an economic shock to the government can lead to a critical crisis. Since the Iranian government expenses have a large dependency to the Oil revenues, a significant decline in the oil revenues, like what is happened in the year 2014, cause a great depression in the Iranian economy. In the level of equity market, as the government tried to fire-sell its assets to cover the expenses, the stability of the market is decreased. This is also the case for the pension funds, which tried to provide their liquidities for their monthly payments.
5. Conclusions
Systemic risk is relevant to the inter-connection and correlation of different parts of a market and the control and mitigation of systemic risks is one of the main challenges of financial markets. Due to the fact that different companies do not have the same contribution in the occurrence of systemic risk, the identification of systemically important companies is recommended to the financial authorities. Recently, network theory has been widely applied for analysis of the behavior of financial systems, financial crisis and systemic risk. In this paper, cross-shareholding network of Tehran Stock Exchange is represented as a bi-level network. Based on the cross-shareholding data, the direct and integrated cross-shareholding network of TSE is represented and different systemic risk indices are applied and statistically appraised.
Results show that the cross-shareholding network is a good representation for analysis of systemic risk in financial markets. The consideration of integrated ownership in the cross-shareholding network leads to a more reliable network and a better understanding of systemic risk importance for different companies. Moreover, the results of statistical analysis show that the cross-shareholding network of TSE is a scale free network. The existence of scale free network shows that the stock market is fertile for the crisis in the case of systemic risk events. Although the identification of systemically important companies is an effective way to control systemic risks, simulation of the behavior of companies in the case of systemic events can lead to better results and is proposed for future research.
Acknowledgment
The authors would like to thank two anonymous referees for their valuable comments on this paper.
Author Contributions
Both authors contributed to the conceptualization of the paper and the policy analysis. Hossein Dastkhan also drafted the paper and performed the empirical analysis.
Conflicts of Interest
The authors declare no conflict of interest.
Appendix B: Histogram and Cumulative Distribution of Systemic Risk Measures
Appendix C: Complement of Cumulative Distribution of Systemic Risk in Log-Log Scale
References
- N. Pecora, and A. Spelta. “Shareholding relationships in the Euro Area banking market: A network perspective.” Phys. A 434 (2015): 1–12. [Google Scholar] [CrossRef]
- A.G. Haldane, and R.M. May. “Systemic risk in banking ecosystems.” Nature 469 (2011): 351–355. [Google Scholar] [CrossRef] [PubMed]
- P. Smaga. The Concept of Systemic Risk. Systemic Risk Centre Working Paper; London, UK: London School of Economics, 2014. [Google Scholar]
- V. Boginski, S. Butenko, and P.M. Pardalos. “Mining market data: A network approach.” Comput. Oper. Res. 33 (2006): 3171–3184. [Google Scholar] [CrossRef]
- F.X. Diebold, and K. Yilmaz. “On the Network Topology of Variance Decompositions: Measuring the Connectedness of Financial Firms.” J. Econom. 182 (2014): 119–134. [Google Scholar] [CrossRef]
- C. Upper. “Simulation methods to assess the danger of contagion in interbank markets.” J. Financ. Stab. 7 (2011): 111–125. [Google Scholar] [CrossRef]
- J.P. Onnela, A. Chakraborti, K. Kaski, and J. Kertesz. “Dynamic asset trees and black Monday.” Phys. A Stat. Mech. Appl. 324 (2003): 247–252. [Google Scholar] [CrossRef]
- X.F. Liu, and C.K. Tse. “Dynamics of network of global stock market.” Account. Finance Res. 1 (2012): 1–12. [Google Scholar] [CrossRef]
- F. Allen, and D. Gale. “Financial Contagion.” J. Political Econ. 108 (2000): 1–33. [Google Scholar] [CrossRef]
- G. Hałaj, and C. Kok. “Assessing interbank contagion using simulated networks.” Comput. Manag. Sci. 10 (2013): 157–186. [Google Scholar] [CrossRef]
- S. Lenzu, and G. Tedeschi. “Systemic risk on different interbank network topologies.” Phys. A 391 (2012): 4331–4341. [Google Scholar] [CrossRef]
- J.B. Glattfelder. “Ownership Networks and Corporate Control: Mapping Economic Power in a Globalized World.” Available online: https://www.sg.ethz.ch/media/medialibrary/2013/12/james_glatteth-2007-02.pdf (accessed on 2 September 2014).
- A. Westphal. “Systemic Risk in the European Union: A Network Approach to Banks’ Sovereign Debt Exposures.” Int. J. Financ. Stud. 3 (2015): 244–279. [Google Scholar] [CrossRef]
- S. Battiston, and J.B. Glattfelder. “Backbone of complex networks of corporations: The flow of control.” Phys. Rev. E 80 (2009): 036104. [Google Scholar]
- S. Vitali, J.B. Glattfelder, and S. Battiston. “The network of global corporate control.” PLoS ONE 6 (2011): e25995. [Google Scholar] [CrossRef] [PubMed]
- S. Battiston. “Inner structure of capital control networks.” Phys. A 338 (2004): 107–112. [Google Scholar] [CrossRef]
- Y.Y. Ma, X.T. Zhuang, and L.X. Li. “Research on the relationships of the domestic mutual investment of China based on the cross-shareholding networks of the listed companies.” Phys. A 390 (2011): 749–759. [Google Scholar] [CrossRef]
- D. Garlaschelli, S. Battiston, M. Castri, V.D.P. Servedio, and G. Caldarelli. “The scale-free topology of market investments.” Phys. A 350 (2005): 491–499. [Google Scholar] [CrossRef]
- C. Comet, and N. Pizarro. “The cohesion of inter-corporate networks in France.” Procedia Soc. Behav. Sci. 10 (2011): 52–61. [Google Scholar] [CrossRef]
- H. Li, W. Fang, H. An, and L. Yan. “The shareholding similarity of the shareholders of the worldwide listed energy companies based on a two-mode primitive network and a one mode derivative holding-based network.” Phys. A 415 (2014): 525–532. [Google Scholar] [CrossRef]
- H. Li, H. An, X. Gao, J. Huang, and Q. Xu. “On the topological properties of the cross shareholding networks of listed companies in China: Taking shareholders’ cross-shareholding relationships into account.” Phys. A 6 (2014): 80–88. [Google Scholar] [CrossRef]
- “Official Website of Tehran Stock Exchange.” Available online: http://www.tsetmc.com/Loader.aspx?ParTree=15 (accessed on 20 January 2015).
- S.M. Jaramillo, B.A. Kabadjova, B.B. Benitez, and J.P.S. Margain. “An empirical study of the Mexican banking system’s network and its implications for systemic risk.” J. Econ. Dyn. Control 40 (2014): 242–265. [Google Scholar] [CrossRef]
- R. Cont, A. Moussa, and E.B. Santos. “Network Structure and Systemic Risk in Banking Systems, 2010.” Available online: http://ssrn.com/abstract=1733528 or http://dx.doi.org/10.2139/ssrn.1733528 (accessed on 5 June 2015).
- T.O. Kuzubaş, I. Ömercikoğlu, and B. Saltoğlu. “Network centrality measures and systemic risk: An application to the Turkish financial crisis.” Phys. A Stat. Mech Appl. 405 (2014): 203–215. [Google Scholar] [CrossRef]
- M.E.J. Newman. “Analysis of weighted networks.” Phys. Rev. E 70 (2004): 056131. [Google Scholar] [CrossRef] [PubMed]
- T. Opsahl, F. Agneessens, and J. Skvoretz. “Node centrality in weighted networks: Generalizing degree and shortest paths.” Soc. Netw. 32 (2010): 245–251. [Google Scholar] [CrossRef]
- C.H. Hubbell. “An Input-Output Approach to Clique Identification.” Sociometry 28 (1965): 377–399. [Google Scholar] [CrossRef]
- F. Brioschi, L. Buzzacchi, and M.G. Colombo. “Risk Capital Financing and the Separation of Ownership and Control in Business Groups.” J. Bank. Finance 13 (1989): 747–772. [Google Scholar] [CrossRef]
- M. Elliott, B. Golub, and M.O. Jackson. “Financial Networks and Contagion.” Am. Econ. Rev. 104 (2014): 3115–3153. [Google Scholar] [CrossRef]


© 2016 by the authors; licensee MDPI, Basel, Switzerland. This article is an open access article distributed under the terms and conditions of the Creative Commons Attribution (CC-BY) license (http://creativecommons.org/licenses/by/4.0/).