Abstract
The primary objective of this article is to answer the following two research questions: has the growing public debt of state governments promoted increased public investment? If the answer is yes, then does any increase in public investment lead to more growth in the Mexican states? Dynamic Models of panel data and the Generalized Method of Moments, with information for 32 states from 1993 to 2012, were used for this purpose. The econometric results confirmed that public debt is positively correlated with public investment and that this in turn generates economic growth. This does not mean that a good economic policy strategy has been followed, since the marginal positive impact of public investment, and therefore the public debt on the production per person, is reduced (1% increase in the interaction between public investment and public debt variable causes a 0.0005% increase in economic growth). This suggests deviations from the debt contracted for purposes other than production, which could lead to a situation of unsustainability of state public finances in the medium term.
JEL Classification:
H72; H74; O40
1. Introduction
The Mexican economy is underdeveloped and the authorities have not found a way to overcome this; it faces problems as diverse as poverty, informality, low productivity, insecurity, unemployment and a chronic phase of economic stagnation. Of all indicated problems, the one that gives most concern relates to the low rates of economic growth. Attempts have been made to fix this and various strategies proposed, the most common being the increase in public spending, particularly concerning investment.
There are at least three sources to finance government spending: printing money, taxes and public debt. The first source has not been used recently as a financing mechanism, at least officially, while the second has remained on a path of low stability; in fact, with information provided by Robles and Huesca [1] (p. 68), it is known that the collection in Mexico as a proportion of GDP is 18%, taking into account oil revenues, and 14.25% without considering them, when the average of the OECD (Organization for Economic Co-operation and Development) was 25.81% in 2012.
The third source of funding is the public debt, which has grown at the federal level, but this does not represent a problem, since the gross debt represented 27% of GDP to December 2012, and 80.3% of domestic debt and other external debt [2]. The total gross public debt of the USA for the same year was 106.5%, with 84.1% in Spain and 68.5% in Brazil [3].
The problem is the debt of the states or sub-national, which has grown significantly from 2% of GDP in 1994 to 3.1% in 2013. In some states such as Chiapas, Chihuahua, Coahuila, Nayarit, Quintana Roo and Veracruz, the debt has grown in the same period by a factor greater than five [4]. According to current regulations, at least in theory, the public debt of the states means more income and income transfers from the federation to be used for multi-year projects of investment that will translate into economic growth and jobs, which ultimately result in greater well-being for the citizens.
From the above, this paper provides evidence of the relationship between public debt and public investment, as well as between public investment and economic growth. The central objective is to answer the following two questions of research: has the growing public debt of sub-national governments promoted an increase in public investment? If the answer is yes, then does any increase in public investment translate into greater growth of the Mexican states? In essence, it is considered that public investment complements private investment and thus promotes growth [5,6].
Thus, there are two hypotheses. The first is called “golden rule” [7], which states that there is a positive relationship between the public debt and public investment of sub-national governments in Mexico for the period 1993–2012. It is assumed that debt is prudently used only to finance socially profitable investment spending that “brings its own source of payment in the form of direct generation of resources... the rule marked it implies that current spending be paid only out of current income, never with debt ...” [8].
The second hypothesis is that public investment is the main determinant of economic growth of sub-national governments [9]. It assumes that there is complementarity between public investment and private investment, thus both promote increases in the production of goods and services. Thus, when an entity is in debt, it is because the retrieved money is channeled into public investment and this promotes economic growth.
The article has six sections, including this introduction. The second part is devoted to the review of the literature in an effort to highlight the contribution made by this article. The third presents the data used, source and characteristics. The fourth is a brief description of the data and presents the econometric method. In the fifth, the results of the estimates are presented. Finally, the findings are discussed and some policy recommendations presented.
2. Literature Review
This work establishes that sub-national governments hire debt for the purpose of financing public investment projects that complement private investment to translate into greater economic growth, from which contracted debt becomes sustainable and there is no risk for their finances (on the determinants of debt, see [10]). According to orthodox principles, maintaining healthy public finances is a necessary condition for growth, which implies maintaining an appropriate public deficit and debt level. The following criteria are defined to make it happen [11] (pp. 347–348):
- (1)
- Comparison between revenue and public expenditure by means of a definition of public deficit, where it tends to zero at the optimal levelwhere is the nominal budget deficit, is public spending, is the public income, is the volume of interest paid, is the nominal effective rate of interest, and is the total value of domestic public debt from the period 0 to period t − 1.
- (2)
- Compliance with the intertemporal budget constraint
Equation (2) says that the sum of the present value of each of the expected primary surpluses must be greater than or equal to the value of the initial debt (r is the interest rate). Thus, if the primary deficit is zero, then it should not be public debt. Growing surpluses in each period are required to maintain a positive or increasing public debt.
- (3)
- Following Blanchard et al. [12] (p. 12) the comparison between the rate of economic growth and the interest rate that is paid by the debt should be considered:where is the original debt, g is government spending and t tax revenues expressed as proportion of the actual product, r is the interest rate and θ is the rate of growth of the economy. Thus, fiscal policy is sustainable if the present value of the primary deficit is equal to the negative of the initial value of the debt, which means you can keep any level of debt and primary deficit if and only if the growth rate of the economy exceeds the rate of interest paid on the debt. With this framework, we tried to reaffirm the idea according to which the contracted debt goes to public investment and the latter translates into higher economic growth, completing a virtuous circle.
Alternatively, the work relies on Minsky [13] and its financial instability hypothesis transferred to sub-national public finance, according to which increases in investment in the current period encourage expectations of higher profits in the future, which improves the price of capital assets and increases the confidence of companies and financial intermediaries, which is reflected in lower perception of risk and greater indebtedness [11] (p. 349). However, causality would be in a different sense as it would be on investment to growth and this to indebtedness. This is a different situation to that raised in this article, where we want to verify if indeed debt contracted by sub-national governments translates into public investment and hence to higher growth.
Prior to the review of empirical works on the relationships between variables proposed in this article, the theoretical considerations raised by Rubio et al. [14] should be noted, in particular the debt overhang hypothesis and the Laffer curve for the debt. Regarding the first point, it is noted that foreign and national private sector agents conceive the debt as a future tax on the return on capital; additionally, they perceive that a growing debt service increases the likelihood that the government brings inflationary financing policies. Higher borrowing creates expectations that lead to a reduction in private investment, which in turn is detrimental to economic growth [14] (p. 13). In addition, Obstfeld and Rogoff [15] warn that increasing the stock of debt increases the probability of non-payment, and therefore the country (in this case the state) should decrease the investment so that, given a lesser product, it reduces the cost of credit.
Regarding the Laffer curve applied to the study of debt by Rubio et al. [14], it is suggested that if the amount of debt in relation to GDP is put in the axis of abscissa, with the contribution of the debt to the GDP growth on the y-axis, it will be observed that, between these two series, there is a non-linear relationship, and instead an inverted u-shaped curve appears, so the debt contracted at the beginning generates growth, but then stops it. This is explained by the likelihood of non-compliance in the payment from certain considered high levels of indebtedness and the consequent detrimental effect on both public and private investment (see [16]).
Regarding the relationship between public debt and economic growth, there is an abundant amount of literature, particularly using comparisons between countries. Patillo et al. [17] studied the non-linear impact of debt on economic growth using a panel of 93 countries for the period 1969–1998, and found that from a certain debt threshold (160% to 170% of the exports or 35% to 40% of GDP), growth shrinks since it reduces the efficiency of the investment more than its volume, which favors the hypothesis of over-indebtedness previously exposed. Salamanca and Monroy [18], in the case of an emerging economy such as that of Colombia, provide similar information to find that private investment is reduced each time the external public debt increases. In Mexico, Diaz [19] found the public debt of the federal government is used predominantly for the financing of the government deficit, which represents an obstacle to investment and, therefore, a brake on economic growth.
A much-cited work in the study of the relationship between debt and growth is Reinhart and Rogoff [20] who, using historical series of more than 200 years, found two situations: (1) that the relationship between government debt and the GDP growth is weak for debt-to-GDP rate below a threshold of 90% of GDP, and above 90%, the average growth rates fall 1%; (2) the markets of emerging economies face lower external debt (public and private) thresholds, when external debt reaches 60% of GDP, and annual growth is reduced to about 2%, and if debt levels are higher, growth is reduced by almost half. In essence, this work recommends being careful not to reach a level of debt that impairs economic growth.
However, the above-mentioned work suffers from severe flaws that were exposed by authors such as Irons and Bivens [21], but particularly Herndon et al. [22]. For the first set of authors, the most serious failure of the work of Reinhart and Rogoff [20] is that they analyze correlation between public debt and growth, but not causation, particularly to demonstrate that there is a causal link between these variables and the relationship running from low economic growth to public borrowing. Herndon et al. [22] completely discredit the work of Reinhart and Rogoff [20] to demonstrate that these authors made mistakes in coding, the selective exclusion of the evidence, and weighting in a non-conventional form their summary statistics, so it is not confirmed that there is a threshold of debt from which economic growth is reduced; in fact, it can be considered that the relationship between these variables depends on the period and analyzed country (also see Pescatori et al. [23] and Ostry et al. [24]).
Rito et al. [25] evaluated the effect of debt on economic growth using data for 13 countries—Greece, Italy, Portugal, Belgium, France, Germany, Spain, Finland, Estonia, Hungary, Denmark, Lithuania and Sweden—from the first quarter of 2000 to the third quarter of 2011. What they found is that public debt has a positive effect on growth up to a certain level, after which it must comply with its cost and its effect on growth is negative. This agrees with Kellerman [26], who shows that in the long term, the opportunity cost of social public investment financed with debt is superior to the public investment financed with taxes.
For the Mexican case, Ramírez and Erquizio [27] evaluated the public debt contracted by the state’s impact on public spending on investment, a model whose main purpose was not this but proves that the governments of the states spend more coming up to elections. They used in their estimates information from 31 federal entities for the period 1993–2006, grouped in a panel that was estimated using instrumental variables and the Generalized Method of Moments. The result is that there is a negative relationship between the new debt contracted by sub-national governments and spending on public investment; in contrast, the estimate of the relationship between the total expenditure, administrative expenditure and public debt is positive, which serves as background for this article (in relation to the way in which public spending of sub-national governments is influenced by the political business cycle—see also the work of Gámez and Ybarra-Yunez [28] and Sánchez [29], who found for the Asturian municipalities in Spain that debt is contracted to respond to scheduled public spending and to achieve financial autonomy).
Romp and de Haan [30] studied a long list of theoretical and empirical works that have studied the relationship between public investment (or public capital) and economic growth, and conclude that although not all studies find that the growth is being encouraged by the public investment, there is always greater consensus on the importance of having public capital for productive promotion. Sánchez-Juárez and García [31] found with data of the Mexican economy for the period 2003–2011 that the relationship between production and public investment made by sub-national governments of the northern border is negative, which they attributed to the effect of displacement of private investment or that had a short temporary sample (on this last point, see the work of Castillo and Garcia [32]). Shrithongrung and Kriz [33] show with sub-national data of the American economy and the method of Panel Vector Autoregression, that public capital has a positive effect on growth in the short and the medium term. On the other hand, Shrithongrung and Sánchez-Juárez [9], with data of sub-national governments of Mexico, confirm that public investment has positive effects on the production in both the short and the long term. Based on the review, it can be said that public investment or public capital promotes growth considering developing and developed economies.
With reference to the study of the relationship between public debt, public investment and economic growth, very few studies were found in the search carried out in digital databases for one period no longer than ten years. The work of Boris [34] is highlighted, with data from 20 European countries for the period 1985–2010, and who applied the method of fixed effect panel controlling for potential bias of endogeneity and causality test, and found that economic growth is what determines public debt and that public debt negatively affects total investment. According to his work, when an economy ceases to grow, public borrowing is used and this harms investment and is detrimental for growth, plunging the economies into stagnation. Its results favor the paradigm of austerity in public finance as a stabilization mechanism and the hypothesis of crowding-out of private investment.
Rodríguez and Azamar [11] conducted the first job encountered that links sub-national public debt, public investment and economic growth in the case of the Mexican economy; they used data from the 32 federal entities for the period 2005–2009 and estimated models of simple linear regression with the OLS (Ordinary Least Square) method for panel data. In one of their estimates, they found that the lower the level of indebtedness and greater state investment, the greater the economic growth of the state. In a second estimate, they found that increased state debt and total public investment negatively affect economic growth. Regarding when the data description was performed, an element to be highlighted is that, during the analyzed period, the growth of public debt was greater than public investment, which suggests that part of the debt is used for other purposes. The work suffers from several problems: (1) in their estimates, they obtained positive and negative signs in what refers to the impact of debt on economic growth; (2) for the first of their estimates, although the debt has a negative sign, the t test reveals that it is not statistically significant; (3) as noted in his paper, his work has a reduced temporary sample; (4) it does not estimate the effect of debt on public investment and therefore assumes that the impact of the debt on growth should always be negative; (5) its estimates do not consider control variables.
This article considers the works cited as a precedent to determine whether contracted debt—associated with sub-national governments—is positively related to public investment and this with the growth of the product, in order to expand the knowledge we have on this important issue for Mexican public finances.
3. Origin and Characteristics of the Data
We built a database with information from 1993 to 2012 for the 32 states that make up the Mexican Republic. These are: (1) Aguascalientes; (2) Baja California; (3) Baja California Sur; (4) Campeche; (5) Coahuila; (6) Colima; (7) Chiapas; (8) Chihuahua; (9) Distrito Federal; (10) Durango; (11) Guanajuato; (12) Guerrero; (13) Hidalgo; (14) Jalisco; (15) México; (16) Michoacán; (17) Morelos; (18) Nayarit; (19) Nuevo León; (20) Oaxaca; (21) Puebla; (22) Querétaro; (23) Quintana Roo; (24) San Luis Potosí; (25) Sinaloa; (26) Sonora; (27) Tabasco; (28) Tamaulipas; (29) Tlaxcala; (30) Veracruz; (31) Yucatán; and (32) Zacatecas.
It has eight variables: population (pop), total output (pib), output per person (pibpc), public investment (inver), current government spending (corriente), average years of schooling (edu), foreign direct investment (ied), and public debt (deuda). The population was obtained from the Consejo Nacional de Población and is an estimate of the population each year. Total production was obtained from the Instituto Nacional de Estadística y Geografía (INEGI) and its Banco de Información Económica; data were deflated using a base year of 1993. The output per person is obtained by dividing the previous two series. Public investment and current expenditure were taken from the Sistema Municipal de Bases de Datos from INEGI, deflated based 1993. Schooling by entity data were obtained from Sistema Nacional de Información Estadística Educativa of the Ministry of Education. Foreign direct investment data came from the Center for the Study of Public Finance of the House of Representatives, deflated base 1993.
Finally, public debt data were obtained from the Secretaría de Hacienda y Crédito Público (SHCP), deflated base 1993. Two caveats must be carried out with respect to this series: the first is that in the case of the state of Hidalgo for 1999, Campeche 2003, 2006 and 2009, and Tlaxcala 1996–2004 and 2008–2010, debt reported value was zero, so we proceeded to assign a value of one peso, since for the econometric analysis logarithms were used. The second warning is that the debt reported by the SHCP only includes registered bank debt and equity instruments emissions, but does not include all of the short-term debt, since only states are required to report the debt that compromises the entries received from the federal government [8].
4. Description of Data and Econometric Method
Description of data is presented in the tables and charts that follow. The variables of interest are public debt, public investment, and production per person. The production per person increased by little more than 4000 pesos between 1993 and 2012, a modest increase in 20 years (42%); inequalities between states with more and less income reported increased, which can be seen when analyzing the positive change in the standard deviation. The main feature of the behavior of output per person is its meager growth and geographic concentration. As for public investment, in the period, an increase of 150% was observed, and distances between states that had more and less investment decreased, hence the reduction in the standard deviation in the two periods was observed. Aggregated data confirms that there is a correlation between increases in output per person and public investment, clarifying that this last grows much more. In terms of public debt, this increased 313% and shows a great inequality between states that borrow more and those which borrow less. The available statistics are clear: three indicated series are positively correlated, but it is surprising that the magnitude of the growth does not correspond between them (see Table 1).

Table 1.
Description of the database built, 32 states, Mexico, 1993–2012.
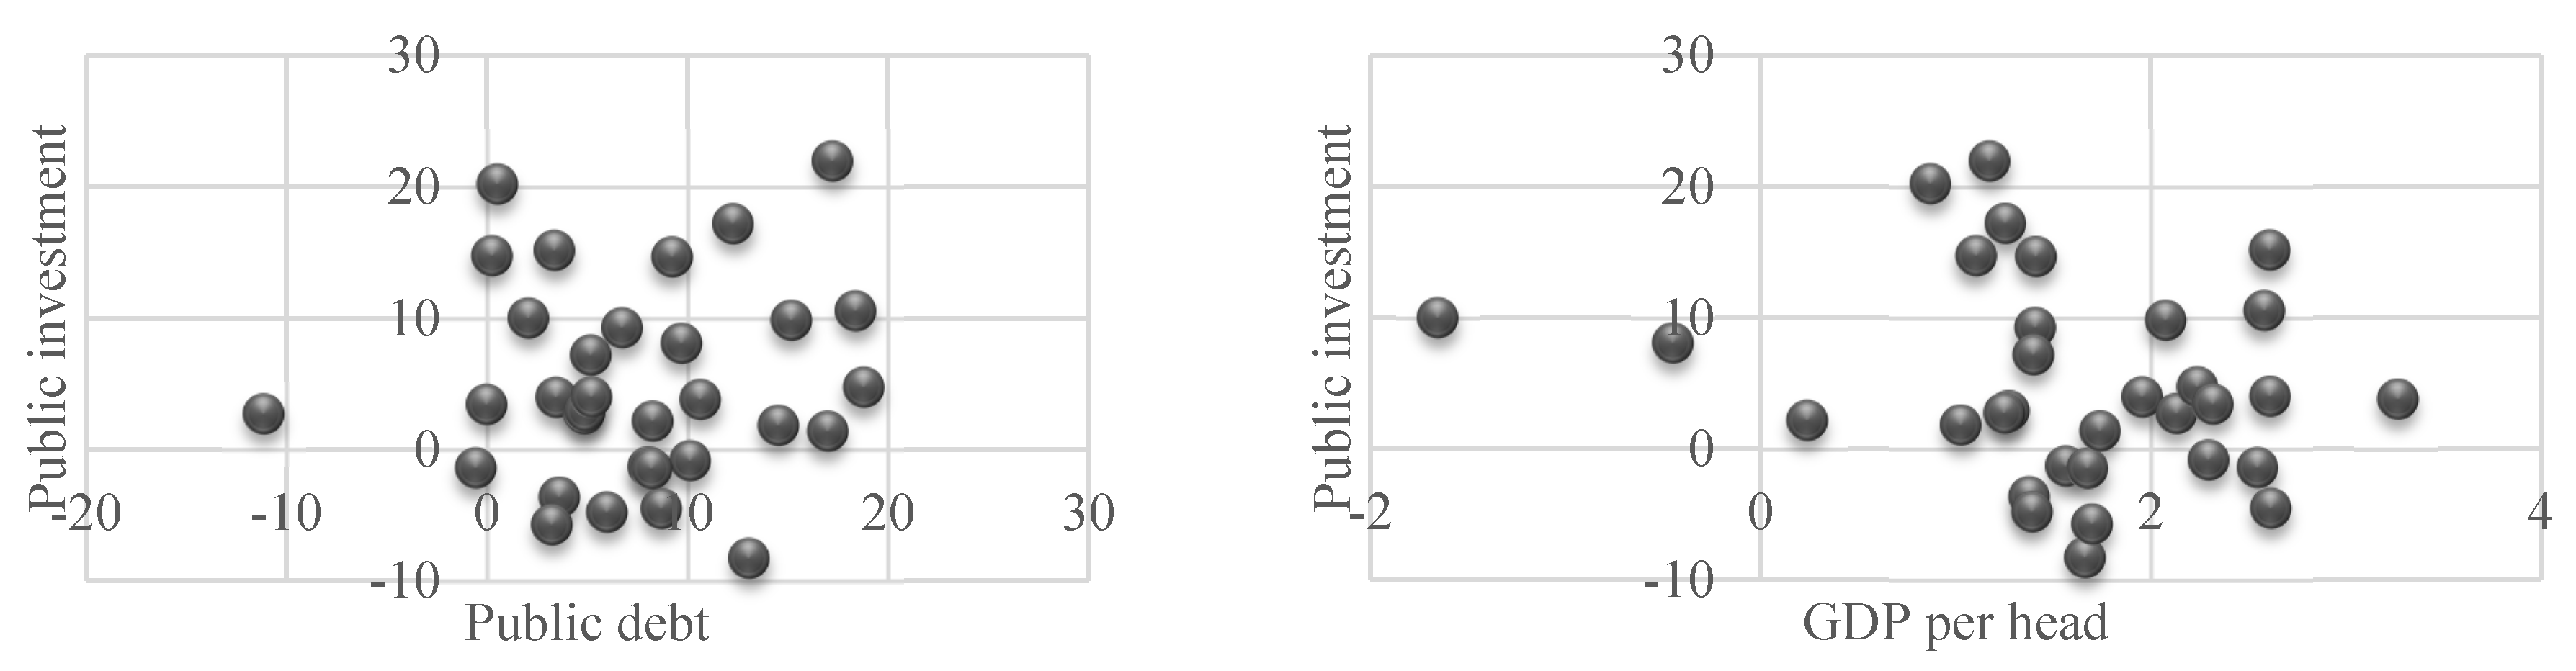
Average annual growth of the public debt and public investment rates are presented in the Figure 1. For some states, it seems to show a slight positive relationship. Regarding the relationship between public investment and production per person, there is not a relationship in accordance with the established hypothesis, which leads directly to the realization of an econometric analysis with panel data that makes use of all available information and to obtain a more robust conclusion. In relation to public investment, nine states presented a negative rate of growth (Nuevo León, Tabasco, Querétaro, Tamaulipas, Jalisco, Guanajuato, Morelos, Yucatan and Distrito Federal). In six states, the growth rate of public investment was positive and two-digit (between 14% and 21%) (Hidalgo, Baja California Sur, Nayarit, Aguascalientes, Guerrero and Oaxaca).

Figure 1.
Average annual growth rate of the public debt, public investment, and per capita GDP, 32 states, Mexico, 1993-2012. Source: Own elaboration.
As far as the state public debt is concerned, only two states observed negative rates of growth (Querétaro and Tlaxcala). In eight states, the growth of public debt was between 12% and 18% on annual average, whereas in 12, debt grew by between 5% and 10%. On the other hand, the production was what increased less; only in the state of Zacatecas was it higher than 3%. In Quintana Roo and Campeche, growth was even negative, although in these states public investment grew significantly, as well as public debt. In 10 states (Guanajuato, Aguascalientes, San Luis Potosí, Coahuila, Querétaro, Sonora, Nuevo León, Michoacán, Durango and Puebla), the growth in output per person was between 2% and 2.6%. In the remaining 18 states, growth was greatly reduced. The conclusion here is that for the whole country, the regional growth in output per person is reduced, while debt and public investment in most of the states grows significantly, suggesting that other factors must collaborate more with economic growth; therefore, in the study, it was decided to include control variables such as education and foreign direct investment.
To conclude this part, a classification of the states with major and minor levels of output per person, public investment, and public debt for the last year of the sample is presented in Table 2. It points out that two of the most heavily indebted states are also those who have higher levels of output per person, but not in regards to public investment (Distrito Federal and Nuevo León). Coahuila and Chihuahua are other states that draw attention, as they have a high level of output per person and debt; Sonora, Quintana Roo, Baja California and Tamaulipas are similar cases. In relative terms, this highlights the central region and northern border region, which have high levels of production per person and public debt, as well as moderate public investment.
Table 2.
Ranking of production, public investment and public indebtedness, 2012, pesos 1993 = 100.
The investigation made use of dynamic models to study the relationship between public debt and economic growth. Thus, before presenting the results, we define what is meant by a dynamic model and the different versions to be estimated.
Dynamic models are characterized by the presence of one or more lagged endogenous variables as part of the explanatory variables. They try to explain a variable based on its behavior in the past, which is quite adequate, in a context where history matters. In particular, a dynamic model has the following structure:
where y is the endogenous variable, X is a vector with the exogenous variables of control, while α and β are parameters to be estimated and ε is the random disturbance term.
To clarify this, we estimate three equations with information grouped on a panel with 640 observations, and 32 cross-sections from 1993 to 2012, this with the Generalized Method of Moments (GMM). This method was chosen because it eliminates any bias associated with the individual heterogeneity not observed, which consequently provides more efficient results (see Arellano and Bond [35]). We estimate a first equation in which output per capita is determined by its lagged value (yit−1), public investment, schooling, foreign direct investment (Xit) and the extent of government debt, both in absolute values and in logarithms.
According to established assumptions, it is expected that economic growth is positively determined by public debt, since it is assumed that it is used mostly to finance public investments. The correlation is also expected to be positive in the case of schooling and foreign direct investment. The second estimated equation explains the public investment itself lagged (inverit−1), the current expenditure of the government, the population of each entity, foreign direct investment (Xit), and of course the public debt, both in their absolute values as logarithms.
It is expected that for higher current expenditure there is less public investment, while foreign direct investment is complementary to public investment. Finally, an equation was estimated involving an interaction factor (inver*deudait), which, it is expected, will correlate positively with growth to show that public debt is heading for more public investment, and the latter to complement private investment takes the form of higher economic growth in Mexican states. The control variables used were foreign direct investment and schooling.
5. Results
The estimation of Equation (5), with the absolute values of the variables, gave the following results (see Table 3):
- The first lag of GDP per capita was statistically significant at 0.01.
- Public investment lagged three periods has a positive effect on output per person, with a significance level of 0.01—although marginal effects, as measured by the coefficient, indicate that its impact is reduced.
- The public debt is positively correlated with output per person, with a significance level of 0.01. As in the case of public investment, marginal effects are reduced.
- In this way, part of the hypothesis of research seems to be confirmed; it is possible to say that public investment is a determinant of economic growth, as well as public debt. However, the marginal effect is negligible.
- In addition, it was found that the average years of schooling, proxy variable of education and human capital are positive determinants of economic growth.
- Foreign direct investment is negatively related to production, with a statistical significance of 0.01.
- As a measure of the goodness of the estimates, the J statistic and its probability value were calculated. A rejection of the null hypothesis means that instruments do not satisfy the orthogonality conditions required for its use. This may be because they are not really exogenous or because they have been incorrectly excluded from the regression (Baum et al. [36] (p. 16)). The estimated statistical was 30.50 with a value of probability of 0.33, which does not reject the null hypothesis, the model was specified correctly.
Table 3.
Results of the estimation of Equation (5) with the Generalized Method of Moments GMM.
The estimate with logarithms also indicated that the first lag of the endogenous variable was statistically significant, the third lag of public investment and the first public debt have a positive impact on economic growth, but the coefficient of public investment was not statistically significant. With regards to the control variables, education has a positive impact on economic growth and is statistically significant. Foreign direct investment has the expected positive sign, but its coefficient is not statistically significant. The J statistic indicates that the null hypothesis of correct specification must be rejected. The estimate included dummy variables, for periods without transforming a better overall estimate, was obtained, with signs expected in public investment and debt variables, but the problem remained that individually their coefficients were not statistically significant (results not reported here, but are available on request).
The estimation of Equation (6) produces the following results (see Table 4):
- The first lag of public investment was statistically significant at 0.01, both in absolute values as estimated in logarithms.
- The current expenditure on the estimation in absolute values was a positive sign, indicating that it is complemented with public investment. In the estimation of logarithms, the expected negative sign was obtained, but the associated coefficient was not statistically significant. Authors such as Vivanco and Solís [37], using similar data for the period 1993–2006, found that the relationship between public investment and current expenditure is negative but, as in this study, the coefficient was not statistically significant.
- The total population, both in absolute values and in logarithms, is shown correlated positively with public investment, with the result significant at 0.01.
- The foreign direct investment in absolute values presented the expected positive sign and is statistically significant at 0.01. However, in logarithms, the correlation is negative, although the estimated coefficient is not significant.
- The increases in public debt reduce public investment, if the results are considered in absolute values, but in logarithms have the expected positive sign, although the coefficient is not significant. It was decided to consider the relationship is positive as Kinto [38] and Vivanco and Solis [37] report in the Mexican case. With the estimation of Equation (7), this will become clear.
Table 4.
Results of the estimation of Equation (6) with the GMM.
Finally, we present the results of estimate Equation (7) in absolute values and logarithms (see Table 5):
- The variable output per capita lagged one period was significant in the estimation with absolute values and logarithms.
- The variable interaction between public investment and public debt was statistically significant at 0.01, using absolute values and logarithms. In the case of the logarithms, the interaction variable was lagged three periods. This confirms the two proposed hypotheses, according to which the debt which is channeled for public investment collaborates to observe a greater economic growth. However, the marginal contribution of increases in public debt and public investment on growth are small, since for every 1% increase in this interaction variable, output per capita rises 0.0000508 per cent.
- Education is a variable that persistently shows as statistically significant and implies that the greater degree of schooling of the population of a state, the greater the chance of increased production per person.
- Finally, foreign direct investment, if logarithms are used, is statistically significant at 0.01 and has the expected positive sign. In absolute terms, it is statistically significant, but with a negative sign; it presents a negative correlation with output per person, so it is not possible to reach a conclusion about its effect on economic growth.
Table 5.
Results of the estimation of Equation (7) with the GMM.
6. Discussion
In this article, using Dynamic Models with panel data and the GMM, there has been evidence to confirm that between public investment and public debt of the Mexican states, there is a positive correlation, which is in line with the findings of other researchers. Moreover, it has been shown that public investment is a positive determinant of economic growth, with which it can be stated that the debt that has been hiring does have a relatively favorable impact on state economies. However, there are some points that need to be made.
The first and most important is that the rate of average annual growth of the public debt (7.4%) is higher than the public investment (5.04%) and this in turn is several times higher than the production per person. Thus, it is possible to conclude that the contracted debt is not sustainable, which adds that it does not meet a basic rule for the recruitment of debt—that observed economic growth rate is higher than the interest rate that you pay on the loan received. From 1993 to 2012, state economies grew 1.5% on average while the interbank interest rate of reference in 2015 averaged 4.7%.
Although the absolute amount of the debt of states remains low (3.1% of GDP), its trajectory is of concern because it may occur that at some point in time, the debt, far from contributing to growth, is detrimental to it, as is explained in the section reviewing the international literature. In addition, it should be remembered that in this study, public debt that the state governments have contracted was not considered at all, and it only worked with published information which includes registered bank debt and equity instruments emissions, leaving out the debt that does not compromise federal contributions to states that do not have the obligation to report to the federation.
From the study, we can reflect on the true destination of public debt that is contracted by the state governments. It is very likely that it is channeling other than public investment expenditures, particularly to cover the operating expenditure of governments. Indeed, Ramírez and Erquizio [27] demonstrate that there is a positive correlation between public debt and total government spending. In addition, the debt may be the result of an imbalance of funds from operations in which current expenses exceed the current funds, because there is no ability to raise what it takes or there are simply no incentives to do so within the framework of a federation. In any case, this matter may be considered for further research in this direction.
The public debt and its relationship with public investment is a matter that leads directly to issues such as transparency and accountability. It is likely, although it cannot be proved, that spending on public works is in fact less than that officially reported, and so its effect on the statistical exercise cannot be strongly identified as positive on economic growth. Government corruption is a widespread problem in Mexico; the citizens do not believe in the information published by the authorities, particularly if it has to do with one of its main obligations, such as public investment. According to Transparency International, this country was classified 103 out of 175 nations in 2014 in the field of fighting corruption. Remember that the estimation that we perform with absolute values of the ratio between public debt and public investment was observed in a negative sign, which establishes an additional element to study more deeply in future research.
Part of the research agenda is to incorporate the most recent information, including the variable of private investment, and, as stated before, to assess the relationship between public debt and current expenditure. The public debt should be a priority for the authorities and analysts, since when a government is into debt, it is taking an important intertemporal choice using resources of the administrations of the future in order to meet current needs. By virtue of this, the hiring of new debt must be fully justified; it is particularly relevant to verify that it complies with the “golden rule” and that there is a positive impact over short-term economic growth.
In light of the results presented, it is recommended to increase public investment and monitor the effectiveness of multiplier effects; it is not only quantity, but as in many other areas of the economy, it is a matter of quality. It is also recommended that its funding comes from taxes and not exclusively from debt, an issue long debated in Mexico, since states are highly dependent on resources received via the federation: today, of every 100 pesos received by states, 97 pesos come from the federation and only three pesos are collected internally. Tax reforms should aim at giving the states greater tax powers and strengthen the legal framework to ensure that public finances are handled more transparently and citizens may have total certainty over the government’s use of its resources.
7. Conclusions
In summary, the main conclusion of this work is that the public debt may be an option to finance public investment, as long as it is intended fully for this area and not diverted for other purposes, which is always likely due to the configuration of the incentives of the political class in power. The current legal framework should be reformed to expressly state that debt contracted under any circumstances must not be used in areas other than investment in public works with productive character, introducing severe penalties for those who do not act in this way. If a reform is not achieved in this direction, in the next 20 years, we will be speaking about the way in which the sub-national government debt grew and how it has become an obstacle to economic growth and regional development in Mexico.
Acknowledgments
The authors would like to thank Universidad Autonoma de Ciudad Juarez; Consejo Nacional de Ciencia y Tecnologia; Programa de Desarrollo del Profesorado de la Secretaría de Educacion Publica.
Author Contributions
These authors contributed equally to this work.
Conflicts of Interest
The authors declare no conflict of interest.
References
- A. Robles, and L. Huesca. “Incidencia fiscal en México: ¿Es posible aumentar la recaudación sin afectar a la población? ” Finanz. Política Econ. 5 (2013): 59–78. [Google Scholar]
- Secretaría de Hacienda y Crédito Público (SHCP). Información de Finanzas Públicas y Deuda Pública, Enero-Diciembre de 2012. Ciudad de México, México: Secretaría de Hacienda y Crédito Público, 2013. [Google Scholar]
- México Evalúa. Gasto y Deuda Pública Estatal ¿Para Qué? Ciudad de México, México: México Evalúa, 2013. [Google Scholar]
- Secretaría de Hacienda y Crédito Público (SHCP). Deuda Pública de Entidades Federativas y Municipios 2014. Ciudad de México, México: Secretaría de Hacienda y Crédito Público, 2015. [Google Scholar]
- J. Barth, and J. Cordes. “Substitutability, complementarity, and the impact of government spending on economic activity.” J. Econ. Bus. 3 (1980): 235–242. [Google Scholar]
- J. Hernández. “Inversión pública y crecimiento económico: Hacia una nueva perspectiva de la función del gobierno.” Econ. Teoría Práct. 33 (2010): 59–95. [Google Scholar]
- F. Balassone, and D. Frando. “Public investment, the stability pact and the “golden rule”.” Fisc. Stud. 21 (2000): 207–229. [Google Scholar] [CrossRef]
- C. Hurtado, and G. Zamarripa. Deuda Subnacional: Un Análisis del Caso Mexicano, 1st ed. Ciudad de México, México: Fundación de Estudios Financieros, 2013. [Google Scholar]
- A. Srithongrung, and I. Sánchez-Juárez. “Fiscal policies and subnational economic growth in Mexico.” Int. J. Econ. Financ. Issues 5 (2015): 11–22. [Google Scholar]
- R. Barro. “On the determination of public debt.” J. Political Econ. 85 (1979): 940–971. [Google Scholar] [CrossRef]
- A. Rodríguez, and A. Azamar. “Crecimiento económico, inversión pública y endeudamiento en las entidades federativas de la República Mexicana.” In El Retorno del Desarrollo, 1st ed. Federico Novelo; Ciudad de México, México: Universidad Autónoma Metropolitana Xochimilco, 2013, pp. 343–366. [Google Scholar]
- O. Blanchard, J. Chouraqui, and R. Hagermann. “The sustainability of fiscal policy: New answers to an old question.” OECD Econ. Stud. 15 (1990): 7–36. [Google Scholar]
- H. Minsky. “Capitalism financial processes and the instability of capitalism.” J. Econ. Issues 14 (1980): 505–523. [Google Scholar] [CrossRef]
- O. Rubio, J. Ojeda, and E. Montes. “Deuda externa, inversión y crecimiento en Colombia.” Banco Repúb. Estudios Econ. 1 (2003): 1–41. [Google Scholar]
- M. Obstfeld, and R. Kenneth. Foundations of International Macroeconomics. Cambridge, MA, USA: MIT, 1996. [Google Scholar]
- K. Megersa, and D. Cassimon. “Public debt, economic growth and public sector management in developing countries: Is there a link? ” Public Adm. Dev., 2015. [Google Scholar] [CrossRef]
- C. Patillo, H. Poirson, and L. Ricci. External Debt and Growth. International Monetary Fund Working Papers in Economics; Washington, DC, US: International Monetary Fund, 2002, Volume 69. [Google Scholar]
- A. Salamanca, and V. Monroy. “Deuda externa pública e inversión en Colombia 1994–2007: Evidencia de un modelo no-lineal TAR.” Cuad. Econ. 28 (2009): 205–243. [Google Scholar]
- E. Díaz. “Deuda pública interna, tasa de interés y restricciones a la inversión productiva.” Comer. Exter. 60 (2010): 38–55. [Google Scholar]
- C. Reinhart, and K. Rogoff. Growth in a Time of Debt. National Bureau of Economic Research Working Papers No. 15639; Washington, DC, US: National Bureau of Economic Research, 2010. [Google Scholar]
- J. Irons, and J. Bivens. Government Debt and Economic Growth. Overreaching Claims of Debt “Threshold” Suffer from Theoretical and Empirical Flaws. Economic Policy Institute Briefing Papers No. 271; Washington, DC, US: Economic Policy Institute, 2010. [Google Scholar]
- T. Herndon, M. Ash, and R. Pollin. Does High Public Debt Consistently Stifle Economic Growth? A Critique of Reinhart and Rogoff. Political Economy Research Institute Working Papers No. 322; Amherst, MA, US: Political Economy Research Institute, 2013. [Google Scholar]
- A. Pescatori, D. Sandri, and J. Simon. “Debt and Growth: Is There a Magic Threshold? ” Washington, DC, USA: International Monetary Fund, 2014. [Google Scholar]
- J. Ostry, A. Ghosh, and R. Espinoza. When Should Public Debt Be Reduced? Washington, DC, USA: International Monetary Fund, 2015. [Google Scholar]
- H. Rito, T. Vaicekauskas, and A. Lakstutiene. “The effect of public debt and other determinants on the economic growth of selected European countries.” Econ. Manag. 17 (2012): 914–921. [Google Scholar]
- K. Kellerman. “Debt financing of public investment: On a popular misinterpretation of “the golden rule of public sector borrowing”.” Eur. J. Political Econ. 23 (2007): 1088–1104. [Google Scholar] [CrossRef]
- R. Ramírez, and A. Erquizio. “Análisis del ciclo político electoral a partir de variables de gasto público por entidad federativa en México, 1993–2009.” Paradig. Econ. 4 (2012): 5–27. [Google Scholar]
- C. Gámez, and A. Ibarra-Yúñez. “El ciclo político oportunista y el gasto de los estados mexicanos.” Gest. Política Pública 18 (2009): 39–65. [Google Scholar]
- M. Sánchez. “Endeudamiento y ciclo político-presupuestario: Aplicación a los municipios asturianos.” Presup. Gasto Público 65 (2011): 75–96. [Google Scholar]
- W. Romp, and J. de Haan. “Public capital and economic growth: A critical survey.” Perspektiven der Wirtschatftspolitik 8 (2007): 6–52. [Google Scholar] [CrossRef]
- I. Sánchez-Juárez, and R. García. “Producción, empleo e inversión pública en la frontera norte de México.” Rev. Int. Adm. Finanz. 7 (2014): 111–126. [Google Scholar]
- R. Castillo, and E. García. “El impacto de la deuda externa pública sobre la inversión privada en México: Un análisis de cointegración.” Estudios Front. 8 (2007): 99–119. [Google Scholar]
- A. Shrithongrung, and K. Kriz. “The impact of subnational fiscal policies on economic growth: A dynamic analysis approach.” J. Policy Anal. Manag. 33 (2014): 912–928. [Google Scholar]
- G. Boris. “Implications of public debt on economic growth and development.” A European perspective. IEB Int. J. Finance 9 (2014): 42–61. [Google Scholar]
- M. Arellano, and S. Bond. “Some tests of specification for panel data: Monte-Carlo evidence and an application to employment equations.” Rev. Econ. Stud. 58 (1991): 277–297. [Google Scholar] [CrossRef]
- C. Baum, M. Schaffer, and S. Stillman. “Instrumental variables and GMM: Estimation and testing.” Stata J. 3 (2003): 1–31. [Google Scholar]
- E. Vivanco, and M. Solís. “Impacto del endeudamiento público estatal sobre la inversión productiva en México, 1993–2006.” Trimest. Fisc. 95 (2010): 299–327. [Google Scholar]
- M. Kinto. ¿Por Qué se Endeudan los Gobiernos Estatales en México? Ciudad de México, México: Algunas Consideraciones para la Reforma Constitucional y la Ley Reglamentaria en Materia de Responsabilidad Hacendaria, Centro de Estudios de las Finanzas Públicas, Premio Nacional de Finanzas Públicas, 2014. [Google Scholar]
© 2016 by the authors; licensee MDPI, Basel, Switzerland. This article is an open access article distributed under the terms and conditions of the Creative Commons by Attribution (CC-BY) license (http://creativecommons.org/licenses/by/4.0/).