2.2.1. Variables and Sample
The econometric analysis presented in this paper is centered on several bank-level variables available from the quarterly Report of Condition and Income, or Call Report, collected by the Federal Financial Institutions Examination Council (FFIEC).
A bank is defined as
global whenever it has non-zero values of
net due to/from own foreign offices, Edge and Agreement subsidiaries, and IBFs (Schedule RC-H
3) at some point of the chosen sample. The dependent variable is Net Interoffice Accounts,
nioa, which is constructed as the difference between “
due to” and “
due from” own foreign offices, Edge and Agreement subsidiaries, and IBFs so that it takes on a positive (negative) value whenever parent offices are net borrowers (lenders)
vis-à-vis their foreign offices.
The descriptive statistics of
nioa reported in
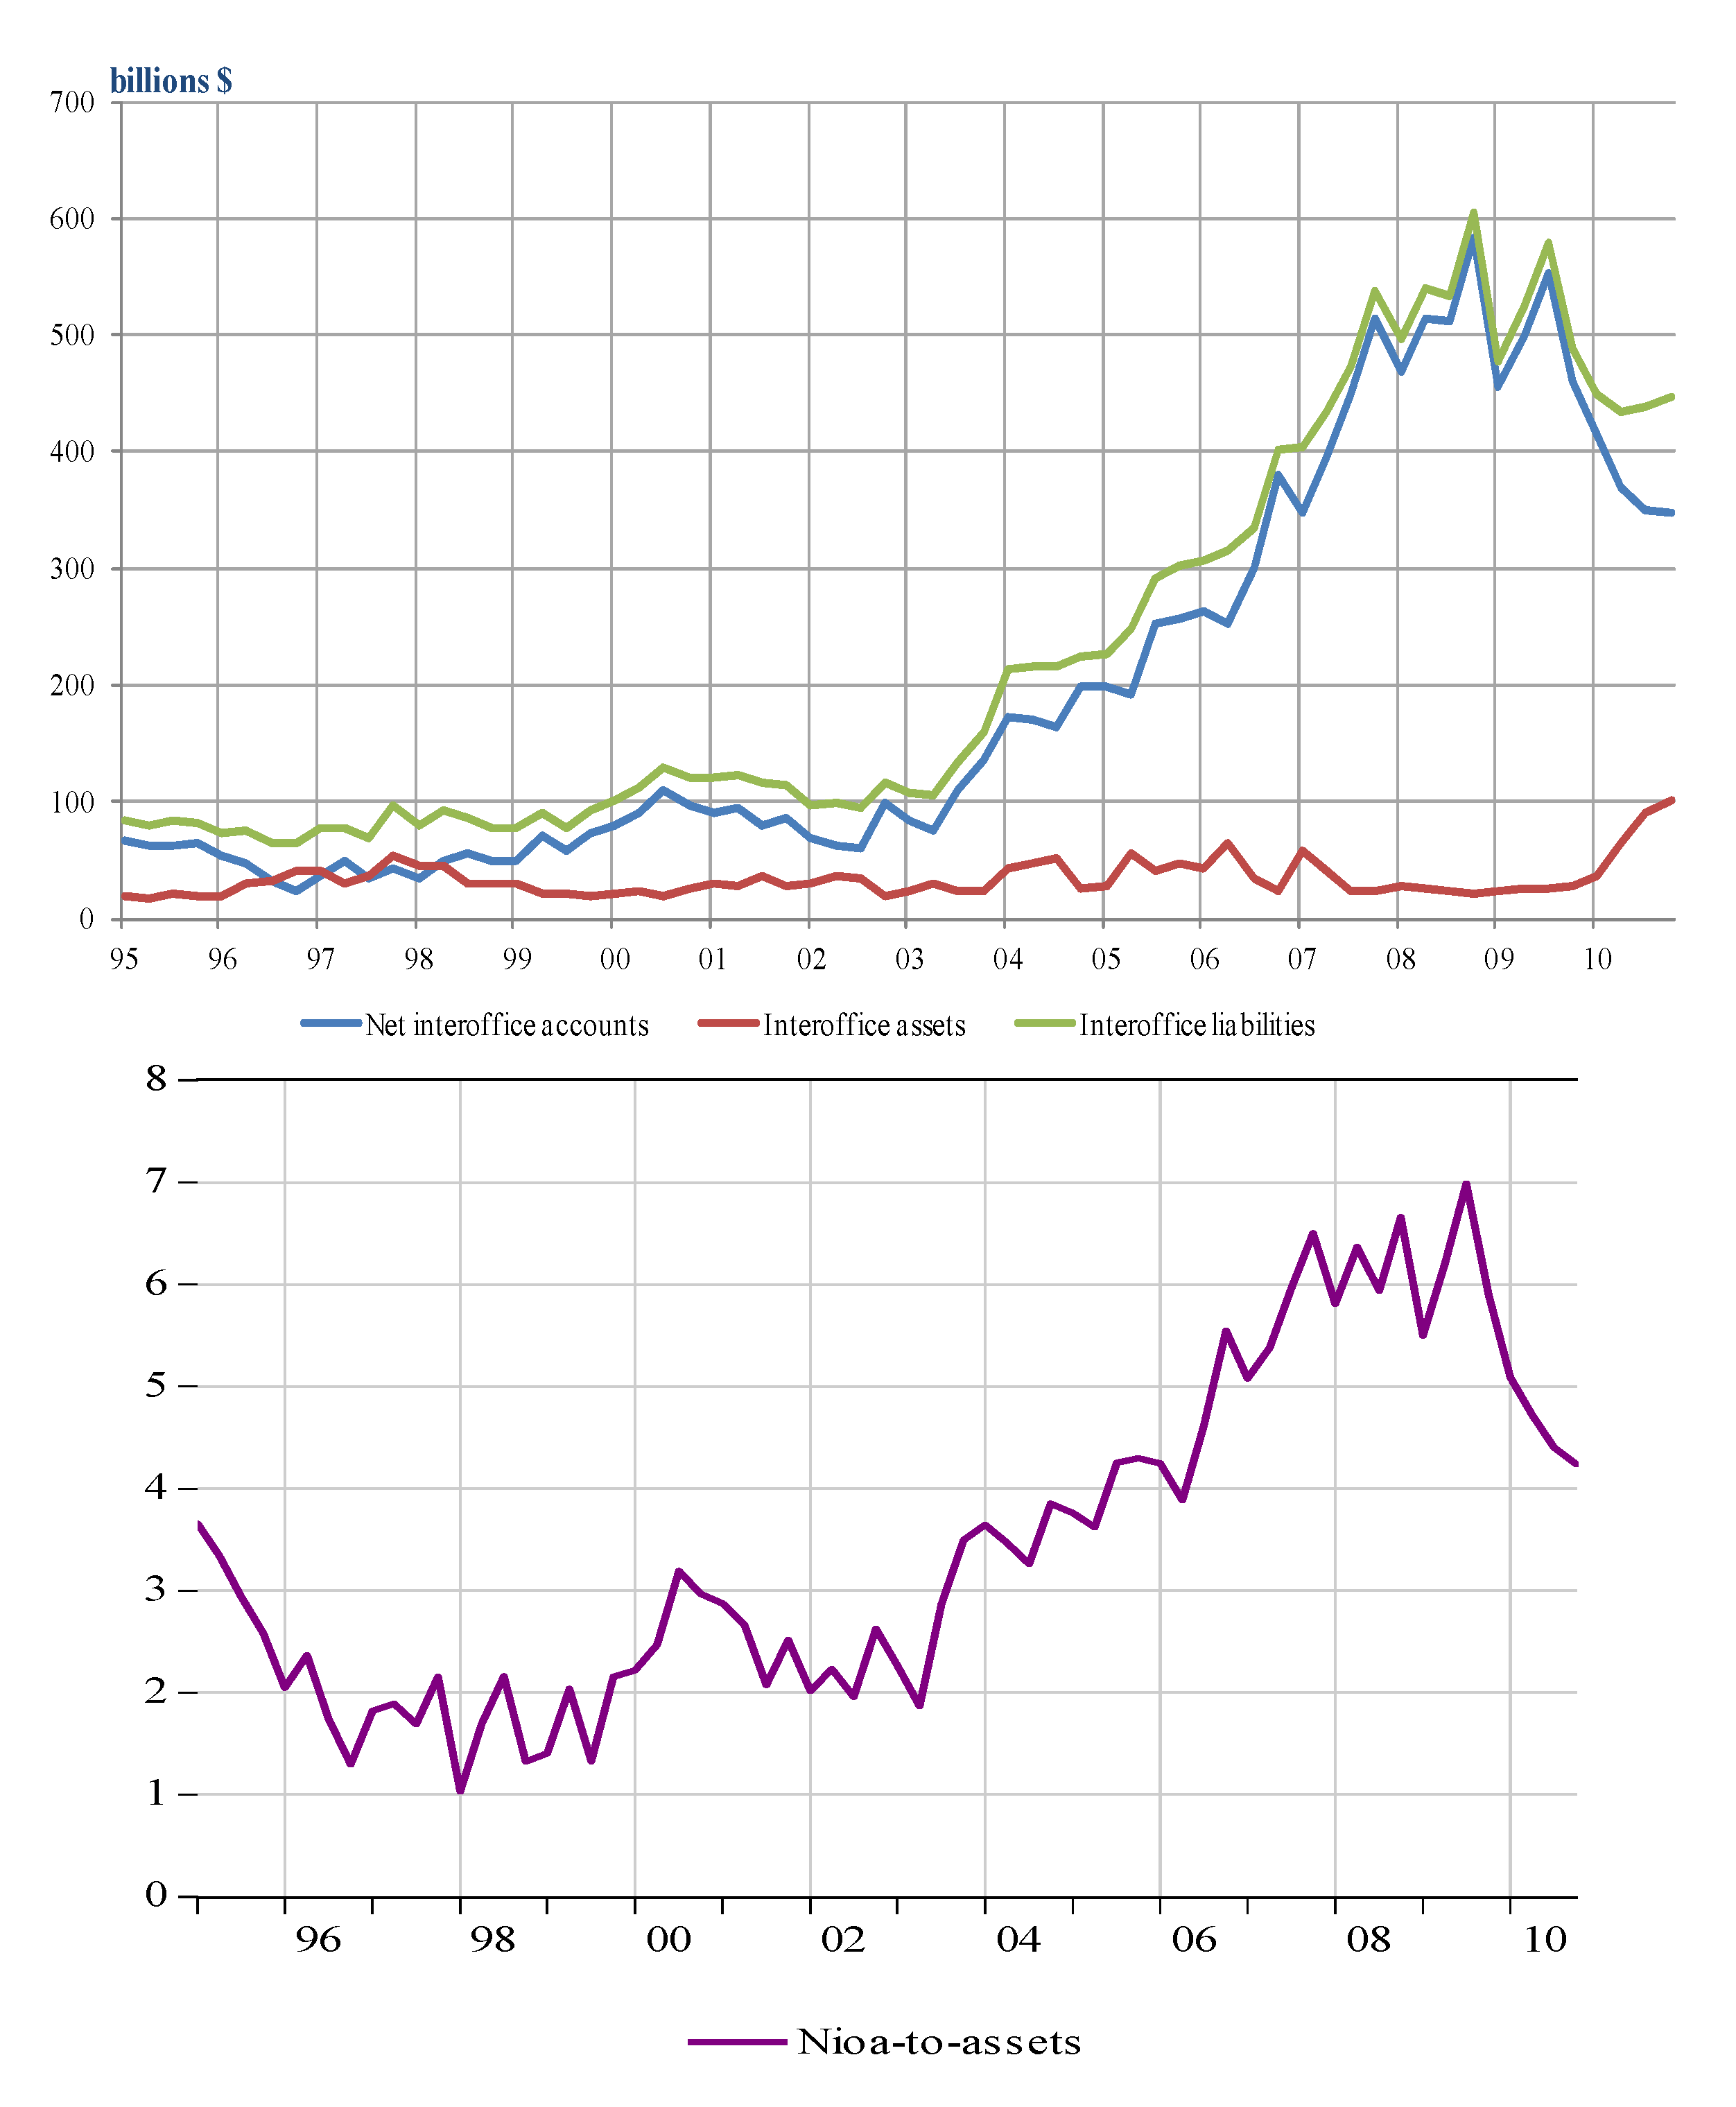
Table 1 show that despite the fact that in 15 years the number of US global banks has almost halved (201 in 1995
vs. 113 in 2010), aggregated net borrowings owed to foreign offices have more than tripled from 2002 to sample-end. In 2008
nioa reached its historical high of $583 billion; in the two following years it diminished slightly but still remained higher than the levels observed before 2006. There is large cross-sectional variation in
nioa, as can be noticed from the very low values of mean and median and very large minimum and maximum values, more marked towards the end of the sample.
Table 1.
Descriptive Statistics for net interoffice accounts (NIOA), $Bn.
Table 1.
Descriptive Statistics for net interoffice accounts (NIOA), $Bn.
| Year | Sum | Mean | Median | Min | Max | Std. Dev. | Obs. |
|---|
| 1995 | 63.1 | 0.3 | 0.0 | −6.0 | 8.9 | 1.2 | 201 |
| 1996 | 23.0 | 0.1 | 0.0 | −16.5 | 7.1 | 1.6 | 188 |
| 1997 | 43.6 | 0.3 | 0.0 | −12.5 | 11.5 | 2.3 | 152 |
| 1998 | 62.0 | 0.5 | 0.0 | −4.2 | 8.1 | 1.5 | 134 |
| 1999 | 81.5 | 0.6 | 0.0 | −3.0 | 11.9 | 1.8 | 131 |
| 2000 | 110.4 | 0.9 | 0.0 | −3.4 | 20.7 | 2.7 | 128 |
| 2001 | 96.0 | 0.8 | 0.0 | −3.7 | 18.8 | 2.8 | 122 |
| 2002 | 99.1 | 0.9 | 0.0 | −7.4 | 21.2 | 3.0 | 116 |
| 2003 | 140.4 | 1.3 | 0.0 | −7.4 | 16.3 | 3.6 | 111 |
| 2004 | 197.9 | 1.8 | 0.0 | −9.0 | 48.4 | 6.4 | 107 |
| 2005 | 255.4 | 2.1 | 0.0 | −30.2 | 65.1 | 8.5 | 124 |
| 2006 | 378.4 | 3.3 | 0.1 | −8.2 | 81.0 | 11.7 | 115 |
| 2007 | 513.0 | 4.4 | 0.1 | −12.1 | 87.7 | 14.6 | 117 |
| 2008 | 583.0 | 5.0 | 0.1 | −10.8 | 116.5 | 18.5 | 117 |
| 2009 | 459.6 | 4.0 | 0.1 | −13.1 | 103.5 | 14.0 | 116 |
| 2010 | 346.9 | 3.1 | 0.1 | −73.2 | 111.6 | 16.3 | 113 |
As shown in
Table 2, the larger the global bank (
i.e., in terms of total assets) the more it borrows in net terms from its foreign offices; in particular, in 2008 70% of
nioa was due from the six largest banks with total assets of more than $200 billion. The bottom of
Table 2 shows the
nioa-to-assets ratio by bank size in order to gauge the relative importance of
nioa in financing assets. The six largest global banks have a positive
nioa, which depicts a relatively contained variability around the mean: between 2% and 14% of assets are financed by
nioa. Medium-sized banks, on the other hand, have an average
nioa-to-assets ratio equal to 0.073 but the degree of heterogeneity is more important. For some banks,
nioa are a very important source of funding, financing up to 31% of assets. Medium-sized banks do not depict large net outflows to their related offices: the largest negative
nioa is equal to only 0.08. Small banks, on the other hand, have the highest heterogeneity in terms of relative importance in
nioa as a source of funding: while on average only 5.5% of assets are financed by
nioa, this source of funding can be extremely important for some banks, going up to 80% of total assets. Among all global banks, small banks depict important net lending to their foreign related offices via their internal capital markets: their largest negative
nioa is equal to 0.44.
Table 2.
Nioa and bank size as of the first quarter of 2008.
Table 2.
Nioa and bank size as of the first quarter of 2008.
| Total Assets Range ($bn) | Nioa | Number of Banks | % of Total |
|---|
| >200 | 304 | 6 | 70 |
| >100 and ≤200 | 78 | 7 | 18 |
| ≤100 | 54 | 60 | 12 |
| | Nioa-to-Assets |
| Total Assets Range ($bn) | Mean | Max. | Min. |
| >200 | 0.064 | 0.14 | 0.02 |
| >100 and ≤200 | 0.073 | 0.31 | −0.08 |
| ≤100 | 0.055 | 0.80 | −0.44 |
The quarterly unbalanced panel considered in the estimation contains 102 global banks over the period 1995 to 2010; the banks included in the sample are those for which at least seven years of consecutive data points of nioa are available.
The bank-level balance sheet variables considered primarily capture the ease of obtaining funding from a variety of channels. Funding of domestic offices is broken down into borrowings in the form of domestic inter-bank debt, private sector deposits, and repurchase agreements. The former two types of funding are further classified into demand and term deposits. Funding availability at foreign offices is proxied by total deposits. The effective federal funds rate is used to keep close track of the central bank’s steered policy rate. A number of macroeconomic variables were initially incorporated to the analysis to capture other possible determinants of
nioa, such as interest rate differentials, exchange rates, and real GDP, but they were not found to significantly explain changes in
nioa over the sample considered. Details and summary statistics on all the variables kept in the analysis are reported in
Table 3.
Total deposits held by foreign offices have expanded greatly over the years, reflecting the growing importance of banking globalization: they quadrupled over the period 2001–2009 reaching $1.3 trillion. Funding obtained by domestic offices from domestic markets comes mainly from transaction deposits of the private sector ($383 billion in 2009) and securities sold under repo agreements ($256 billion in 2009). Funding though interbank deposits has increased notably over the years, reaching a total of almost $50 billion in 2009 (transactional and non-transactional confounded).
Table 3.
Summary statistics and source of other balance-sheet variables, $Bn.
Table 3.
Summary statistics and source of other balance-sheet variables, $Bn.
| Total | | Source | Code | Availability |
|---|
| | Total deposits at foreign offices | Call Report | rcfn2200 | 1995–2010 |
| 1995 | 226.89 | | | |
| 2001 | 469.36 | | | |
| 2009 | 1301.43 | | | |
| | Non-transaction deposits at domestic offices of the private sector | Call Report | rcon2385 | 1995–2010 |
| 1995 | 0.08 | | | |
| 2001 | 1.52 | | | |
| 2009 | 10.52 | | | |
| | Transaction deposits at domestic offices of the private sector | Call Report | rcon2215 | 1995–2010 |
| 1995 | 129.52 | | | |
| 2001 | 250.12 | | | |
| 2009 | 383.00 | | | |
| | Interbank non-transaction deposits at domestic offices | Call Report | rconb552 | 2001–2010 |
| 1995 | - | | | |
| 2001 | 5.04 | | | |
| 2009 | 22.67 | | | |
| | Interbank transaction deposits at domestic offices | Call Report | rconb551 | 2001–2010 |
| 1995 | - | | | |
| 2001 | 17.28 | | | |
| 2009 | 25.06 | | | |
| | Securities sold under agreements to repurchase at domestic offices (*) | Call Report | rconb995 | 2002–2010 |
| 1995 | - | | | |
| 2001 | 128.20 | | | |
| 2009 | 255.96 | | | |
2.2.2. Model Estimation I
The inference is based on the following autoregressive-distributed lag model:
where
is the index for each bank such that
and
is the time index. The variable
nioa represents net interoffice accounts and
are deposits at foreign offices. The vector
mainly contains those variables that refer to different sources of funding available to domestic offices: demand and term deposits of both the private sector and domestic banks and collateralized borrowings (
i.e., under repurchase agreements).
is the federal funds rate and
is the unobserved bank-specific effect.
Judson and Owen [
18] suggest that in a dynamic setting with an unbalanced panel and a small time sample, the
Generalized Method of Moments (GMM) is the most suitable framework for estimating asymptotically efficient estimators. Here the Arellano-Bover/Blundell-Bond two-steps estimator [
19] has been employed in order to overcome the weak instrument problem that might arise when the dependent variable is highly persistent and/or the ratio of the variance associated to the fixed effect to the variance of the idiosyncratic error is too large. The standard errors are corrected for heteroskedasticity and serial correlation and the Sargan test is carried out in order to test the validity of specification of the estimated model.
The first column of
Table 4 reports the GMM estimates of (1) with a limited set of variables (
i.e., excluding interbank and repo domestic borrowings), that is, all those series that are available over the whole sample 1995–2010 (see
Table 2 for details). The second and third columns report the estimates of (1) over the samples 2002–2010 and 2007–2010, respectively; the former sample is chosen according to the availability of the repo debt and interbank borrowings variables.
Table 4.
GMM Estimation, Dependent variable: nioa.
Table 4.
GMM Estimation, Dependent variable: nioa.
| Variables | Sample 1995–2010 | Sample 2002–2010 | Sample 2007–2010 |
|---|
| nioat–1 | 0.830 *** (0.000) | 0.833 *** (0.000) | 0.259 (0.318) |
| Foreign deposits | 0.038 *** (0.000) | 0.054 *** (0.000) | 0.420 ** (0.204) |
| Federal funds rate | 25323.43 *** (14.59) | 91384 *** (25.84) | −77270 * (39689) |
| Non-transaction deposits | 0.548 *** (0.000) | 0.565 *** (0.000) | 1.679 * (0.860) |
| Transaction deposits | −0.039 *** (0.000) | −0.161 *** (0.000) | −0.514 * (0.279) |
| Interbank non-transaction deposits | - | 0.640 *** (0.000) | 0.620 (0.710) |
| Interbank transaction deposits | - | 1.183 *** (0.000) | 0.221 (1.706) |
| Repo debt | - | −0.068 *** (0.000) | −0.554 *** (0.071) |
| Cross-sections included | 102 | 92 | 48 |
| Sargan test p-value | 0.566 | 0.737 | 0.939 |
Availability of deposits available at foreign offices has a positive and significant effect on
nioa in each of the three regressions; however, during the crisis, the estimated coefficient of foreign deposits is much larger and equal to 0.420 compared to 0.038 in the overall sample period. This result implies that
nioa is positively related to the availability of stable liquidity funding such as deposits available at foreign offices. During the crisis, this relationship is even stronger, reflecting an intensified redistribution of liquidity among banking groups via internal capital markets; this result is similar to the findings by Cetorelli and Goldberg [
13]. Moreover, this result supports the possibility of a flight-to-safety effect witnessed during the financial crisis; that is, foreign depositors might have switched their deposits away from US branches in favor of domestic banks, triggering a fall in
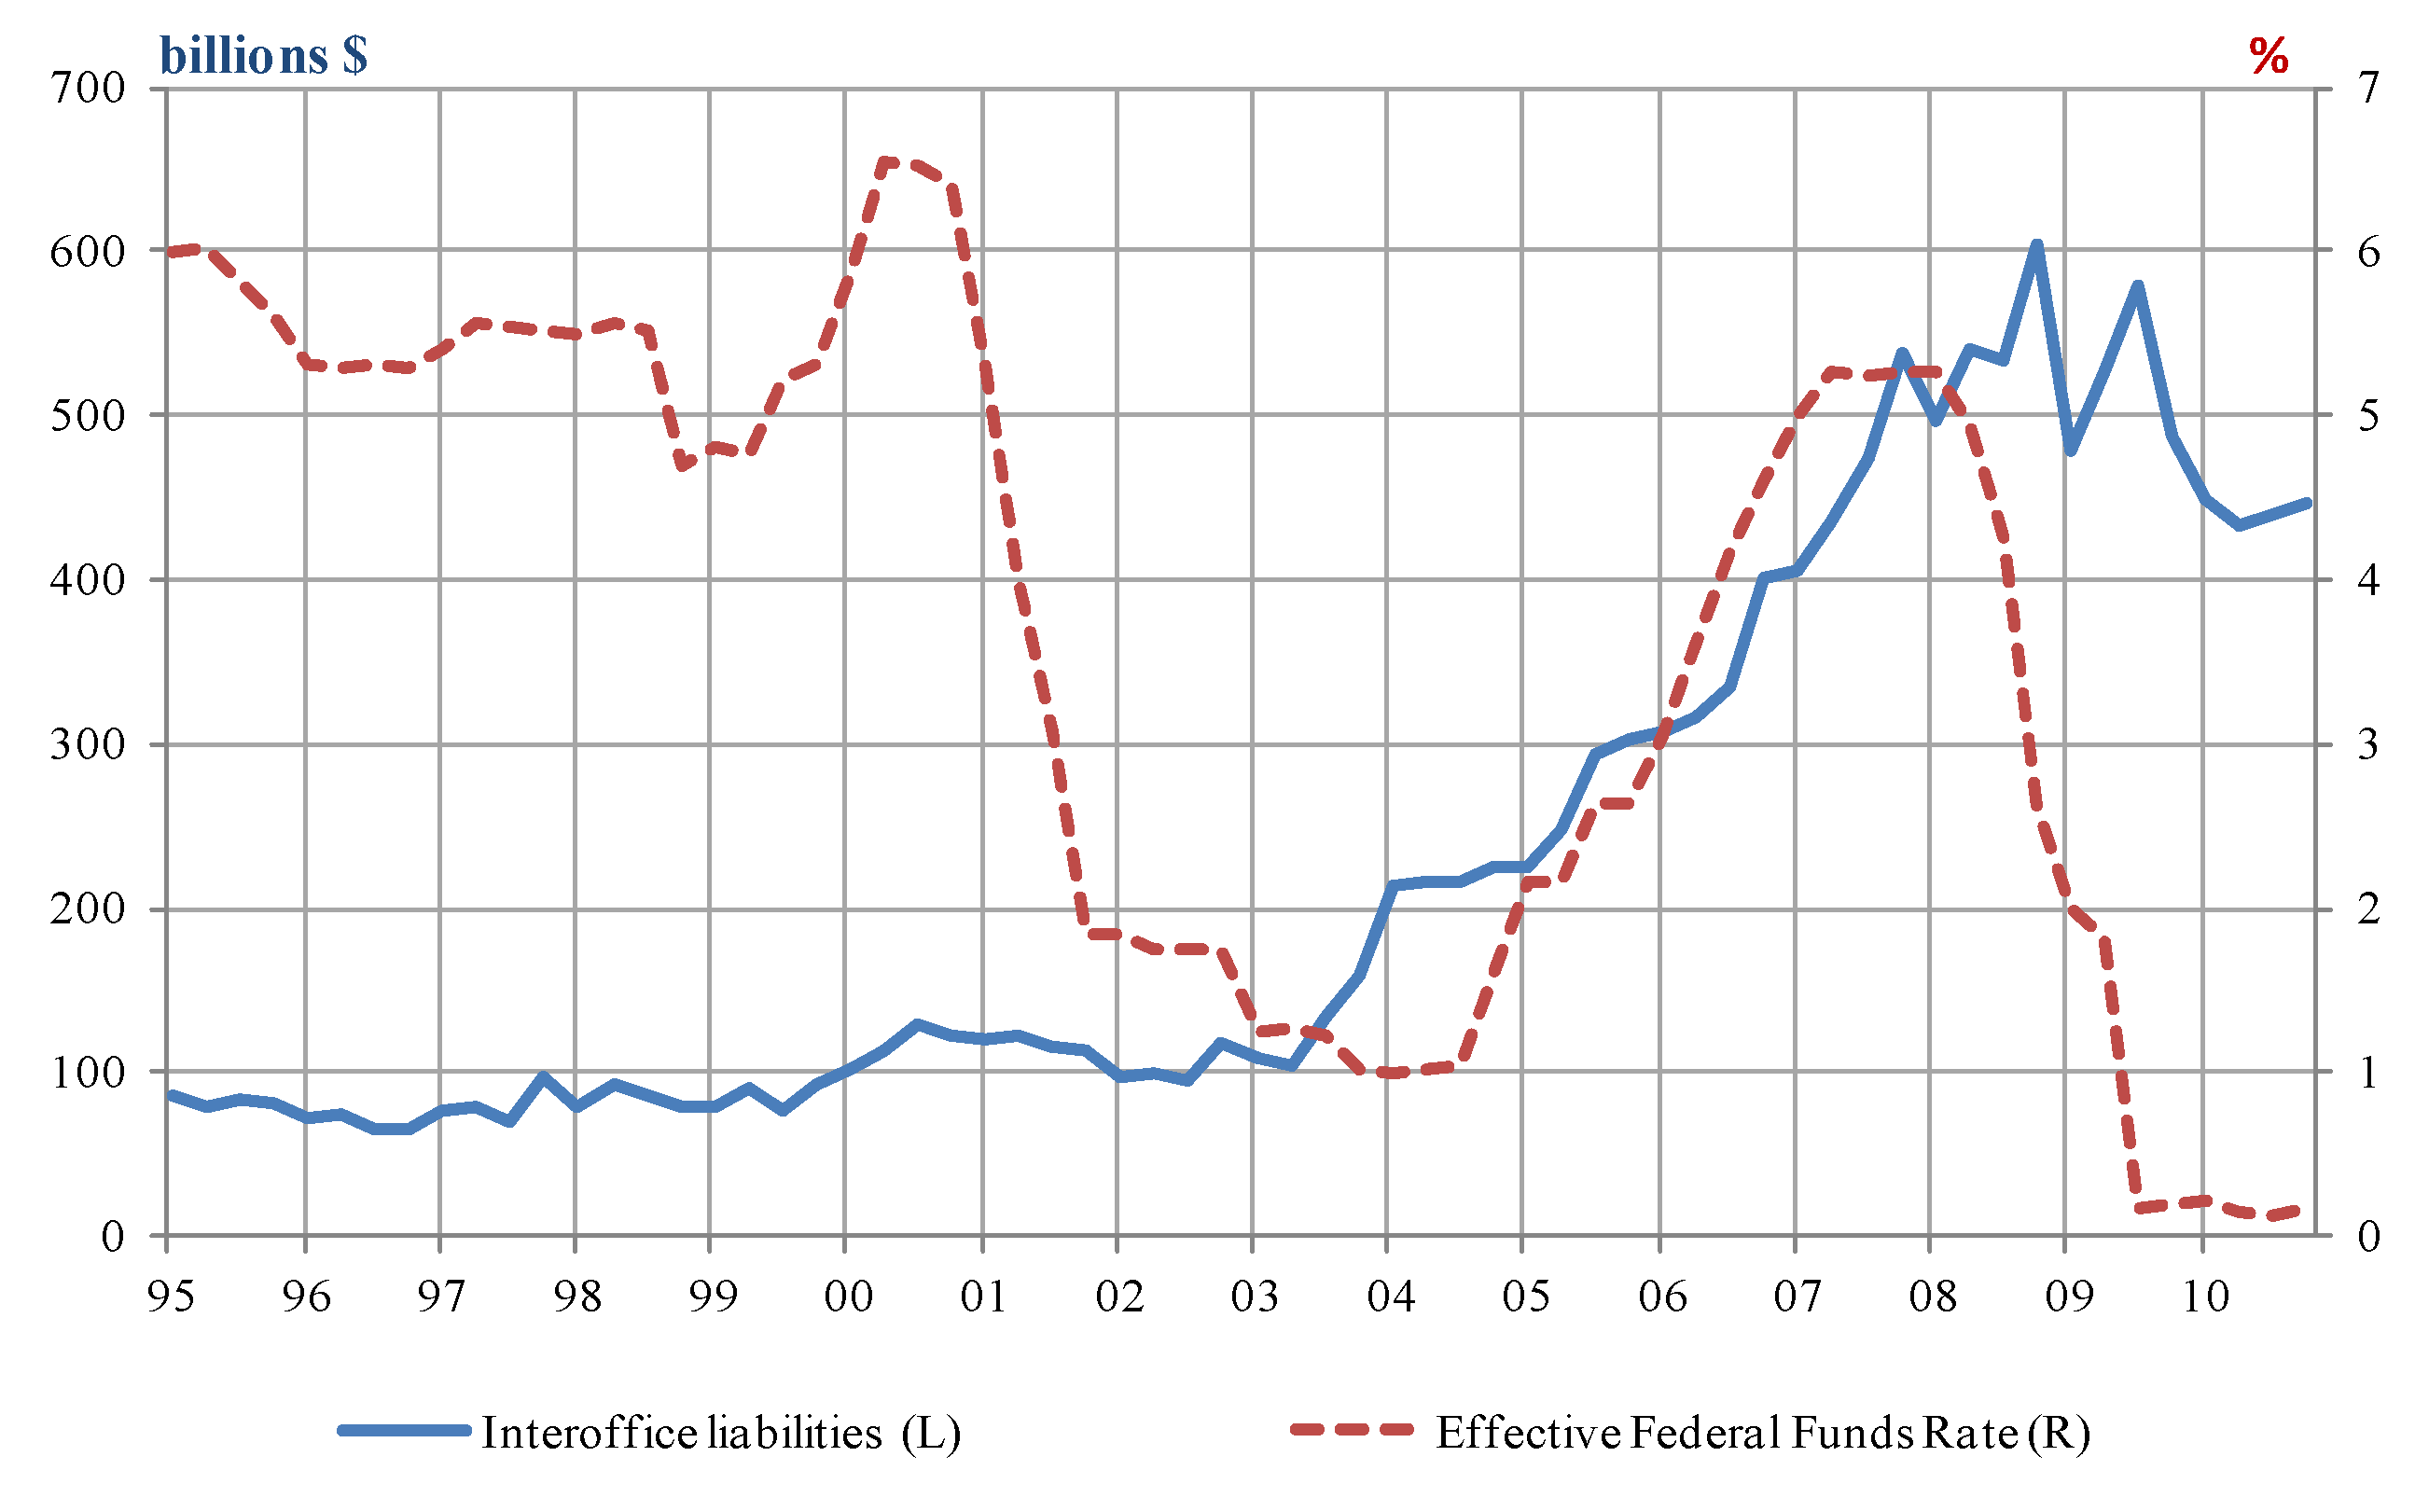
nioa. The effect of the federal funds rate is positive and significant over the whole sample: an increase in the federal funds rate by 1% increases the average
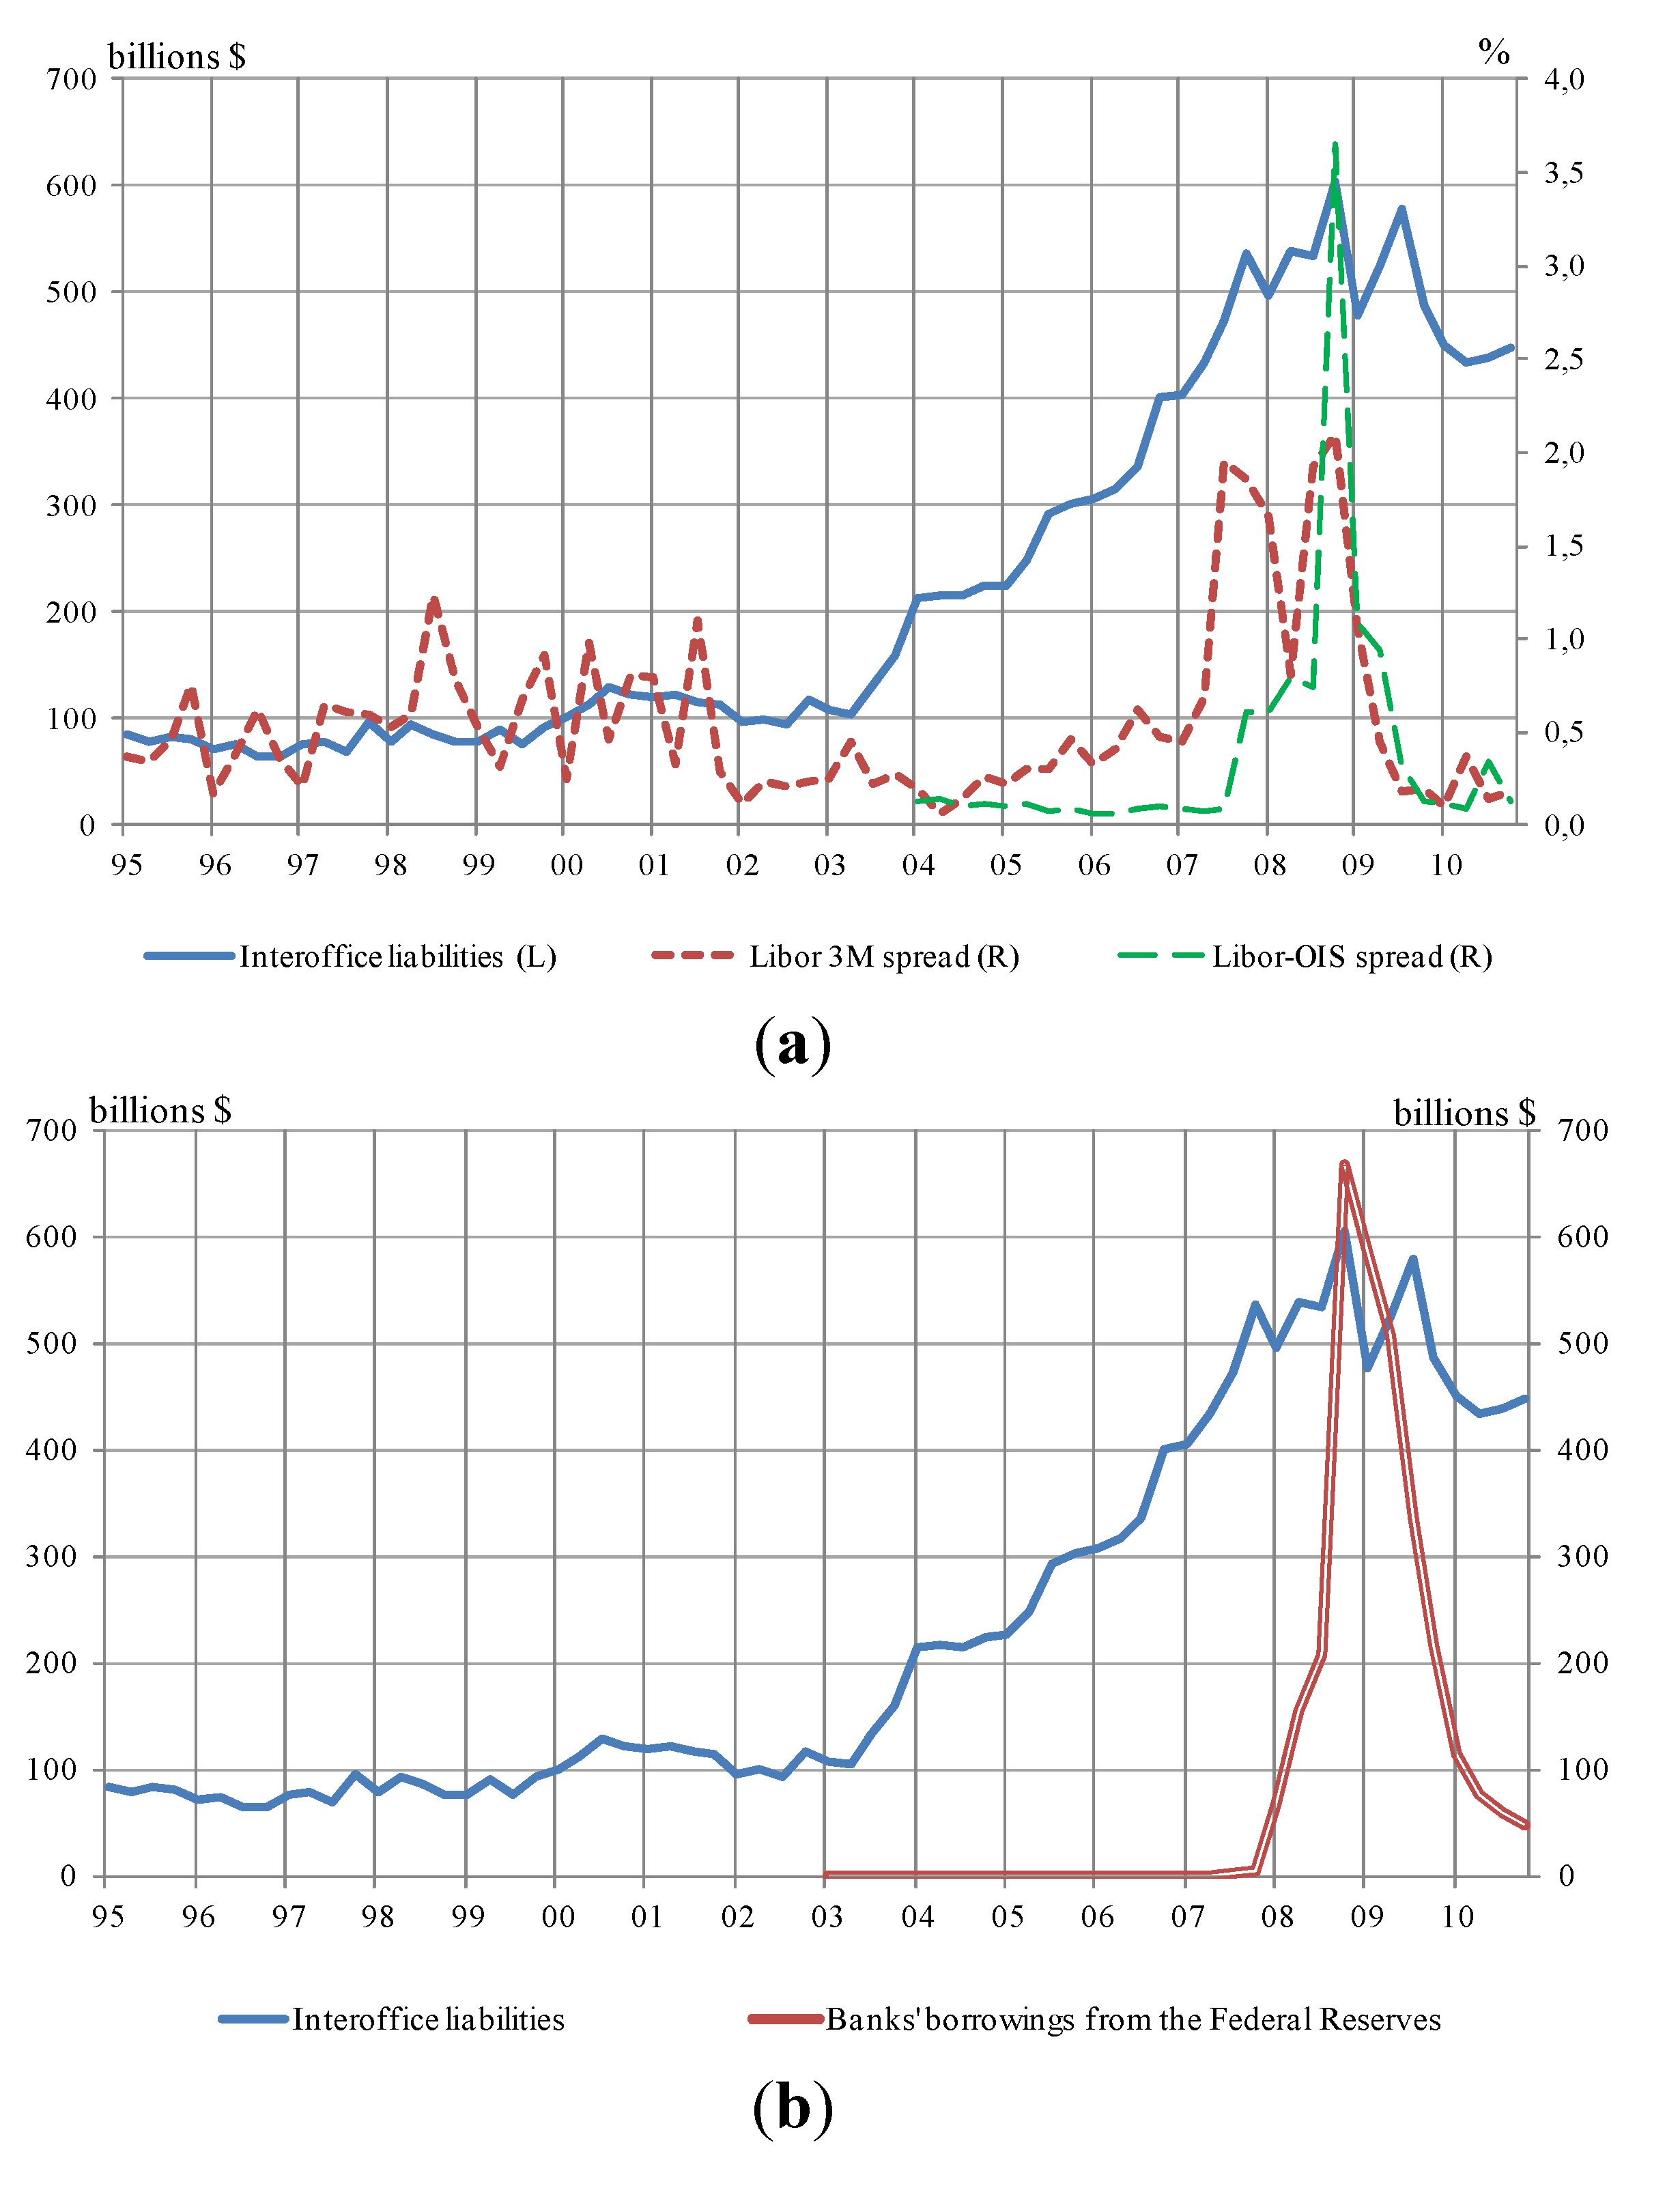
nioa by over $25 billion. This result confirms the previous findings that global banks respond to a domestic restrictive monetary policy by importing liquidity via their internal capital market. During the crisis, however, this general result does not hold anymore: the estimated coefficient of the federal funds rate is negative and marginally significant. This result reflects the fact that domestic funding conditions, such as those in repo markets, rather than the monetary policy stance, have been an important driver of
nioa, notwithstanding the low level of the federal funds rate. This result is in line with the findings by De Haas and Lelyveld [
11] and is further confirmed by the estimated coefficient of repo debt, which is negative and strongly significant in both samples. The estimated coefficient suggests a sizable degree of substitution between funding through repo and internal capital markets, especially during the crisis, when every $1 fall in repo debt increased
nioa by $0.56. Therefore, the reduction of liquidity in repo markets, caused by the deterioration of banks’ balance sheets and uncertainty about the fundamental value of some assets, has led global banks to tap this drop in funding by withdrawing funds from their foreign offices.
Transaction deposits are also negatively related to evolution in
nioa; its estimated coefficient is four times larger during the crisis than over the sample 2002–2010 even if it is significant at the 10% level. Lastly, it is interesting to note that the other types of funding—non-transactional deposits and interbank markets—have positive and significant coefficients over the sample 2002–2010. This positive relationship can be explained by the fact that not all changes in funding are replaced by
nioa. As found in De Haas and Lelyveld [
11], during stable economic conditions internal capital markets are used to redistribute liquidity across the banking group. Therefore, during buoyant economic conditions in which savings are high and interbank markets are functioning correctly, the increase in
nioa is due to liquidity redirection through internal capital markets rather than compensating for the loss of a domestic funding source.
Most of the regression estimates of (1) during 2007–2010 are either not significant or become marginally significant. This is probably due to the fact that there are important cross-sectional responses in the way nioa was affected during the crisis. Most notably, it could be argued that the large degree of substitution between repo debt and nioa could be more important for larger banks that rely more on wholesale funding.
Table 5 below replicates the estimation in the last column of
Table 4 by bank size over the period 2007–2010. The first column reports the estimates of (1) for the four largest banks, those with average total assets over $1 trillion; the second and the last columns report the estimates for the banks with average assets equal to more than and less than $1 billion, respectively. For larger banks, the increase in
nioa during the crisis was primarily explained by the contraction in funding from repo markets. In the sample of the largest 15 global banks, however, the fall in transaction deposits also significantly affects the increase in
nioa. Smaller banks, on the other hand, have significantly increased their net borrowings from their internal capital market, however, not to respond to a particular domestic funding constraint. The increase in
nioa for this subset of global banks was motivated by the availability of foreign deposits, implying that the liquidity that was imported was mainly driven by either a precautionary motive or to restore their balance sheet following increasing defaults. Smaller banks were not affected as much as large banks by the dry-up in wholesale funding markets; however, they still needed to raise external funds to cover the losses brought about by nonperforming assets. The estimated effect on
nioa reflects the increase in uncertainty witnessed in financial markets, translated into the greater difficulty for smaller banks of raising additional unsecured funding.
Table 5.
GMM Estimation. Dependent variable: nioa, sample 2007–2010.
Table 5.
GMM Estimation. Dependent variable: nioa, sample 2007–2010.
| Variables | Largest 4 Banks | Largest 15 Banks | Other Banks |
|---|
| nioat−1 | 0.763 *** (0.216) | 0.716 *** (0.163) | −0.029 (0.082) |
| Foreign deposits | 0.110 (0.159) | 0.140 (0.164) | 0.857 *** (0.145) |
| Federal funds rate | 1799562 (2583567) | −19287 (326006) | −25767 (11214) |
| Non-transaction deposits | −0.084 (1.510) | 1.234 (0.888) | 0.019 (0.150) |
| Transaction deposits | −0.313 (0.286) | −0.376 ** (0.156) | 0.223 (0.183) |
| Interbank non-transaction deposits | 0.525 (0.659) | 0.456 (0.482) | 0.686 (0.862) |
| Interbank transaction deposits | −0.326 (2.236) | −0.220 (1.683) | −0.848 (0.851) |
| Repo debt | −0.400 *** (0.093) | −0.432 *** (0.041) | −0.113 (0.128) |
| Cross-sections included | 4 | 15 | 63 |
| Sargan test p-value | 0.565 | 0.206 | 0.649 |
2.2.3. Model Estimation II
In the previous sub-section it has been argued that domestic funding conditions can be important determinants of
nioa. Estimates from
Table 4 point to the existence of a non-linear effect of the federal funds rate on
nioa, while in
Table 5 it has been shown that during the crisis the monetary policy rate does not significantly explain
nioa. This section aims at shedding some light on whether the impact of the federal funds rate on
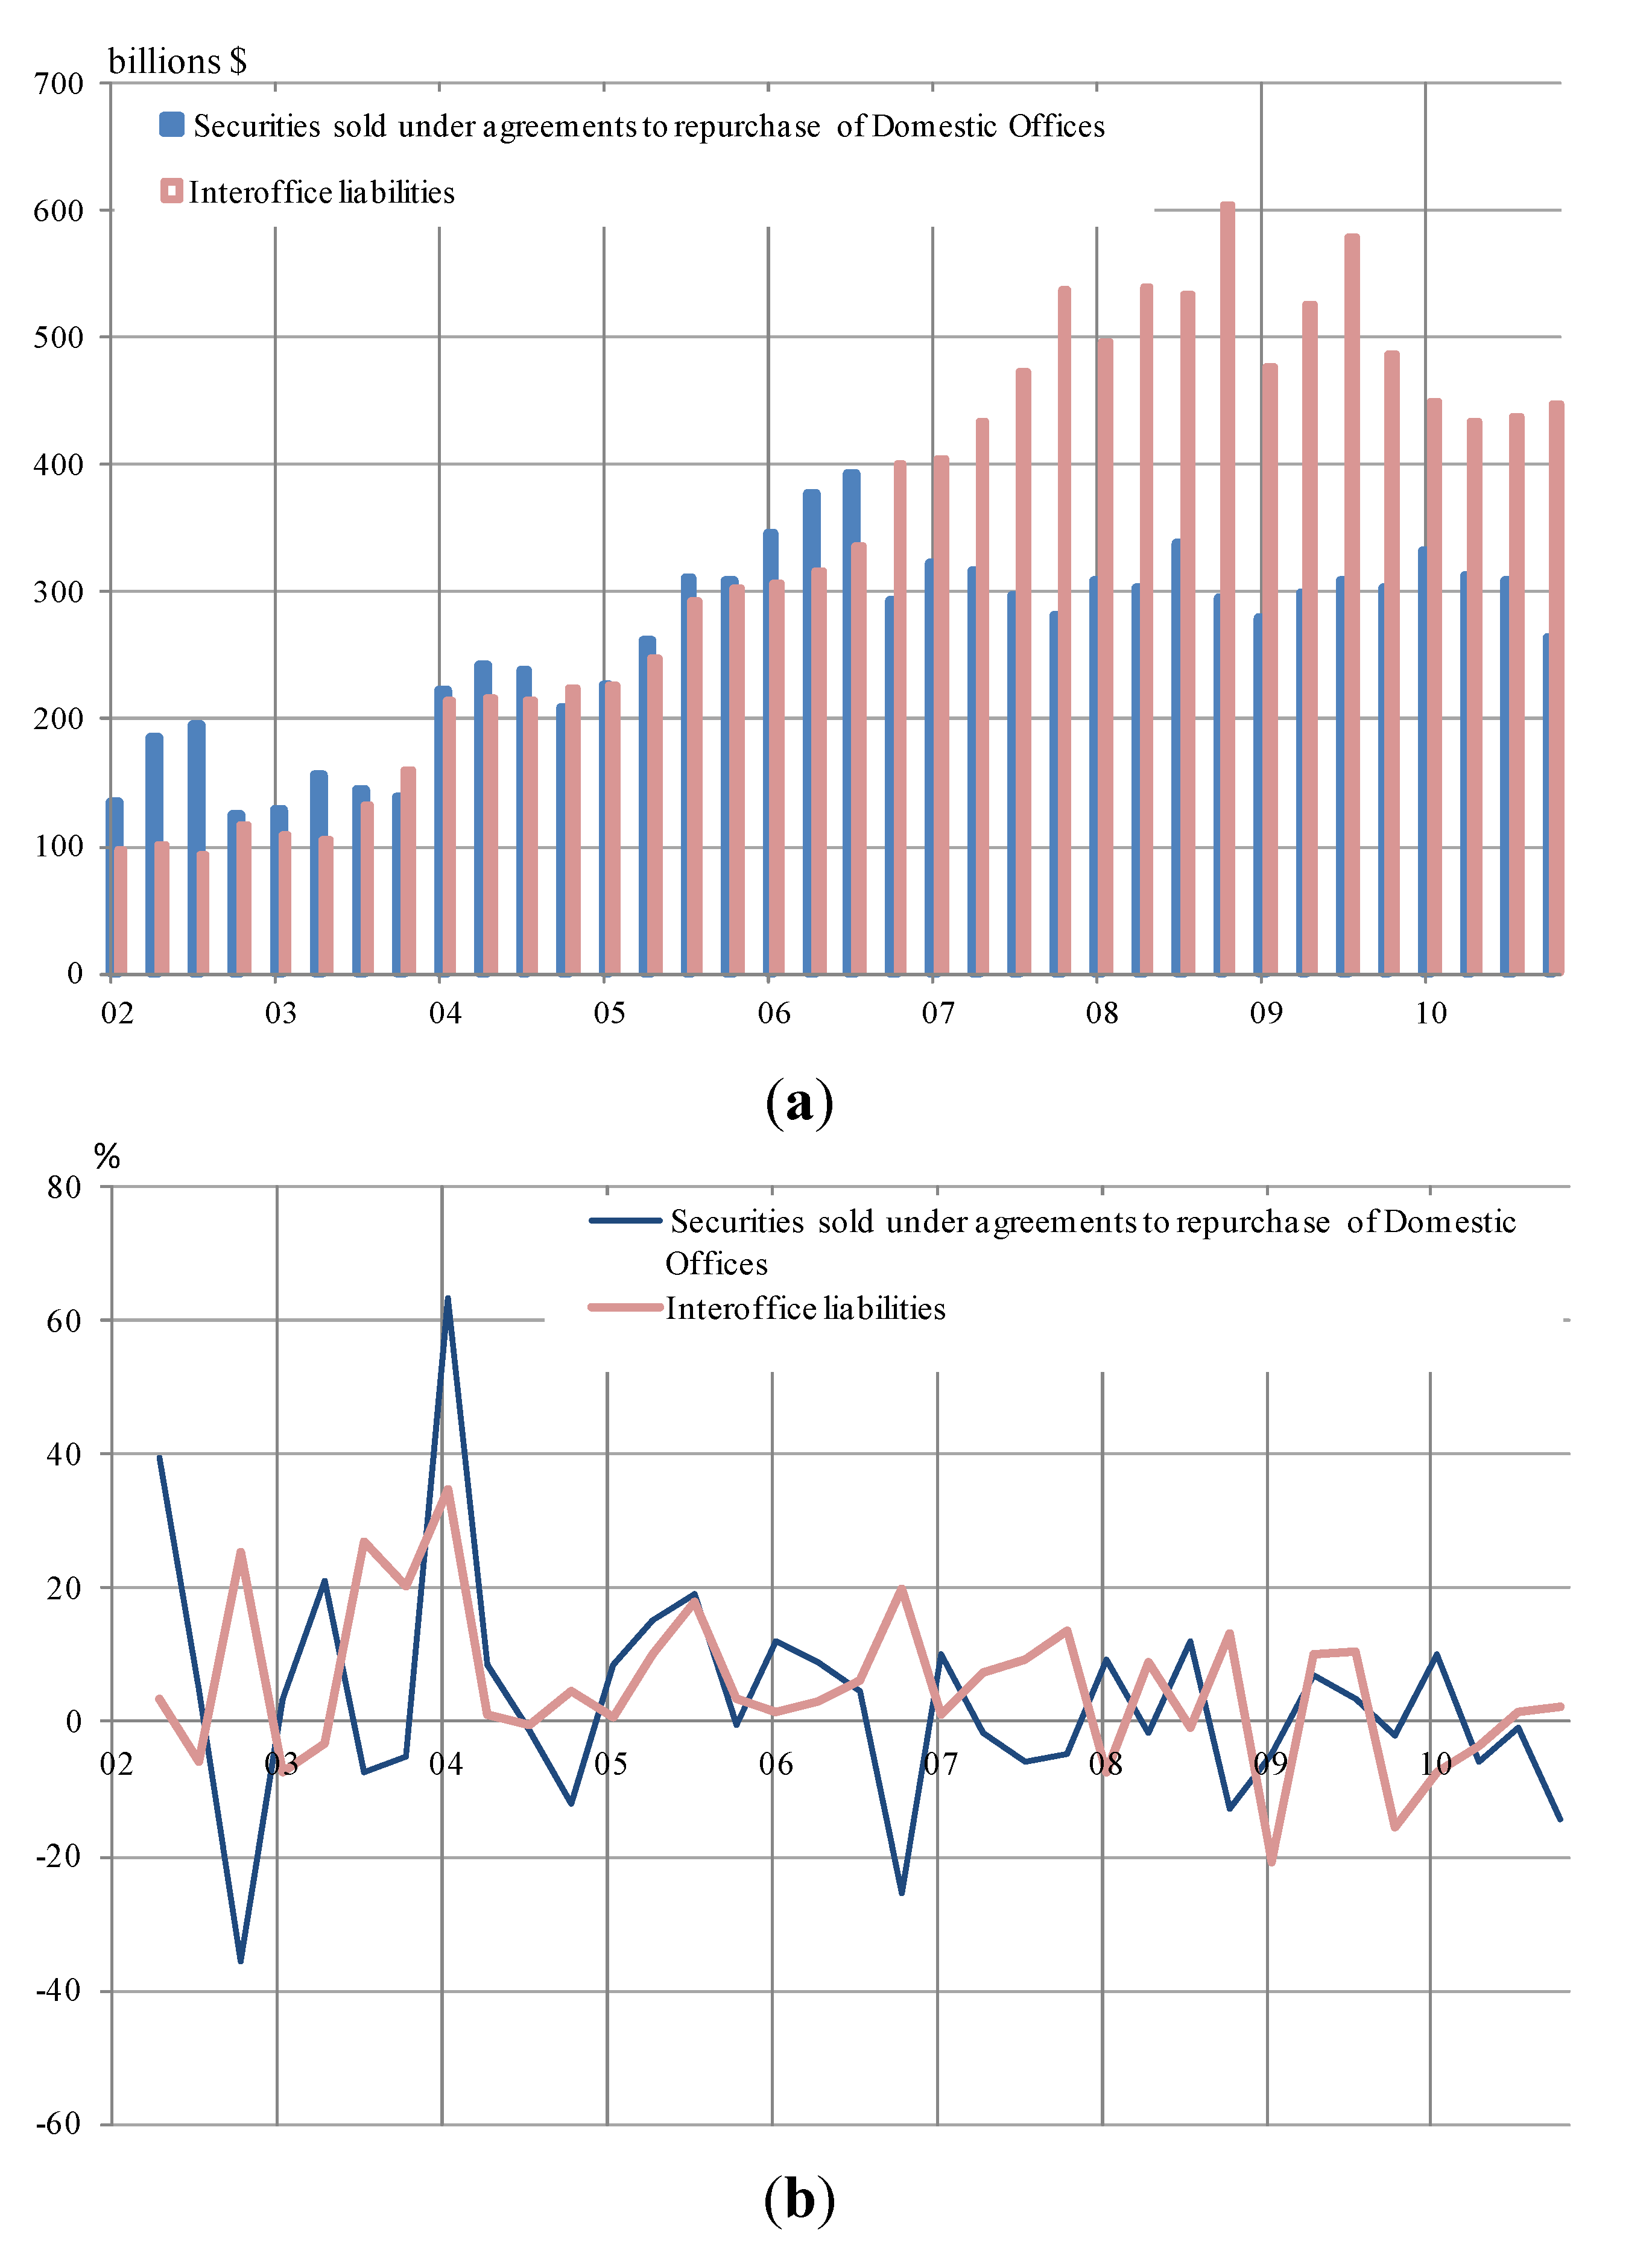
nioa varies across banks depending on their funding structure rather than on their size. There is, indeed, still a large heterogeneity of banks in the group of small banks, some of which are also highly reliant on wholesale funding. Most notably, the focus will be here on funding through securities sold under repo agreements, which constitutes for many global banks an important source of funding, and, as shown in
Table 4, has a negative and strongly significant effect on
nioa. However, there are important cross-sectional differences in the ratios of repo funding-to-total assets in the considered sample of global banks, which can vary between 0 and 0.5.
Therefore, it might be interesting to investigate whether when the central bank reduces its steered rates to stimulate interbank borrowing and lending during a banking crisis, collateral deterioration leads those global banks that finance a greater share of their assets through repo markets to rely relatively more on interoffice borrowings.
A Panel Threshold Regression Model (PTRM), as proposed by [
20], is used to test whether the effect of policy rates on
nioa differs when accounting for cross-sectional variations in funding through repo markets of global banks. The variables are divided by total assets as the focus here is on the relative importance of repo in a bank’s funding structure.
The PTRM estimated has the following form:
where I() is an indicator function,
ait stands for total assets of bank
i at time
t,
rt is the effective federal funds rate at time
t, and
are securities sold under agreements to repurchase at domestic offices of bank
i at time
t. The vector
contains regime-independent variables such as the ratio of foreign deposits-to-total assets as well as additional regressors to reduce the possibility of spurious correlations.
4 is the vector of disturbances of bank
i at time
t and
is the threshold of the variable
securities sold under agreements to repurchase-to-total assets. Specification (2) allows the coefficient of
rt to depend on a
threshold variable, which is the ratio of repo funding-to-total assets.
Table 5 shows the regression slope estimates of (2) and the estimated threshold,
, for the balanced quarterly panel over the period 2002 to 2010, which includes 51 global banks. The estimated coefficient of
is positive and significant at the 5% significance level, equal to 0.12. This result suggests that those banks that finance their assets with a lower share of borrowings through repo agreements, equal to 20% or less of their total assets (as found by the estimate of the threshold at the bottom of
Table 6), adjust their
nioa in the same direction of federal funds rates. For this kind of bank, then, the general result found in [
12] holds: a loosening in domestic monetary policy results in a reduction in net borrowings of domestic banks from their foreign affiliates. The estimated coefficient of
, on the other hand, is negative and significant at the 5% significance level, equal to −0.35. That is, banks that finance more than 20% of their assets with borrowing through repo agreements react differently to a change in domestic policy rate: a fall in federal funds rate results in an increase in
nioa.
This set of results confirms the prediction that those global banks that finance a greater share of their assets through repo markets borrow more from their foreign affiliates when their collateral deteriorates during a banking crisis. The negative and significant effect of federal funds rates on
nioa for those banks can be explained as follows. The slow increase in the federal funds rate from 2003 happened in conjunction with inflating asset prices, which enhanced the value of banks’ collateral. During this period, those global banks that were greatly reliant on borrowing from repo markets had strong collateral and borrowing from foreign affiliates was diminishing. However, as the federal funds rate started to fall dramatically in 2008 and the banking crisis had deteriorated banks’ balance sheets, global banks started borrowing more from their foreign affiliates, given the rising difficulty in borrowing from repo markets. Since regression (2) considers the variables normalized by total assets, the results in
Table 5 might be driven entirely by the asset side of the bank balance sheet for high-repo-funded banks, rather than a shift in the
nioa. Therefore, for robustness check,
Table 7 below reports the two sets of estimates of a linear version of (2) in which the variables are not normalized by assets. The estimates of the first column refer to the sample of global banks with the highest gross amount of repo borrowings; the second column shows the estimates of the model for all other banks. The estimated coefficient of the federal funds rate is significant in both instances and is negative for the sample of banks with the largest amount of outstanding repo debt and positive for all other banks.
Table 6.
Panel threshold regression estimation.
Table 6.
Panel threshold regression estimation.
| Dependent variable: nioa-to-assets | | |
|---|
| Regime-dependent variable | Repo financing | Estimate |
| Federal funds rate | low | 0.116 ** [0.049] |
| Federal funds rate | high | –0.352 ** [0.152] |
| Regime-independent variable | | Estimate |
| Foreign deposits-to-assets | - | 0.640 *** [0.070] |
| Threshold |
| γ | | 0.202 |
Table 7.
Estimation by repo funding. Dependent variable: nioa.
Table 7.
Estimation by repo funding. Dependent variable: nioa.
| Variables | Higher Repo | Lower Repo |
|---|
| Foreign deposits | 0.354 *** (0.056) | 0.263 *** (0.023) |
| Federal funds rate | −8283027 ** (3680297) | 1268646 * (668641) |
| Cross-sections included | 9 | 95 |


