In this section, we present the numerical results about the convergence behaviors of the OAS, the DUR and the CNVX of the three selected MBS instruments. For each selected MBS instrument, we compare the convergence of OAS, DUR and CNVX using different random number generator combinations. We find that for all scenarios, the degree of absolute convergence is larger than the degree of relative convergence for all three MBS instruments. Therefore, by seeking relative convergence instead of absolute convergence, we can save computational time. Details will be given in the following parts.
4.1. Convergence of OAS
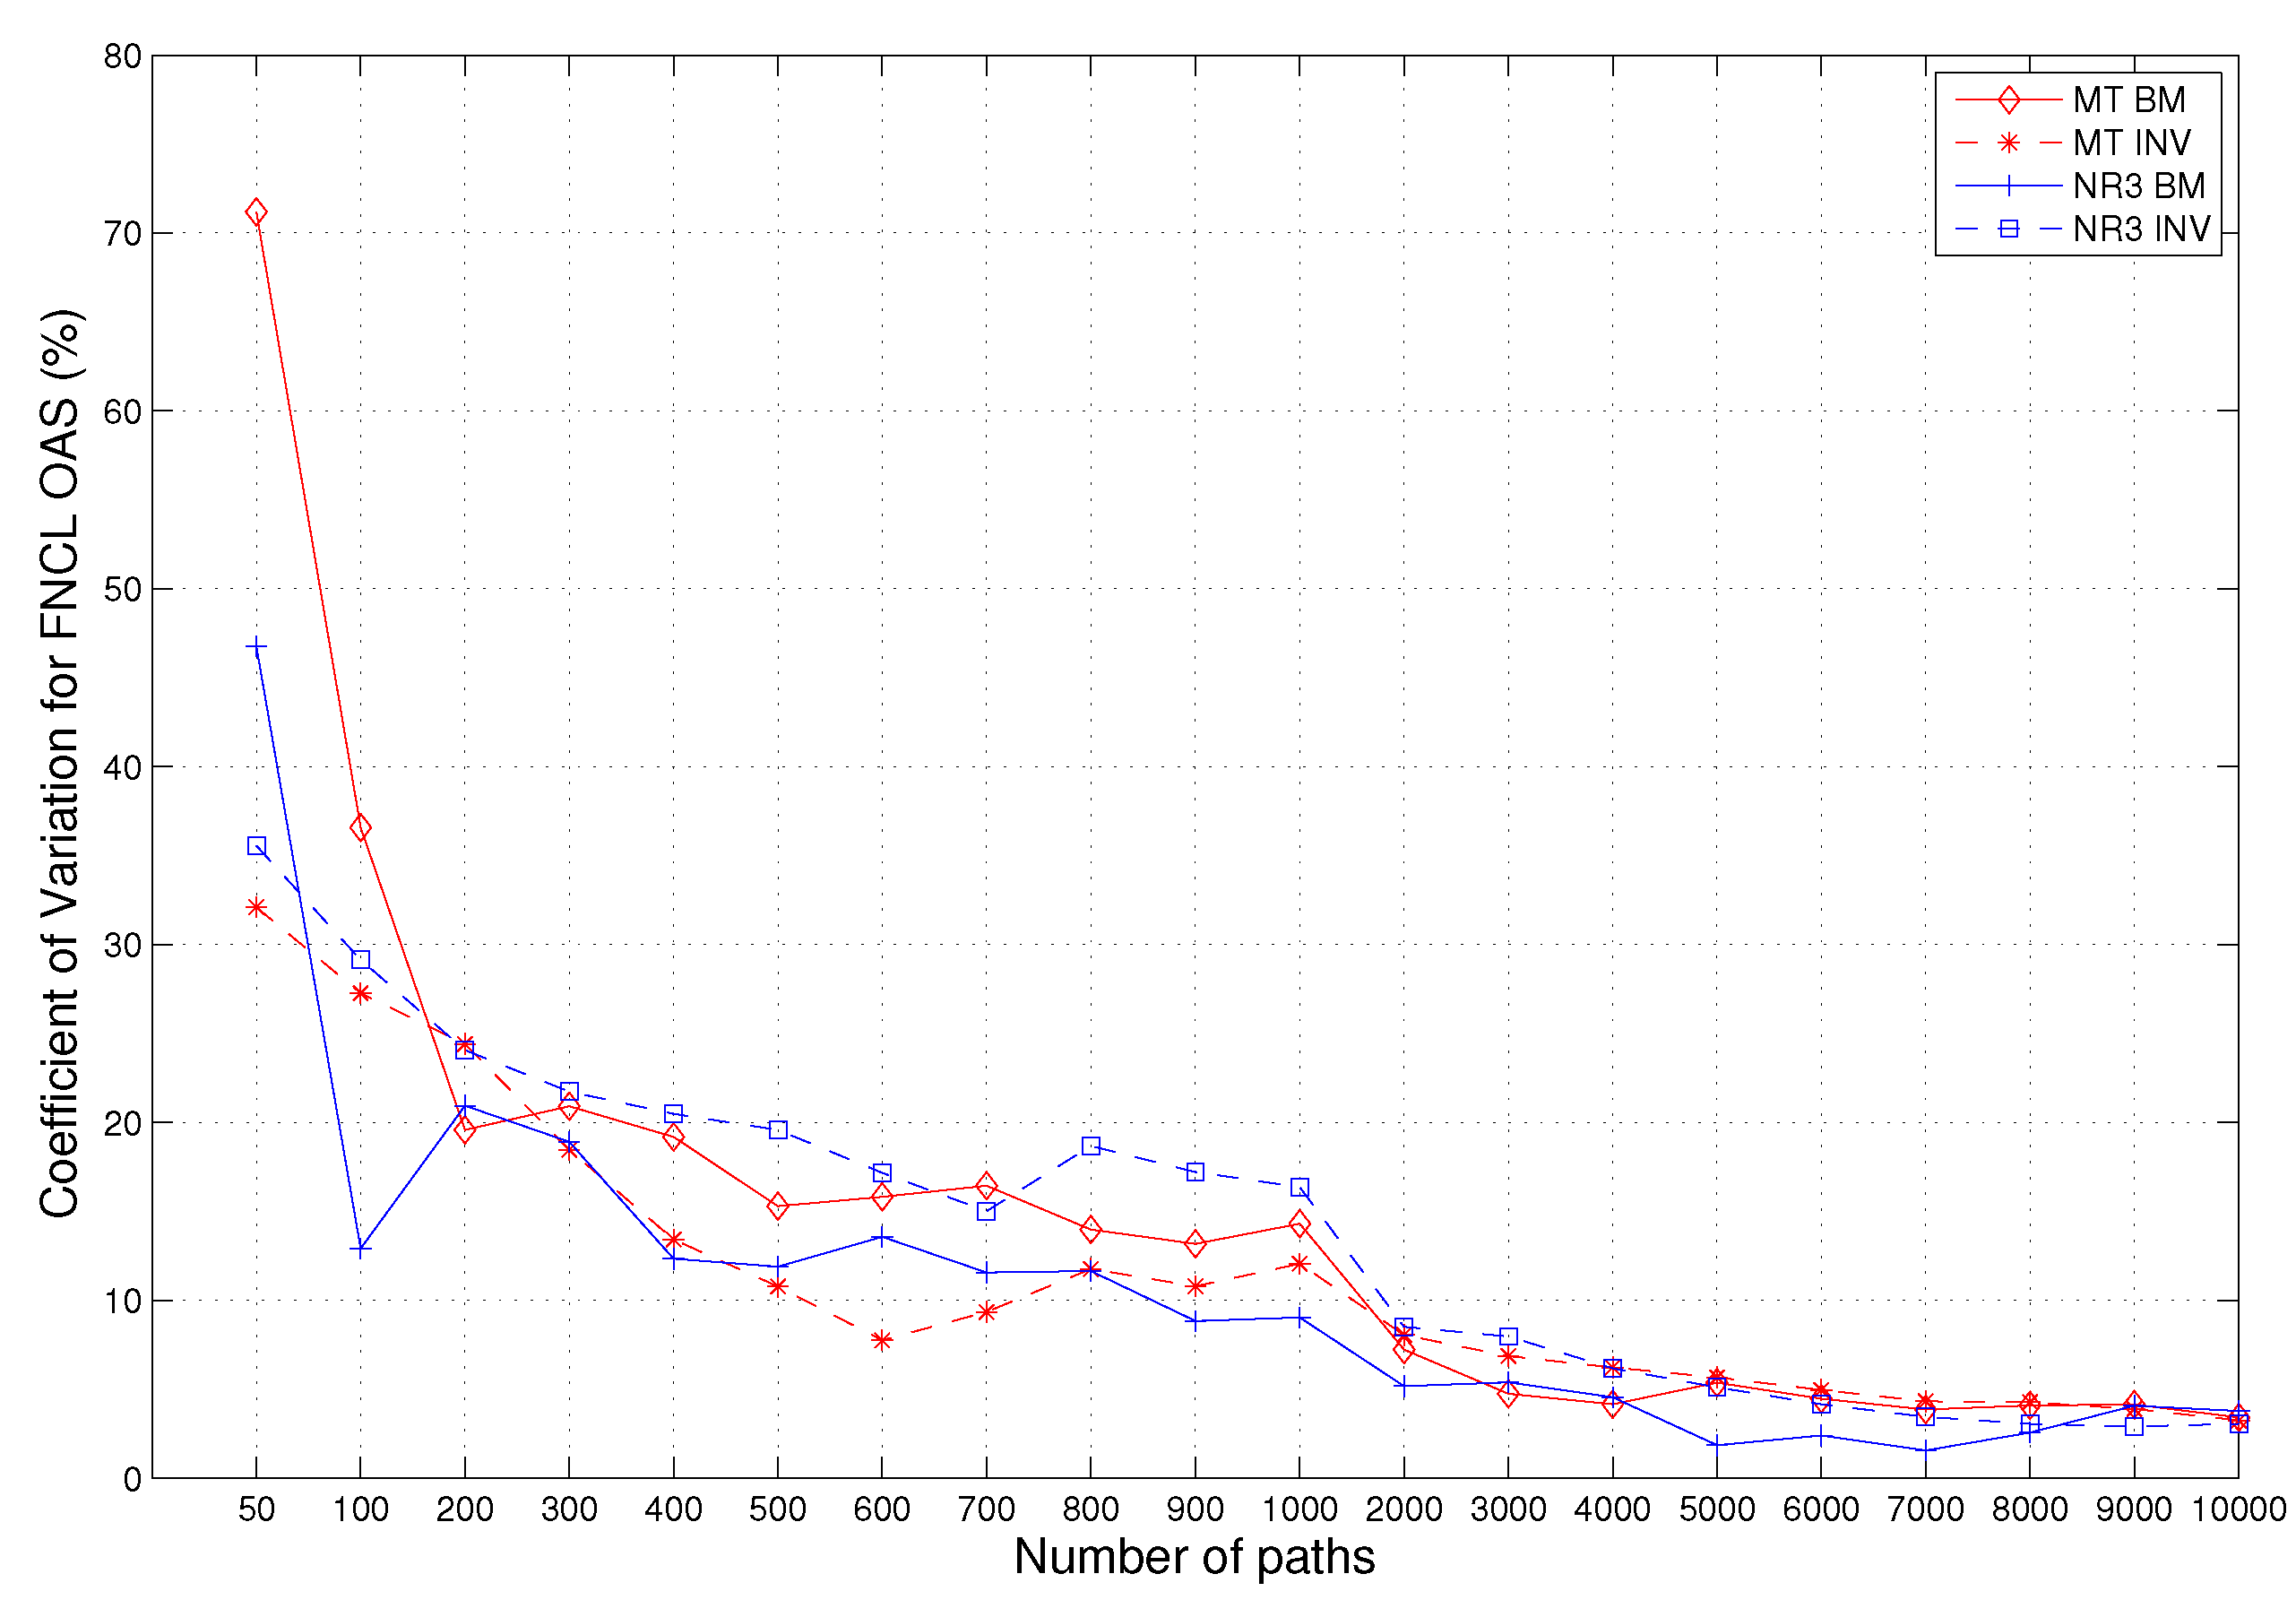
For the three MBS instruments we consider, we calculate the CV of the OAS using four random number generator combinations, MT-BM, MT-INV, NR3-BM and NR3-INV. We give the numerical results for FNCL, which are shown in
Figure 1. The convergence pattern for PAC and Support are very similar, and we omit them here.
Figure 1.
The convergence of OAS for the FNCL. The vertical axis is for the coefficient of variation (%). The horizontal axis is the number of paths.
Figure 1.
The convergence of OAS for the FNCL. The vertical axis is for the coefficient of variation (%). The horizontal axis is the number of paths.
As we can see from the figure, for all four random number generators, OAS does show the convergence properties, and the convergence patterns are very similar to each other. On the other hand, we can tell from the graph that, to reach an accuracy with a CV of 5%, we need about 4,000–6,000 paths. For 10,000 paths, the CVs are about 3% for all four random generators. In other words, the convergence of the OAS of FNCL is not very fast.
Next, we will look at the convergence behaviors of DUR, effective duration, and CNVX, effective convexity of FNCL.
4.2. The Effective Duration and the Effective Convexity
Using OAS obtained by calibrating to the market prices of any selected MBS instrument, we can price the MBS instrument with the interest rate shifting up or down by 100 basis points. Then, by virtue of Equations (
6) and (
7), we can evaluate the DUR and the CNVX of the MBS instrument, which describe the sensitivity of the MBS price against the changes in interest rate. This will also help determine where the value goes and where the risk goes in the MBS structure.
DUR measures the price sensitivity of the MBS with respect to the changes of interest rates. It can be described by the first derivative of the MBS price w.r.t. interest change. CNVX is the second derivative of the MBS price w.r.t. the interest rate change. It measures the sensitivity of DUR to the changes of the interest rate.
The convergence behaviors of DUR and CNVX for FNCL using the four different random number generators are given in
Figure 2.
Figure 2.
The Convergence of DUR and CNVX of the FNCL. The vertical axis is for the coefficient of variation (%). The horizontal axis is the number of paths.
Figure 2.
The Convergence of DUR and CNVX of the FNCL. The vertical axis is for the coefficient of variation (%). The horizontal axis is the number of paths.
As we can tell from the figure, both DUR and CNVX show the convergence property for different random number generators, and the patterns are very similar for different random number generators. On the other hand, we can see that the convergence speeds of DUR and CNVX are faster than that of OAS. For example, if we use 6000 paths, the CV of OAS is only 5%, for which the CV for DUR is about 0.4% and the CV for CNVX is about 1.5% for all random number generators. We will compare their convergence speeds in the next subsection.
In addition, we ran the same numerical experiments for the PAC and the Support, too. The numerical results are similar to that of the FNCL. There are some minor difference. We will present the numerical results later in
Subsection 4.4, the robustness test part.
4.3. Relative Convergence and Absolute Convergence
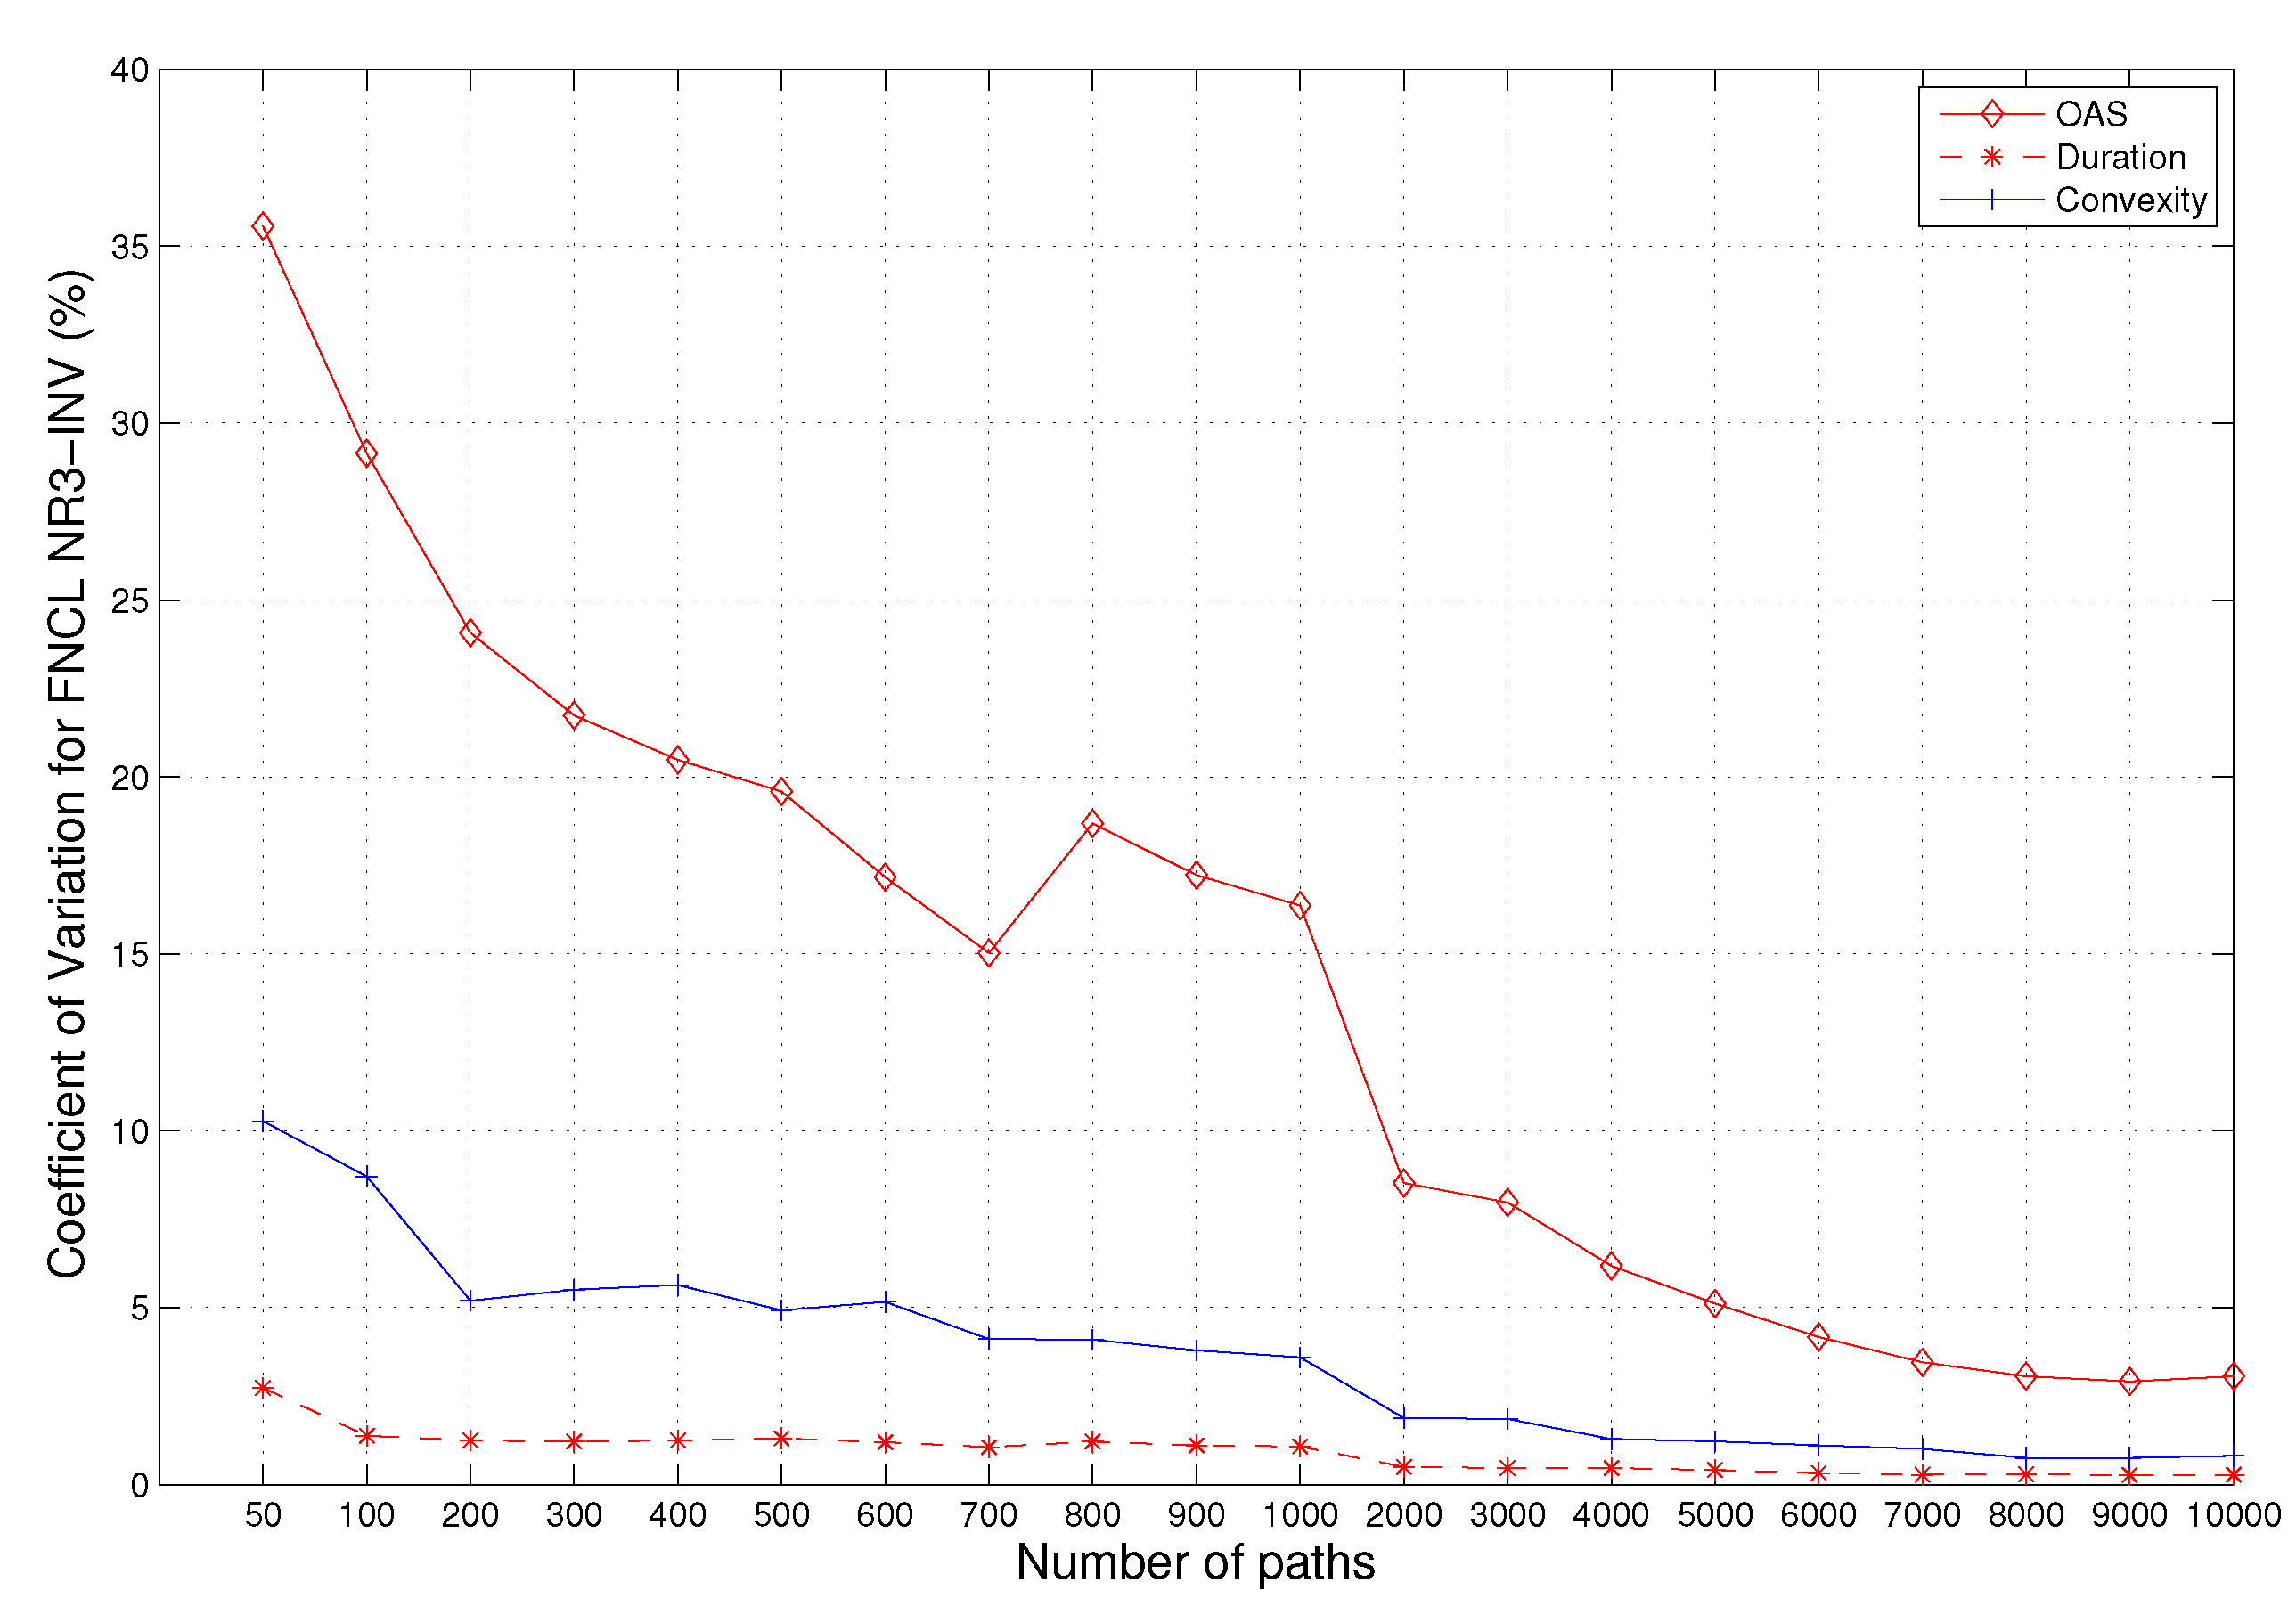
For any given random number generator combination and any of the three MBS instruments we consider, although OAS, DUR and CNVX all show convergence behavior as the number of paths increases, their convergence speeds are different. To indicate this, we consider a particular combination, NR3-INV, for an MBS instrument, FNCL. The convergence behaviors for OAS, DUR and CNVX are shown in the
Figure 3.
Figure 3.
The Comparison of the convergence of OAS, DUR and effective convexity for the FNCL using NR3-inverse cumulative distribution function (INV). The vertical axis is for the coefficient of variation (%). The horizontal axis is the number of paths.
Figure 3.
The Comparison of the convergence of OAS, DUR and effective convexity for the FNCL using NR3-inverse cumulative distribution function (INV). The vertical axis is for the coefficient of variation (%). The horizontal axis is the number of paths.
As we can see from the figure, although OAS does show convergence as the number of paths becomes bigger, the convergence speed is very slow, compared to the convergence of DUR and CNVX.
To quantitatively measure the speed of the convergence, we consider the relation between the CV and the number of paths that are needed to reach the required accuracy measured by the CV. The results are summarized in
Table 1.
Table 1.
Convergence results for FNCL using NR3-INV.
Table 1.
Convergence results for FNCL using NR3-INV.
| CV | 20 | 10 | 5 | 2.5 | 1 | 0.5 | 0.1 |
|---|
| OAS | 500 | 2,000 | 6,000 | + | + | + | + |
| Duration | 50- | 50- | 50- | 100 | 2,000 | 2,000 | + |
| Convexity | 50- | 100 | 500 | 2,000 | 6,000 | + | + |
| Degree of Absolute Convergence | | | | | | | |
| (OAS, DUR/CNVX) | 500 | 2,000 | 6,000 | + | + | + | + |
| Degree of Relative Convergence | | | | | | | |
| (OAS, DUR/CNVX) | 50- | 100 | 500 | 2,000 | 6,000 | + | + |
As we can see from
Table 1, for the FNCL, the convergence speeds for its DUR and CNVX are much faster than its OAS. For example, from
Table 1, we can see that, if we use the random generator NR3-INV, to reach an accuracy of
for OAS,
i.e.,
, the required number of paths are at least
. On the other hand, under the same conditions, to reach the accuracy of
for DUR or CNVX, the number of paths is much less than that for OAS. From the table, we can see that, for FNCL, only 50 paths are needed to reach the accuracy of
for DUR and only 500 paths are needed for the effective convexity.
In addition, from the table, we can see that, for a given number of paths, if the number is small, OAS may not demonstrate good convergence properties. Although OAS obtained at this moment is not so accurate, we can still use it to calculate DURs and CNVXs, which can show very good convergence properties even if we use the same number of paths to calculate them.
To obtain a good approximative value for OAS, we need to use many paths (at least ). Then, we can use OAS to calculate DUR and CNVX. There is no doubt that with the ‘accurate’ OAS and relative large number () of paths, we can get ‘accurate’ values for durations and convexity. This is the absolute convergence, which can always be guaranteed by virtue of the law of large numbers. However, it takes a long time, which is not bearable in the industry.
However, from our numerical results for FNCL, we can see that even if the numbers of paths are small and OAS does not show a very decent convergence property, DUR and CNVX can show a very nice convergence behavior. This is the relative convergence.
In
Table 1, we also give the degrees of absolute convergence for OAS and DUR/CNVX, which are the number of paths that are needed for both OAS and DUR/CNVX to reach certain accuracy (CV) levels. The degrees of relative convergence, the numbers of paths that are needed for DUR/CNVX to reach certain accuracy (CV) levels, are given in
Table 1, too. As we can see, the degree of absolute convergence is always larger than the degree of relative convergence, unless both of them are beyond
. For the latter case, although we do not have accurate values for the degrees of absolute convergence and relative convergence, we can tell from
Figure 3 that the degree of absolute convergence is always larger than the degree of relative convergence. Therefore, if our final goal is to get DUR/CNVX only, we can seek relative convergence instead of absolute convergence to save computational time.
4.4. Robustness
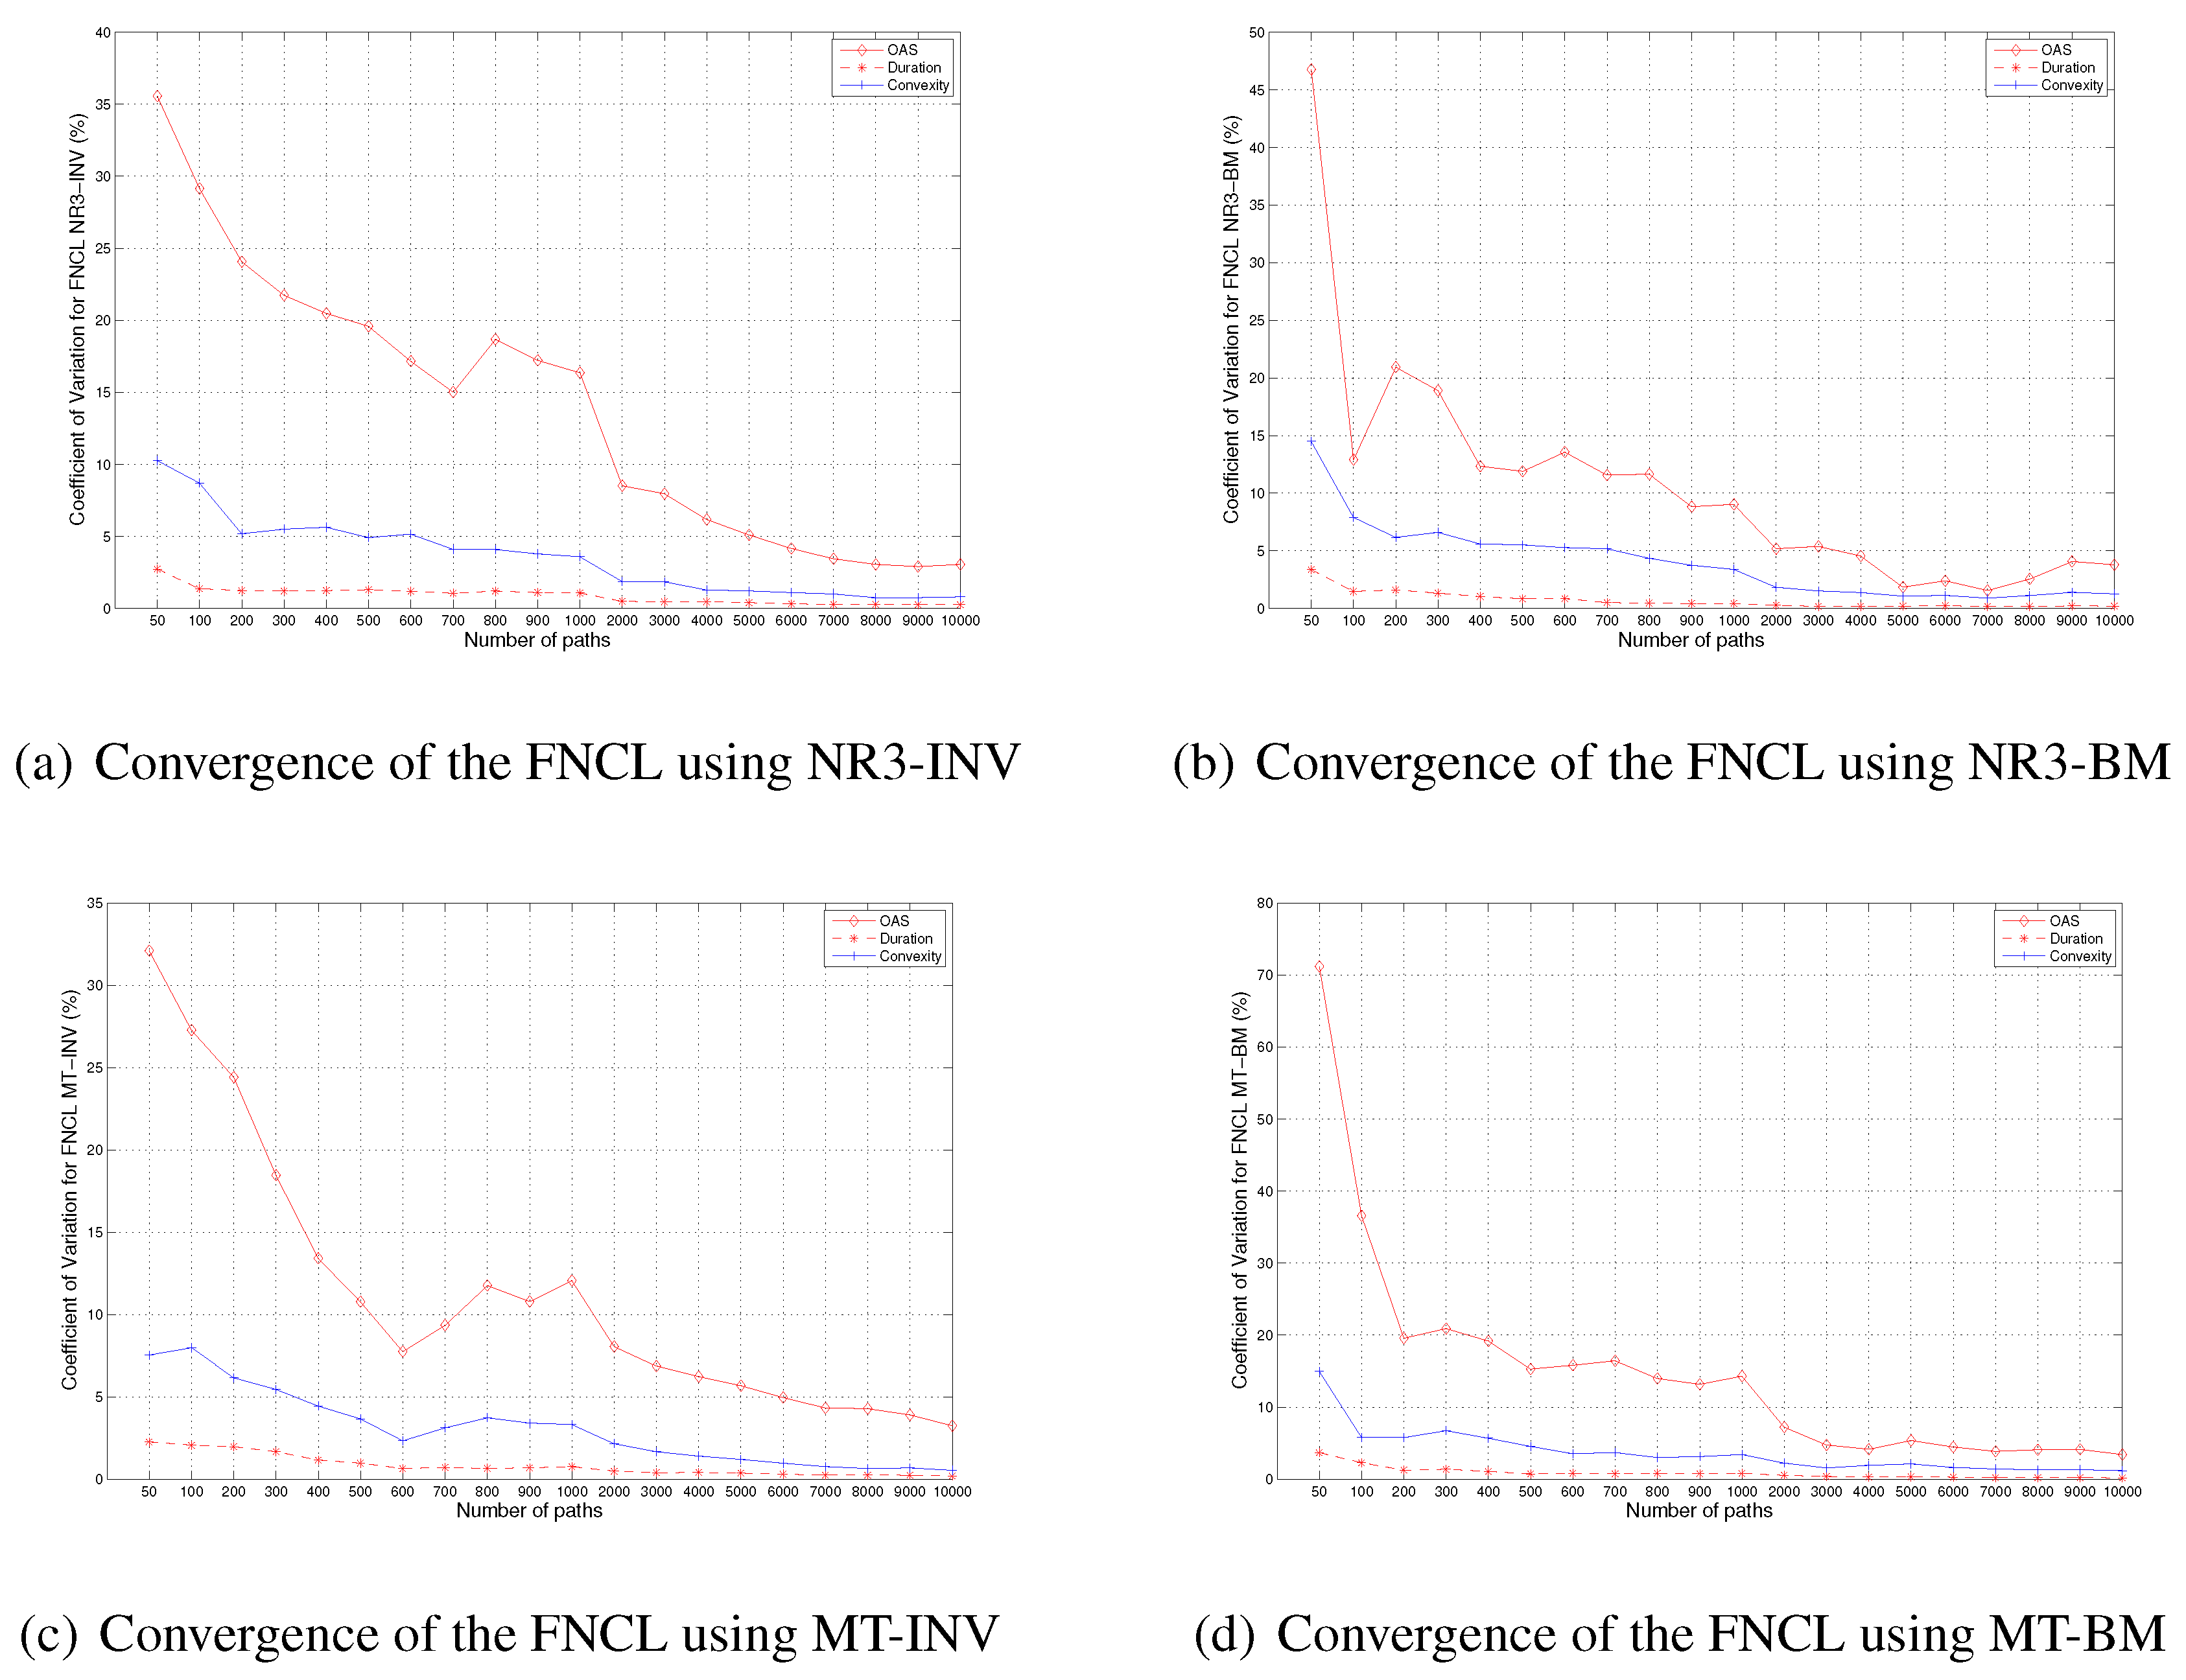
In the last subsection, we presented the numerical results for an MBS instrument, FNCL, using the random number generator combination RN3-INV. To test the robustness of the method, we also use another three random number generator combinations, NR3-BM, MT-INV and MT-BM, for our numerical experiments of FNCL. The numerical results are shown in
Figure 4 (we put the results for NR3-INV here also for comparison purposes).
Figure 4.
The Convergence of OAS, DUR and CNVX of the FNCL using different random number generator combinations, NR3-INV, NR3-Box–Müller (BM), Mersenne twister (MT)-INV and MT-BM. The vertical axis is for the coefficient of variation (%). The horizontal axis is the number of paths.
Figure 4.
The Convergence of OAS, DUR and CNVX of the FNCL using different random number generator combinations, NR3-INV, NR3-Box–Müller (BM), Mersenne twister (MT)-INV and MT-BM. The vertical axis is for the coefficient of variation (%). The horizontal axis is the number of paths.
As we can see from the figure, for NR3-BM, MT-INV and MT-BM, the convergence patterns of OAS, DUR and CNVX are very similar to the pattern when we use NR3-INV.
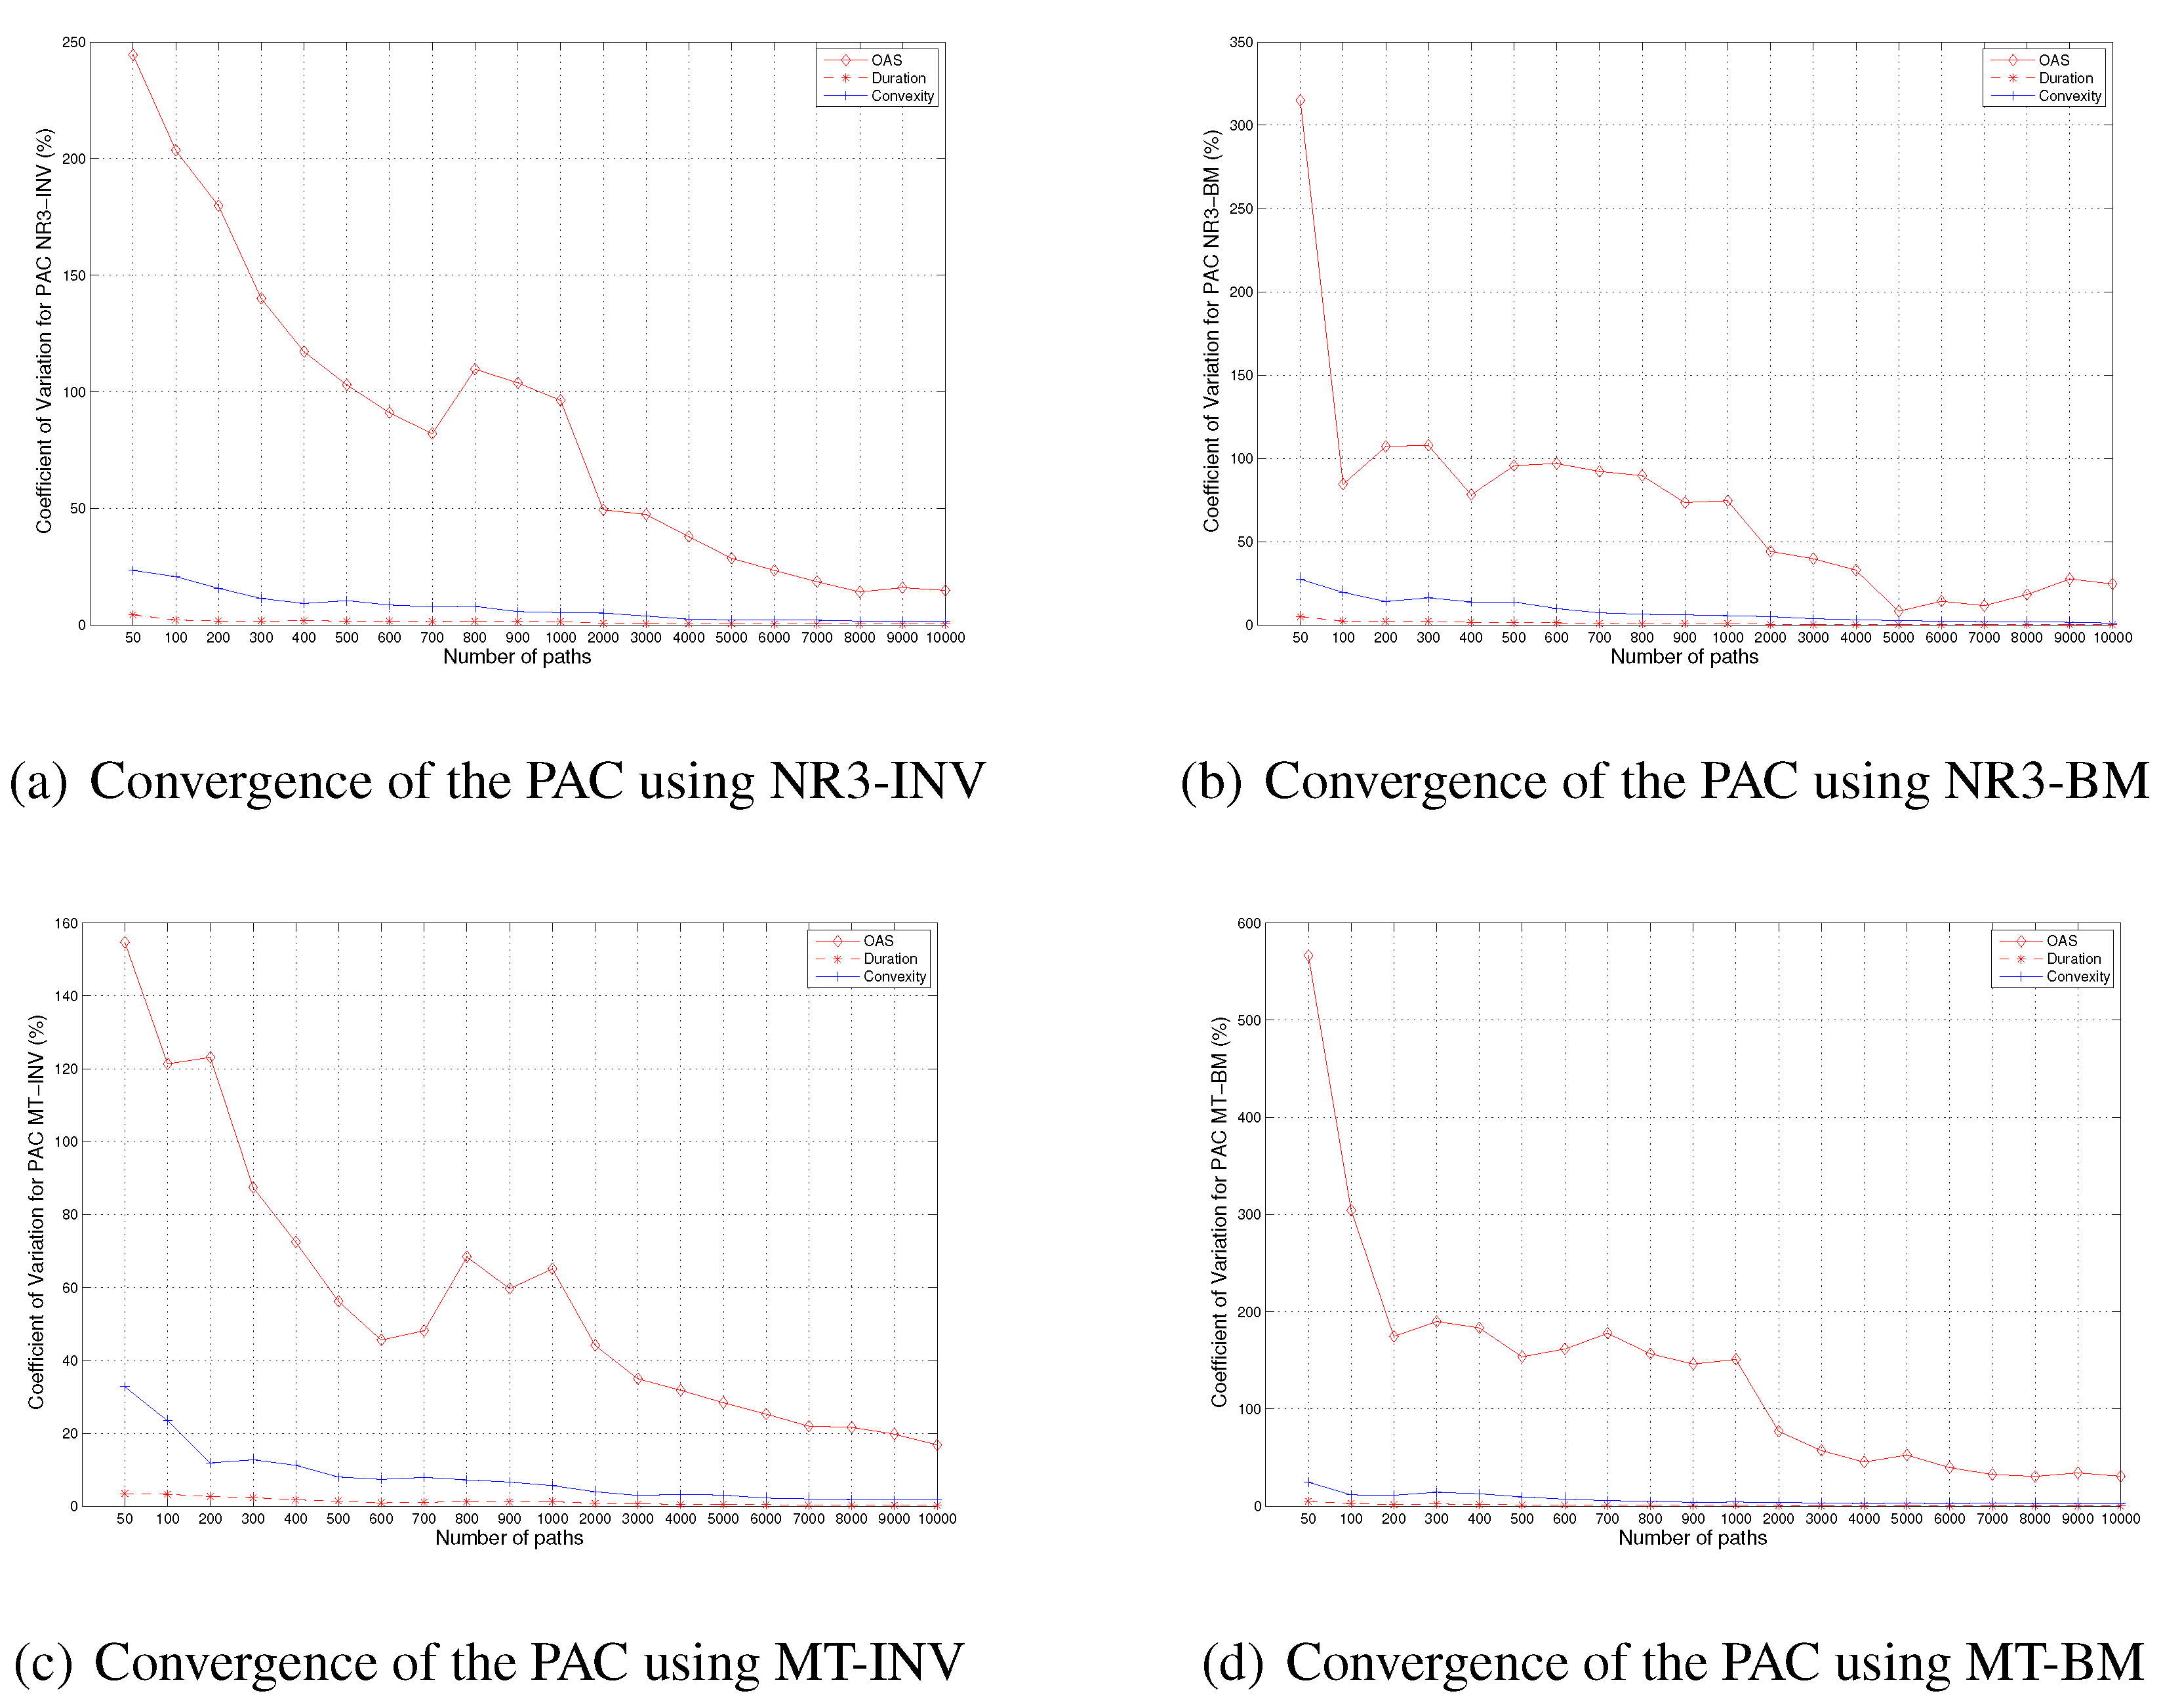
In addition, we repeat the numerical experiment for the other two MBS instruments, the PAC and the Support. The numerical results are given in
Figure 5 and
Figure 6.
As we can see from all of those figures, for all scenarios that we considered, we do observe the phenomenon that DUR and CNVX converge faster than OAS. Therefore, it is safe to say that relative convergence does exist for MBS securities when we use the typical pseudo-random number generators for our Monte Carlo Simulation.
Figure 5.
The Convergence of OAS, DUR and CNVX of the planned amortization class (PAC) using different random number generator combinations, NR3-INV, NR3-BM, MT-INV and MT-BM. The vertical axis is for the coefficient of variation (%). The horizontal axis is the number of paths.
Figure 5.
The Convergence of OAS, DUR and CNVX of the planned amortization class (PAC) using different random number generator combinations, NR3-INV, NR3-BM, MT-INV and MT-BM. The vertical axis is for the coefficient of variation (%). The horizontal axis is the number of paths.
We want to point out that the relative convergence patterns for the FNCL, the PAC and the Support are somewhat different from each other. Although the DURs for all three MBS instruments have strong relative convergence patterns, the situation for CNVX is very different. From the figures, we can see that the convergence of CNVX is very fast for PAC. For the FNCL, the convergence of CNVX is slower than that of the PAC, but faster than that of the Support. This is not very surprising since PAC is the senior tranche and its duration is less sensitive to the prepayment and interest rate change, compared to the pass-through and the Support. On the other hand, the Support absorbs most of the prepayment, and its price and duration are more sensitive to the interest rate movement.
In addition, we observe that the relative convergence of DUR is stronger than that of CNVX for all three MBS instruments that we considered. In other words, to obtain the desired accuracy in terms of CV, the number of paths needed for DUR is less than that needed for CNVX, while the number of paths needed for OAS is the largest. Therefore, the convergence speed for DUR is the fastest, followed by that for CNVX and OAS. This is true for all three MBS instruments that we considered.
From our numerical results, we can see that if our final goal is to calculate the effective duration and CNVX for an MBS instrument, it is not necessary to use tens of thousands of paths to obtain an ‘accurate’ OAS first. Instead, in most cases, several thousands or several hundreds of paths are enough to get very accurate values of DUR and CNVX.
Figure 6.
The Convergence of OAS, DUR and CNVX of the Support using different random number generator combinations, NR3-INV, NR3-BM, MT-INV and MT-BM. The vertical axis is for the coefficient of variation (%). The horizontal axis is the number of paths.
Figure 6.
The Convergence of OAS, DUR and CNVX of the Support using different random number generator combinations, NR3-INV, NR3-BM, MT-INV and MT-BM. The vertical axis is for the coefficient of variation (%). The horizontal axis is the number of paths.


