1. Introduction
Over the past decade, credit derivatives have experienced a noticeable increase of importance in financial markets. Within this class of derivative instruments, credit default swaps (hereinafter, CDS) have received a special attention from regulators, practitioners and academics. The turnover of CDS markets has increased markedly over the last few years, even though the majority of transactions are executed over-the-counter, posing some concerns about the transparency of these operations. In effect, some authors argue that these transactions contributed to a surge of the systemic risk in the financial sector during the financial crisis of 2008.
CDS spreads reflect the default risk of the reference entity. The final payoff of these over-the-counter contracts depends on a credit event and the spreads indicate the credit quality of the reference entity. These contracts allow investors to transact separately the credit risk of the reference entity and to split funding from default risk."
1 These markets, as other derivatives markets in general, have experienced a noticeable growth over the last decade. Financial institutions are one of the major participants in CDS markets, since it allows them to hedge their exposure to illiquid bonds and/or loans/receivables. One argument in favor of these instruments is that they provide additional liquidity to the bond market, promote risk sharing between market participants and allow creating synthetic portfolios of bonds. For instance, Alan Greenspan argued that these new financial instruments allowed the sophisticated financial institutions to reduce their credit risk, transferring it to less leveraged market participants.
Initially, credit default swap markets focused private debt since the risk of default was higher for these reference entities. Transactions over sovereign reference entities were rare, although contracts over sovereign debt of emerging market countries, such as Latin America and Eastern Asia, gained some popularity after the Eastern Asia currency crisis. After the Lehman Brothers bankruptcy, investors turned their attention to the capacity of developed countries (in particular, South-European countries) to honor their obligations. Euro zone countries faced a large increase of public debt, in order to recapitalize the financial system and to fight the economic recession and unemployment.
Merton(1974) [
1] proposes a structural model to price the equity of a firm as a contingent claim. The value of liabilities would reflect the difference between the value of a riskless bond and a put option over the firms’ assets, having as strike price the face value of liabilities. According to the model, a high debt equity ratio would imply a high correlation between stock and bond prices, because stock and bond prices are influenced by the market value of assets. [
2] shows that subject to some assumptions, a long position in a par priced floating rate note and the purchase of a CDS contract with the same face value of protection, creates a combined position with no credit risk in the event of default. Hence, the CDS spread should be equal to the credit spread of the par priced floating rate note. In that sense, one should expect a similar association between bond credit spreads and stock prices, and between CDS spreads and stock prices, because bond credit spreads and CDS spreads are close substitutes. Indeed, some authors document an association between credit (bond) markets and stock markets. In the 1990s, some empirical studies showed an empirical relation between stock returns and bond yield changes. For instance, [
3,
4,
5] report a contemporary and slightly positive but statistically significant association between stocks and bond returns.
In this study, I address the empirical relation between stock and sovereign CDS markets. Sovereign CDS spreads are credit risk indicators that depend on the economic fundamentals of a country. Thus, if stock markets are an economic barometer, a volatility increase or decline might result in a message for sovereign debt creditors. On the other hand, a decline in the government refinancing conditions or an increasing sovereign default risk may also cause more taxes and a rise in the cost of capital/higher credit spreads for domestic companies, reducing future earnings and stock prices. To put it another way, one might expect a negative relation between stock returns and sovereign CDS spreads.
Contrary to other studies that focus the relationship between stock prices and firms’ CDS spreads, I assess the empirical relation between sovereign CDS spreads and the aggregated stock market performance, with the advantage that the analysis focus two distinct periods: a stable one, characterized by a low sovereign default risk and a bullish stock market, and an instable one, characterized by the financial distress of sovereign entities. Therefore, I present three major contributions to the financial literature about this topic, which is presently concentrated in a small number of papers. In particular, I study (i) the existence of a long-term relation between CDS spreads and stock index prices; (ii) the price discovery mechanism and the interaction between the markets; and (iii) the market volatility propagation. I analyze data from eleven Euro zone countries (Portugal, Spain, Italy, France, Greece, Ireland, Germany, Finland, Austria, The Netherlands, and Belgium) and the period that ranges between 2007 and 2012. Besides reinforcing the empirical evidence about this subject, this study aims to help practitioners and regulators to understand the complex linkages between these two markets.
This paper is structured as follows: section two contains the literature review; section three conveys the theoretical framework and the sample; section four presents the empirical results; and finally section five displays the conclusions and a brief discussion of the implication of the results.
2. Literature Review
Most of the empirical analysis on this subject focuses the links between stock and CDS spreads at the level of the firm, not the linkage between sovereign CDS markets and the stock market as a whole. The linkage between the two markets is supported by [
1], where equity and debt are modelled as contingent claims over a firm’s assets. According to Merton, the default probability of a company is a non-linear function of the market value of the assets, the assets volatility and the debt-equity ratio. Consequently, the returns of bonds and stocks should be correlated, with that correlation increasing as the default risk increases. When equity and debt expected returns are not proper, arbitrage based in the firm’s capital structure is possible. Therefore, if a company’s CDS spread is higher (lower) than it should be (given the stock price as well), an arbitrageur could obtain riskless profits from selling (buying) CDS contracts and buying (selling) shares. This way, arbitrage forces the equilibrium between the two markets.
Blume
et al (1991), Cornell and Green (1991) and Fama and French (1993) [
3,
4,
5] emphasize the presence of a contemporaneous, inter-temporal, slightly positive and statistically significant econometric relation between stock and bond returns. [
6] concludes that changes of bond yields are positively influenced by changes of Treasury bond yields and negatively affected by contemporaneous and lagged stock returns. [
7] show a positive association between the raw daily returns of stocks and bonds of financially distressed firms in the period 1994–1997. However, when stocks abnormal returns are used instead of raw returns, the statistical association between the variables turns non-statistically significant. [
8] study the informational efficiency of corporate bond markets for financial distressed firms using hourly data. Their sample consists in data collected after 1995. They do not find evidence that stock markets led bond markets, although there is a modest and positive contemporaneous association between them.
Longstaff
et al (2003) [
9] examine Granger causality between (weekly) changes of CDS spreads, changes of bond spreads and stock returns. Their analysis focuses on the US markets and the results indicate that stock markets and CDS markets led corporate bond markets meaning that new information is incorporated into prices firstly in the first two markets than in the bond market. [
10] document an empirical relation between the volatility of stock returns and bond yields. [
11] show that CDS spreads anticipate credit quality deterioration before stock markets. [
12] study the relationship between stock markets, bond markets and CDS markets during the period 2000–2002 for a set of 58 firms (USA (35), Europe (20) and Asia (3)). They find that (i) the CDS market reacts to the stock market movements, and that the magnitude of that reaction is affected by the credit quality of the firm and by the liquidity of the bond market; and (ii) stock returns lead bond spreads and CDS spreads.
Bystrom (2005) analyzes [
13] the association between the performance of a CDS iTraxx index and stock market returns during the period 2004–2005 and concludes that stock market returns Granger cause CDS spread changes, but the reverse does not occur. [
14] report a negative correlation between CDS indexes and stock indexes performance. That correlation is higher amid financial distressed firms and in the overall the correlation surged after July 2007. This outcome is consistent with Merton model: the decline of stock prices results in an increase of leverage, contributing to a rise of default risk and CDS spreads. Results also suggest that the stock market leads the CDS market, regardless of the firm’s financial situation. However, the volatility spillovers from the CDS markets to the stock markets are higher than the reverse.
Avramov
et al (2009) [
15] show that the effect of rating downgrades on stock prices and CDS spreads is higher amid financially distressed firms. [
16] show that the stock market leads the CDS market and the bond market in price discovery. [
17] show that the price discovery process varies with the financial situation of the firms. The contribution of stock markets to price discovery is positively influenced by the turnover ratio of the stock market, the credit quality of the firm and by the reduced presence of negative adverse shocks. Stock markets appear to lead CDS markets, but that leadership has been decreasing over time.
Chan-Lau and Kim (2004) and Chan
et al (2008) [
18,
19] focus the interaction between sovereign credit markets and stock markets. The former authors study a long-term equilibrium relation between stock index prices, sovereign CDS spreads and bond spreads. They use a sample with eight emerging countries (Brazil, Bulgaria, Colombia, Mexico, Philippines, Russia, Turkey, and Venezuela) and cover the period that ranges between March 2001 and Mid-2003. They do not find a long term equilibrium relationship between stock markets and CDS (bond) markets on the large majority of the analyzed countries (the exceptions are Russia and Venezuela, in which the stock market led price discovery). [
19] extend [
18] sample to seven Asian countries (China, Korea, Thailand, Japan, Malaysia, Indonesia, and The Philippines) and cover the period 2001–2007. They conclude that CDS spreads and stock prices are negatively correlated in all countries with the exception of China. They find a cointegration relationship between stock prices and CDS spreads for China (since 2005), Thailand and South Korea. On the other hand, the CDS market seems to lead the stock market, which refutes [
18] results.
4. Empirical Results
I begin by dividing the sample of each country into distinct bins of observation, according to the 5Y implied cumulative default probability (henceforth, P.D.) extracted from the observed sovereign CDS spreads. To compute the 5Y implied cumulative default probability, I use the approximation provided by Equation (1)
2.
Next, I assign an implied rating to each observation in accordance with the bins displayed in
Table 1.
Table 1.
Implied rating and default probability.
Table 1.
Implied rating and default probability.
| 5 years implied cumulative default probability | Implied Rating |
|---|
| [0; 5%) | A |
| [5%; 10%) | B |
| [10%; 18%) | C |
| [18%; 25%) | D |
| [25%; 50%) | E |
| >50% | F |
Table 2 presents the partition of the sample of each country according to the implied rating. The statistical properties of the time series of CDS spreads and (log) stock index prices are then analyzed for each of the bins. In a first stage, the stationary of the series is evaluated.
Table 3 displays the results from Augmented Dickey-Fuller tests (ADF tests). Almost all the series are first order integrated. The exceptions are CDS spreads of Ireland in state E, CDS spreads of Austria (in all buckets) and the log of stock index prices of Greece in state E.
Table 2.
Implied rating/bucket.
Table 2.
Implied rating/bucket.
| Country | Implied Rating/Bucket | Beginning | End | Country | Implied Rating/Bucket | Beginning | End |
|---|
| Spain | A | 03-01-2005 | 02-10-2008 | Greece | A | 03-01-2005 | 29-09-2008 |
| B | 03-10-2008 | 06-04-2010 | C | 30-09-2008 | 10-11-2009 |
| C | 07-04-2010 | 11-02-2011 | D | 11-11-2009 | 23-04-2010 |
| D | 14-02-2011 | 17-08-2011 | E | 26-04-2010 | 25-11-2010 |
| E | 18-08-2011 | 16-05-2012 | F | 26-11-2010 | 16-09-2011 |
| Portugal | A | 03-01-2005 | 03-10-2008 | Germany | A | 03-01-2005 | 15-07-2011 |
| B | 06-10-2008 | 14-01-2010 | B | 18-07-2011 | 16-05-2012 |
| C | 15-01-2010 | 14-05-2010 | Belgium | A | 03-01-2005 | 23-10-2008 |
| D | 17-05-2010 | 16-09-2010 | B | 24-10-2008 | 04-11-2010 |
| E | 17-09-2010 | 05-07-2011 | C | 05-11-2010 | 31-08-2011 |
| F | 06-07-2011 | 16-05-2012 | D | 01-09-2011 | 16-05-2012 |
| Ireland | C | 29-01-2009 | 24-05-2010 | Austria | A | 03-01-2005 | 22-10-2008 |
| D | 25-05-2010 | 08-10-2010 | B | 23-10-2008 | 01-09-2011 |
| E | 11-10-2010 | 16-05-2012 | C | 02-09-2011 | 16-05-2012 |
| Italy | A | 03-01-2005 | 14-08-2008 | The Netherlands | A | 05-09-2008 | 02-08-2011 |
| B | 15-08-2008 | 29-12-2008 | B | 03-08-2011 | 16-05-2012 |
| C | 30-12-2008 | 18-08-2011 | France | A | 03-01-2005 | 23-04-2010 |
| D | 19-03-2012 | 19-03-2012 | B | 26-04-2010 | 01-08-2011 |
| E | 19-08-2011 | 16-05-2012 | C | 02-08-2011 | 16-05-2012 |
| Finland | A | 26-01-2009 | 08-11-2011 | - | - | - | - |
| B | 09-11-2011 | 16-05-2012 | - | - | - | - |
Table 3.
Augmented Dickey–Fuller unit root tests.
Table 3.
Augmented Dickey–Fuller unit root tests.
| Country | Implied Rating | CDS Spreads | Log Stock Prices | Country | Implied Rating | CDS Spreads | Log Stock Prices |
|---|
| Portugal | A | 1.55 | −0.81 | Finland | A | −1.63 | −1.92 |
| B | −1.63 | −0.80 | B | −1.39 | −1.48 |
| C | −1.05 | −0.94 | Spain | A | 2.38 | −1.73 |
| D | −1.32 | −2.6186 * | B | −2.16 | −1.32 |
| E | −0.16 | −1.98 | C | −2.27 | −2.57 |
| F | −2.6894 * | −1.91 | D | −1.11 | −0.73 |
| Greece | A | 0.15 | −1.19 | E | −1.56 | 0.09 |
| C | −1.80 | −1.32 | Belgium | A | 2.99 | 1.24 |
| D | 0.36 | −2.03 | B | −1.13 | −1.08 |
| E | −1.88 | −2.921 ** | C | −1.49 | −0.61 |
| F | 1.18 | 1.06 | D | −2.03 | −1.62 |
| Italy | A | 0.19 | −0.78 | Ireland | C | −1.78 | −1.56 |
| B | −1.16 | −1.11 | D | −0.24 | −2.13 |
| C | −0.37 | −1.32 | E | −2.9521 ** | −1.32 |
| E | −2.37 | −1.50 | Austria | A | 6.7262 *** | −0.32 |
| France | A | −0.87 | −1.21 | B | −2.19 | −1.85 |
| B | −1.31 | −2.15 | C | −2.8147 * | −1.80 |
| C | −2.53 | −1.91 | The Netherlands | A | −2.10 | −2.01 |
| Germany | A | −1.26 | −1.73 | B | −2.35 | −1.62 |
| B | −2.7546 * | −2.09 | - | - | - | - |
The simpler way to examine the interaction between CDS spreads and stock index prices lies in the computation of the Pearson correlation coefficient. Given that the CDS spreads and the log of stock index quotes are unit roots, the computation of the first difference of the variables is necessary to ensure the robustness of the results. I calculate the Pearson correlation coefficient in each bucket (defined according to the implied rating), in order to compare the contemporaneous correlation between CDS spread changes and indexes returns in different stages of financial distress.
Table 4 shows that the correlation between CDS spread changes and stock market returns increases when the P.D. increases. However, in some particular cases, such as Portugal and Greece, that correlation actually declines (in absolute value) in the worst bins (E and F). Indeed, in the case of Greece the coefficient of correlation declined from −0.56 to −0.18; Ireland also exhibits a slight reduction of the correlation in the shift from bin D to bucket E.
Two notes concerning the abovementioned results. First, CDS spreads are not available for some countries before 2009, and, thus, the span of the analysis differs across countries. Second, the number of partitions of the sample for each country depends on the number of bucket changes over the analyzed time span. These two reasons help explaining the correlation discrepancy observed between the buckets A of Portugal and Greece, and the buckets A of Finland, France and The Netherlands. In fact, the first set of countries presents near 0 correlations on bucket A, whereas the second set presents correlations significantly higher than 0. Notice that the correlations from the first set comprehend only the period prior to 2009, which was relatively stable in terms of sovereign credit risk (not only for Portugal and Greece, but also for the remaining countries that integrate the Euro area). In the cases of Finland and France, the correlation displayed in state A comprehends (also) the period after 2010, which was striking in terms of sovereign credit risk contagion amid Euro area countries. As a result, one can conclude that the correlations represent different states of financial distress, but they are also conditioned by the overall Euro area systematic credit risk.
Another measure used to examine the association between the two markets is the Granger causality test, which allows inferring about the market that leads price discovery. First, Equation (2) is estimated, and then an F-test is performed.
Table 4 displays Granger causality tests computed for each country and across financial distress states and
Table 5 exhibits the results of Johansen cointegration test.
where ΔPCDS,t respects to CDS spreads changes; and ΔPIB,t concerns stock index returns.
Table 4.
Correlation and “Granger” causality between stock returns and credit default swaps (CDS) spread changes.
Table 4.
Correlation and “Granger” causality between stock returns and credit default swaps (CDS) spread changes.
| Country | Implied Rating | Contemporaneous Correlation | CDS spread changes “Granger” cause stock index returns | Stock index returns “Granger” cause CDS spread changes | Country | Implied Rating | Contemporaneous Correlation | CDS spread changes “Granger” cause stock index returns | Stock index returns “Granger” cause CDS spread changes |
|---|
| Portugal | A | −0.0698 | 6.2879 *** | 2.8614 ** | Finland | A | −0.4025 | 1.9088 | 6.9683 *** |
| B | −0.2142 | 4.6743 *** | 2.8548 ** | B | −0.5111 | 0.8781 | 2.3733 * |
| C | −0.7775 | 5.8204 *** | 2.1802 * | Spain | A | −0.1349 | 0.8131 | 3.387 *** |
| D | −0.4885 | 1.1408 | 0.7449 | B | −0.2878 | 1.7446 | 5.5685 *** |
| E | −0.5620 | 3.6402 *** | 0.5291 | C | −0.6234 | 8.6928 *** | 0.6249 |
| F | −0.4900 | 0.3972 | 1.0636 | D | −0.4676 | 1.1072 | 0.6360 |
| Greece | A | −0.0896 | 0.4377 | 4.2043 *** | E | −0.6845 | 2.9685 ** | 3.0844 ** |
| C | −0.2747 | 0.5902 | 4.7411 *** | Belgium | A | 0.0239 | 15.123 *** | 6.7967 *** |
| D | −0.5514 | 0.7095 | 1.1650 | B | −0.2137 | 0.9081 | 6.0297 *** |
| E | −0.5576 | 0.2997 | 3.5087 *** | C | −0.5470 | 2.408 * | 0.2940 |
| F | −0.1779 | 2.7351 ** | 3.2567 ** | D | −0.7109 | 0.6674 | 0.4547 |
| Italy | A | −0.1657 | 1.991 * | 3.0647 ** | Ireland | C | −0.3617 | 1.3099 | 0.7288 |
| B | −0.2927 | 0.8176 | 0.2969 | D | −0.4032 | 0.8491 | 0.5740 |
| C | −0.5214 | 9.1768 *** | 0.4284 | E | −0.3725 | 0.6269 | 0.9290 |
| E | −0.7007 | 1.1375 | 1.7148 | Austria | A | −0.2095 | 2.3407 * | 2.7216 ** |
| France | A | −0.2128 | 1.4059 | 6.5063 *** | B | −0.2960 | 0.2074 | 11.96 *** |
| B | −0.3291 | 1.9427 | 1.3885 | C | −0.7250 | 1.4686 | 0.8392 |
| C | −0.7367 | 1.7235 | 0.8110 | The Netherlands | A | −0.2523 | 2.0693 * | 6.6975 *** |
| Germany | A | −0.1627 | 0.6423 | 6.6258 *** | B | −0.6471 | 1.1267 | 0.3772 |
| B | −0.6759 | 2.5721 ** | 1.6839 | - | | - | - | - |
Table 5.
Cointegration tests: log of stock index prices and CDS spreads.
Table 5.
Cointegration tests: log of stock index prices and CDS spreads.
| Country | Implied Rating | Max Eigen Test | Trace Test | Country | Implied Rating | Max Eigen Test | Trace Test |
|---|
| Portugal | A | 17.16 *** | 20.44 *** | Finland | A | 6.44 | 11.77 |
| B | 7.40 | 10.12 | B | 9.32 | 10.89 |
| C | 21.12 *** | 27.39 *** | Spain | A | 17.95 ** | 22.75 ** |
| D | 15.18 * | 16.67 | B | 14.94 * | 17.52 |
| E | 14.01 * | 20.05 ** | C | 12.85 | 15.68 |
| F | 19.00 ** | 24.56 ** | D | 20.21 *** | 22.38 ** |
| Greece | A | 12.16 | 14.86 | E | 21.14 *** | 22.53 ** |
| C | 8.39 | 10.56 | Belgium | A | 57.59 *** | 63.23 *** |
| D | 16.69 ** | 19.86 *** | B | 6.78 | 8.12 |
| E | 13.05 | 17.29 | C | 8.57 | 9.74 |
| F | 13.23 | 18.53 * | D | 16.81 ** | 21.95 ** |
| Italy | A | 8.53 | 10.95 | Ireland | C | 18.88 ** | 23.17 ** |
| B | 11.07 | 16.60 | D | 13.18 | 14.26 |
| C | 9.06 | 12.31 | E | 15.94 ** | 18.32 * |
| E | 8.40 | 11.71 | Austria | A | 66.51 *** | 75.94 *** |
| France | A | 7.51 | 8.75 | B | 19.83 ** | 22.45 ** |
| B | 8.48 | 11.03 | C | 15.62 * | 18.23 * |
| C | 11.71 | 16.10 | The Netherlands | A | 5.71 | 10.43 |
| Germany | A | 4.62 | 8.19 | B | 9.75 | 16.97 |
| B | 15.98 ** | 20.24 ** | - | - | - | - |
The results from Granger causality tests do not allow deriving a unique conclusion. For instance, Ireland does not exhibit Granger causality between the two markets in any stage of financial distress. CDS spreads changes do not Granger cause stock index returns in Finland and France. In addition, this relation is very weak in Austria and Germany. Contrary to what was expected, Granger causality tests also reveal that the magnitude of the effects of the stock market on the CDS market declined with the level of financial distress in Portugal, Italy, France, Germany, Finland, Belgium, Austria, and The Netherlands.
A different and commonly used approach for testing the relationship between the two markets consists in the analysis of cointegration. The presence of a cointegration relation between two or more variables means that there is a stable long-term equilibrium relationship among them. According to the Granger Representation Theorem, it also means that there is an error correction mechanism that forces an alignment between the variables in the long term.
In theory, the relation between the two variables should not be linear at all: during sovereign financial distress periods, the correlation between the markets should be higher than in stable periods. Consequently, a linear cointegration analysis is not feasible. In spite of that, a stable long-term relationship between the markets may occur at shorter time spans, in particular during time frames where sovereigns present a distress financial situation. To put it another way, I expect the presence of a strong cointegration relationship when countries exhibit a financial distress situation and a weak relationship when the sovereign displays a sustainable financial situation.
Johansen cointegration test is widely used for testing the hypothesis of cointegration on systems of equation. I compute this test for each country and controlling for the country credit quality (determined by the implied sovereign rating). The empirical evidence points toward the rejection of a cointegration relationship in Italy, France, Finland, and The Netherlands (Max Eigen statistics and Trace statistics do not reject the null hypothesis, which implies that the series are not cointegrated in any of the analyzed bins)—
Table 5. At the other extreme, Johansen cointegration test suggests a cointegration relationship in Austria, regardless of the bucket. Spain, Belgium, Portugal, and Ireland exhibit a cointegration relation only on the extreme buckets. Putting it another way, the dependency of the markets is higher at the extreme conjunctures and weaker at intermediate conjunctures. As for Germany, the dependency between markets became stronger after a downgrade in its implied credit rating. In sum, the evidence from Johansen cointegration test does not support the hypothesis that the dependency between CDS and stock markets enhances after sovereign credit risk deterioration. The majority of the countries faced higher dependency between the markets in the worst bucket in terms of financial distress, but also in the A bucket. In four of the analyzed countries, I do not find evidence of a long-term equilibrium relationship at any bucket. Thus, the results of Merton’s and Chan-Lau and Kim’s models are not confirmed by the data, since the dependency of the markets does not seem to rise (at least monotonically) with downgrades of the implied sovereign rating and credit quality deterioration.
Given the non-linear relationship between CDS spreads and stock index prices, I use a second methodology to gauge the interaction between the markets. In order to implement that model, I convert the before mentioned error-correction model into a state space form representation—see Equation (3) and estimate the adjustment coefficients recursively (factor loadings) using the Kalman filter.
The first two equations (measurement equations) describe how well the observable variables are produced by the state variables, while the last two (state equations) describe the law of motion of the speed adjustment coefficients towards equilibrium. The factor loadings are estimated recursively according to the model. Kalman filter works recursively, each iteration consists of a prediction step and an update step. This formulation seeks to identify structural breaks in the adjustment coefficients and to infer about the likelihood of those structural breaks being partially caused by the rising (falling) sovereign credit risk. I use weekly data in the analysis as a way to reduce the number of auto-correlation parameters in the equations and the computation burden in the estimation.
Table 6 shows the estimated parameters and corresponding t-stats. The final estimates for the recursive adjustment coefficients (
λ1,t and
λ2,t) are also displayed. The first conclusion from this outcome highlights the fact that the final state of
λ1,t coefficient is negative for all the analyzed countries, even though it is only statistically significant for Belgium, France, Ireland, and Portugal at a significance level of 5%, and for Germany, Spain, Finland, and Greece at a significance level of 10%.
λ2,t is negative for Austria, Italy, and The Netherlands. In the remaining cases, it is positive in line with the theory (although not statistically significant).
Table 6.
Vector error-correction (VEC) state space representation with recursive estimation of the speed adjustment parameters–Estimation Results.
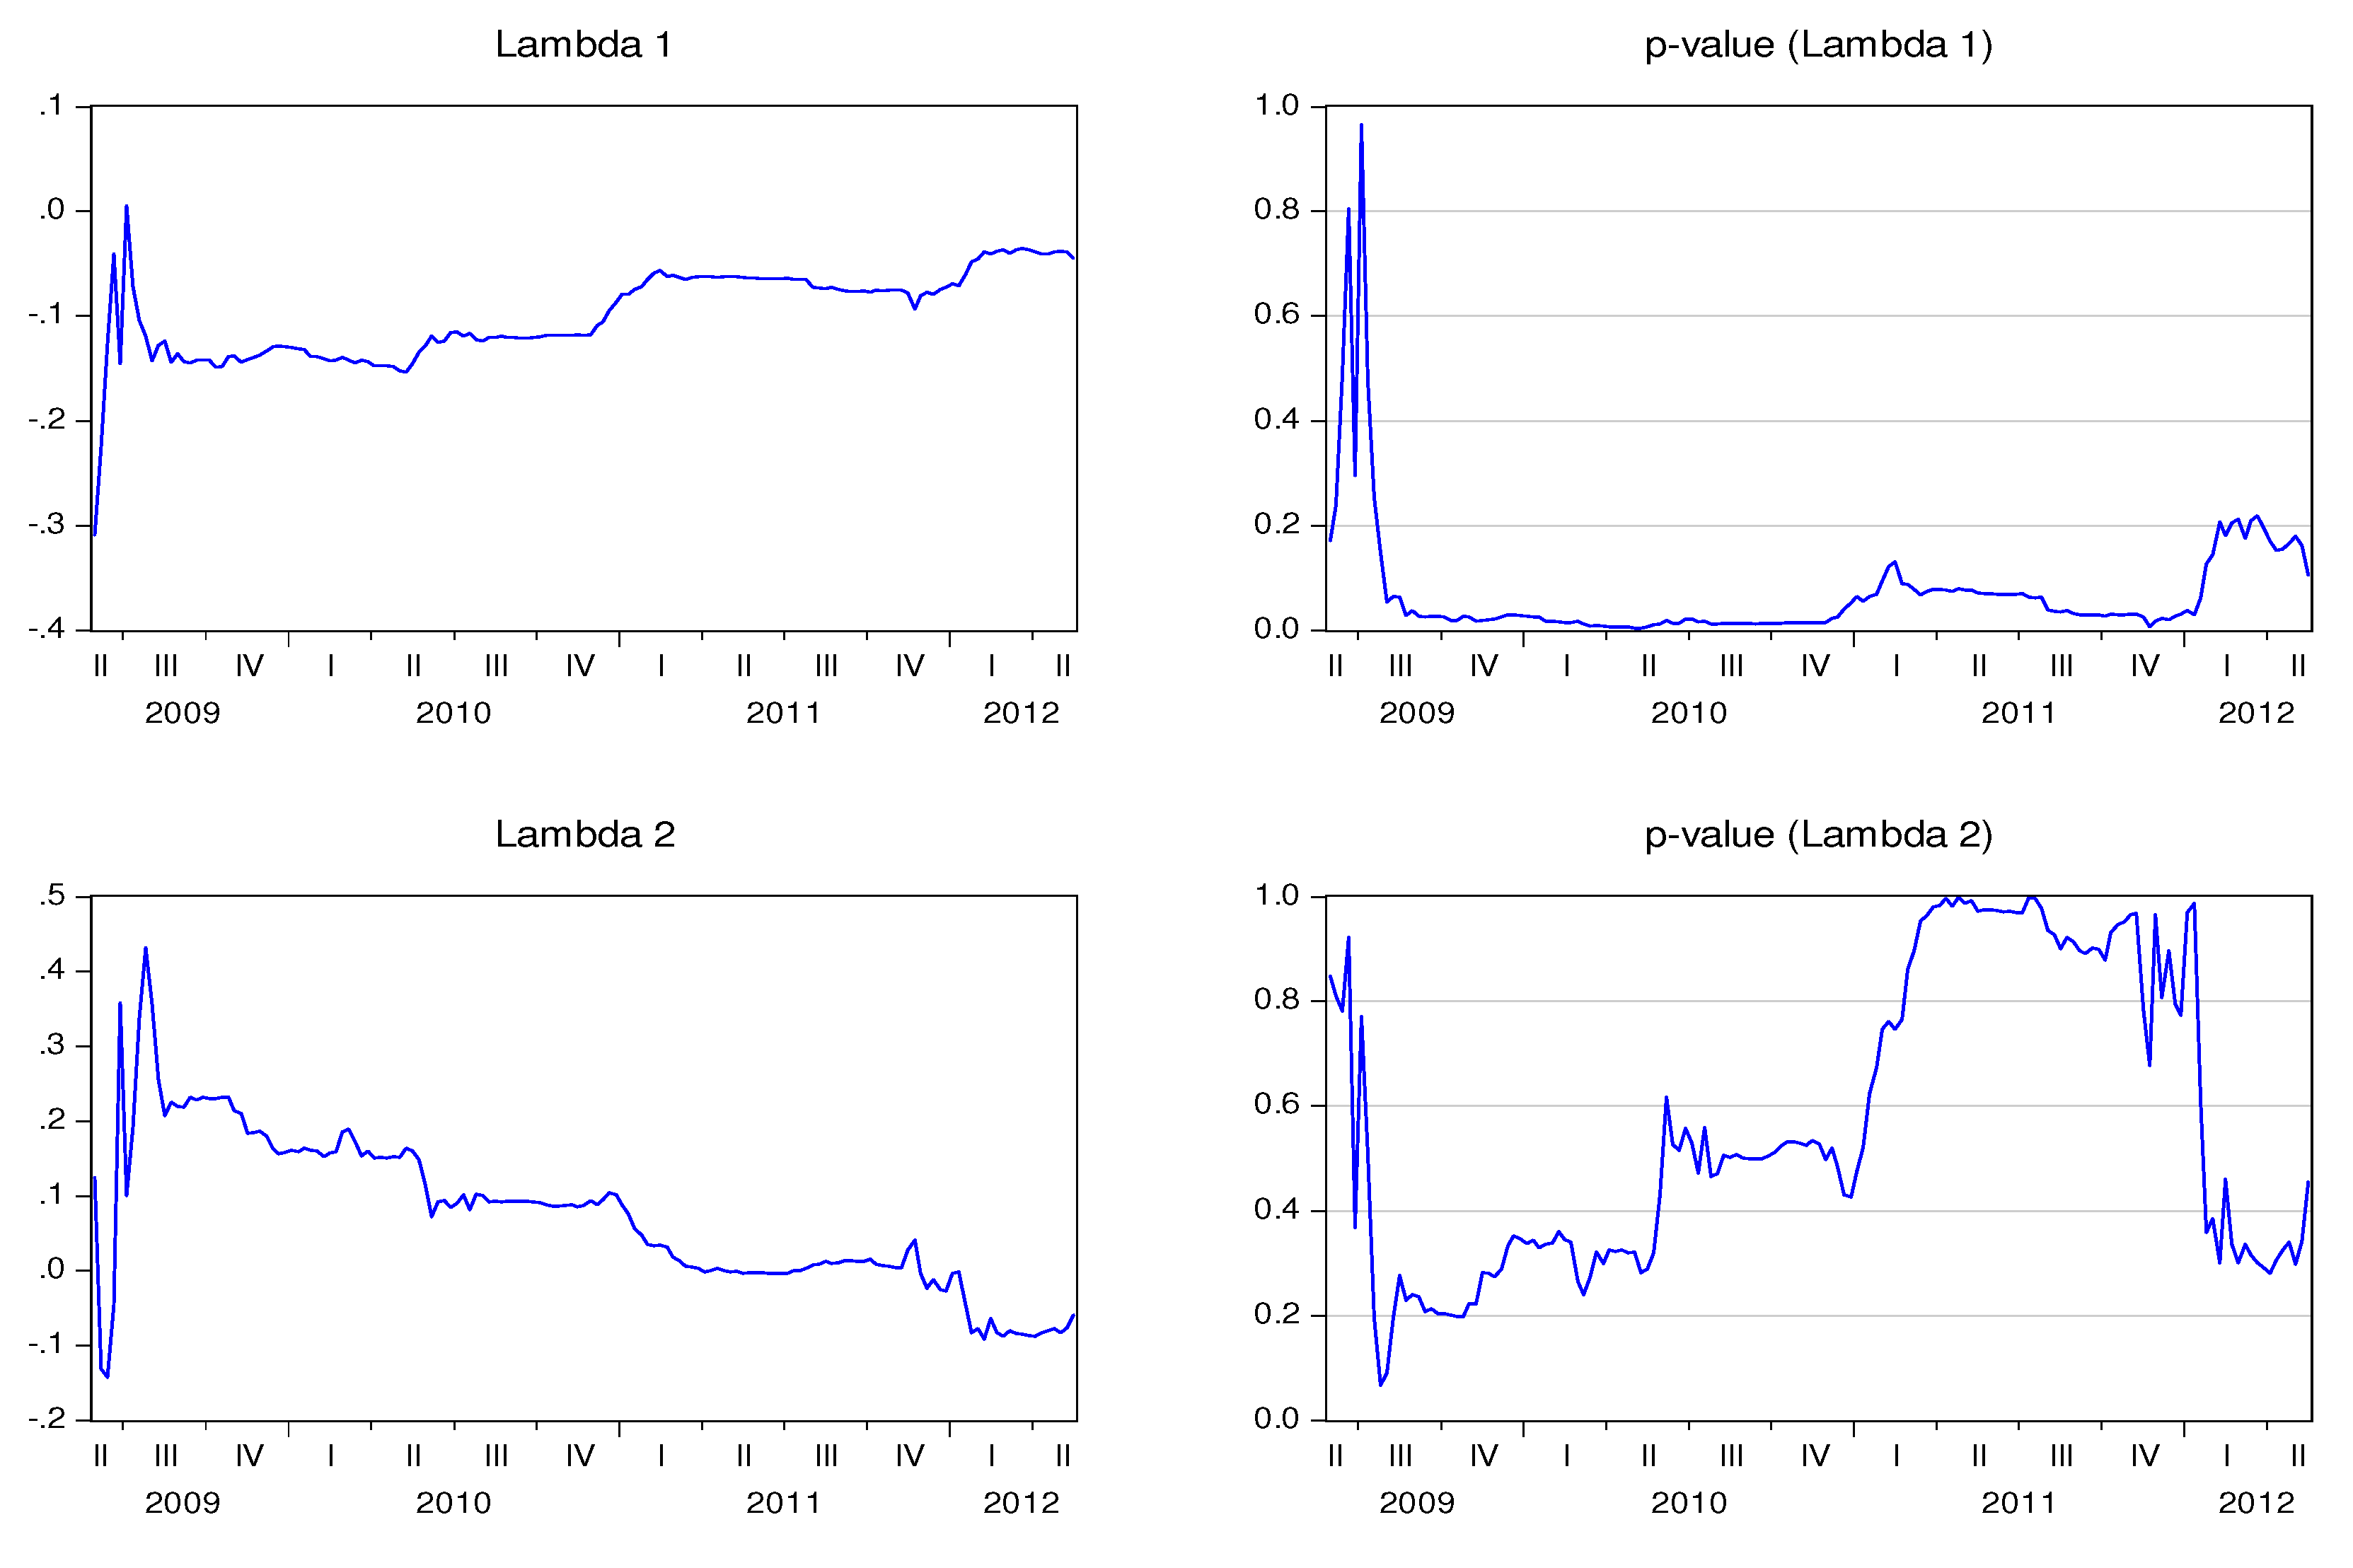
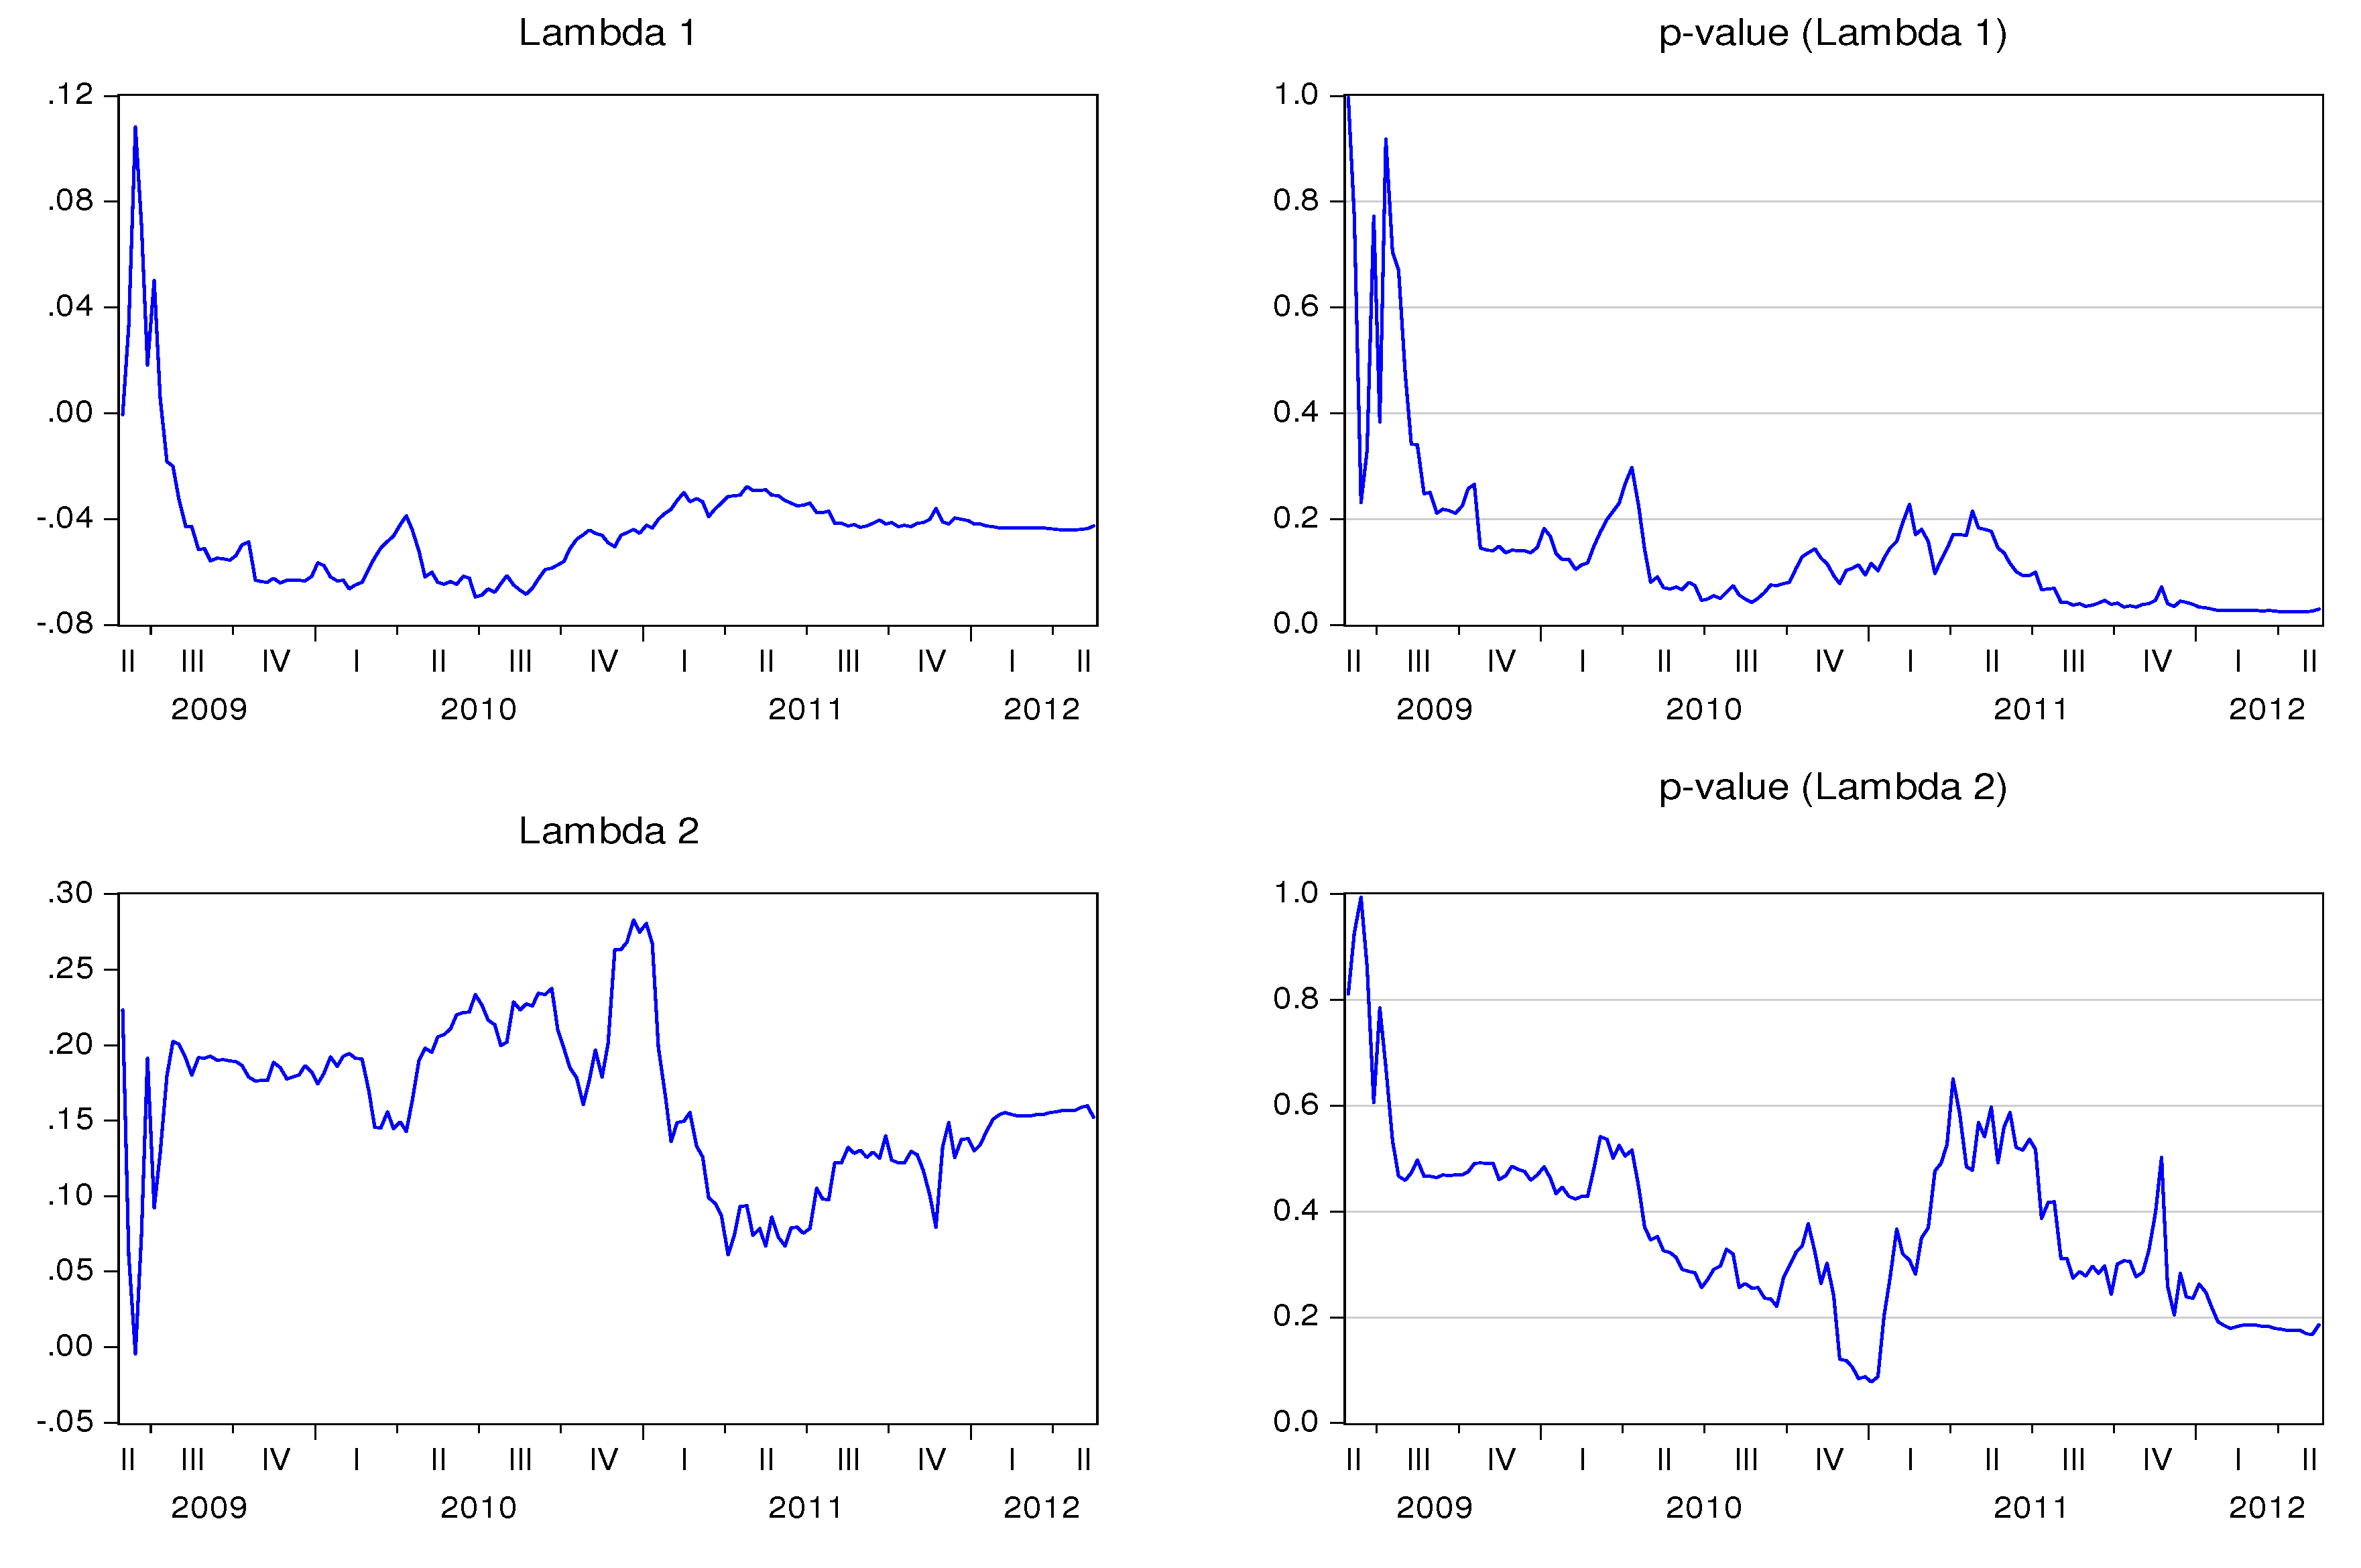
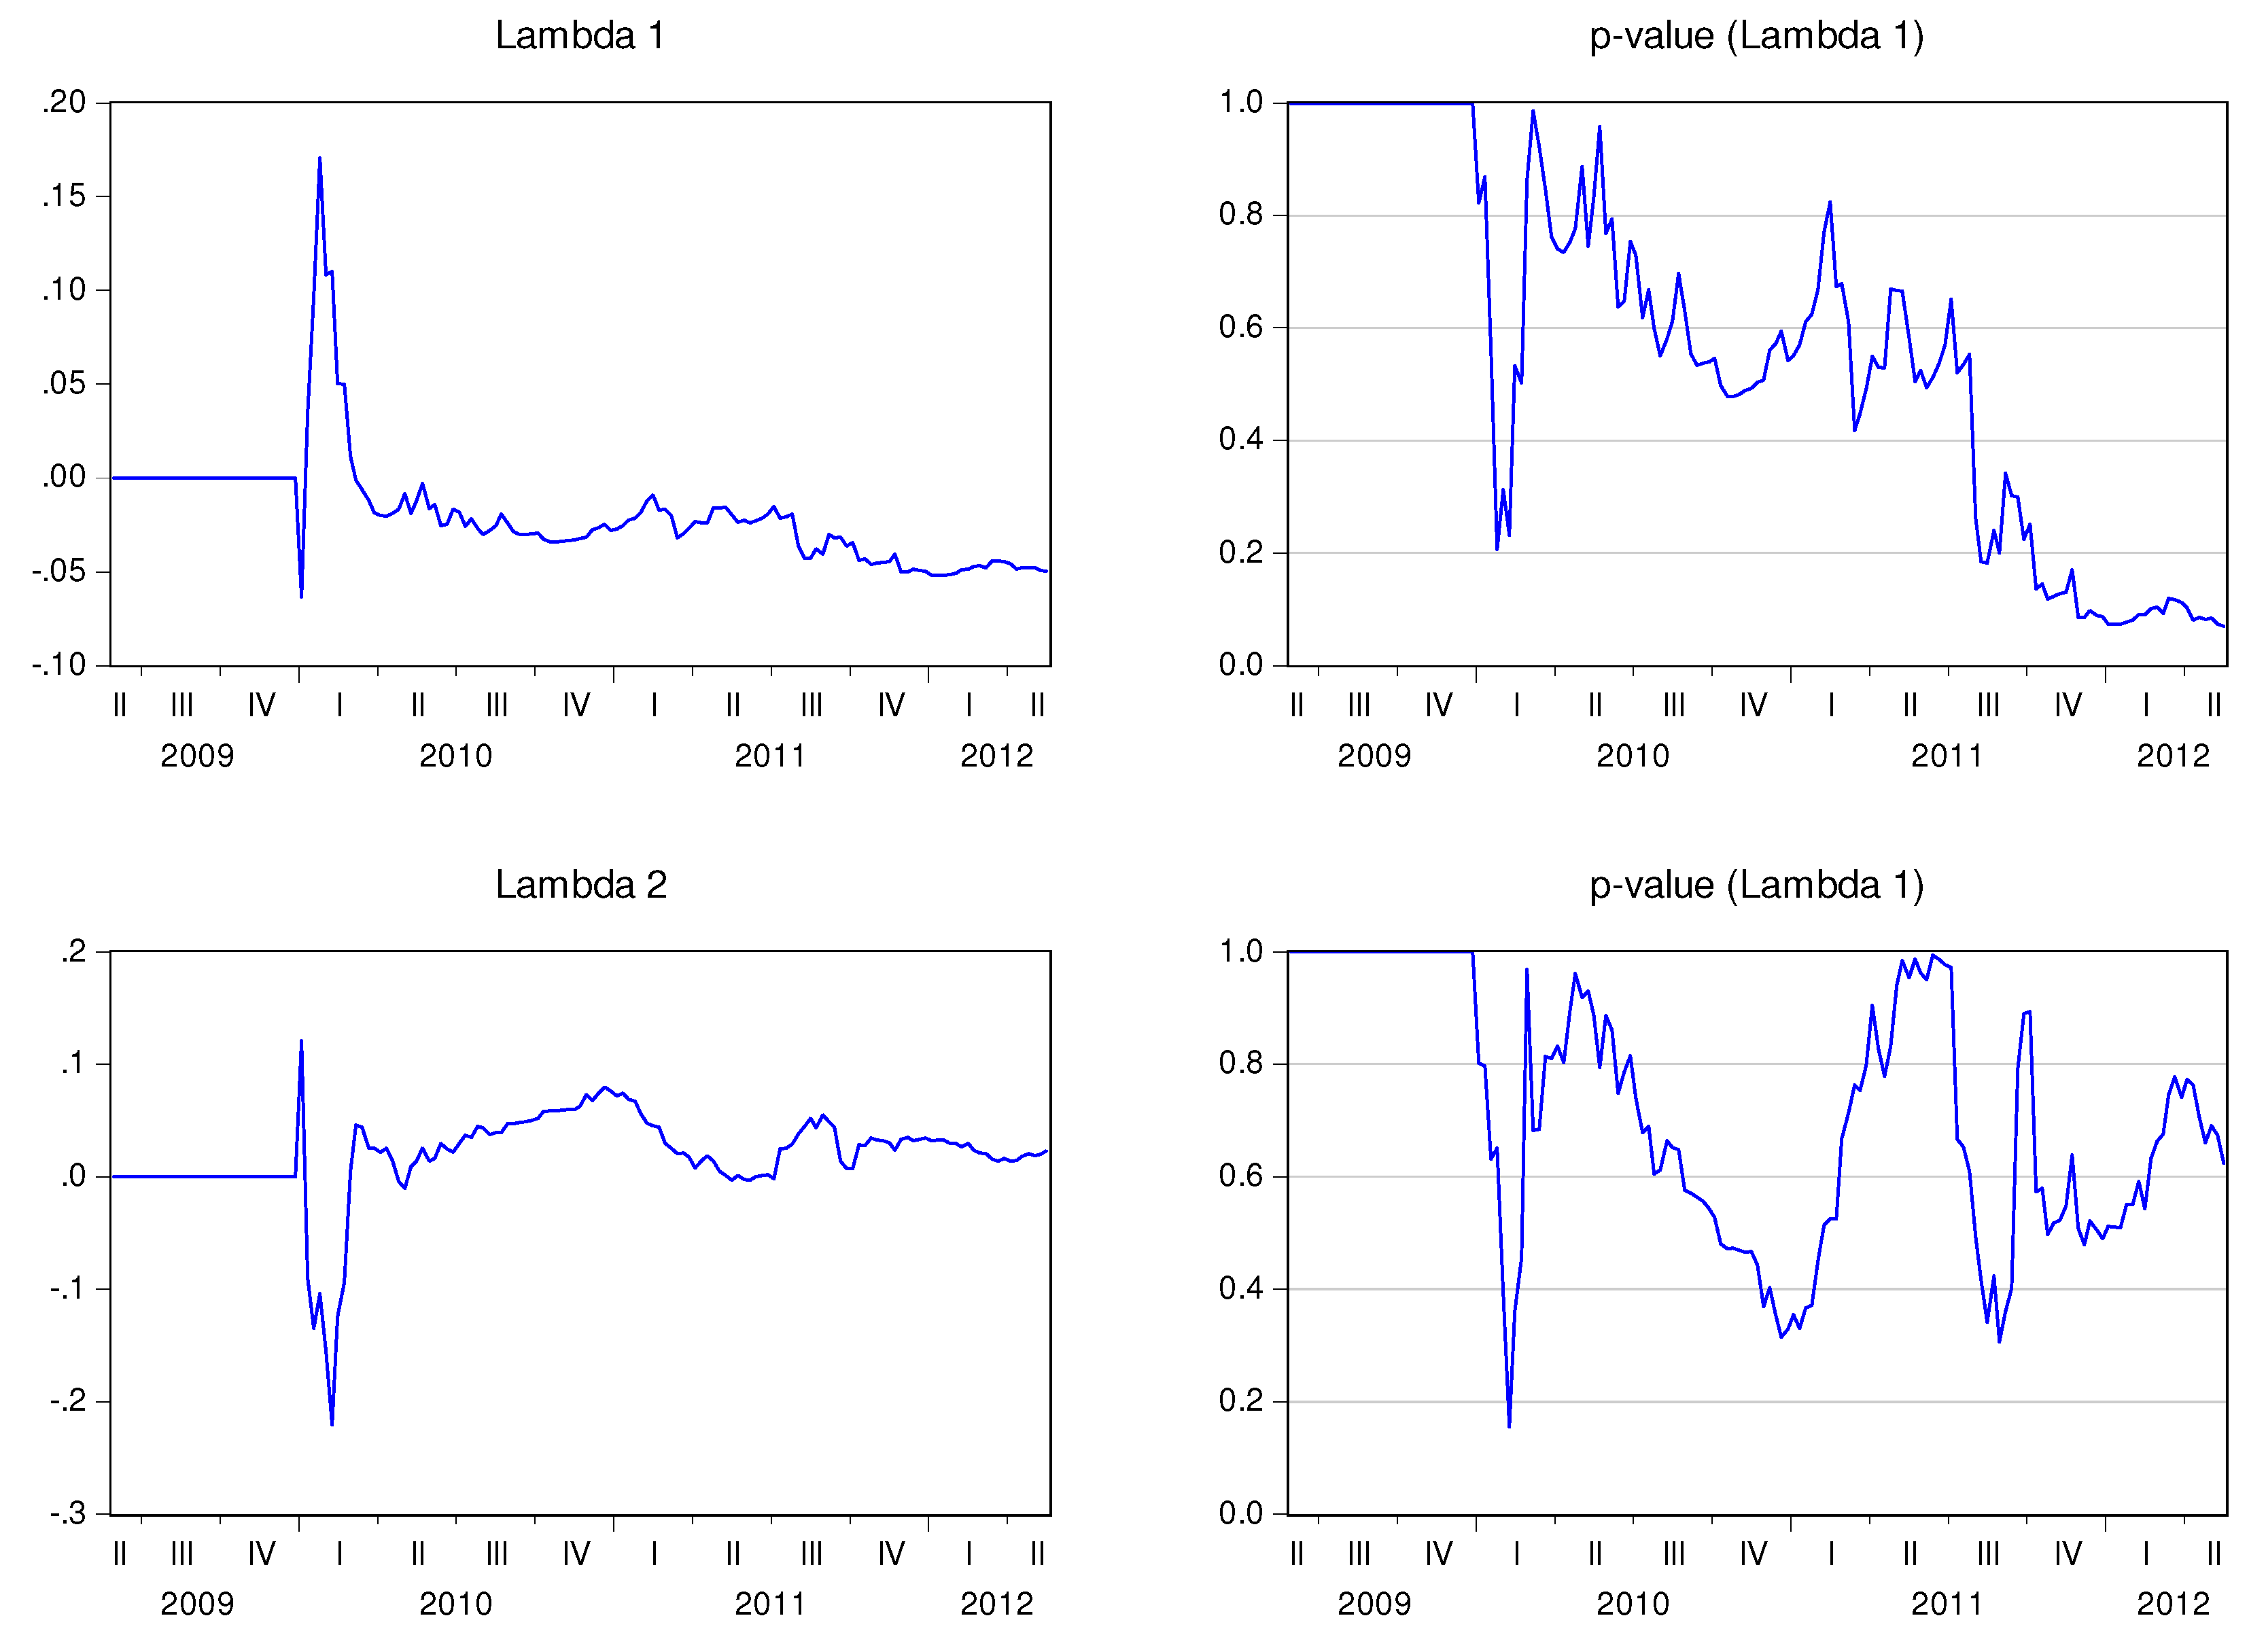
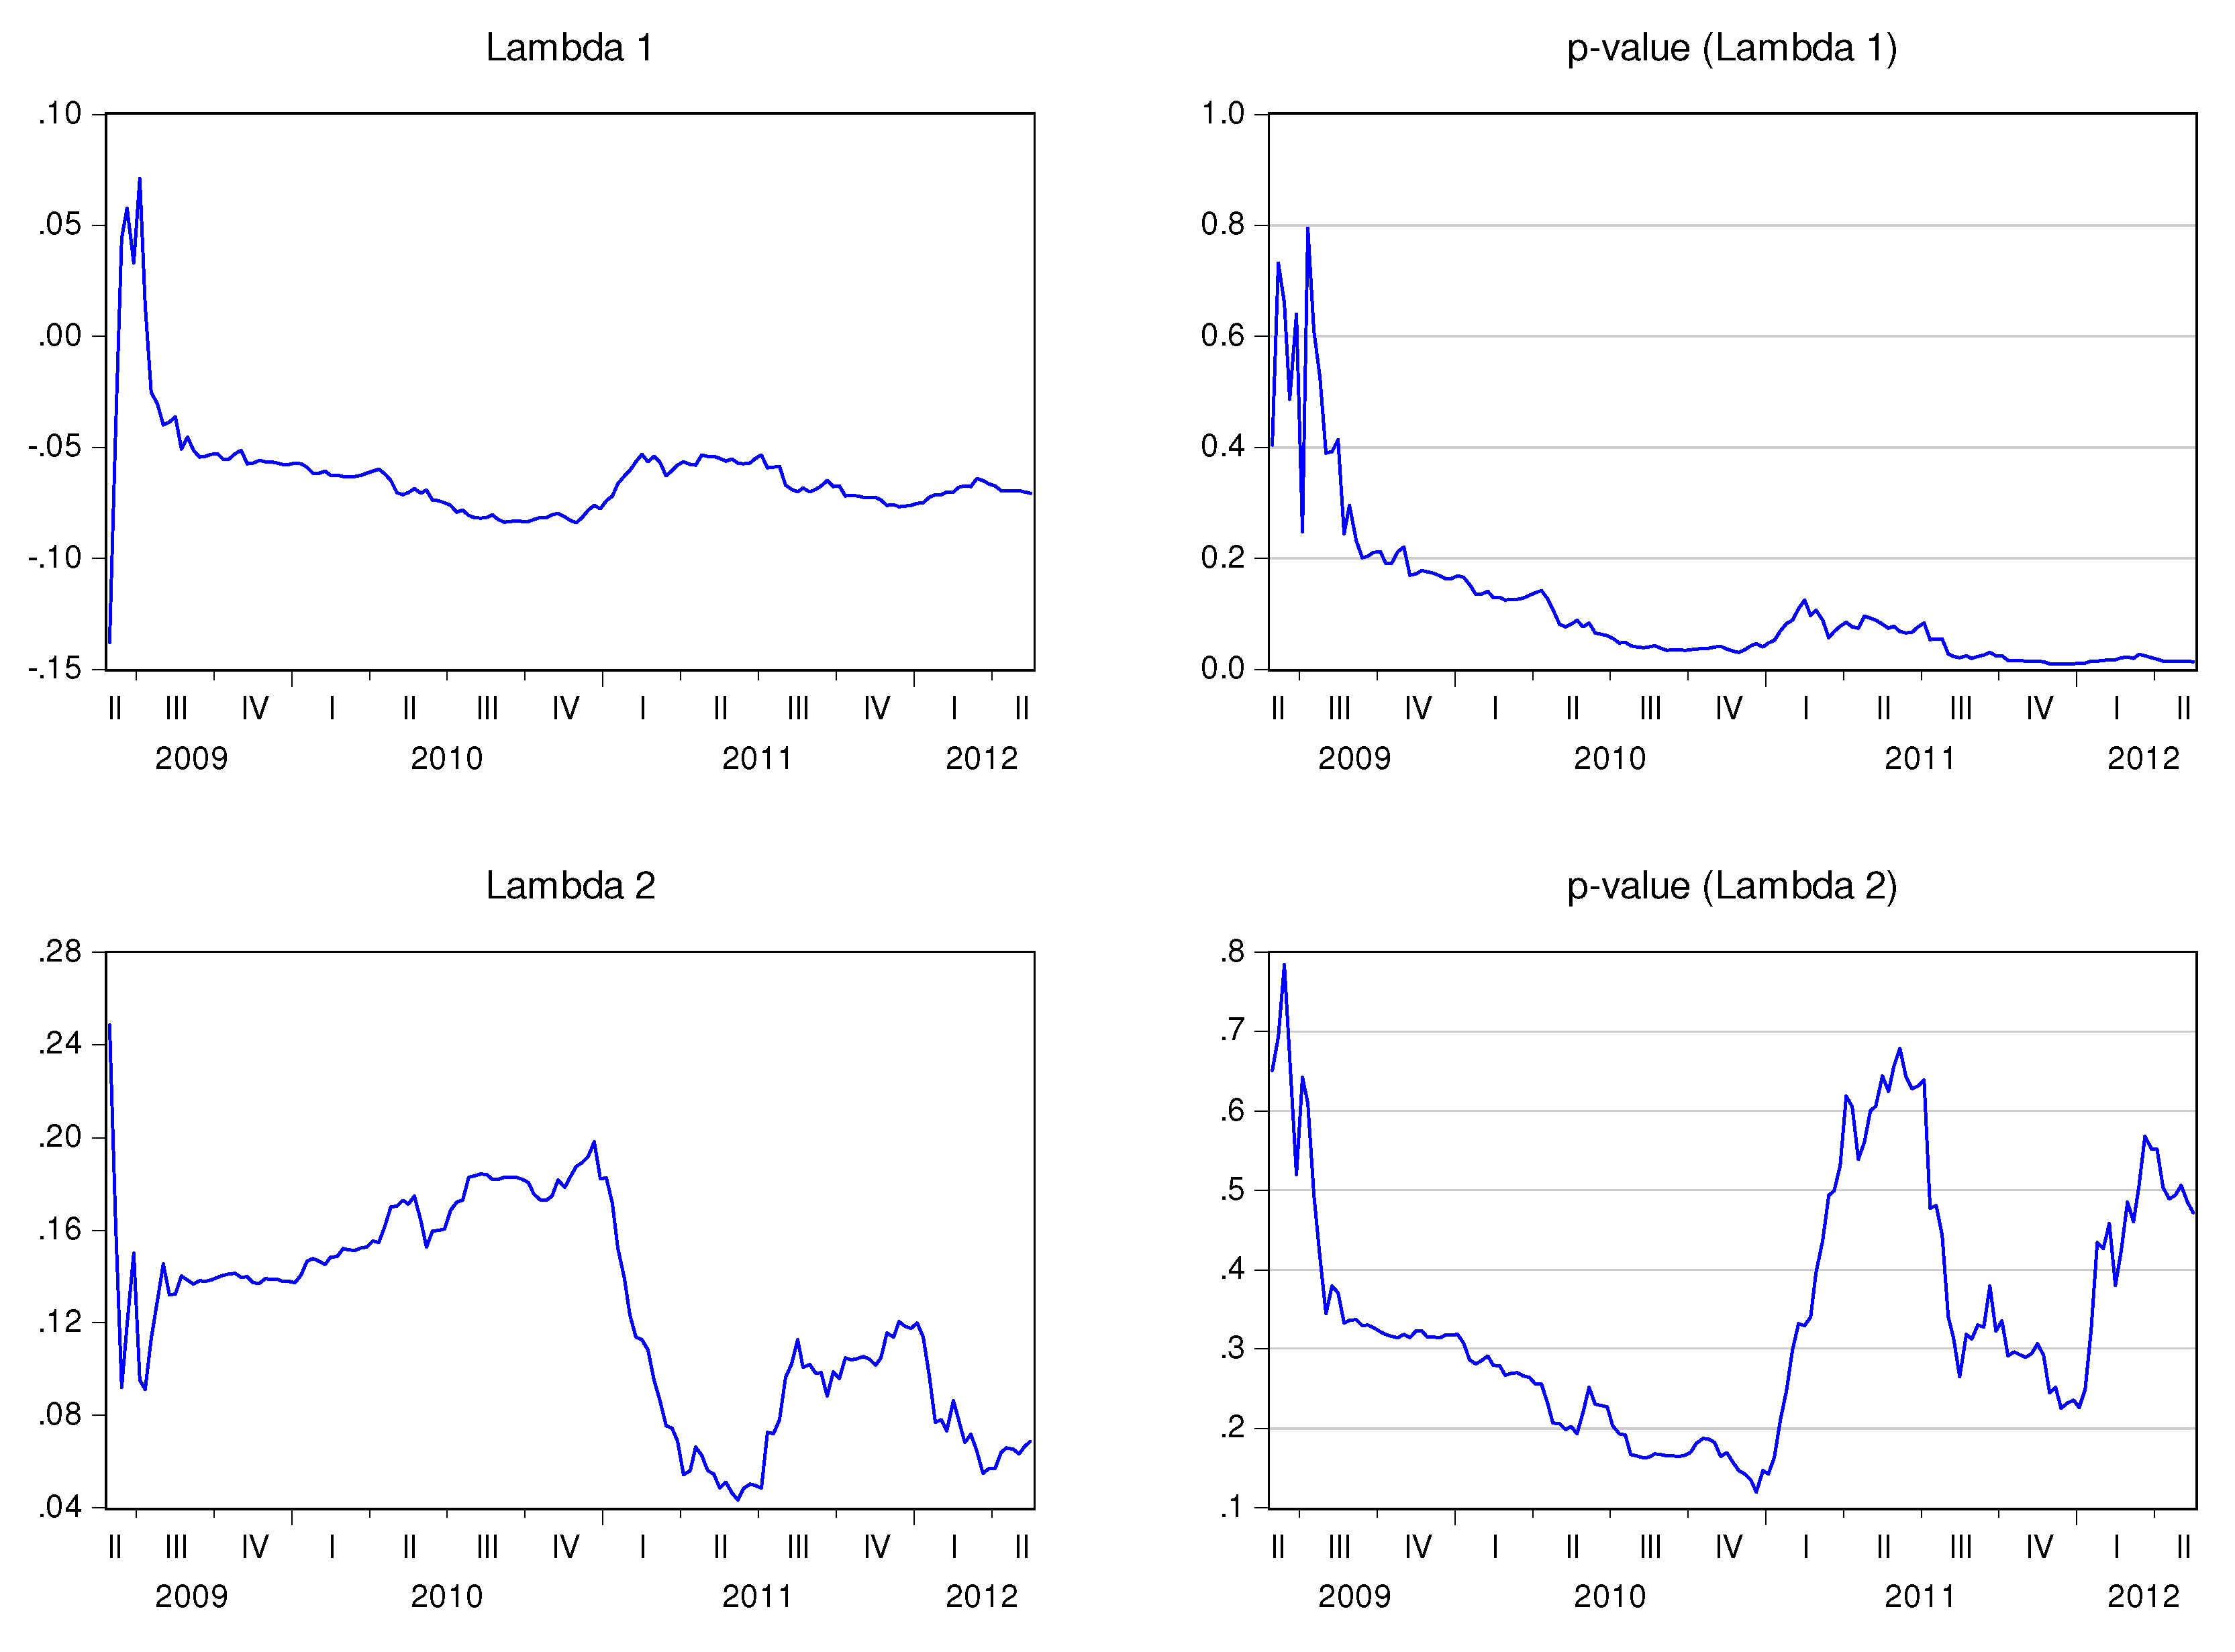
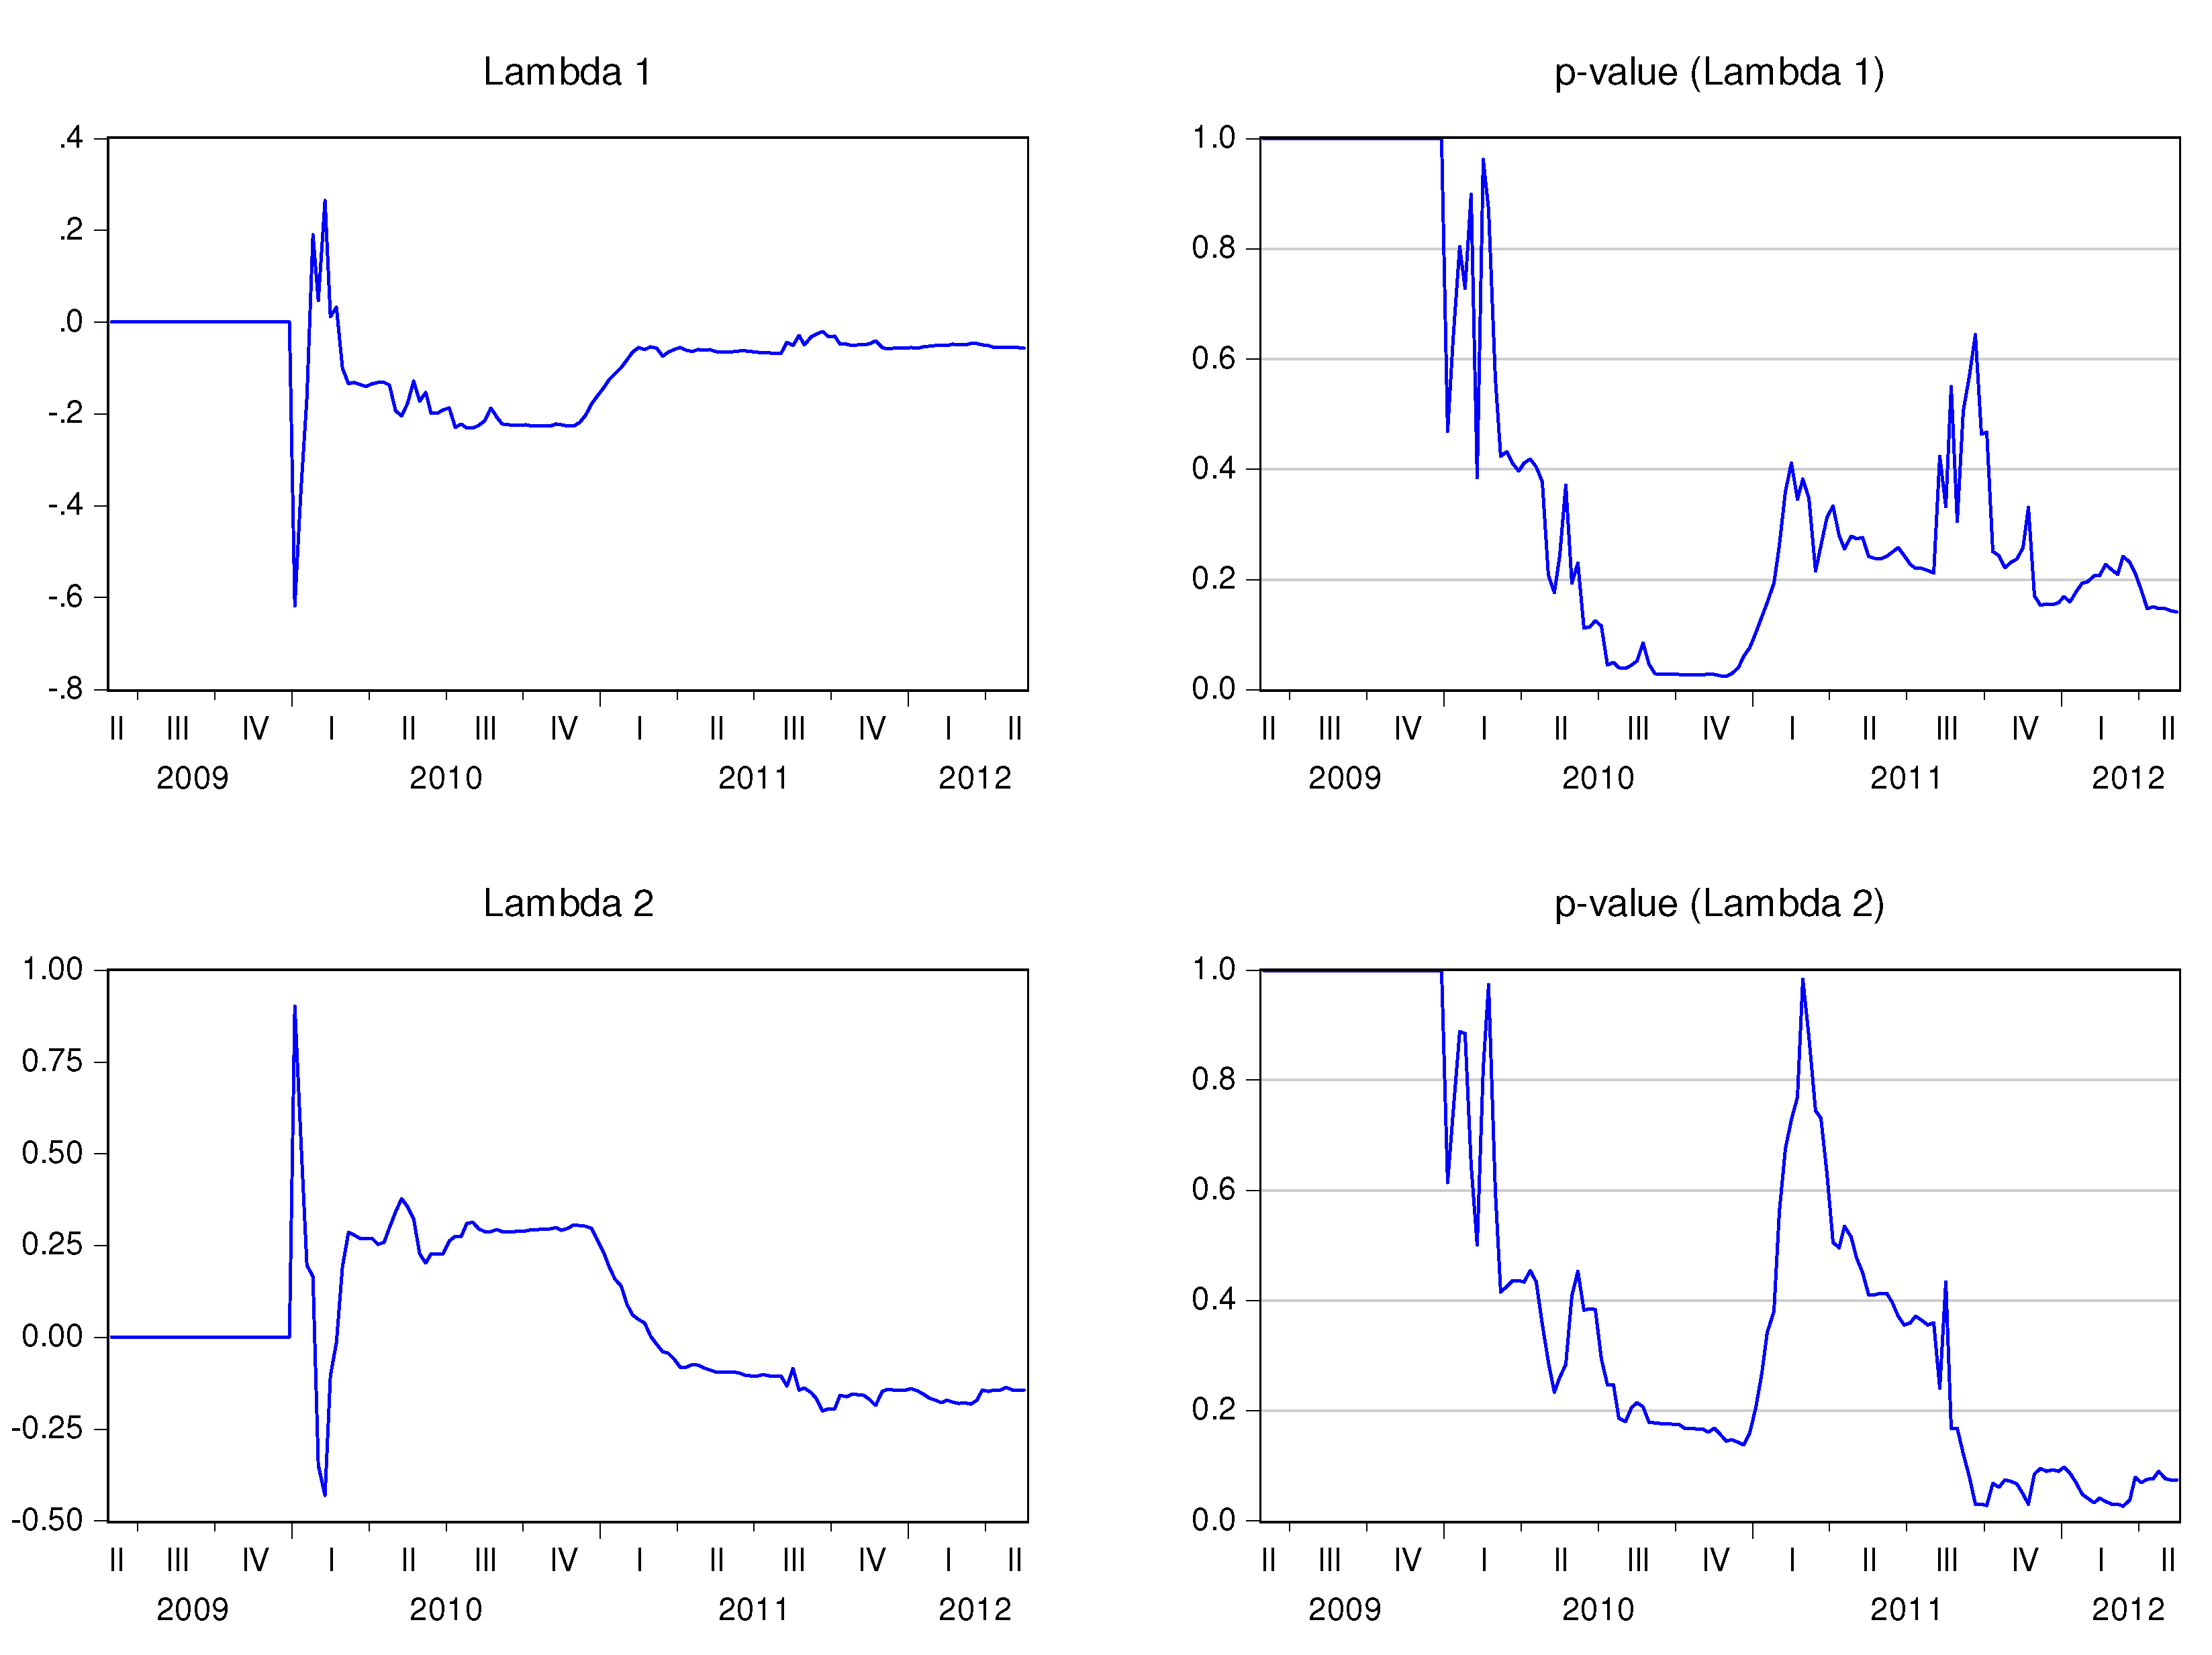
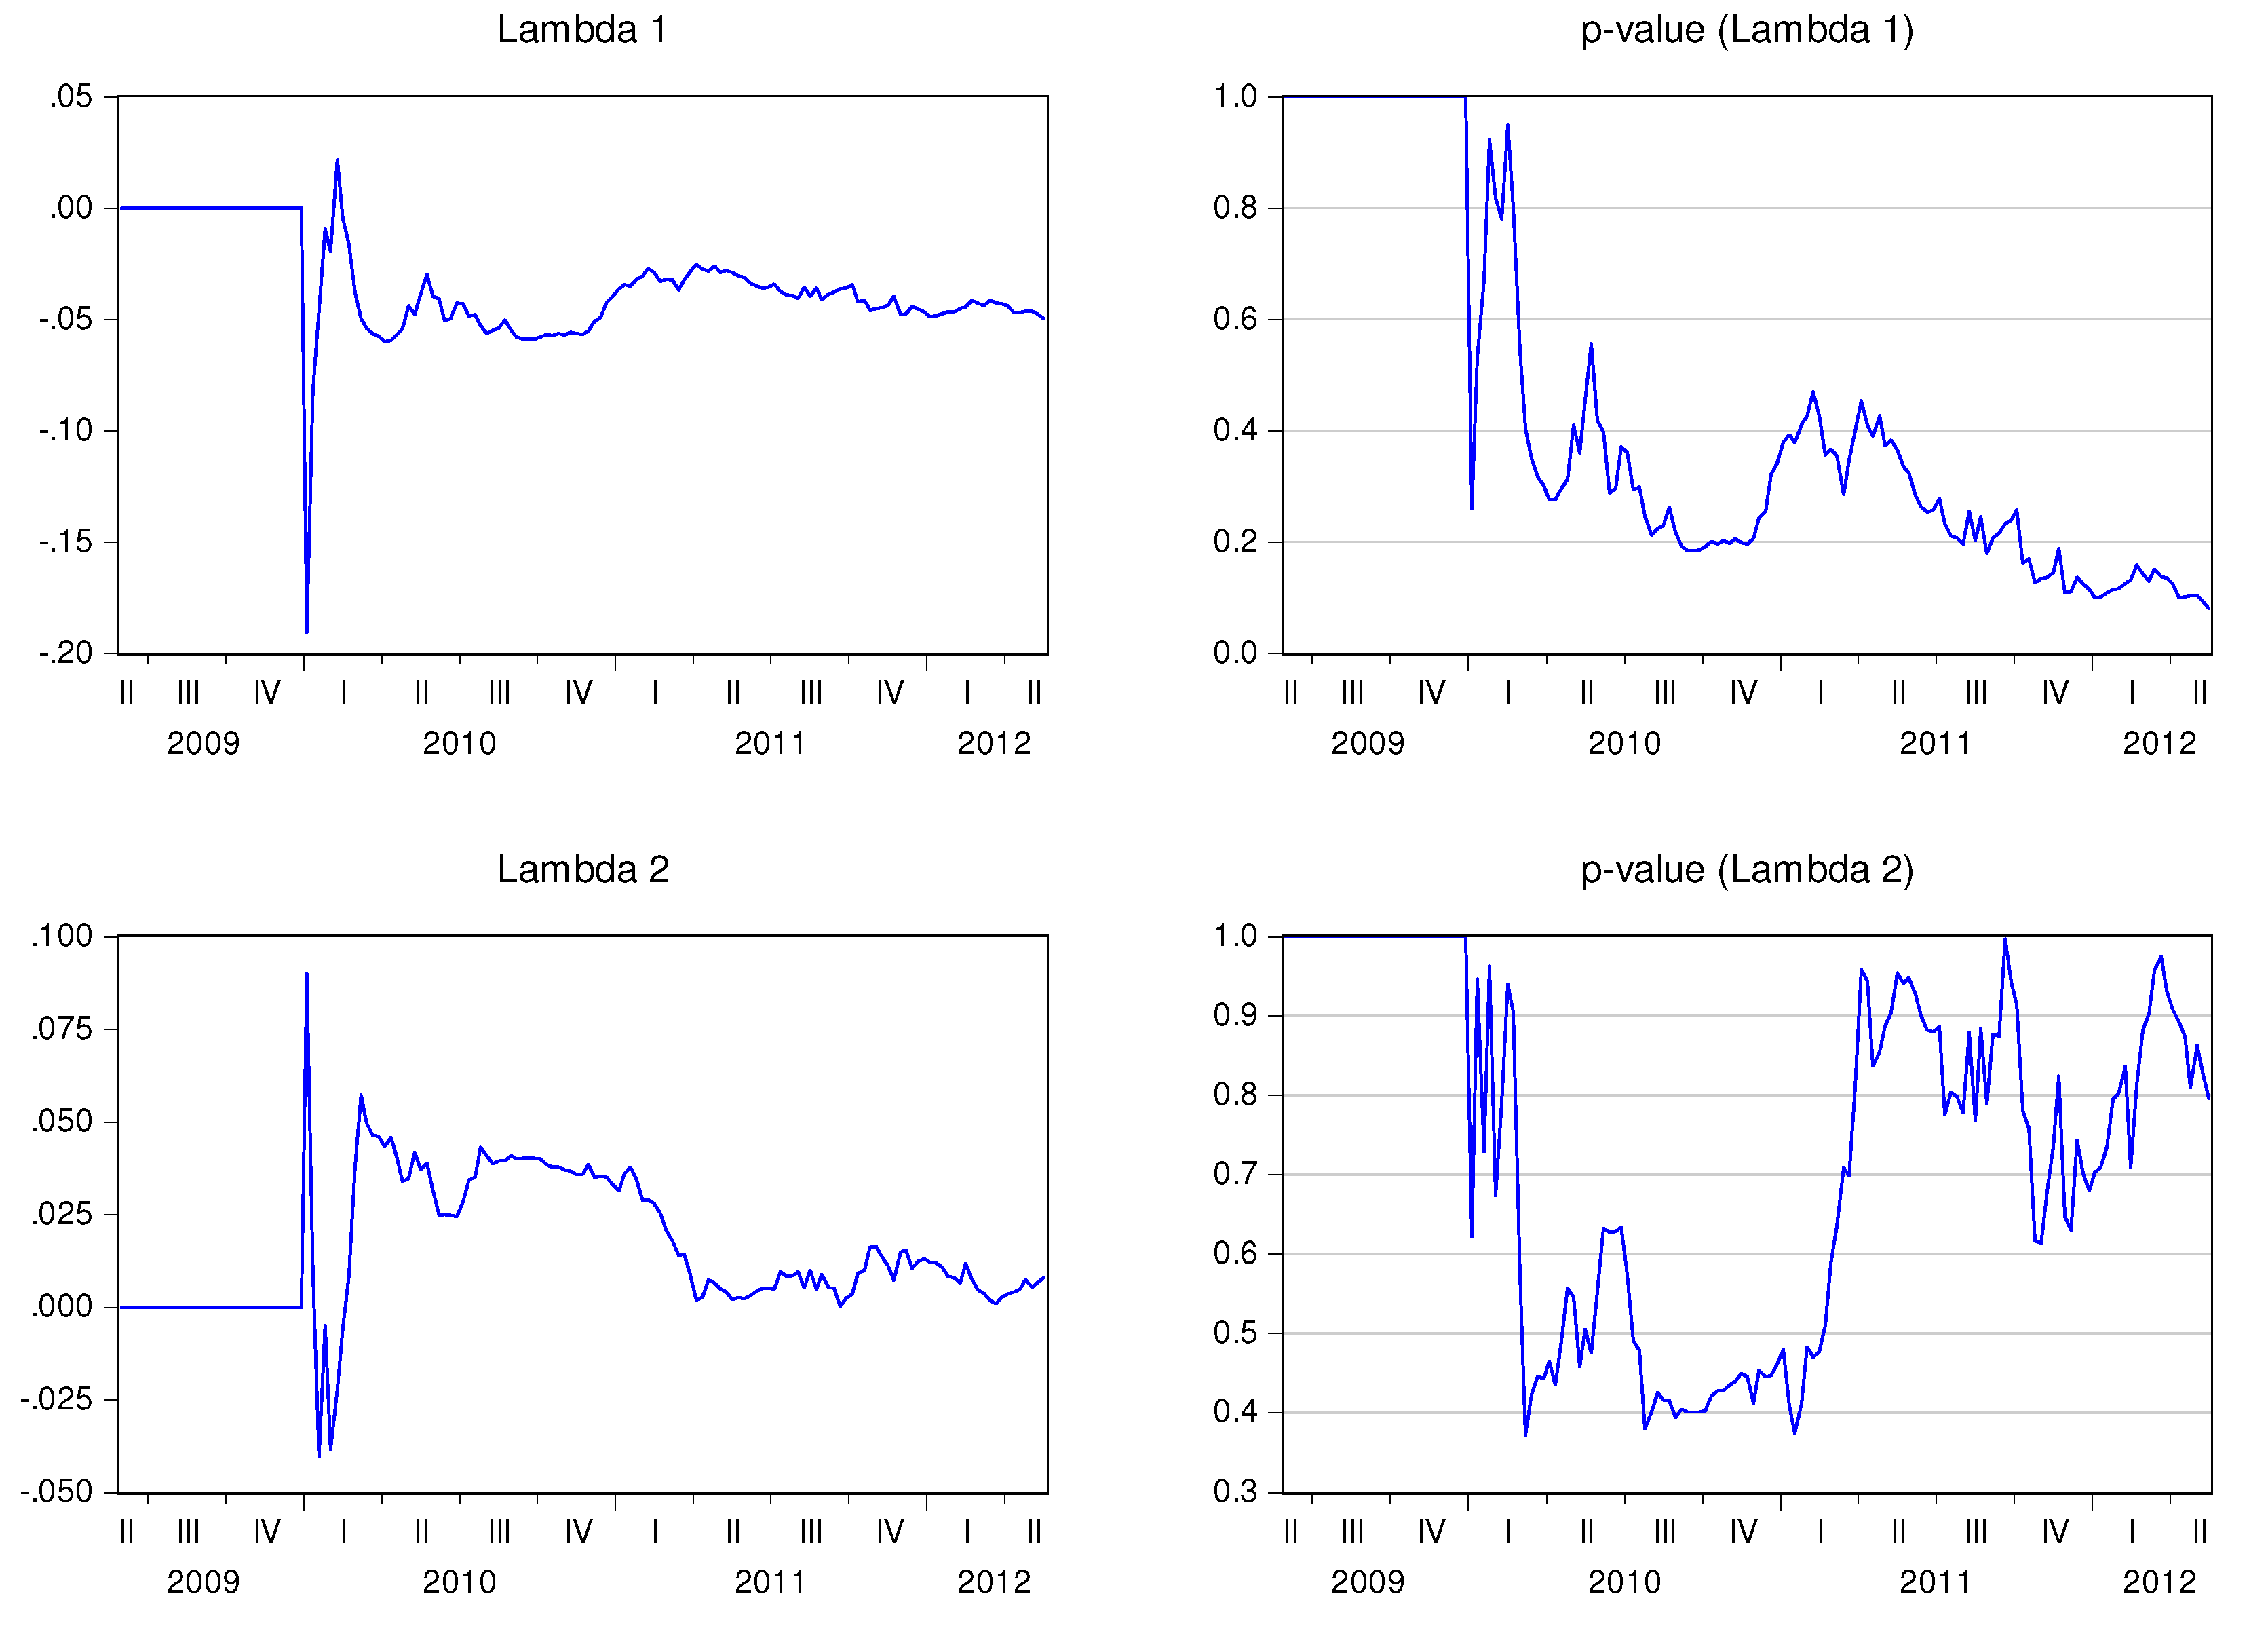
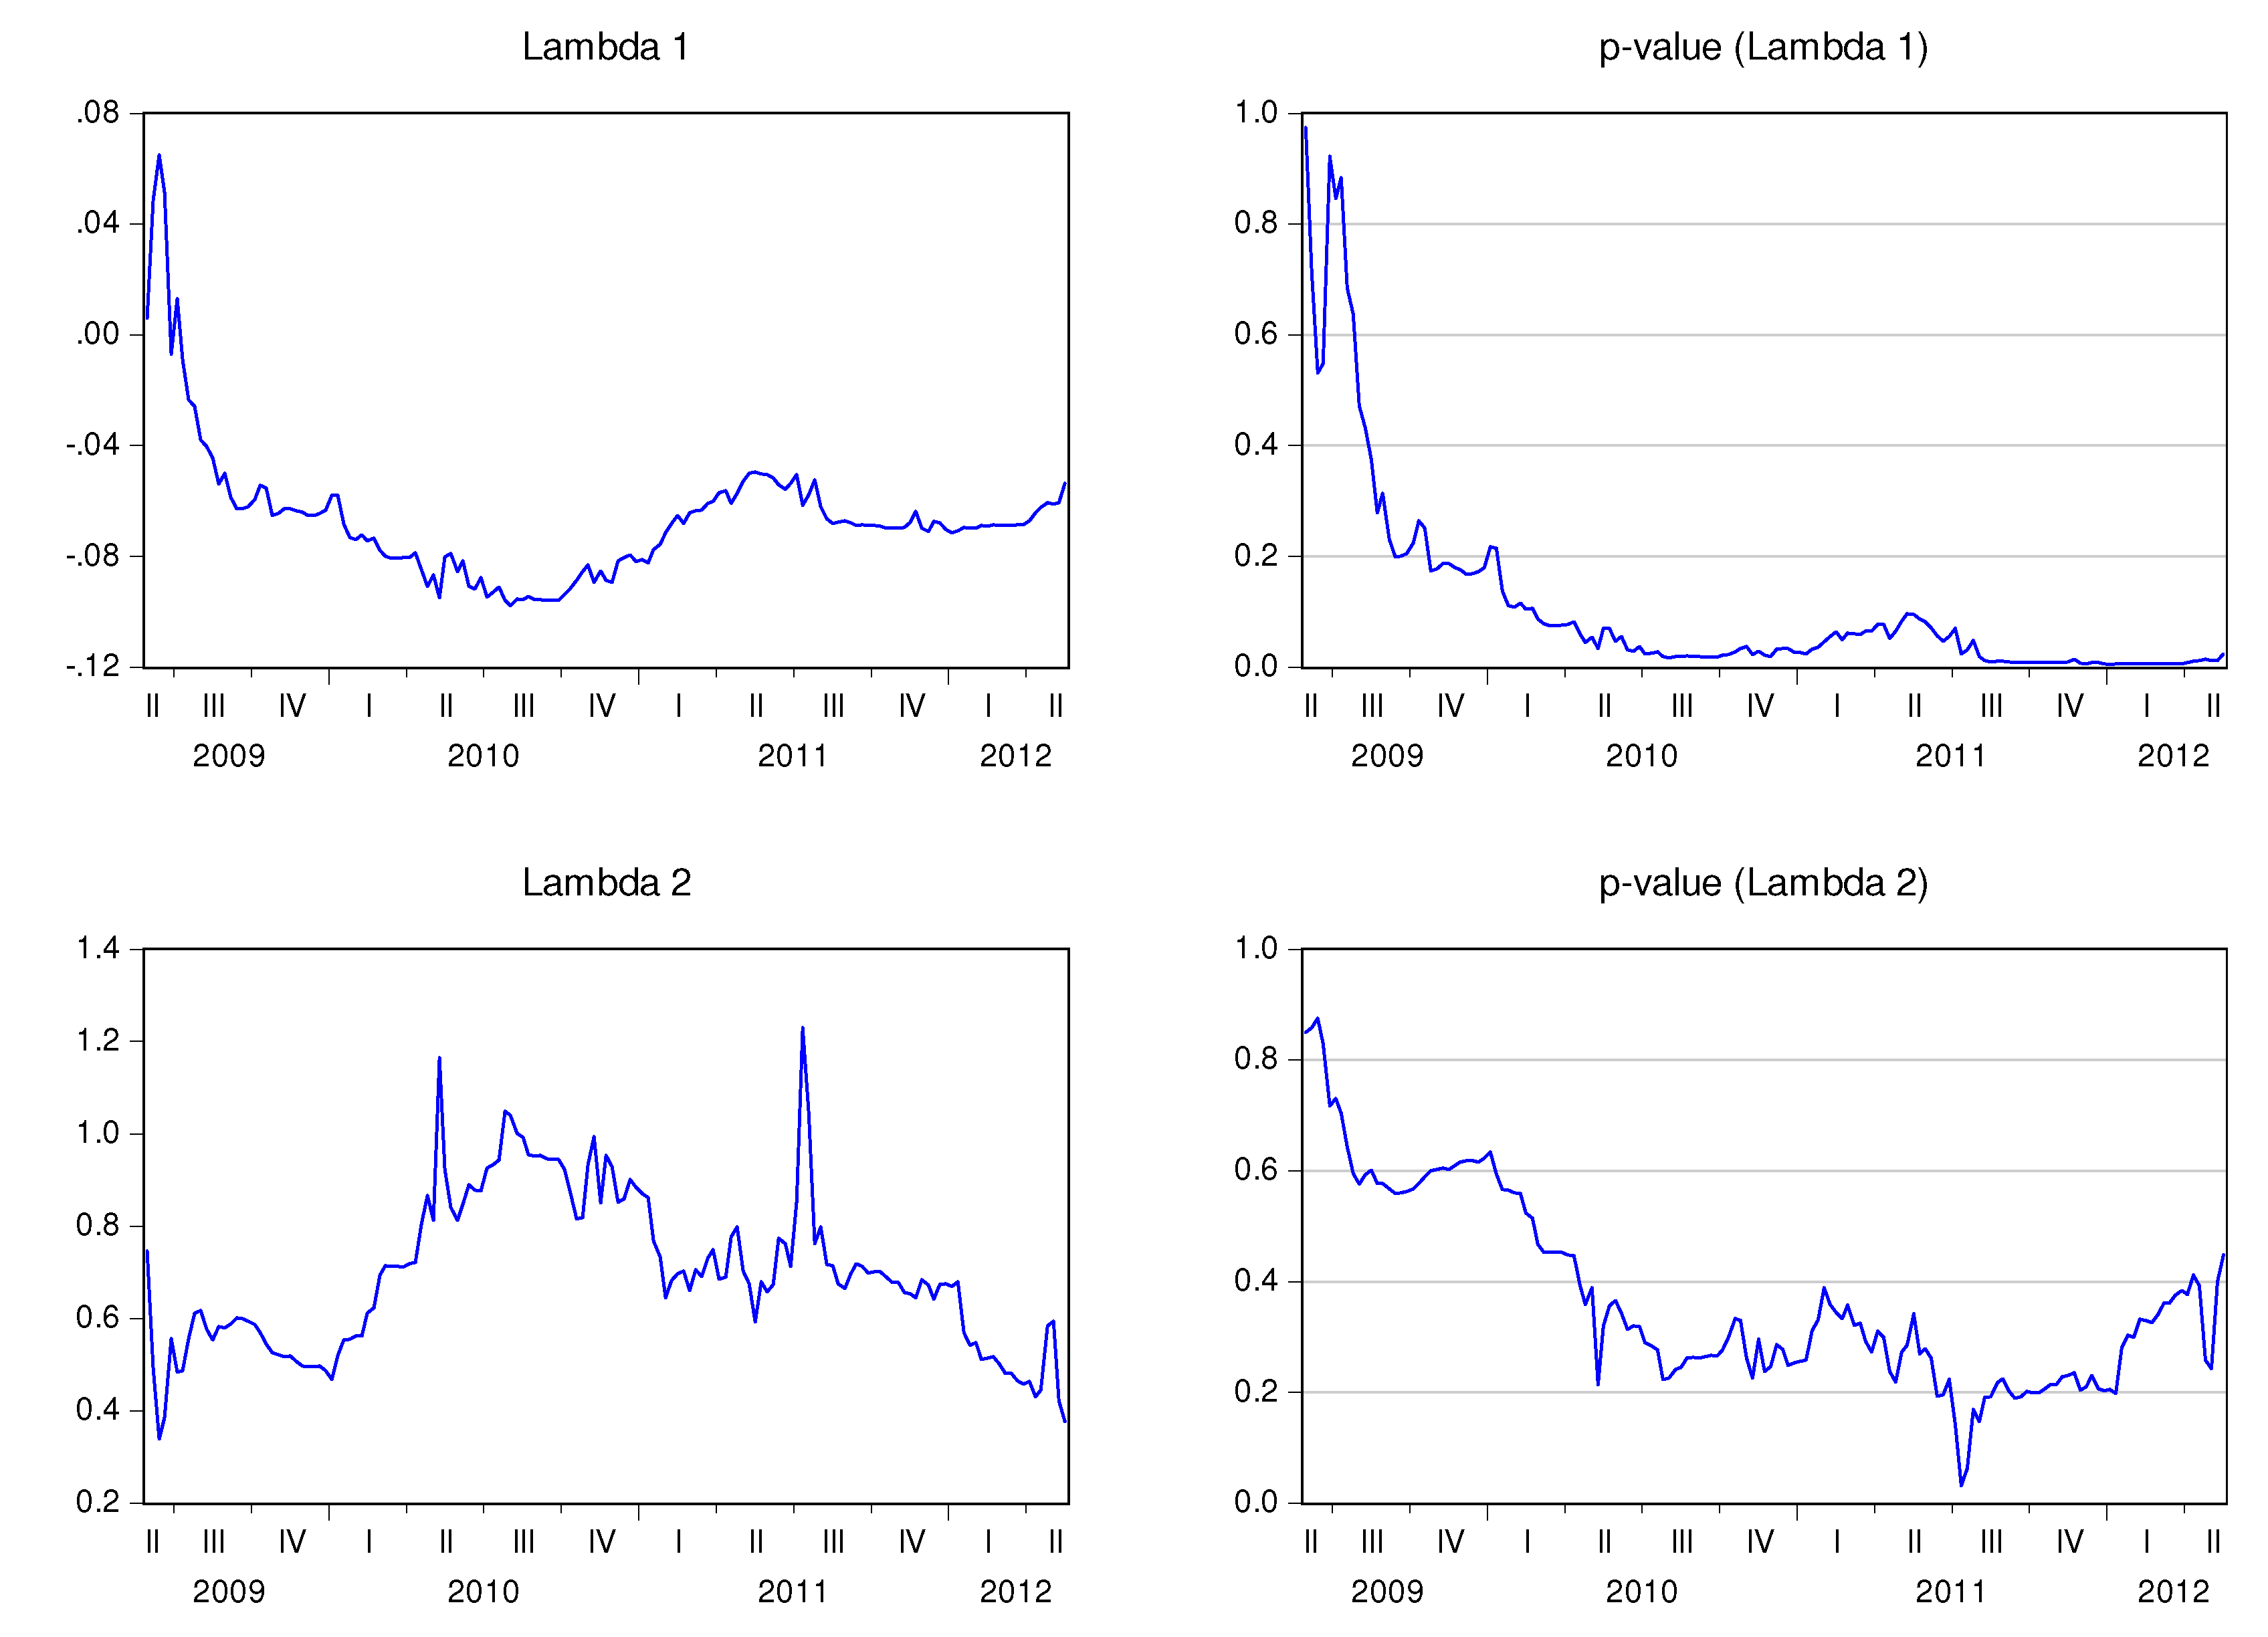
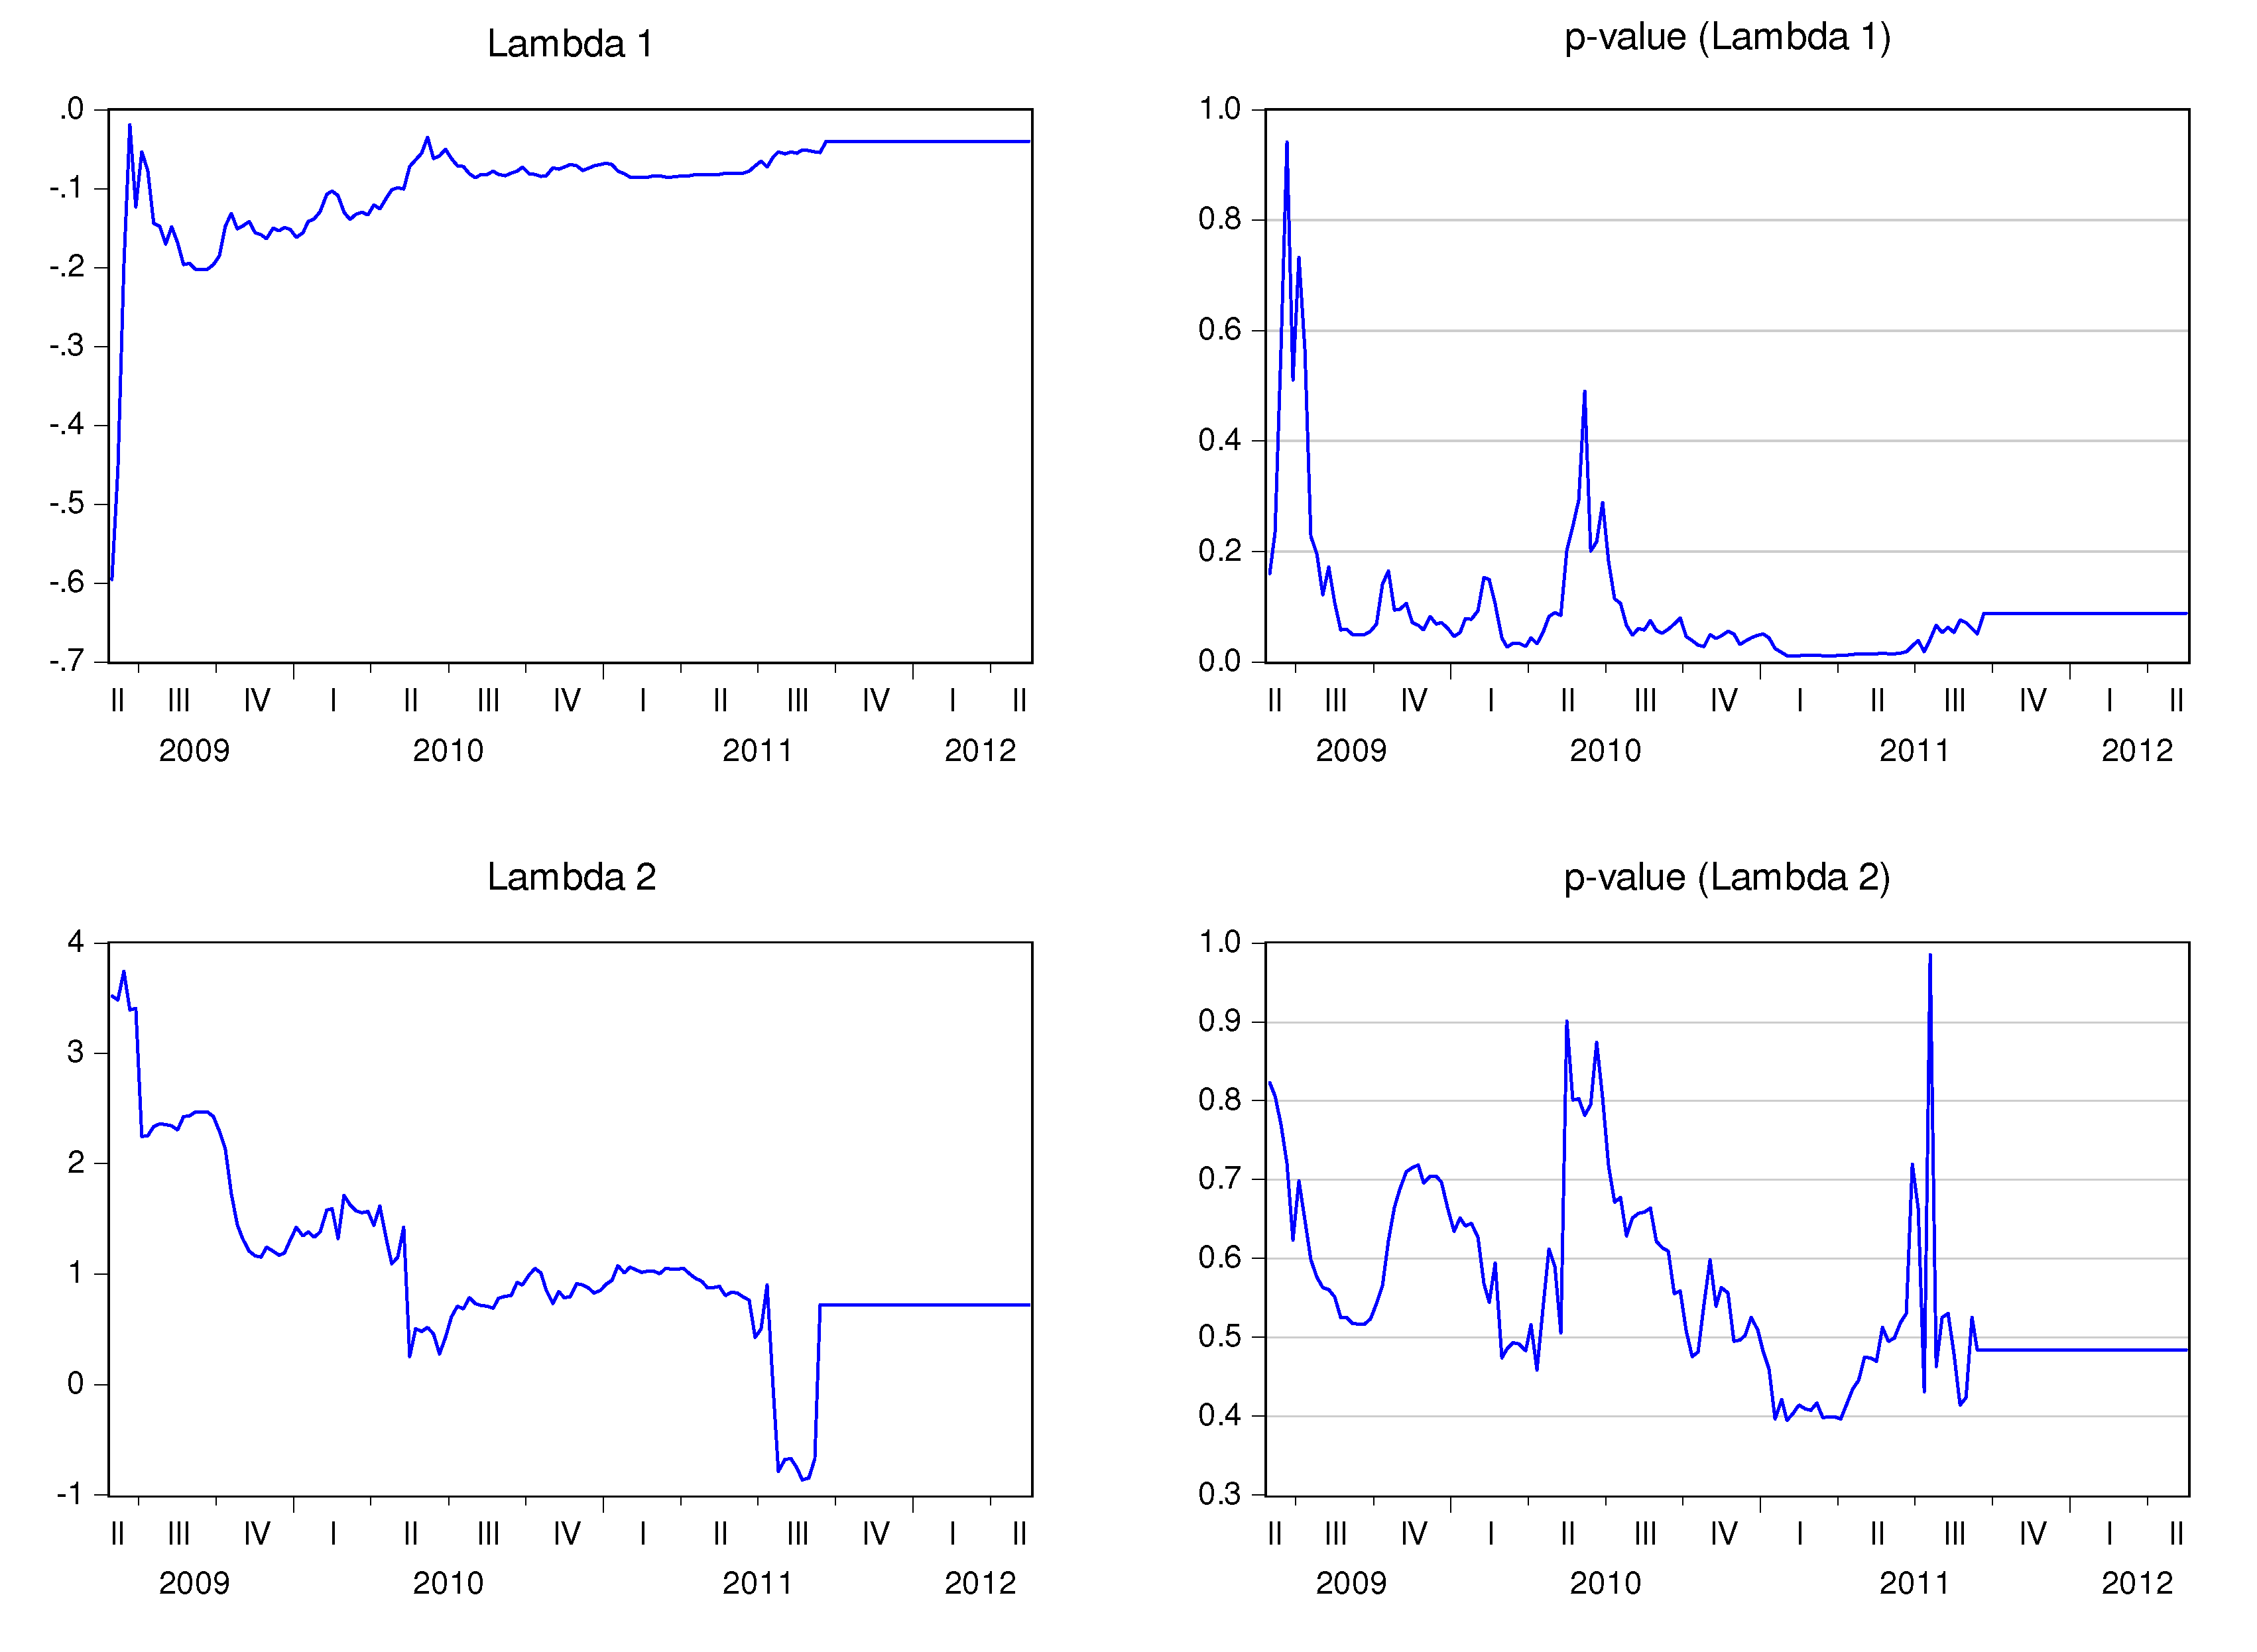
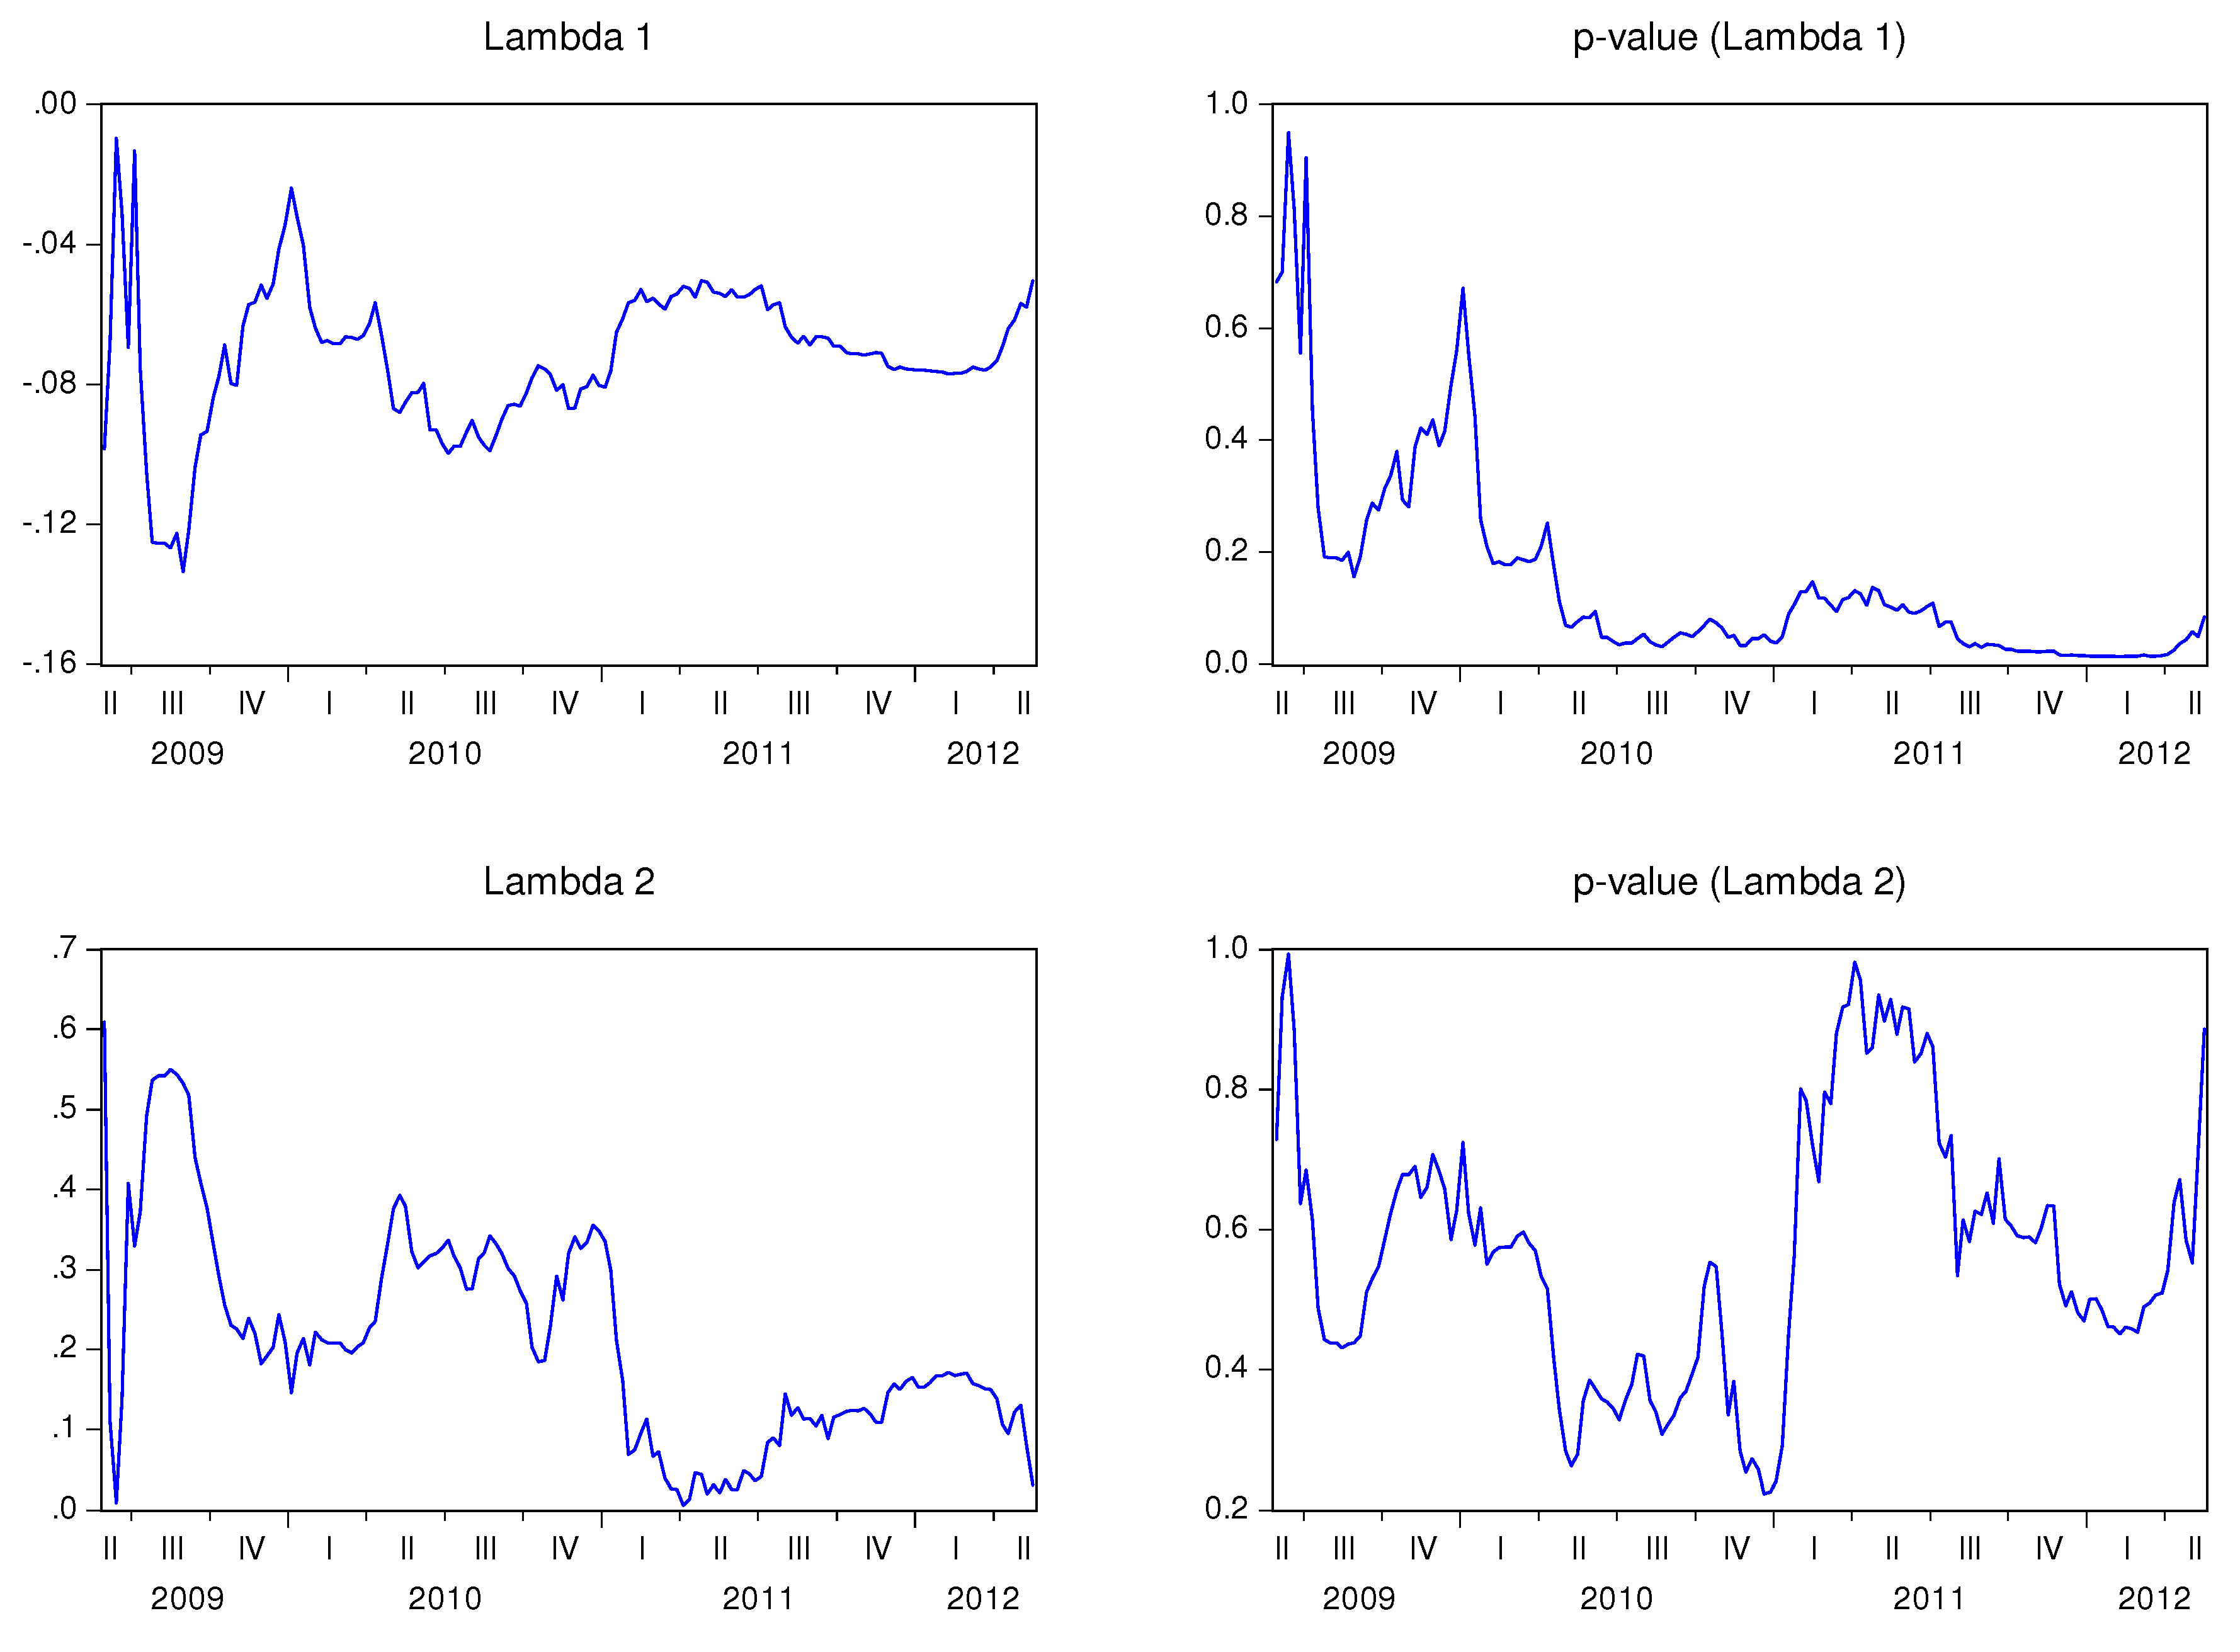
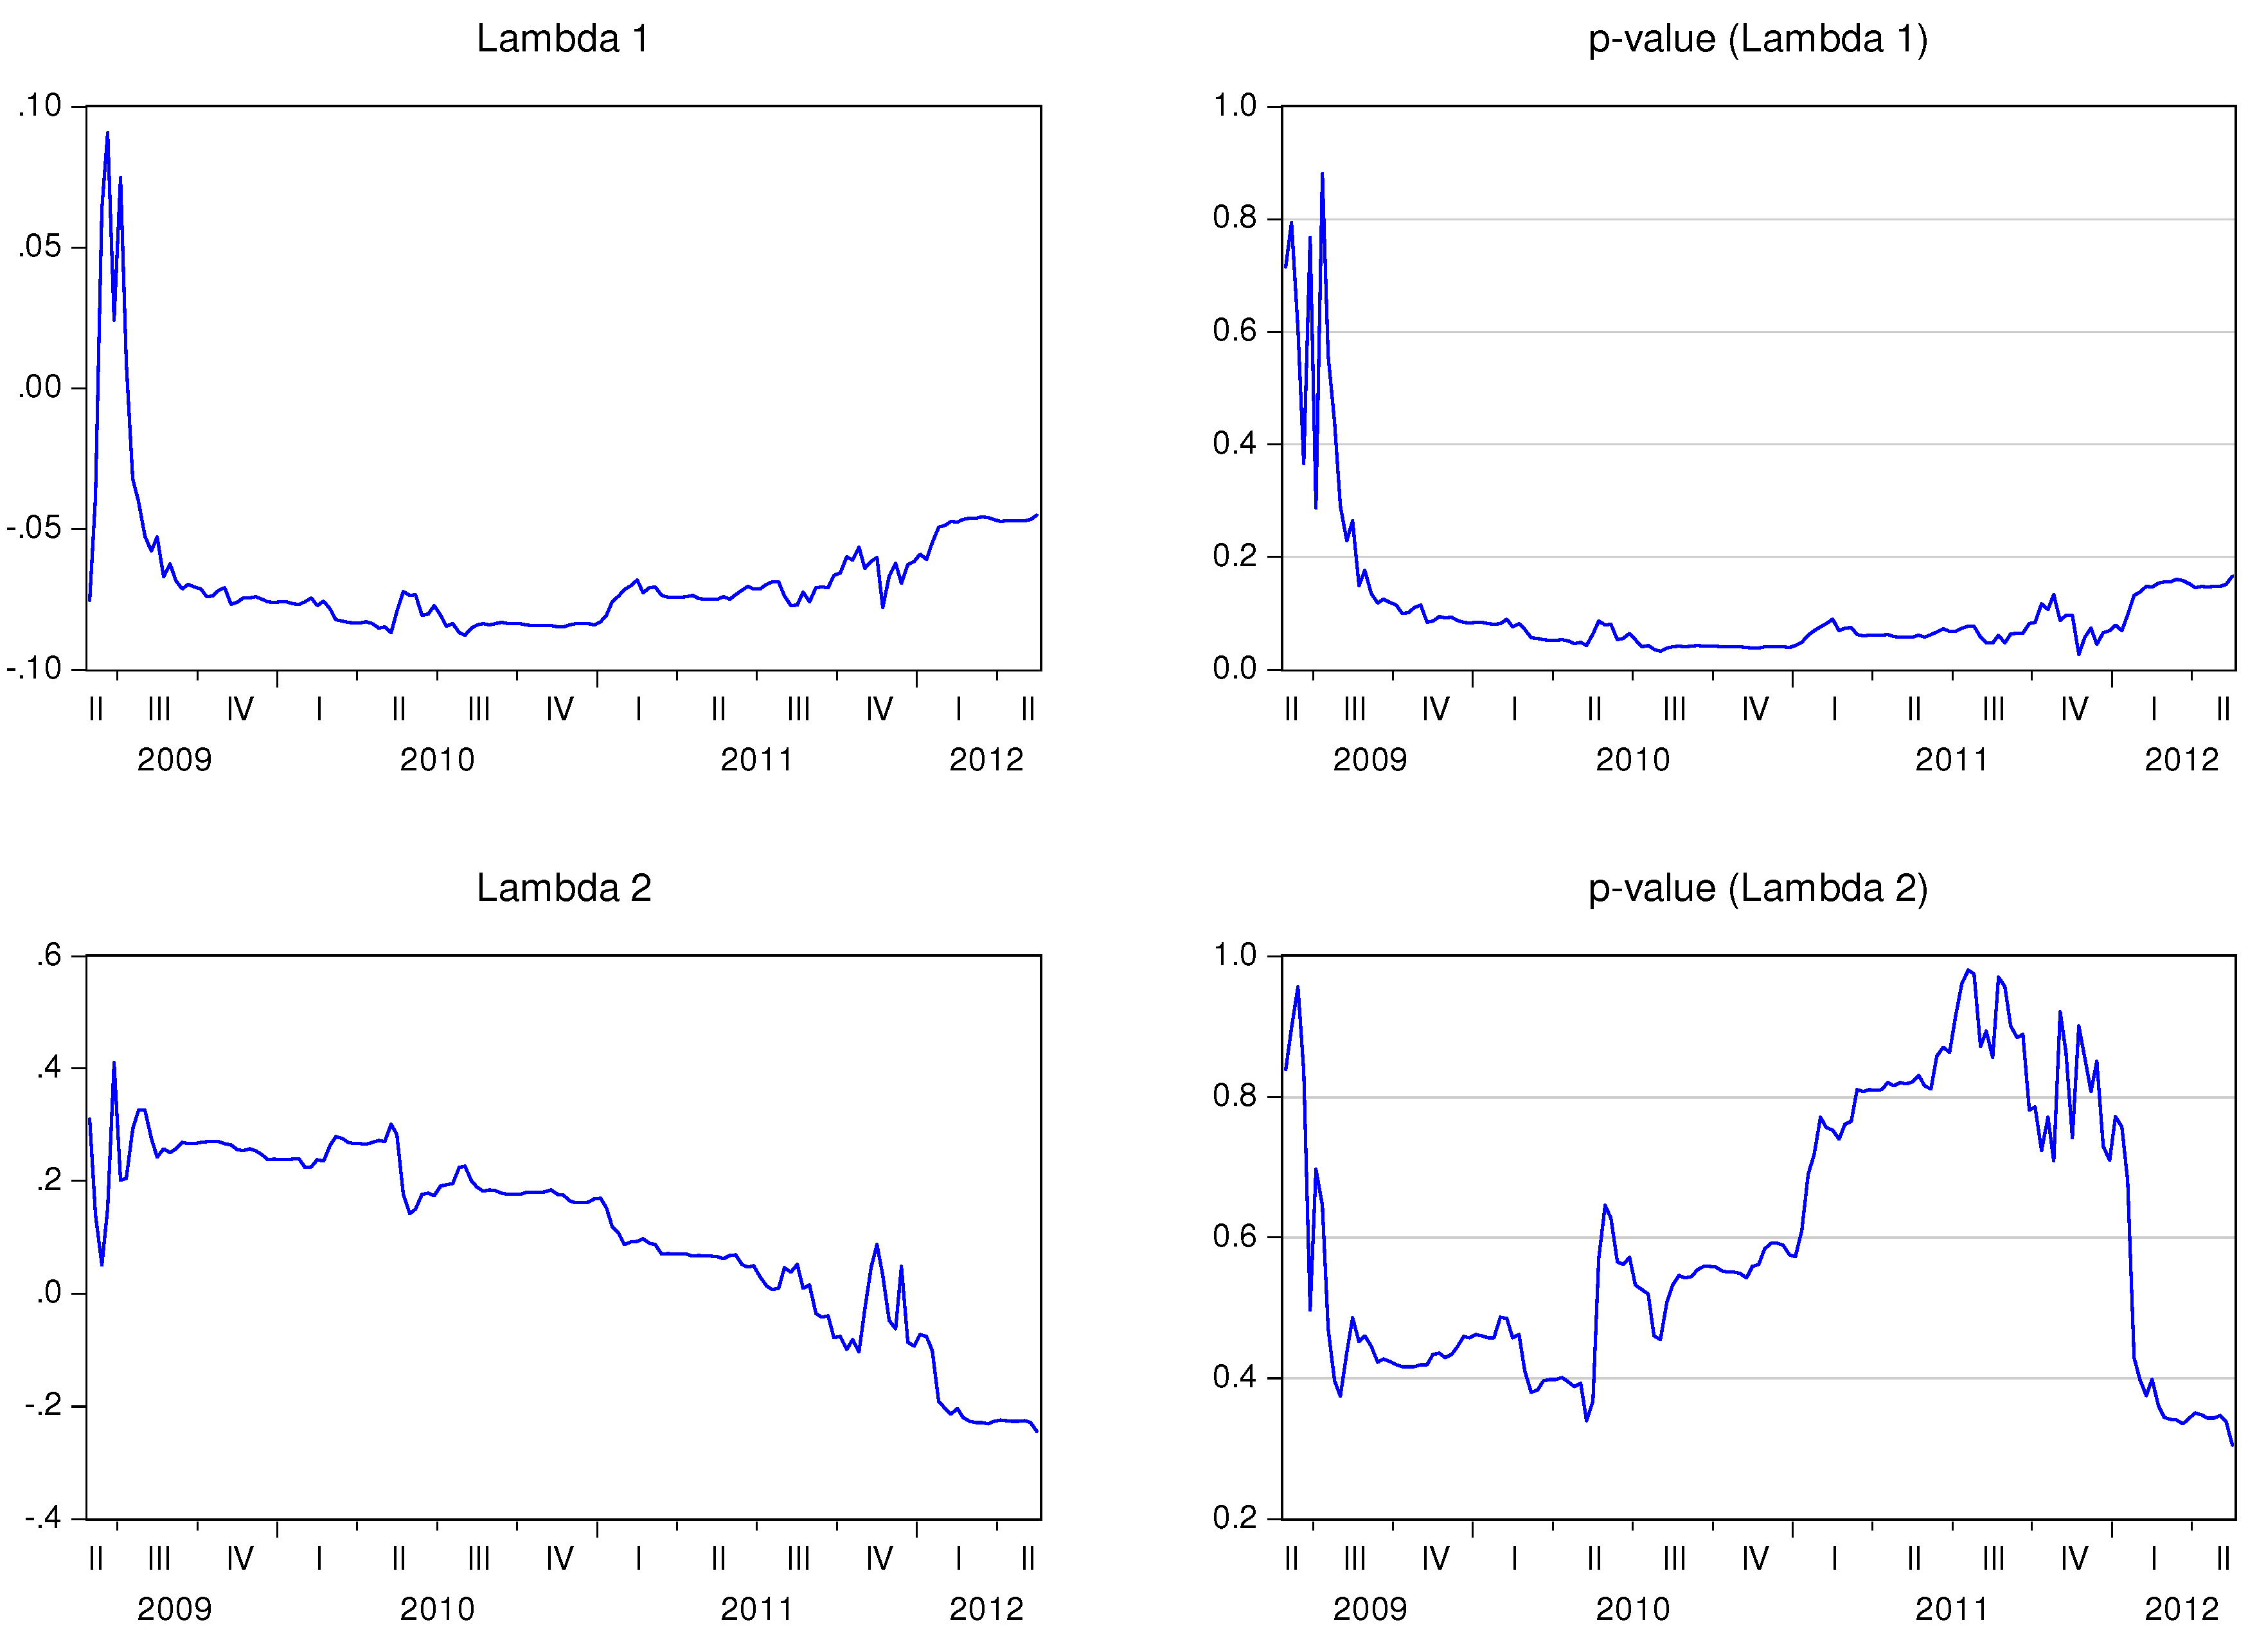
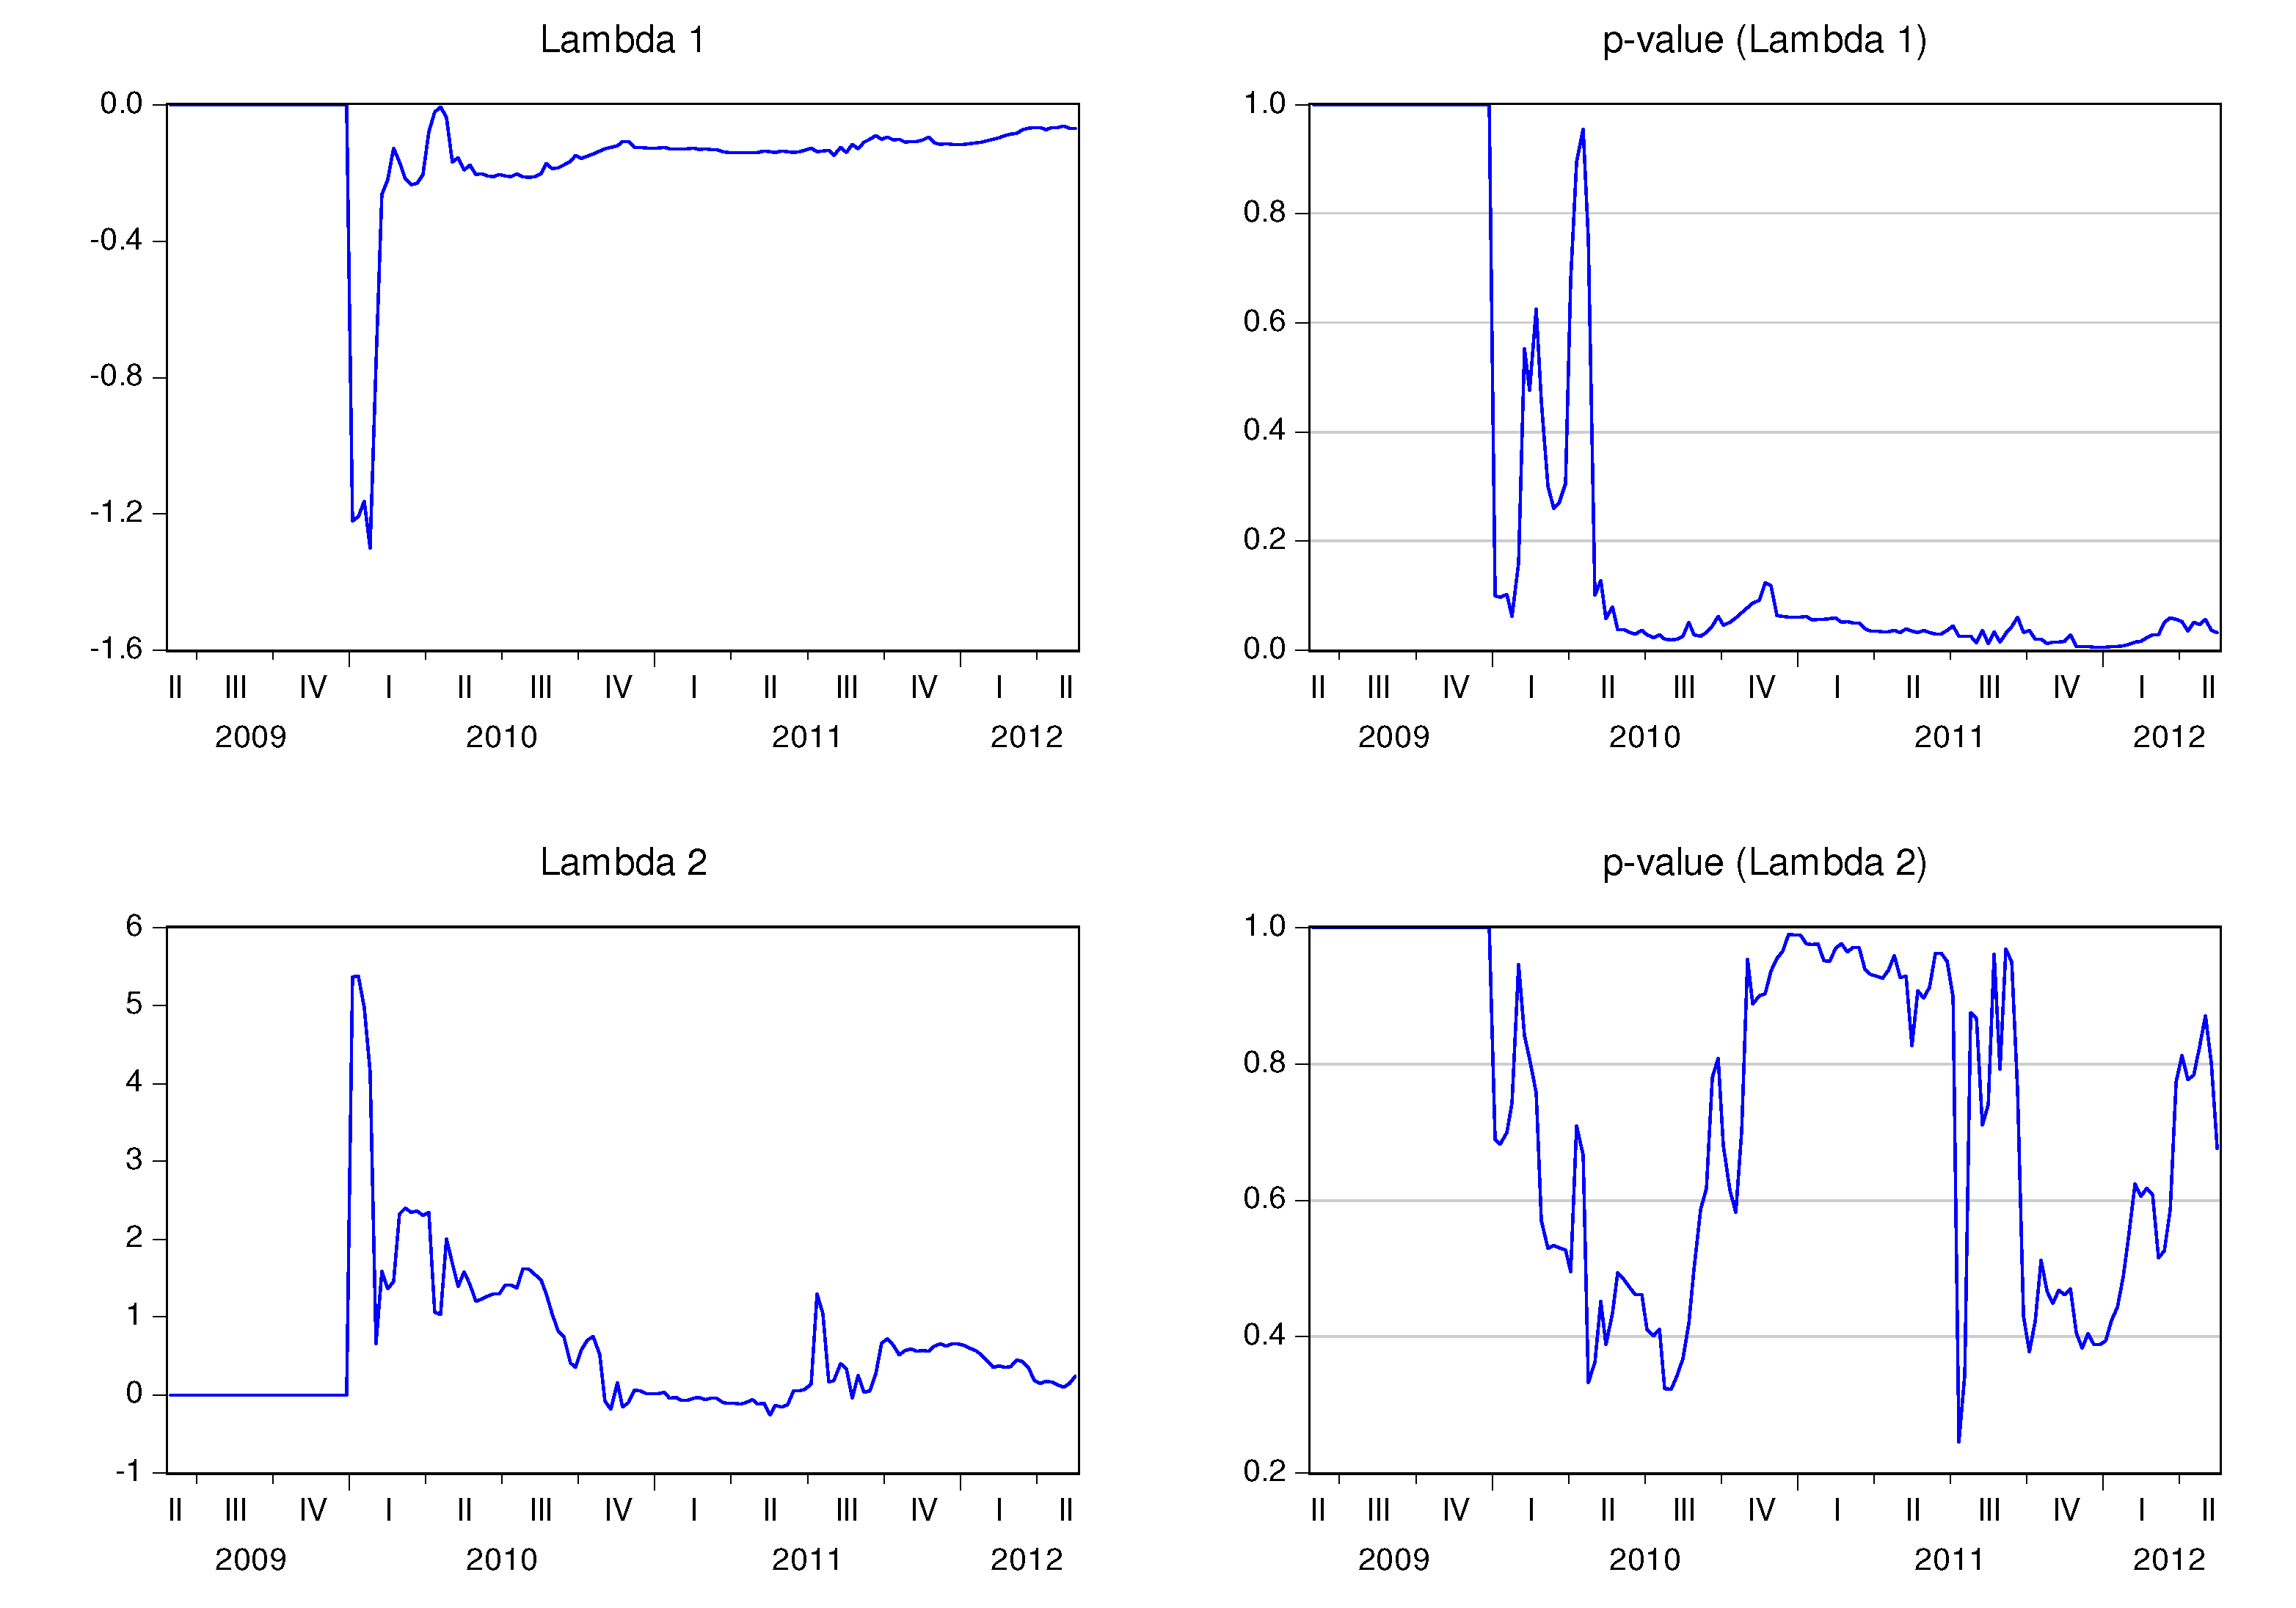
Figure 1 to
Figure 11 show the behavior of the speed adjustment coefficients by country.
![Ijfs 02 00145 i006]() 1,t
1,t is negative for all countries, signifying that the stock market reacts negatively (and correctly) to the imbalance between stock market prices and CDS spreads. Notice also that
![Ijfs 02 00145 i006]() 1,t
1,t is statistically significant during large periods of time, if not at all time, for Belgium, France, Portugal, Greece, Spain, Italy and Ireland. As a result, these stock markets seem to react to the imbalance with the CDS markets. λ
2,t is not statistically significant, which means that the CDS market leads the stock market in these countries. Notice that if
λ2,t is 0, the CDS market will not respond to imbalances between the markets, and the adjustment is only performed by the stock market.
![Ijfs 02 00145 i006]() 2,t
2,t is positive for Belgium, Germany, France, Finland, Portugal, Spain, and Ireland, and negative in The Netherlands. The sign of
![Ijfs 02 00145 i006]() 2,t
2,t alternates over time in the cases of Austria, Italy, and Greece. This coefficient is not statistically significant in any of the analyzed countries, at least during long time spans.
Figure 1.
Recursive estimation of the speed adjustment parameters—Austria.
Figure 1.
Recursive estimation of the speed adjustment parameters—Austria.
Figure 2.
Recursive estimation of the speed adjustment parameters—Belgium.
Figure 2.
Recursive estimation of the speed adjustment parameters—Belgium.
Figure 3.
Recursive estimation of the speed adjustment parameters—Germany.
Figure 3.
Recursive estimation of the speed adjustment parameters—Germany.
Figure 4.
Recursive estimation of the speed adjustment parameters—France.
Figure 4.
Recursive estimation of the speed adjustment parameters—France.
Figure 5.
Recursive estimation of the speed adjustment parameters—The Netherlands.
Figure 5.
Recursive estimation of the speed adjustment parameters—The Netherlands.
Figure 6.
Recursive estimation of the speed adjustment parameters—Finland.
Figure 6.
Recursive estimation of the speed adjustment parameters—Finland.
Figure 7.
Recursive estimation of the speed adjustment parameters—Portugal.
Figure 7.
Recursive estimation of the speed adjustment parameters—Portugal.
Figure 8.
Recursive estimation of the speed adjustment parameters—Greece.
Figure 8.
Recursive estimation of the speed adjustment parameters—Greece.
Figure 9.
Recursive estimation of the speed adjustment parameters—Spain.
Figure 9.
Recursive estimation of the speed adjustment parameters—Spain.
Figure 10.
Recursive estimation of the speed adjustment parameters—Italy.
Figure 10.
Recursive estimation of the speed adjustment parameters—Italy.
Figure 11.
Recursive estimation of the speed adjustment parameters—Ireland.
Figure 11.
Recursive estimation of the speed adjustment parameters—Ireland.
Finally, I compare the behavior of the 5Y P.D. with the evolution of the recursive speed adjustment coefficients (
![Ijfs 02 00145 i006]() i,t
i,t). The correlation between these variables is presented on
Table 7. The correlation between the 5Y P.D. and
![Ijfs 02 00145 i006]() 1,t
1,t is positive and higher than 0.1 for Austria (0.49), Greece (0.63), Spain (0.19), and Ireland (0.13)—see
Table 7. It is negative and inferior to −0.1 for Germany (−0.54), Finland (−0.26), France (−0.42), and Portugal (−0.40). A strong and negative correlation between the variables means that, in a context of financial distress, the adjustment coefficient of the stock market to the disequilibrium between CDS markets and stock markets will increase in absolute values. In other words, financial distress seems to enhance the error correction mechanism of the stock market. This effect seems to have occurred in Germany, Finland, France, and Portugal. In Austria, Greece, Spain, and Ireland the stock market seems to depart even more from the equilibrium when the risk of default surges.
With respect to the correlation between the 5Y P.D. and
![Ijfs 02 00145 i006]() 2,t
2,t, it is negative on the majority of the cases. The exceptions are Germany and Portugal. The absolute values of the correlation coefficients are superior to 0.2 for all cases. Germany and Portugal display a positive correlation between the 5Y P.D. and
![Ijfs 02 00145 i006]() 2,t
2,t, while the remaining countries present a correlation with the opposite sign. In financial distress periods,
![Ijfs 02 00145 i006]() 2,t
2,t tends to increase in Germany and Portugal, meaning that the imbalance between the sovereign CDS markets and the stock markets narrows as a consequence of the CDS adjustment. In the remaining cases, the disequilibrium is corrected exclusively through the stock market or not at all. Price discovery analysis shows that only Portugal and Germany present an increase of the adjustment velocity consistent with [
1] and [
18], according to which |
![Ijfs 02 00145 i006]() i,t
i,t| (i = 1,2) should increase during financial distress periods.
Table 7.
Correlation between time variant speed adjustment parameters and 5 year default probability.
Table 7.
Correlation between time variant speed adjustment parameters and 5 year default probability.
| Country | Correlation between 5Y P.D. and ![Ijfs 02 00145 i006]() 1,t 1,t | Correlation between 5Y P.D. and ![Ijfs 02 00145 i006]() 2,t 2,t |
|---|
| Austria | 0.492 | −0.612 |
| Belgium | 0.030 | −0.219 |
| Germany | −0.537 | 0.242 |
| Spain | 0.193 | −0.556 |
| Finland | −0.264 | −0.217 |
| France | −0.416 | −0.372 |
| Ireland | 0.126 | −0.373 |
| Italy | −0.046 | −0.811 |
| The Netherlands | 0.079 | −0.444 |
| Portugal | −0.396 | 0.335 |
| Greece | 0.633 | −0.800 |
5. Volatility Dissemination across Stock Markets and CDS Markets
In addition to studying the first order relationship between stock index prices and CDS spreads, it is also important to assess the volatility propagation between the two markets. In doing so, I use [
14] approach. Firstly, I calculate the daily volatility of stock indexes returns and CDS spread changes by squaring both variables. Next, I estimate Equation (4) and conduct a Granger causality analysis between squared returns and squared spread changes.
where VCDS,t is the square of CDS spread changes at t; VIB,t is the square of stock index returns at t;
The results indicate that the contemporaneous correlation between the volatilities of the two markets have grown considerably over the last years—see
Table 8. However, the evidence does not support the hypothesis that volatility propagation increases with financial distress.
Table 8.
Volatility spillovers across stock markets and CDS markets.
Table 8.
Volatility spillovers across stock markets and CDS markets.
| Country | Implied Rating | Contemporaneous Correlation | CDS spread volatility “Granger” cause stock index volatility | Stock index volatility “Granger” cause CDS spread volatility | Country | Implied Rating | Contemporaneous Correlation | CDS spread volatility “Granger” cause stock index volatility | Stock index volatility “Granger” cause CDS spread volatility |
|---|
| Portugal | A | 0.0637 | 3.7534 *** | 9.1603 *** | Finland | A | 0.3376 | 3.9011 *** | 4.3483 *** |
| B | 0.0061 | 0.3977 | 0.6652 | B | 0.1393 | 9.8805 *** | 0.7806 |
| C | 0.9514 | 3.1223 ** | 3.9376 *** | Spain | A | 0.0497 | 1.0634 | 1.5394 |
| D | 0.2314 | 2.9377 ** | 3.8545 *** | B | 0.0146 | 0.5273 | 0.4964 |
| E | 0.4820 | 1.6923 | 0.8433 | C | 0.8005 | 13.031 *** | 6.9382 *** |
| F | 0.3022 | 0.3943 | 1.8842 | D | 0.1785 | 27.952 *** | 3.0755 ** |
| Greece | A | 0.0143 | 2.7587 ** | 5.0099 *** | E | 0.4574 | 1.1916 | 3.0604 ** |
| C | 0.0178 | 0.6243 | 0.3631 | Belgium | A | 0.4362 | 5.8026 *** | 8.9193 *** |
| D | 0.1924 | 0.7466 | 0.2481 | B | 0.0470 | 0.6250 | 0.3656 |
| E | 0.6549 | 2.2389 * | 14.595 *** | C | 0.4769 | 11.215 *** | 3.3203 ** |
| F | −0.0184 | 0.2211 | 1.9091 | D | 0.4597 | 0.3882 | 3.5899 ** |
| Italy | A | 0.1798 | 1.6103 | 6.631 *** | Ireland | C | 0.3884 | 2.6455 ** | 2.7422 ** |
| B | 0.1094 | 0.3828 | 0.5081 | D | 0.0701 | 0.2947 | 0.3967 |
| C | 0.6048 | 5.3287 *** | 2.9204 ** | E | 0.1372 | 0.0674 | 0.7497 |
| E | 0.6500 | 2.2204 * | 2.2653 * | Austria | A | 0.0887 | 2.1188 * | 1 |
| France | A | 0.2228 | 1.0716 | 6.5424 *** | B | 0.1597 | 0.8283 | 3.2862 ** |
| B | 0.1112 | 3.1003 ** | 0.2208 | C | 0.5143 | 0.3849 | 1.2377 |
| C | 0.6061 | 0.5491 | 0.6984 | The Netherlands | A | 0.1626 | 2.5919 ** | 9.1673 *** |
| Germany | A | 0.1544 | 17.699 *** | 1.7556 | B | 0.4345 | 0.2563 | 0.2414 |
| B | 0.5499 | 3.4513 *** | 1.2146 | - | - | - | - | - |
Only three cases present evidence consistent with that hypothesis: The Netherlands, Austria, and Germany. In the case of Portugal, bucket C presents a correlation of 0.95, while bucket F displays a correlation of 0.30. Thus, the correlation between the volatility of the two markets actually decreases with financial distress. Spain displays similar results, with a correlation of 0.80 on bucket C and a correlation of 0.17 and 0.46 on buckets E and F, respectively. In Greece, a correlation of −0.02 is reported at bucket F. Given these results, one cannot conclude that the correlation of volatilities surges in financial distress periods.
The analysis of Granger causality between stock market volatility and CDS market volatility leads to similar conclusions. The results do not support the hypothesis that a market leads the other in terms of volatility propagation during financial distress periods. Conversely, for some cases, the data suggests that the lead-lag relationships between the two markets are stronger during stable periods. For instance, Portugal exhibits statistically significant lead-lag relationships between the two markets in buckets A, C, and D, but not on buckets E and F. Ireland displays statistically significant lead-lag relations between the two markets on state C, but not on buckets D and E. Similar situations occur in Greece, France, The Netherlands, and Austria. In the case of Germany, the CDS market volatility seems to Granger cause stock market volatility, regardless of the level of financial distress.
6. Conclusion and Discussion of the Results
This paper aims to contribute to the existing literature by assessing the interaction between stock and CDS markets.
Previous studies show that the association between stock prices and CDS (or bond) spreads is stronger when the financial situation of the firm deteriorates. In other words, stock prices and bond prices (CDS spreads) exhibit a strong positive (negative) correlation in financial distress periods. Several papers aimed to analyze if Merton’s model results were supported by the data, but only at a firm level. Until now, only a few have studied the interaction between stock markets and sovereign CDS markets with mixed results.
Using data from sovereign credit risk and stock index performance of Euro zone countries encompassing the period 2008–2012, I analyze the effects of sovereign financial distress on the dependency between stock markets and CDS markets. The data does not support the claim that the dependency of the markets increases with sovereign financial distress. These conclusions are derived from the analysis of contemporaneous correlations, Granger causality between CDS spread changes and stock indexes returns, and confirmed by a cointegration analysis and by the results from the analysis of an error correction model represented in a state space form where the speed of adjustment is estimated recursively.
I begin with the computation of the correlation between CDS spread changes and stock indexes returns. The data does not confirm that the correlations between CDS spread changes and stock indexes returns increase monotonically with sovereign financial distress. In particular, downgrades to worse buckets in terms of sovereign financial distress do not always result in the rise of the correlation between the variables. For instance, in the cases of Portugal and Greece, one observes several downgrades along with the reduction of the dependency between the markets.
The presence of Granger causality between stock returns and CDS spreads changes is also analyzed. CDS spreads do not Granger cause stock index returns in Finland and France. Granger causality is also very weak for Austria and The Netherlands. Contrary to what was expected, Granger causality tests reveal that the magnitude of the effects of the stock market on the CDS market declined with downgrades (and credit quality deterioration) in Portugal, Italy, France, Germany, Finland, Belgium, Austria, and The Netherlands. On the other hand, no Granger causality is found for Ireland, regardless of the bucket considered.
The empirical evidence also points towards the rejection of a cointegration relationship in Italy, France, Finland, and The Netherlands, regardless of the level of sovereign credit risk displayed by the country. Austria presents a cointegration relationship between the markets in all of the buckets, but Spain, Belgium, Portugal, and Ireland exhibit a cointegration relation only at the extreme states. In the latter countries, the long-term relationship seems to be stronger in the best and worst conjunctures and weaker in intermediate conjunctures. In Germany, it seems that the long-term relation between the variables became stronger after a bucket downgrade. Thus, one may conclude for the rejection of the hypothesis that the dependency between the stock markets and the sovereign CDS markets surges on financial distress periods. A recursive estimation of the speed adjustment coefficients towards equilibrium is also performed. Only Portugal and Germany present an increase of the speed adjustment parameters consistent with [
1], where the values of the factor loadings increase with financial distress. In some of the countries, the opposite occurs, and the speed adjustment parameters decline with credit quality deterioration.
Finally, I analyze the interaction of stock market volatility and CDS market volatility. The results do not support the hypothesis that volatility propagation increases during financial distress periods. On the contrary, for some cases, the data suggests that the lead-lag relationships between the two markets volatility are stronger during stable periods.


 1
1 2
2 1
1 2
2 1,t
1,t 2,t
2,t 1,t is negative for all countries, signifying that the stock market reacts negatively (and correctly) to the imbalance between stock market prices and CDS spreads. Notice also that
  1,t is statistically significant during large periods of time, if not at all time, for Belgium, France, Portugal, Greece, Spain, Italy and Ireland. As a result, these stock markets seem to react to the imbalance with the CDS markets. λ2,t is not statistically significant, which means that the CDS market leads the stock market in these countries. Notice that if λ2,t is 0, the CDS market will not respond to imbalances between the markets, and the adjustment is only performed by the stock market.
  2,t is positive for Belgium, Germany, France, Finland, Portugal, Spain, and Ireland, and negative in The Netherlands. The sign of
  2,t alternates over time in the cases of Austria, Italy, and Greece. This coefficient is not statistically significant in any of the analyzed countries, at least during long time spans.
 i,t). The correlation between these variables is presented on Table 7. The correlation between the 5Y P.D. and
  1,t is positive and higher than 0.1 for Austria (0.49), Greece (0.63), Spain (0.19), and Ireland (0.13)—see Table 7. It is negative and inferior to −0.1 for Germany (−0.54), Finland (−0.26), France (−0.42), and Portugal (−0.40). A strong and negative correlation between the variables means that, in a context of financial distress, the adjustment coefficient of the stock market to the disequilibrium between CDS markets and stock markets will increase in absolute values. In other words, financial distress seems to enhance the error correction mechanism of the stock market. This effect seems to have occurred in Germany, Finland, France, and Portugal. In Austria, Greece, Spain, and Ireland the stock market seems to depart even more from the equilibrium when the risk of default surges.
  2,t, it is negative on the majority of the cases. The exceptions are Germany and Portugal. The absolute values of the correlation coefficients are superior to 0.2 for all cases. Germany and Portugal display a positive correlation between the 5Y P.D. and
  2,t, while the remaining countries present a correlation with the opposite sign. In financial distress periods,
  2,t tends to increase in Germany and Portugal, meaning that the imbalance between the sovereign CDS markets and the stock markets narrows as a consequence of the CDS adjustment. In the remaining cases, the disequilibrium is corrected exclusively through the stock market or not at all. Price discovery analysis shows that only Portugal and Germany present an increase of the adjustment velocity consistent with [1] and [18], according to which |
  i,t| (i = 1,2) should increase during financial distress periods.
 1,t
1,t 2,t
2,t


