Article

Modeling the Determinants of Stock Market Investment Intention and Behavior Among Studying Adults: Evidence from University Students Using PLS-SEM

by
Dostonbek Eshpulatov
1,*,
Gayrat Berdiev
1 and
Andrey Artemenkov
2
1
Department of Accounting and Finance, Gulistan State University, Gulistan 120100, Uzbekistan
2
Department of Finance, Westminster International University in Tashkent, Tashkent 100047, Uzbekistan
*
Author to whom correspondence should be addressed.
Int. J. Financial Stud. 2025, 13(3), 138; https://doi.org/10.3390/ijfs13030138
Submission received: 21 June 2025 / Revised: 12 July 2025 / Accepted: 23 July 2025 / Published: 25 July 2025

Abstract

The development of stock markets is pivotal for economic growth, particularly through the mobilization of idle resources into productive investments. Despite recent reforms to enhance Uzbekistan’s capital market, public engagement remains limited. This study examines the behavioral determinants of stock market investment intention and participation among university students, employing the Theory of Planned Behavior (TPB) and Partial Least Squares Structural Equation Modeling (PLS-SEM). The model investigates the influence of digital literacy, financial literacy, social interaction, herding behavior, overconfidence bias, risk tolerance, and financial well-being on investment intention and behavior. A survey of 369 university students was conducted to assess the proposed relationships. The results reveal that risk tolerance, overconfidence bias, and herding behavior significantly and positively affect investment intention, while digital literacy demonstrates a notable negative effect, suggesting caution in assuming technology readiness automatically translates to investment readiness. Investment intention, in turn, strongly predicts actual participation and mediates several of these effects. Conversely, financial literacy, financial well-being, and social interaction showed no significant direct or mediating influence. Additionally, differences according to gender and academic background were observed in how intention translates into behavior. The findings underscore the need for integrated financial and behavioral education to enhance market participation and contribute to policy discourse on youth financial engagement in emerging economies.

1. Introduction

The development of robust stock markets is pivotal for enhancing the financial systems of developing countries, facilitating capital formation, improving resource allocation, and providing crucial investment opportunities. Empirical evidence consistently links stock market development with economic growth (Owen, 2020). In Uzbekistan, the capital market is increasingly recognized as a vital mechanism for mobilizing idle financial resources into productive investments. Despite significant governmental reforms aimed at increasing the share of securities in GDP and enhancing market transparency and efficiency, public engagement in the stock market remains notably limited. For instance, with a population exceeding 37 million, Uzbekistan’s brokerage accounts are scarce, representing only about 2.1% of the population, with less than 10% of these being active. This highlights a significant underutilization of the capital market by the general public.
Traditionally, Uzbek citizens have preferred to store wealth in tangible assets or low-yield savings, rather than productive financial instruments like equities. Recognizing this, the government has initiated various programs to shift public investment behavior. University students represent a crucial segment of the future workforce and potential investors (Lyngdoh et al., 2025). Understanding their investment intentions is therefore essential for informing policies aimed at increasing financial inclusion and fostering broader economic development (Xiao & Porto, 2017). Although various factors influencing stock market participation have been identified, including behavioral and cognitive factors such as digital literacy, financial literacy, social interaction, herding behavior, overconfidence bias, risk tolerance, and financial well-being (Ahmad & Shah, 2020), and digital literacy has also emerged as a key determinant (Wang et al., 2023), a significant research gap persists in understanding the interplay of these behavioral and cognitive factors on stock market investment intention and actual participation, specifically among university students within the unique socio-economic and educational context of Uzbekistan. Most existing studies are from developed markets or focus on general populations, leaving a void regarding this critical demographic in emerging economies.
Motivated by the low public engagement in Uzbekistan’s nascent capital market and the limited research on young investors in this context, this study aims to examine the behavioral determinants of stock market investment intention and participation among university students. We employ the Theory of Planned Behavior (TPB) (Ajzen, 1991) as our guiding theoretical framework, which posits that behavioral intentions are largely shaped by an individual’s attitudes, subjective norms, and perceived behavioral control, serving as a reliable predictor of actual behavior.
To achieve our objectives, we conducted a cross-sectional survey of 369 university students across Uzbekistan, utilizing a structured questionnaire. The collected data were analyzed using Partial Least Squares Structural Equation Modeling (PLS-SEM), a robust method particularly suitable for exploring complex relationships among latent variables and for predictive modeling in social science research (Cepeda-Carrion et al., 2019; Hair et al., 2021; Kock, 2015; Ringle et al., 2012). Our methodological innovation lies in the comprehensive integration of a broad range of behavioral and cognitive factors within the TPB framework, specifically adapted and validated for the Uzbek context, and our nuanced examination of their direct and mediating effects on investment intention and participation.
The key findings of this study reveal that risk tolerance, overconfidence bias, and herding behavior significantly and positively influence investment intention. Intriguingly, digital literacy demonstrates a notable negative effect on investment intention, suggesting that technological competence alone does not equate to investment readiness in this context. Investment intention, in turn, strongly predicts actual stock market participation and mediates several of these effects. Conversely, financial literacy, financial well-being, and social interaction showed no significant direct or mediating influence. Furthermore, our multi-group analysis uncovered important differences according to gender and academic background in how intention translates into behavior and how certain biases manifest.
This study offers several significant contributions. Theoretically, it extends the application of the TPB to the underexplored context of an emerging market’s young investor segment, providing novel insights into the complex interplay of behavioral and cognitive factors. Methodologically, it demonstrates the robust application of PLS-SEM to analyze a comprehensive model of investment behavior, with careful attention to construct measurement and contextual adaptation. Practically, the findings underscore the urgent need for integrated financial and behavioral education in Uzbek universities, emphasizing critical digital literacy, risk awareness, and the mitigation of cognitive biases. These insights are crucial for policymakers and educators aiming to enhance market participation and contribute to the broader policy discourse on youth financial engagement and capital market development in transitioning economies like Uzbekistan.

2. Literature Review

2.1. Theoretical Foundation

The Theory of Reasoned Action (ToRA), introduced by Ajzen and Fishbein in 1975, sought to clarify the connection between individuals’ attitudes and their behavioral intentions. Building upon this framework, Ajzen later formulated the Theory of Planned Behavior (TPB) in 1991, which extended ToRA by incorporating the element of perceived behavioral control (Ajzen, 1991). This addition acknowledged that an individual’s ability and motivation to perform a behavior significantly influence their intention to act. According to TPB, behavioral intentions are shaped by three key factors: attitude toward the behavior, subjective norms, and perceived behavioral control. These components collectively determine an individual’s likelihood of engaging in specific actions. This theoretical lens is particularly pertinent for investigating financial market participation, as demonstrated by several recent studies. For instance, Akhter and Hoque (2022) successfully applied TPB to analyze investment intentions among individual investors in Bangladesh, highlighting the significance of behavioral factors. Similarly, Nadeem et al. (2020) employed TPB to explore factors influencing stock market participation among young professionals, reinforcing its utility in understanding engagement with financial instruments. Furthermore, Yang et al. (2021) utilized TPB to investigate individual financial planning behaviors in emerging markets, underscoring its predictive power for financial decisions.
In the context of the present study, TPB was employed to examine the factors influencing students’ intentions to participate in the stock market, offering a comprehensive framework to understand how psychological and contextual variables drive investment behaviors. In the realm of financial decision-making, individuals’ intentions serve as critical predictors of their actual investment behaviors, reflecting their readiness to act based on underlying motivations and perceived control (Akhter & Hoque, 2022; Aristei & Gallo, 2021; Nadeem et al., 2020; Xu et al., 2022; Yang et al., 2021). According to the Theory of Planned Behavior (TPB) proposed by Ajzen (1991), an individual’s attitude indicates the extent to which they perceive a particular behavior as favorable or unfavorable. These evaluations, in turn, inform the individual’s intentions to perform the behavior. In the context of financial decision-making, an investor’s intention to participate in the stock market is shaped by their favorable or unfavorable assessments of such an action, thereby serving as a key determinant of actual investment behavior. Drawing from the insights gained regarding stock market participation, this study formulated the hypotheses outlined in Table 1.

2.2. Research Hypotheses

2.2.1. Digital Skills

Recent research emphasizes the importance of digital financial literacy in shaping individual investment behavior. For example, a study by Lu et al. (2024) found that digital financial literacy significantly enhances household participation in stock markets by improving financial capability and investment decision-making. According to Enescu and Raileanu Szeles (2024), digital literacy is crucial for empowering individuals to access and effectively use online financial platforms, which in turn enhances their capacity for well-informed investment choices. This increased competence reduces entry barriers and fosters greater participation in the stock market. Furthermore, digital literacy significantly enhances individuals’ ability to manage their finances, make informed decisions, and engage with digital financial services, all of which contribute to increased financial inclusion and participation in financial markets (Al-Afeef & Alsmadi, 2025). In contrast, Bhat et al. (2025) found that digital financial knowledge, digital financial experience, and digital financial skills significantly reduce impulsivity and enhance self-control, which may indirectly affect investment behavior. These findings support the assumption that digital literacy may play a crucial role in promoting stock market participation among university students in Uzbekistan. Drawing from the preceding discussion, the following hypothesis is proposed for empirical investigation:
Hypothesis 1 (H1).
There is a hypothesized significant positive relationship between digital literacy and stock market investment intention among students in Uzbekistan.

2.2.2. Financial Competence

Financial literacy has emerged as a fundamental determinant of individual investment behavior, particularly in the context of stock market participation. Theoretical and empirical research widely supports the notion that individuals equipped with a higher level of financial knowledge are more likely to engage in complex financial activities, such as investing in stocks (Akhter & Hoque, 2022). Furthermore, cognitive and psychological dimensions of financial decision-making have gained increasing attention. Research suggests that subjective financial knowledge can be as influential as objective knowledge in shaping investment intentions (Shehata et al., 2021). Financial literacy positively influences stock market participation by equipping individuals with the knowledge and confidence to make informed investment decisions, as supported by empirical evidence across multiple studies (Aristei & Gallo, 2021; Luo et al., 2023; Nadeem et al., 2020; Xu et al., 2022; Yang et al., 2021). However, this relationship is not always straightforward. As highlighted by Y. H. Lee and Ma (2024), overconfidence arising from misestimation (overestimating one’s financial knowledge) and misplacement (believing oneself to be more financially literate than peers) can also significantly impact participation, sometimes leading individuals with low actual knowledge to engage in risky market activities. Moreover, Akhter and Hoque (2022) reported that financial literacy did not exhibit a significant direct effect on behavioral intentions. Furthermore, their findings indicated that financial literacy did not enhance the relationship between investors’ attitudes and their behavioral intentions toward engaging in stock market participation. In light of the preceding discussion, the following hypothesis is proposed for empirical validation:
Hypothesis 2 (H2).
There is a hypothesized significant positive relationship between financial literacy and stock market investment intention among students in Uzbekistan.

2.2.3. Risk Tolerance

According to Behera et al. (2022), ‘risk absorption capacity’ functions as a mediating factor, influencing the relationship between investor cognition and neuroplasticity. This capacity is directly linked to risk tolerance. The study shows that emotionally affected investors, due to past losses, can re-engage with the market if their risk-bearing potential (a proxy for risk tolerance) is rebuilt through cognitive development. This reaffirms that low risk tolerance, often tied to psychological trauma, reduces stock market participation. Akhter and Hoque (2022) demonstrate that perceived financial risk significantly moderates the relationship between attitude and intention toward stock market participation. This suggests that even if investors hold positive attitudes, higher perceived risk can dampen participation unless they possess sufficient financial cognitive abilities and planning skills to mitigate that risk perception. Y. H. Lee and Ma (2024) introduce the concept of overconfidence, specifically misestimation and misplacement, as a key factor influencing market participation. Overconfident individuals tend to underestimate risk and overestimate their financial literacy, which may lead them to invest more readily. This behavior reflects low perceived risk or high risk tolerance, albeit not necessarily rationally derived. A study by Yang et al. (2021) demonstrated a significant and positive correlation between risk tolerance and stock market investment intention. The insights from the preceding discussion lead to the formulation of the following hypothesis for testing:
Hypothesis 3 (H3).
It is hypothesized that risk tolerance positively and significantly influences the stock market investment intention of students in Uzbekistan.

2.2.4. Economic Well-Being

According to Tulcanaza-Prieto et al. (2025), financial well-being is positively associated with investment behavior, as individuals who possess a sense of financial security and confidence are more inclined to participate in investment-related activities. Aristei and Gallo (2021) found that financial well-being, defined by confidence and control over personal finances, significantly enhances the likelihood of engaging in investment activities, supporting its relevance in predicting stock market participation. Akhter and Hoque (2022) contend that financial well-being significantly enhances individuals’ propensity to participate in the stock market. They emphasize that a heightened sense of financial security and confidence reduces anxiety and fosters more deliberate and informed investment behaviors. In contrast, Yang et al. (2021) reported no statistically significant direct or mediating relationship between financial well-being and stock market participation, suggesting that financial well-being alone may not consistently predict individuals’ investment behaviors. In light of the preceding discussion, the following hypothesis is proposed for empirical examination:
Hypothesis 4 (H4).
It is hypothesized that financial well-being positively and significantly influences the stock market investment intention of students in Uzbekistan.

2.2.5. Collective Decision-Making

Bogdan et al. (2023) highlight that in situations characterized by uncertainty or insufficient financial literacy, individuals tend to emulate the investment behaviors of others. This herding tendency serves as a coping mechanism and subsequently enhances their probability of engaging in stock market participation. Herding behavior influences investor decisions primarily for two reasons: (1) to mitigate the risk of financial loss by aligning with the majority and (2) to capitalize on potential gains by following perceived successful investment trends (Qasim et al., 2019). Herding behavior occurs when investors choose certain stocks to invest in rather than diversifying or avoiding specific options. This collective movement can distort market valuations by driving industry prices away from their underlying fundamental values (Spyrou, 2013). Drawing from the foregoing discussion, the ensuing hypothesis is put forth for empirical examination:
Hypothesis 5 (H5).
We propose that herding behavior will exert a significant positive impact on Uzbekistani students’ intention to invest in the stock market.

2.2.6. Overconfidence Bias

Overconfidence bias is an investor’s tendency to overestimate the accuracy of their private information signals and their ability to predict market movements. This cognitive bias leads investors to trade more frequently, often resulting in higher trading volumes and suboptimal financial decisions. Studies have found that overconfidence is a significant contributor to the disposition effect and can lead to poor investment decisions and decreased returns (Benayad & Aasri, 2023). When individual investors rely on heuristic-based decision-making, their analytical reasoning and technical comprehension may be compromised, increasing the likelihood of judgmental errors and biased financial choices (Ahmad & Shah, 2020). Bakar and Yi (2016) observed that overconfidence bias exerts a significant positive influence on investors’ decision-making processes, often prompting excessive trading and risk-taking behavior. Conversely, Benayad and Aasri (2023) and Yang et al. (2021) found that overconfidence bias does not exhibit a statistically significant impact on investment decision-making, suggesting that its influence may vary across different investor populations and contexts. Informed by the preceding discussion, we hypothesize for empirical testing that:
Hypothesis 6 (H6).
It is hypothesized that overconfidence bias positively and significantly influences the stock market investment intention of students in Uzbekistan.

2.2.7. Social Interaction

Social interaction refers to individuals’ perceptions of others’ expectations and behaviors, particularly regarding specific actions such as investment decisions. It reflects how social feedback mechanisms, like recognition through comments or endorsements, shape conformity to perceived norms (Akhtar & Das, 2019). The sharing of investment success stories via social networks may partly account for variations in stock market participation. Social networks help spread investment success stories, which can drive stock market participation. While internet use and social interaction generally boost engagement, modern communication tools may reduce the quality of shared financial information, weakening the positive effects of personal interactions (Liang & Guo, 2015). An investor, as a social being, interacts with others whose opinions and behaviors can influence their financial decision-making (P.H. & Uchil, 2020). Even socio-cultural knowledge significantly influences individuals’ intention to participate in the stock market (Bondia et al., 2019). In addition, Wu et al. (2018) and Yang et al. (2021) found that social interaction positively influences customers’ willingness to invest. Informed by the preceding arguments, we now propose the following testable hypothesis:
Hypothesis 7 (H7).
It is hypothesized that social interaction positively and significantly influences the stock market investment intention of students in Uzbekistan.

2.2.8. Individuals’ Stock Market Investment Intentions

Kumar and Goyal (2015) note that investors, when faced with uncertainty, must choose among several potential courses of action during their decision-making process. Determining the relative significance of factors influencing behavioral intention is a crucial component in analyzing individual investors’ decision-making processes (Akhtar & Das, 2019). The findings confirm that behavioral intention significantly mediates the relationship between behavioral antecedents and actual behavior, indicating that intention is a critical predictor in financial decision-making processes (Shehata et al., 2021). Sivaramakrishnan et al. (2017) and Yang et al. (2021) inferred that investment intention significantly predicts behavior related to stock market participation. In summation, and consistent with the discussion presented above, the subsequent hypothesis is put forth for empirical validation:
Hypothesis 8 (H8).
We propose that stock market investment intention will exert a significant positive impact on Uzbekistani students’ engagement in the stock market.

2.2.9. The Indirect Influence via Stock Market Investment Intention

An individual’s predisposition to engage in investment activities influenced by numerous motivating factors and personal perceptions is represented by their behavioral intention to invest. These intentions are influenced by internal attitudes and external stimuli that collectively drive the decision-making process related to stock market participation. Yang et al. (2021) identified several predictors of investment intention, including risk tolerance, financial well-being, financial literacy, overconfidence bias, herding behavior, and social interaction, all contributing to stock market participation. The study by Akhtar and Das (2019) highlights that individuals’ attitudes, capabilities in financial planning, and their evaluations of financial risks and benefits play a pivotal role in shaping stock market participation decisions. Furthermore, the relationship between attitudes and behavioral intentions to invest is moderated by factors such as financial planning proficiency, overall financial satisfaction, and perceived levels of financial risk. Perceived behavioral control denotes an individual’s assessment of the ease or difficulty associated with performing a specific behavior. Typically, when individuals hold favorable attitudes toward a particular behavior, they are more likely to develop a strong intention to carry out that behavior (Ajzen, 1991; Ajzen & Driver, 1992). Yang et al. (2021) observed a strong and statistically significant positive relationship between investment intention and stock market participation, suggesting that individuals with higher intentions are more likely to engage in actual investment behavior. Consistent with the discussion presented above, the ensuing hypothesis is advanced for empirical validation:
Hypothesis 9 (H9).
We propose that the influence of risk tolerance, financial well-being, financial literacy, digital literacy, overconfidence bias, herding behavior, and social interaction on stock market participation among university students in Uzbekistan is significantly mediated by their investment intention.
Figure 1 below depicts the entire conceptualized set of hypothesized relationships that were empirically examined.

3. Research Framework

3.1. Target Population and Sample Selection

This study’s target population comprised university students, a demographic apt to show interest in financial behaviors and investment decision-making. The sample for this study comprised students from 28 study fields across four higher education institutions in Uzbekistan: Gulistan State University, Gulistan State Pedagogical Institute, the Yangiyer Branch of Tashkent Institute of Chemical Technology, and the National University of Uzbekistan named after Mirzo Ulugbek. Data were collected using a Google Forms-based survey, which was administered in person across four different universities, encompassing a range of academic disciplines. The survey was distributed through visits to academic classes and departmental cohorts, with participation invited on a voluntary basis. Using G*Power 3.1 software (Heinrich Heine University, Düsseldorf, Germany), we conducted a power analysis to determine the optimal minimum sample size for the structural model. Following the guidelines suggested by Faul et al. (2009), the number of predictors was based on the most complex regression equation in the model, that is, the endogenous construct with the highest number of direct antecedents. In this study, the construct Stock Market Investment Intention was predicted by seven independent variables: digital literacy, financial literacy, social interaction, herding behavior, overconfidence bias, risk tolerance, and financial well-being. Accordingly, the power analysis was conducted using seven predictors, a medium effect size (f2 = 0.15), a significance level of α = 0.05, and a statistical power of 0.95. The analysis indicated that a minimum of 153 respondents was required to achieve sufficient statistical power. To mitigate potential issues associated with a limited sample size, this study set a target of collecting responses from over 500 participants. Although a total of 579 responses were initially collected through a survey conducted between March 2025 and April 2025, data cleaning procedures led to the exclusion of cases with missing values. As a result, 369 valid responses remained for analysis. The final dataset was used to investigate the influence of selected constructs on stock market investment intention and actual participation. To analyze the structural relationships among these constructs, the study employed Partial Least Squares Structural Equation Modeling (PLS-SEM) as the principal analytical method. PLS-SEM was chosen for several key reasons, consistent with its application in similar behavioral finance studies (Ringle et al., 2012). First, PLS-SEM is particularly suitable for exploring complex relationships among latent variables and for predictive modeling, which aligns with our objective of understanding the drivers of financial market participation. Second, it is robust to non-normal data distributions and can be effectively used with relatively smaller sample sizes, making it a flexible choice for social science research (Kock, 2015; Hair et al., 2021; Cepeda-Carrion et al., 2019). This approach is consistent with prior research on financial behavior, as exemplified by Akhter and Hoque (2022), Nadeem et al. (2020), and Yang et al. (2021), all of whom successfully utilized PLS-SEM to analyze TPB-based models in similar contexts.

3.2. Variable Measurement

This research assessed financial literacy via a questionnaire whose design was aligned with Kiril (2020). The instrument consists of 15 items, divided into three components: 7 items measuring financial knowledge, 4 items assessing financial behavior, and 2 items evaluating financial attitudes. The overall financial literacy score ranges from 1 to 13, derived by summing the scores from each component. To be classified as financially literate, respondents are required to meet minimum thresholds in each domain: a score of at least 5 out of 7 in financial knowledge, 3 out of 4 in financial behavior, and 1 out of 2 in financial attitude. This methodology, rooted in an established global standard, ensures both the reliability and the contextual relevance of our financial literacy assessment for university students in Uzbekistan.
Digital literacy was assessed using the Everyday Digital Literacy Questionnaire for Older Adults, developed and validated by Choi et al. (2023). A total of 30 items were adopted from this instrument to evaluate participants’ proficiency in daily digital tasks and their engagement with digital technologies. While the original instrument was designed for an older adult population, it was strategically chosen for this study of university students in Uzbekistan due to its robust focus on foundational and everyday digital tasks and proficiencies crucial for effective participation in modern society. We reasoned that the core digital competencies measured by the questionnaire, encompassing skills related to communication, information seeking, content creation, and safety in digital environments, are universally relevant and represent essential components of digital literacy across different age demographics, including university students.
In this study, risk tolerance is conceptualized as an individual’s propensity to accept a high degree of uncertainty when engaging in financial decision-making, consistent with definitions in the existing literature (Grable & Joo, 2004). This construct was assessed using five items sourced from established instruments: one item was adapted from Pak and Mahmood (2015), two items were taken from Sarwar and Afaf (2016), and two items were drawn from Akhter and Hoque (2022). The rationale for integrating items from these diverse sources was to capture a multifaceted understanding of risk tolerance, drawing on well-validated conceptualizations from existing literature. Each selected item was chosen for its specific relevance to our conceptualization of risk tolerance and its proven reliability in prior studies.
Financial well-being is conceptualized as a multifaceted construct that reflects an individual’s overall evaluation of their financial condition, aligning with the framework provided by J. M. Lee et al. (2020). This construct was measured using five items adopted from their study. This instrument was chosen due to its robust theoretical grounding and its focus on a holistic, individual-centric assessment of financial well-being, which extends beyond objective financial indicators to capture the subjective perception of financial security and satisfaction. Overconfidence bias refers to the tendency of individuals to overestimate their knowledge, skills, and decision-making abilities while underestimating risks and disregarding them (Kukacka & Barunik, 2013). This construct was measured using five items, all adapted from Sarwar and Afaf (2016). This specific instrument was chosen for its clear conceptual alignment with the definition of overconfidence bias pertinent to financial decision-making, and its items effectively capture the core behavioral manifestations of this cognitive bias. Investors’ tendency to mimic the decisions of others, often disregarding their own data and individual assessments, is defined as herding behavior. Five items measuring this construct were adapted from the instrument developed by Sarwar and Afaf (2016). This instrument was selected for its direct relevance to capturing investor imitation tendencies within financial contexts, aligning well with our study’s focus on investment intentions. Its items are designed to assess the psychological inclination to follow the crowd, a key behavioral bias in financial decision-making. Social interaction is recognized as a key channel through which investment-related information is disseminated among potential investors and may be influenced by other information sources. Five items from Wu et al. (2018) were adopted to measure this construct. This specific scale was chosen for its strong theoretical alignment with the concept of informational and normative social influence in financial contexts, and its items are well-suited to capture how individuals acquire and are swayed by investment-related information from their social networks. Stock market investment intention is defined as an individual’s expressed willingness to engage in specific investment behaviors. This construct was measured using five items adopted from Akhtar and Das (2019). This particular scale was chosen for its strong conceptual alignment with theories of planned behavior and reasoned action, providing a robust framework for assessing individuals’ pre-decisional commitment to engaging in stock market activities. Its items are designed to directly gauge the propensity to invest, which is crucial for understanding the behavioral antecedents in emerging markets. To assess stock market participation, this study utilized a set of five measurement items adapted from the works of Khan et al. (2017) and Lyngdoh et al. (2025). Each item was selected for its proven efficacy in prior research in assessing tangible investment behaviors.
Across all constructs measured in this study, including digital literacy, financial literacy, social interaction, herding behavior, overconfidence bias, risk tolerance, financial well-being, intention to invest in stocks, and participation in equity markets, significant emphasis was placed on ensuring the cultural and contextual suitability of the adopted instruments for the Uzbek university student population. While many scales originated from diverse research settings, each was rigorously reviewed and, where necessary, adapted to ensure linguistic and conceptual appropriateness. This meticulous approach guaranteed that the items accurately reflected the unique socio-economic realities, cultural nuances, and behavioral patterns relevant to financial decision-making within the specific Uzbek context. Our commitment to contextual relevance enhances the validity and generalizability of our findings within this particular setting.
All measurement items used in this study are presented in Appendix A. A five-point Likert scale was employed for all items, ranging from “strongly disagree” (1) to “strongly agree” (5). The strength of the relationships connecting the chosen constructs with both stock market investment intention and stock market participation was assessed using this response format.

3.3. Normality Assumption

Multivariate normality was assessed using Mardia’s skewness and kurtosis tests via the Peng and Lai (2012) tool. The results indicated significant deviations from multivariate normality, with Mardia’s multivariate skewness and kurtosis both exceeding acceptable thresholds. These findings confirm that the dataset does not meet the assumption of multivariate normality, supporting the use of Partial Least Squares Structural Equation Modeling (PLS-SEM), which does not require normally distributed data (Cepeda-Carrion et al., 2019).

3.4. Data Processing and Analysis

Partial Least Squares Structural Equation Modeling (PLS-SEM) was the method employed in this study to estimate complex causal relationships among latent constructs (Cepeda-Carrion et al., 2019). Notably, PLS-SEM offers advantages over covariance-based structural equation modeling (CB-SEM), especially for analyzing higher-order constructs and models with mediation effects (Peng & Lai, 2012). Given the study’s sample size (n = 369), which exceeds the commonly recommended threshold of 100 observations, the application of PLS-SEM using SmartPLS 4.1.1.4 software was deemed appropriate for testing the proposed structural relationships.

4. Data Interpretation

4.1. Participant Characteristics

The demographic characteristics of the 369 valid respondents are summarized in Table 2. The gender distribution reveals a greater proportion of female participants, with 221 respondents (59.41%) identifying as female, compared to 151 male respondents (40.59%). In terms of age, the majority of respondents (n = 353, 95.66%) were between 17 and 27 years old. A smaller segment comprised individuals aged 28 to 37 years (n = 13, 3.52%), and only 3 participants (0.81%) were in the 38 to 47 age bracke. In terms of financial literacy, 41 participants (11.02%) met the criteria for being classified as financially literate, while 331 (88.98%) did not.
The survey sample comprised university students from multiple regions of Uzbekistan, with a pronounced concentration in the Syrdarya region (61.25%). Other regions with notable representation included Jizzakh (12.20%) and the Tashkent region (5.96%). In contrast, participation from regions such as Surkhandarya (0.27%), Namangan (0.81%), and Tashkent city (0.81%) was minimal. Institutional affiliation data reveal that the majority of respondents were enrolled at Gulistan State University (71.54%), followed by Gulistan State Pedagogical Institute (21.14%). Smaller proportions were drawn from the Yangiyer University of Chemical Technologies (4.61%) and the National University of Uzbekistan (2.71%).

4.2. Reliability and Validity

The financial literacy construct was operationalized as a composite score derived from 15 items following the OECD/INFE framework. We acknowledge that financial literacy is inherently a multidimensional construct. However, this approach is considered an acceptable practice in PLS-SEM for constructs that are conceptually treated as a unified, aggregated indicator, particularly when the research objective focuses on the overall impact of the composite construct rather than the unique contributions of its sub-dimensions (Hair et al., 2021). While higher-order modeling is often suitable for complex multidimensional constructs, our choice to use an aggregated composite score as a single observed variable allows for model parsimony and directly reflects the OECD/INFE’s approach to deriving an overall financial literacy score. This enables us to investigate the overarching effect of financial literacy as a comprehensive construct within our model. Further details on the specific items and scoring for each component of financial literacy are provided in Table A2.
Initially, the digital literacy construct was measured using 30 items adapted from (Choi et al., 2023). However, during the model evaluation process, multicollinearity diagnostics revealed that several indicators had variance inflation factor (VIF) values exceeding acceptable thresholds (i.e., VIF > 5.0), indicating high multicollinearity. To address this issue and enhance the model’s discriminant and convergent validity, 11 items with the highest VIF values were systematically removed. The final construct retained 19 items, each demonstrating adequate indicator reliability, internal consistency, and convergent validity. This refinement ensured a more parsimonious and statistically sound measurement model while preserving the theoretical integrity of the digital literacy construct. Removed items are presented in Table A3.
The assessment of the measurement model began with evaluating construct reliability, indicator reliability, and convergent validity. Construct reliability was assessed through Composite Reliability (CR), which should exceed the threshold of 0.70 to confirm internal consistency, as suggested by Hair et al. (2014). As displayed in Table 3, all constructs achieved CR values ranging from 0.790 (financial well-being) to 0.971 (digital literacy), satisfying the recommended criteria. Cronbach’s Alpha (CA), used to evaluate indicator reliability, was also acceptable for all constructs, ranging from 0.686 to 0.969, surpassing the acceptable threshold of 0.60. Dillon–Goldstein’s rho (DG rho), an alternative reliability measure, similarly indicated strong internal consistency, with values above 0.60 across constructs. Convergent validity was confirmed through the Average Variance Extracted (AVE), which should exceed 0.50 to demonstrate sufficient variance captured by the constructs relative to measurement error.
While most constructs met the recommended threshold of 0.50 (Fornell & Larcker, 1981), the AVE for financial well-being was marginally below this criterion at 0.432. Although slightly below the stringent threshold, this construct was retained in the model for several theoretical and contextual reasons. Financial well-being is a fundamental construct in understanding an individual’s holistic financial state and its influence on investment intentions, particularly within an evolving economic landscape like Uzbekistan. Removing it would significantly diminish the theoretical scope and practical relevance of our model. Furthermore, some scholars argue that for formative constructs or in nascent research areas, slightly lower AVE values can be acceptable if other validity indicators (like CR and factor loadings) are robust (Hair et al., 2021). In our case, the Composite Reliability for financial well-being (CR = 0.790) met the acceptable threshold, indicating adequate internal consistency. Thus, while acknowledging this minor limitation in convergent validity, its theoretical significance warrants its retention.
Ultimately, all variance inflation factor (VIF) values were found to be below the threshold of 5, indicating that multicollinearity was not a concern in the model. In line with the procedure recommended by Kock (2015), this study conducted a full collinearity assessment for all independent variables. Each construct was regressed onto a common method factor, and the resulting variance inflation factor (VIF) values were below the threshold of 5. These results indicate that the model is free from significant single-source bias. Thus, the full collinearity analysis provides no evidence of common method bias. Discriminant validity in this study was evaluated using two established methods: the Fornell–Larcker criterion and cross-loadings. The initial assessment of discriminant validity employed the cross-loading technique to ensure that each indicator loaded more strongly on its associated construct than on any other construct in the model, in accordance with recommended procedures (Hair et al., 2014). The Fornell–Larcker criterion was employed to evaluate the discriminant validity of the constructs by comparing the square root of the average variance extracted (AVE) for each construct with the correlations between that construct and others. Additionally, the cross-loadings method was applied, which requires that each indicator’s loading on its designated construct exceeds its loadings on other constructs. Based on these criteria, the analysis demonstrated satisfactory discriminant validity across all constructs. Results for the Fornell–Larcker criterion are found in Table 4, while cross-loading outcomes are presented in Table 5. The findings confirmed that all constructs met the necessary conditions for discriminant validity, as each item loaded more strongly on its associated construct than on any other. The analysis confirms model robustness. VIF values below 5 indicate no multicollinearity or common method bias (Kock, 2015). Discriminant validity, assessed via Fornell–Larcker and cross-loadings (Hair et al., 2014), was satisfactory, affirming each variable’s distinctiveness.

4.3. Structural Model Results

Table 6, which evaluates the structural model, identifies the key determinants of stock market investment intention. Our findings reveal that risk tolerance, herding behavior, and overconfidence bias all have a significant positive influence on investment intention. These findings underscore the relevance of behavioral traits in shaping individuals’ investment intentions. In contrast, financial literacy, financial well-being, and social interaction did not yield statistically significant effects. Interestingly, digital literacy was found to have a significant yet negative impact, which may suggest that increased digital awareness is associated with heightened caution or perceived complexity in stock market engagement. Investment intention, in turn, significantly influenced stock market participation, confirming its mediating role within the structural framework.
The model explained 35.5% of the variance in investment intention (R2 = 0.355) and 37.1% in stock market participation (R2 = 0.371), reflecting a moderate level of explanatory power. Effect size (f2) analysis revealed that risk tolerance had the strongest effect (f2 = 0.110), while other constructs contributed smaller effects. To assess the model’s predictive accuracy, the blindfolding procedure was employed, which, according to Hair et al. (2014), reconstructs parameter estimates to evaluate how well the model predicts observed data. This technique is applicable only to endogenous constructs measured reflectively. The cross-validated redundancy (Q2) values for investment intention and stock market participation were 0.317 and 0.240, respectively, confirming adequate predictive relevance for these constructs.

4.4. Mediating Effects

This study evaluated the mediating role of investment intention in the relationships between several antecedents and stock market participation. The analysis revealed that stock market investment intention significantly mediated the relationships between digital literacy, risk tolerance, herding behavior, and overconfidence bias with stock market participation. These findings indicate that the effects of these predictors on investment behavior occur partially through the formation of intention. In contrast, no significant mediating effects were observed for financial literacy, financial well-being, and social interaction, suggesting that investment intention does not significantly channel the influence of these variables on stock market engagement. These results underscore the importance of cognitive-behavioral traits (e.g., risk tolerance and overconfidence) and informational competencies (e.g., digital literacy) in shaping behavioral intention and, ultimately, investment participation. The summary of these mediation effects is presented in Table 7.

4.5. Cross-Group Analysis

Our Multi-Group Analysis (MGA) provided valuable insights into the stability of our proposed model across key demographic subgroups and highlighted specific areas where participant characteristics modulate financial behavior. While the structural model generally exhibited consistency across groups, a few notable exceptions emerged, enriching both theoretical understanding and informing targeted practical interventions. The summary of Multi-Group Analysis (MGA) is presented in Table 8.
Regarding gender-based differences, the MGA revealed that for most hypothesized paths, the influence of antecedents on investment intention and participation did not significantly vary between male and female students. This finding suggests a foundational consistency in the behavioral mechanisms driving investment intentions, regardless of gender, which is an important contribution to the literature on behavioral finance in emerging markets, where gender-specific studies are often limited. A crucial difference was observed, though: the path connecting investment intention to stock market participation proved significantly stronger for males (p = 0.015) than for females. This difference implies that while intentions to invest might be similarly formed across genders, the conversion of these intentions into actual investment behavior is more robust among males. This could be attributable to varying levels of financial autonomy, risk-taking propensity, or access to investment resources and social networks that facilitate actual participation, which might differ between genders in the Uzbek context. For practitioners, this highlights a potential “intention–behavior gap” that is more pronounced among female students, suggesting the need for targeted programs that not only foster intention but also empower women with the practical tools and confidence to translate those intentions into action.
Further, the MGA uncovered significant disparities in key relationships when comparing economics students with non-economics students. Notably, overconfidence bias significantly influenced investment intention among economics students, but not among their non-economics counterparts, with a statistically significant difference observed between these groups. This finding suggests that formal economic education, while enhancing financial knowledge, might inadvertently cultivate a higher degree of overconfidence among students, making them potentially more susceptible to this cognitive bias in their investment decision-making. This nuanced outcome extends the existing literature on behavioral biases by demonstrating how academic background can modulate the impact of psychological factors on financial intentions. Conversely, social interaction significantly affected the investment intentions of non-economics students, while showing no significant influence on economics students. This indicates that students without a specialized economics background may rely more heavily on peer influence, social networks, or informal advice when contemplating stock market participation. This reliance could stem from a perceived lack of formal knowledge, leading them to seek validation or information from their social circles.
These subgroup-specific insights underscore the importance of tailoring financial literacy and engagement programs. For instance, interventions targeting economics students might need to incorporate modules on recognizing and mitigating cognitive biases, specifically addressing overconfidence. Conversely, programs for non-economics students could leverage social learning theories, potentially using peer-led initiatives or guided group discussions to foster informed decision-making while mitigating the risks of herding behavior observed in social contexts. Overall, while the core relationships of our model hold broadly, acknowledging these specific gender and academic field modulations is vital for developing more effective and contextually relevant strategies to boost stock market participation among university students in Uzbekistan.

5. Discussion

The primary objective of this study was to explore the extent to which stock market investment intention mediates the effects of behavioral and cognitive factors on stock market participation among university students in Uzbekistan.
In contrast to the prevailing body of literature, which often emphasizes the positive role of digital literacy in enhancing financial engagement, the present study reveals a significant negative relationship between digital literacy and stock market investment intention among university students in Uzbekistan. While previous research Al-Afeef and Alsmadi (2025), Enescu and Raileanu Szeles (2024), and Lu et al. (2024) has highlighted the facilitative impact of digital literacy on investment behavior through enhanced access to financial platforms and improved financial decision-making, this study’s findings suggest a more complex dynamic in the local context.
A possible explanation for this discrepancy lies in the interaction between digital literacy and financial literacy. As noted by Bhat et al. (2025), digital financial skills may enhance self-control and reduce impulsivity, possibly leading individuals to adopt a more cautious approach toward investing. Our findings reveal an intriguing negative relationship between digital literacy and investment intention. It is important to emphasize that this relationship may be highly context-dependent within the specific Uzbek setting. In the absence of strong financial literacy, digitally literate individuals may become more aware of the complexities and risks associated with stock market participation, thereby lowering their intention to invest. This notion is supported by the current study’s demographic data, wherein only 11.02% of respondents were classified as financially literate. This aligns with the concept that greater digital access without adequate financial comprehension might amplify risk aversion rather than investment confidence.
Moreover, cultural and institutional factors in Uzbekistan may further mediate this relationship. The relatively underdeveloped state of the local capital market and limited trust in financial institutions may exacerbate hesitation among digitally literate individuals. Given the cross-sectional nature of our data, we explicitly label this finding as exploratory and speculative; thus, causal claims regarding this relationship should be interpreted with considerable caution. This finding underscores the need for integrated educational initiatives that not only promote digital competence but also strengthen foundational financial knowledge. Addressing this gap could help align digital literacy with proactive investment behaviors, especially in transitioning economies such as Uzbekistan. Further research, particularly through longitudinal studies or qualitative investigations, would be essential to fully understand the dynamic interplay and causal mechanisms underlying this observed relationship.
Given the finding that financial literacy did not have a significant effect on stock market investment intention, this outcome warrants careful interpretation in light of the existing literature. While numerous studies have confirmed the positive role of financial literacy in enhancing individuals’ ability to make informed investment decisions (Aristei & Gallo, 2021; Luo et al., 2023; Nadeem et al., 2020; Xu et al., 2022; Yang et al., 2021), the lack of a statistically significant relationship in the present study may reflect unique contextual or demographic factors. University students, despite potentially having access to financial education, may still lack the practical experience and confidence necessary to translate knowledge into concrete investment intentions. This aligns with the argument posed by Y. H. Lee and Ma (2024), who suggested that overconfidence bias, often driven by misjudged self-perceptions of financial literacy, can result in suboptimal or premature investment behaviors. Moreover, Akhter and Hoque (2022) found that financial literacy did not exhibit a direct effect on behavioral intentions, nor did it strengthen the relationship between investors’ attitudes and their intentions to participate in the stock market. They suggested that even financially knowledgeable individuals might perceive the stock market as highly volatile, which could reduce their confidence and discourage investment participation.
The results of this study indicate that risk tolerance positively influences stock market investment intention. This finding aligns with prior research by Behera et al. (2022) and Yang et al. (2021), which shows that individuals with a higher capacity to absorb financial risk are more likely to intend to invest. It suggests that students who are more comfortable with financial uncertainty are also more inclined to engage with the stock market, highlighting the critical role of psychological resilience in investment decision-making.
The findings of this study reveal no significant association between financial well-being and stock market investment intention, aligning with Yang et al. (2021), who similarly reported no direct or mediating effect of financial well-being on stock market participation. A potential explanation for this result could be that even financially secure individuals may still lack confidence or the necessary financial knowledge to engage in stock market activities. Hence, financial well-being alone may not be sufficient to foster investment intention without accompanying behavioral, cognitive, or informational support.
This study investigated how stock market investment intention mediates the link between behavioral and cognitive factors and stock market participation among university students in Uzbekistan. In particular, Bogdan et al. (2023) note that under conditions of uncertainty or limited financial literacy, individuals tend to mimic others’ investment actions as a form of behavioral adaptation. This tendency can enhance participation likelihood by reducing perceived risk. Additionally, Qasim et al. (2019) explain that investors may herd either to avoid potential losses or to pursue gains by following collective trends, while Spyrou (2013) warns that such behavior can lead to market inefficiencies by deviating stock prices from fundamental values. These insights suggest that herding may serve as a psychological anchor for inexperienced investors, including students, thereby reinforcing its influence on investment readiness.
This study’s finding that excessive self-assurance significantly and positively affects individuals’ propensity to invest in the stock market aligns with earlier research emphasizing the behavioral distortions introduced by cognitive biases. Overconfidence leads investors to overrate their knowledge and predictive abilities, which in turn promotes greater investment engagement. This phenomenon is consistent with Bakar and Yi (2016), who reported that overconfident individuals are more likely to make frequent investment decisions and assume greater risks, driven by an inflated sense of control and competence. Moreover, this behavioral trait may increase willingness to participate in the market, even without complete information or adequate analysis. While some studies, such as those by Benayad and Aasri (2023) and Yang et al. (2021), reported no significant relationship between overconfidence and investment decisions, the current findings suggest that, at least within the context of university students, overconfidence may act as a motivational driver that encourages investment intention despite possible limitations in financial knowledge or experience.
The lack of a significant relationship between social interaction and stock market investment intention found in this study deviates from earlier research that emphasized the influence of interpersonal networks on investment decisions (Wu et al., 2018; Yang et al., 2021). One plausible explanation is the limited prevalence of stock market engagement in Uzbekistan, where only a small portion of the population actively participates in financial markets. As a result, opportunities for meaningful social exchange regarding investment practices may be scarce, weakening the role of social influence in shaping investment intentions. Additionally, as noted by Liang and Guo (2015), digital forms of communication may dilute the effectiveness of social interactions in conveying credible financial advice, further diminishing their impact.
The findings of this study reinforce the central role of stock market investment intention as a key determinant of actual stock market participation. Consistent with the Theory of Planned Behavior (Ajzen, 1991), which posits that intention is the most immediate antecedent of behavior, this study provides empirical support for the assertion that individuals with stronger investment intentions are significantly more likely to participate in the stock market. This result aligns with previous research by Sivaramakrishnan et al. (2017) and Yang et al. (2021), both of whom emphasized the predictive strength of intention in financial behaviors. Furthermore, the mediation role identified in prior literature, for instance, by Shehata et al. (2021), is echoed in this study’s findings, suggesting that intention not only reflects internal motivations and attitudes but also serves as a conduit through which various psychological and contextual factors translate into tangible investment actions.
The mediation analysis shows that an investor’s intent to enter the stock market significantly mediates the relationships between digital fluency, propensity for risk-taking, herding behavior, and overconfidence bias with stock market participation. These findings align with the Theory of Planned Behavior (Ajzen, 1991), confirming intention as a key mechanism driving behavior. The strongest mediation effect is observed for risk tolerance and herding behavior, supporting Yang et al. (2021) that intention bridges psychological traits and investment behavior. Notably, digital literacy shows a significant but negative indirect effect, suggesting that greater awareness through digital tools may heighten perceived risks and reduce intention to invest. In contrast, no significant mediating effects were found for financial literacy, financial well-being, and social interaction, indicating these factors may influence participation through other pathways or require additional moderators such as confidence or experience (Akhtar & Das, 2019).
The results from the Multi-Group Analysis reveal that, overall, there are no statistically significant gender or field-based differences in the relationships between most predictors and stock market investment intention. However, one significant gender-based difference was identified in the path from investment intention to stock market participation, with male students showing a stronger effect than female students. This suggests that male students are more likely to translate intention into actual market participation than female students, which may reflect broader socio-cultural or confidence-related disparities.
Based on the comparative analysis between economics and non-economics students, two significant differences emerged. First, the effect of overconfidence bias on investment intention was significantly stronger among economics students, suggesting that those with formal economic training may exhibit greater susceptibility to cognitive biases in investment contexts. Second, the path from social interaction to investment intention showed a significantly stronger effect for non-economics students, indicating that peer influence may play a more prominent role in shaping their financial behavior.
The demographic profile of the respondents provides important context for interpreting the study’s findings. The respondent pool remains predominantly composed of youth aged 17 to 27 (95.66%) and primarily female (59.62%). A notable concentration of respondents is from the Syrdarya region (61.25%), which may introduce regional biases into the findings. In terms of academic affiliation, the majority of participants (71.54%) are from Gulistan State University, followed by Gulistan State Pedagogical Institute (21.14%). This distribution suggests that the results are particularly reflective of the perceptions and behaviors of students within this specific educational and regional context.
University students in developing economies, such as Uzbekistan, frequently demonstrate limited financial knowledge, attitudes, and behaviors, which may hinder their readiness to engage in formal investment activities like stock market participation. In this regard, students’ perceptions and their capacity to identify financial opportunities become critical in shaping their investment intentions. These cognitive and contextual factors are especially relevant as students represent a future segment of investors whose early financial behaviors can influence broader patterns of financial inclusion and market engagement. This view aligns with findings by Garg and Singh (2018), who emphasized that factors such as educational attainment, employment conditions, and family environment significantly shape an individual’s financial competencies and investment-related behaviors. When adapted to the context of Uzbekistan, these insights underscore the relevance of socioeconomic background in influencing university students’ investment preparedness and behavioral intentions.
Beyond the immediate findings of this study, it is crucial to consider the broader socio-economic factors that shape investment activity in Uzbekistan. A significant challenge lies in understanding the motivations behind non-investment, which are frequently rooted in a lack of sufficient knowledge and understanding of capital market instruments and their functioning. This informational asymmetry often leads a substantial segment of the population to retain capital in traditional, often depreciating, forms (e.g., cash holdings), without a clear grasp of inflation’s erosive effects. Furthermore, the prevailing insufficient emphasis on financial literacy within the national education system exacerbates this issue.
Nevertheless, the Uzbek capital market is demonstrably evolving. Recent years have witnessed a notable surge in trading volume and an expansion in the number of active participants. This uptick can be partly attributed to the escalating demand for corporate bonds, a trend amplified by a concurrent reduction in bank deposit interest rates, making alternative investment vehicles more attractive. Concurrently, there is an observable escalation in interest from foreign investors, underscoring growing international confidence in the market’s prospects.
Looking ahead, recent policy initiatives, notably the Resolution of the Cabinet of Ministers of the Republic of Uzbekistan ‘On approval of the regulation on the procedure for opening an individual investment account and accounting for funds on it,’ enacted on June 13, 2024, are poised to catalyze further domestic investment. The forthcoming implementation of Individual Investment Accounts (IIAs) is projected to significantly bolster accessibility and foster broader engagement in the stock market. Despite its current nascent stage of development, the market presents distinct opportunities for the acquisition of securities from established companies at comparatively modest valuations, promising substantial future returns as the market matures and gains depth.

6. Theory and Practical Implications

By incorporating the Theory of Planned Behavior (TPB), this research contributes to the theoretical understanding of stock market behavior. It achieves this by investigating how investment intention mediates the relationship between psychological, cognitive, and social determinants and stock market participation. The findings validate TPB’s premise that behavioral intention serves as a critical predictor of actual behavior, especially in financial decision-making contexts. Notably, the study extends prior literature by incorporating digital literacy as a key variable, offering novel insights into how technological competence intersects with traditional constructs like financial literacy and risk tolerance in shaping investment decisions.
From a practical perspective, the results highlight several actionable implications. First, the negative influence of digital literacy on investment intention suggests that digital competencies alone may not be sufficient without corresponding financial understanding. Therefore, policymakers and educators should emphasize integrated financial and digital literacy programs tailored for students. Second, the significant role of overconfidence bias and herding behavior in shaping intentions underscores the need for psychological and behavioral training in financial education curricula. Lastly, the findings indicate that enhancing students’ investment intentions through targeted interventions may serve as a pathway to increased stock market participation, contributing to the broader goal of financial inclusion and capital market development.
Additionally, institutions such as the Capital Market Development Agency and universities should implement regular workshops, seminars, and awareness campaigns to build students’ confidence in using digital and financial tools effectively. This approach may not only increase participation rates among young investors but also contribute to the broader development of Uzbekistan’s financial sector.

7. Limitations and Future Research

Despite offering valuable insights into the behavioral determinants of stock market participation among university students in Uzbekistan, this study is subject to several limitations that warrant acknowledgment and offer clear avenues for future research.
Firstly, the use of a cross-sectional survey design inherently restricts our ability to infer causal relationships between the constructs. Longitudinal data would provide stronger evidence of directionality and allow for the tracking of behavioral changes over time, offering a more dynamic understanding of investment engagement.
Secondly, the sampling strategy employed was based on convenience sampling, with a heavy concentration in the Syrdarya region (61.25%) and predominantly drawn from two specific institutions: Gulistan State University (71.54%) and Gulistan State Pedagogical Institute (21.14%). Such a geographical and institutional concentration limits the generalizability of our findings, preventing their direct transferability to the broader Uzbek population, students in other regions, or diverse demographics within other emerging economies.
Thirdly, our reliance on self-reported data is inherently susceptible to biases such as social desirability and recall bias, which may affect the accuracy of the responses. While measures were taken to ensure anonymity, the absence of qualitative triangulation, such as through interviews or focus groups, means we could not independently verify certain perceptions or behaviors. Future research could enhance the robustness of findings by incorporating such mixed-methods approaches, providing richer contextual insights and validating quantitative results.
Additionally, a minor methodological limitation was observed in the convergent validity of the ‘financial well-being’ construct, as its Average Variance Extracted (AVE) fell marginally below the recommended 0.50 threshold (AVE = 0.432). While theoretically justified for retention in this study, future research should aim to refine the measurement scale for financial well-being, potentially through qualitative pre-testing or by exploring alternative item formulations, to enhance its convergent validity in this specific context.
Finally, while the model incorporated several key psychological and financial factors, other potentially influential variables, such as economic policy uncertainty, varying levels of trust in financial institutions, or deeper cultural attitudes towards risk and saving, were not considered. Future research should address these limitations by incorporating broader, more diverse, and representative samples, utilizing longitudinal designs where feasible, and employing mixed-method approaches to enrich the validity and generalizability of the findings and further expand the theoretical model.

8. Conclusions

This study examined the determinants influencing stock market participation among university students in Uzbekistan, incorporating behavioral constructs such as risk tolerance, financial well-being, financial literacy, digital literacy, overconfidence bias, herding behavior, and social interaction, within the framework of the Theory of Planned Behavior (TPB). The findings affirm that stock market investment intention plays a critical mediating role between these psychological and cognitive factors and actual market participation. Notably, digital literacy exhibited a significant negative effect on investment intention, suggesting that technological competencies alone may not suffice without accompanying financial knowledge and confidence. Conversely, risk tolerance and overconfidence bias were positively associated with intention, reflecting the role of behavioral tendencies in investment decisions.
The study contributes to the growing body of literature on behavioral finance in emerging markets, particularly by focusing on university students—a demographic often overlooked in financial research despite its long-term importance. By emphasizing behavioral intentions as a mediator, the study validates the TPB framework in the context of developing financial markets and young investor segments.
Beyond these theoretical contributions, our findings carry significant practical implications for curriculum development within Uzbek universities aimed at fostering greater financial engagement among students. Given the observed negative impact of digital literacy on investment intention, curricula should move beyond basic technological proficiency. Instead, they must cultivate a critical digital literacy that equips students to evaluate online financial information, identify misinformation, understand cybersecurity risks, and discern the complexities and potential pitfalls of digital investment platforms.
Furthermore, integrating core concepts of behavioral finance is essential. Universities could introduce modules or dedicated courses that explore cognitive biases (like overconfidence bias, which we found to be positively associated with intention), emotional influences on decision-making, and the psychology of risk perception. Such education would empower students to recognize and mitigate their own behavioral tendencies that might lead to suboptimal investment choices. Concurrently, enhancing risk awareness should be a priority, focusing not just on the abstract concept of risk but also on practical aspects like risk-return tradeoffs, diversification strategies, and personal risk profiling in the context of stock market investments. This could be achieved through interactive workshops, investment simulations, and case studies integrated into economics, business, and even general education programs, thereby moving beyond traditional financial literacy to a more holistic understanding of financial decision-making in a digital age. These targeted educational interventions are vital for building a generation of informed and confident investors, ultimately contributing to the vibrancy and stability of Uzbekistan’s nascent capital market.

Author Contributions

Conceptualization, D.E. and A.A.; methodology, D.E.; software, D.E.; validation, D.E.; formal analysis, D.E.; investigation, D.E. and G.B.; resources, D.E. and G.B.; data curation, D.E. and G.B.; writing—original draft preparation, D.E.; writing—review and editing, D.E. and A.A.; visualization, D.E.; supervision, A.A.; project administration, D.E., funding acquisition, D.E., G.B. and A.A. All authors have read and agreed to the published version of the manuscript.

Funding

This research received no external funding.

Institutional Review Board Statement

The study was conducted on a voluntary and anonymous basis among students. Ethical review and approval were waived for this study by the Scientific and Technical Council of Gulistan State University (Exemption Protocol Code: 4, Date of Exemption: 22 July 2025), as the research involved only anonymous survey procedures and posed no more than minimal risk to participants. This study has been performed in accordance with the Declaration of Helsinki.

Informed Consent Statement

Informed consent was obtained from all subjects involved in the study. Participation in the online survey was voluntary, and completion of the survey was considered implied informed consent.

Data Availability Statement

The data are available from the author and can be produced upon request.

Acknowledgments

We would like to thank the HIVE courses program carried out by the Lab for Social and Human Capital (Uzbekistan) for feedback and support with the methodological framework. The author gratefully acknowledges the support provided by the Center for Policy Research and Outreach (CPRO) at Westminster International University in Tashkent for their methodological guidance in assessing the financial literacy of respondents. Their insights and expertise significantly contributed to the design and evaluation of the survey instrument used in this study.

Conflicts of Interest

The authors declare no conflicts of interest.

Abbreviations

The following abbreviations are used in this manuscript:
OECDOrganisation for Economic Co-operation and Development
INFEInternational Network on Financial Education

Appendix A

Table A1. Research instrument.
Key ConstructsItems Description
Digital Competencies Adapted from Choi et al. (2023)
Tolerance for riskInvesting in the stock market feels like a risky choice
I’m worried about losing money because of how unpredictable the stock market is
I’d rather put my money into stocks than keep it in a bank account
I view investment risks as opportunities
I see myself as someone willing to take high risks
Financial stabilityI’m actively working to secure my financial future
I’m currently falling behind with my finances
My financial situation dictates how I live my life
I’m just barely managing financially
I’m concerned that my current savings or future savings won’t be enough
Behavioral herdingThe amount I invest often depends on what others (like my broker or a financial consultant) think
I feel confident in the accuracy of my investment choices
I trust information about investments that comes from my friends
I trust information about investments that comes from my colleagues
I trust information about investments that comes from my relatives
Investor overconfidenceI trust my own judgment when it comes to evaluating the securities prices in my investment portfolio
My past profitable investments were mostly thanks to my unique investment skills
I’m good at predicting future stock prices
I feel capable of evaluating securities prices in my investment portfolio on my own.
I believe my market knowledge and skills enable me to beat the market
Social influenceI maintain close social relationships with my friends who are also investors
I spend a lot of time interacting with my friends who are investors.
I communicate frequently with my friends who are investors
I’m very active in conversations related to investing
I genuinely enjoy discussing investments with other people (investors)
The intention behind stock investmentsI plan to invest in the stock market frequently
I will encourage my friends and family to invest in the stock market
I intend to invest in the stock market in the near future
I believe the Stock Exchange is an appealing investment channel
Direct involvement in the stock marketMy investment portfolio is diversified across various asset classes (e.g., stocks, bonds, cash, real estate)
I invest in stocks that I am confident will grow significantly in the future
I prioritize investing in stocks that promise quick profits
I frequently buy and sell stocks/shares
I manage my portfolio primarily for maximum gross return, rather than focusing on tax or cost efficiency.
Table A2. Survey instrument for assessing financial literacy.
Financial KnowledgeAnswer
Imagine that five brothers were given 10 million soums as a gift. If the brothers divide the money equally, how much will each of them receive?Open answer
Now imagine brothers have to wait a year to get their share. What they can buy today in a year more
the same amount
fewer goods
I don’t know
Let’s say you deposit $100 into a foreign currency savings account with a guaranteed interest rate of 5% per annum. No additional deposits or withdrawals will be made from the account. How much money will be in your account at the end of the first year after the interest is paid?Open answer
And how much will be in this account in five years?over $110
Exactly $110
Less than $110
Cannot be determined from the given information
Investments with high returns have high riskTrue
False
High inflation means a rapid rise in the cost of livingTrue
False
I don’t know
The more diversified your savings, the lower the risk of losing all your moneyTrue
False
I don’t know
Financial relations
I prefer to spend money rather than save it for a long time!Completely agree
Partially agree
Completely disagree
I live for today and don’t think about tomorrow (I believe it will be good on its own!)Completely agree
Partially agree
Completely disagree
Financial actions
Who makes decisions about financial expenses in your family?Myself
I make financial decisions after consulting with my family members.
These decisions are made by individuals outside of your family.
I don’t know
I carefully monitor my financial affairs (income and expenses)Never
Rarely
Often
Always
I don’t know
What savings instruments have you used in the last 12 months?In national currency at home in cash
In foreign currency in cash
I bought livestock
I received agricultural products during the season (wheat, feed, etc.)
I kept it in national currency in a bank deposit
I kept it in foreign currency in a bank deposit.
I bought bonds
I bought cryptocurrency
I participated in a local informal savings game (local informal savings game)
I bought stocks
I participated in various gambling games (X-bet, online casinos)
I bought a car
I bought a house
I invested in my acquaintance’s business
I engaged in online trading activities.
Other _______
I haven’t saved money
Did your living expenses exceed your income in the last 12 months?Yes/No
What measures did you take the last time this happened?I withdrew money from the deposit
I reduced expenses, spent less, postponed the planned expenses.
Finding additional work
I requested financial assistance from the government.
I borrowed money from my family and friends
I got a loan or salary advance from my employer
I took out a loan by pledging my valuables.
I used bank loans
I got an online loan
I missed payments
Other________
Which of the following financial services have you used?Consumer credit
Bank current account
Bank transaction account
Currency exchange
Credit card
Debit card (bank plastic card)
Mortgage loan
Internet, mobile banking
Insurance policies
Leasing services
Investments in company shares
Domestic and foreign money transfers
Other services
None
Table A3. All items removed from Everyday Digital Literacy Questionnaire after reliability and validity tests.
Item NumberQuestion
5Save Internet documents, photos, or video files you find
9Express my opinion of “like/dislike” on others’ posts
10Comment on others’ posts
13Take photos or videos using digital devices
15Upload Internet posts using digital devices
16Upload pictures or videos using digital devices
17Convert document formats using digital devices
22Change device passwords
23Delete files stored on the device
27Be aware of the mental side effects that can result from excessive device use
28Independently troubleshoot issues related to device/app installation

References

  1. Ahmad, M., & Shah, S. Z. A. (2020). Overconfidence heuristic-driven bias in investment decision-making and performance: Mediating effects of risk perception and moderating effects of financial literacy. Journal of Economic and Administrative Sciences, 38(1), 60–90. [Google Scholar] [CrossRef]
  2. Ajzen, I. (1991). The theory of planned behavior. Organizational Behavior and Human Decision Processes, 50(2), 179–211. [Google Scholar] [CrossRef]
  3. Ajzen, I., & Driver, B. L. (1992). Application of the theory of planned behavior to leisure choice. Journal of Leisure Research, 24(3), 207–224. [Google Scholar] [CrossRef]
  4. Akhtar, F., & Das, N. (2019). Predictors of investment intention in Indian stock markets: Extending the theory of planned behaviour. International Journal of Bank Marketing, 37(1), 97–119. [Google Scholar] [CrossRef]
  5. Akhter, T., & Hoque, M. E. (2022). Moderating effects of financial cognitive abilities and considerations on the attitude–intentions nexus of stock market participation. International Journal of Financial Studies, 10(1), 5. [Google Scholar] [CrossRef]
  6. Al-Afeef, M. A., & Alsmadi, A. A. (2025). Digital empowerment: Unraveling the impact of digital literacy on financial mastery. Discover Sustainability, 6(1), 311. [Google Scholar] [CrossRef]
  7. Aristei, D., & Gallo, M. (2021). Financial knowledge, confidence, and sustainable financial behavior. Sustainability, 13(19), 10926. [Google Scholar] [CrossRef]
  8. Bakar, S., & Yi, A. N. C. (2016). The impact of psychological factors on investors’ decision making in Malaysian stock market: A case of Klang Valley and Pahang. Procedia Economics and Finance, 35, 319–328. [Google Scholar] [CrossRef]
  9. Behera, Y. D. P., Nanda, S. S., Sharma, S., & Sahoo, T. R. (2022). Examining risk absorption capacity as a mediating factor in the relationship between cognition and neuroplasticity in investors in investment decision making. International Journal of Financial Studies, 10(1), 21. [Google Scholar] [CrossRef]
  10. Benayad, K., & Aasri, M. R. (2023). Behavioral biases and investment decisions of SMEs managers: Empirical analysis within the Moroccan context. International Journal of Financial Studies, 11(4), 120. [Google Scholar] [CrossRef]
  11. Bhat, S. A., Lone, U. M., SivaKumar, A., & Krishna, U. G. (2025). Digital financial literacy and financial well-being–evidence from India. International Journal of Bank Marketing, 43(3), 522–548. [Google Scholar] [CrossRef]
  12. Bogdan, S., Brmalj, N., & Mujačević, E. (2023). Impact of liquidity and investors sentiment on herd behavior in cryptocurrency market. International Journal of Financial Studies, 11(3), 97. [Google Scholar] [CrossRef]
  13. Bondia, R., Biswal, P. C., & Panda, A. (2019). The unspoken facets of buying by individual investors in Indian stock market. Review of Behavioral Finance, 11(3), 324–351. [Google Scholar] [CrossRef]
  14. Cepeda-Carrion, G., Cegarra-Navarro, J. G., & Cillo, V. (2019). Tips to use partial least squares structural equation modelling (PLS-SEM) in knowledge management. Journal of Knowledge Management, 23(1), 67–89. [Google Scholar] [CrossRef]
  15. Choi, J., Choi, S., Song, K., Baek, J., Kim, H., Choi, M., Kim, Y., Chu, S. H., & Shin, J. (2023). Everyday digital literacy questionnaire for older adults: Instrument development and validation study. Journal of Medical Internet Research, 25, e51616. [Google Scholar] [CrossRef] [PubMed]
  16. Enescu, A. G., & Raileanu Szeles, M. (2024). Portfolio allocation, risk aversion, and digital literacy among the European elderly. Economics, 18(1), 20220072. [Google Scholar] [CrossRef]
  17. Faul, F., Erdfelder, E., Buchner, A., & Lang, A. G. (2009). Statistical power analyses using G* Power 3.1: Tests for correlation and regression analyses. Behavior Research Methods, 41(4), 1149–1160. [Google Scholar] [CrossRef] [PubMed]
  18. Fornell, C., & Larcker, D. F. (1981). Evaluating structural equation models with unobservable variables and measurement error. Journal of Marketing Research, 18(1), 39–50. [Google Scholar] [CrossRef]
  19. Garg, N., & Singh, S. (2018). Financial literacy among youth. International Journal of Social Economics, 45(1), 173–186. [Google Scholar] [CrossRef]
  20. Grable, J. E., & Joo, S. H. (2004). Environmental and biopsychosocial factors associated with financial risk tolerance. Financial Counseling and Planning, 15(1), 73–82. [Google Scholar]
  21. Hair, J. F., Black, W. C., Babin, B. J., & Anderson, R. E. (2014). Multivariate data analysis (7th ed.). Pearson new international edition. Pearson Education. [Google Scholar]
  22. Hair, J. F., Jr., Hult, G. T. M., Ringle, C. M., Sarstedt, M., Danks, N. P., & Ray, S. (2021). Partial least squares structural equation modeling (PLS-SEM) using R: A workbook (p. 197). Springer Nature. [Google Scholar]
  23. Khan, M. T. I., Tan, S. H., & Chong, L. L. (2017). Active trading and retail investors in Malaysia. International Journal of Emerging Markets, 12(4), 708–726. [Google Scholar] [CrossRef]
  24. Kiril, K. O. S. S. E. V. (2020). OECD/INFE 2020 international survey of adult financial literacy. OECD Publishing. [Google Scholar]
  25. Kock, N. (2015). Common method bias in PLS-SEM: A full collinearity assessment approach. International Journal of e-Collaboration (IJEC), 11(4), 1–10. [Google Scholar] [CrossRef]
  26. Kukacka, J., & Barunik, J. (2013). Behavioural breaks in the heterogeneous agent model: The impact of herding, overconfidence, and market sentiment. Physica A: Statistical Mechanics and its Applications, 392(23), 5920–5938. [Google Scholar] [CrossRef]
  27. Kumar, S., & Goyal, N. (2015). Behavioural biases in investment decision making—A systematic literature review. Qualitative Research in Financial Markets, 7(1), 88–108. [Google Scholar] [CrossRef]
  28. Lee, J. M., Lee, J., & Kim, K. T. (2020). Consumer financial well-being: Knowledge is not enough. Journal of Family and Economic Issues, 41(2), 218–228. [Google Scholar] [CrossRef]
  29. Lee, Y. H., & Ma, W. (2024). The relationship between financial literacy misestimation and misplacement from the perspective of inverse differential information and stock market participation. International Journal of Financial Studies, 12(3), 81. [Google Scholar] [CrossRef]
  30. Liang, P., & Guo, S. (2015). Social interaction, Internet access and stock market participation—An empirical study in China. Journal of Comparative Economics, 43(4), 883–901. [Google Scholar] [CrossRef]
  31. Lu, Z., Wu, J., Li, H., & Galloway, B. (2024). Digital finance and stock market participation: The case of internet wealth management products in China. Economic Systems, 48(1), 101148. [Google Scholar] [CrossRef]
  32. Luo, Z., Azam, S. F., & Wang, L. (2023). Impact of financial literacy on household stock profit level in China. PLoS ONE, 18(12), e0296100. [Google Scholar] [CrossRef] [PubMed]
  33. Lyngdoh, S. W., Das, S., & Das, T. (2025). Investment intentions and influential factors among university students. Choices, 5, 6. [Google Scholar] [CrossRef]
  34. Nadeem, M. A., Qamar, M. A. J., Nazir, M. S., Ahmad, I., Timoshin, A., & Shehzad, K. (2020). How investors attitudes shape stock market participation in the presence of financial self-efficacy. Frontiers in Psychology, 11, 553351. [Google Scholar] [CrossRef] [PubMed]
  35. Owen, M. A. (2020). Stock market development and economic growth: Empirical evidence from an institutional impaired economy. International Journal of Financial Research, 11(5), 496–509. [Google Scholar] [CrossRef]
  36. Pak, O., & Mahmood, M. (2015). Impact of personality on risk tolerance and investment decisions: A study on potential investors of Kazakhstan. International Journal of Commerce and Management, 25(4), 370–384. [Google Scholar] [CrossRef]
  37. Peng, D. X., & Lai, F. (2012). Using partial least squares in operations management research: A practical guideline and summary of past research. Journal of Operations Management, 30(6), 467–480. [Google Scholar] [CrossRef]
  38. P.H., H., & Uchil, R. (2020). Impact of investor sentiment on decision-making in Indian stock market: An empirical analysis. Journal of Advances in Management Research, 17(1), 66–83. [Google Scholar] [CrossRef]
  39. Qasim, M., Hussain, R., Mehboob, I., & Arshad, M. (2019). Impact of herding behavior and overconfidence bias on investors’ decision-making in Pakistan. Accounting, 5(2), 81–90. [Google Scholar] [CrossRef]
  40. Ringle, C. M., Sarstedt, M., & Straub, D. W. (2012). Editor’s comments: A critical look at the use of PLS-SEM in” MIS Quarterly”. MIS Quarterly, 36, 3–14. [Google Scholar] [CrossRef]
  41. Sarwar, A., & Afaf, G. (2016). A comparison between psychological and economic factors affecting individual investor’s decision-making behavior. Cogent Business & Management, 3(1), 1232907. [Google Scholar]
  42. Shehata, S. M., Abdeljawad, A. M., Mazouz, L. A., Aldossary, L. Y. K., Alsaeed, M. Y., & Noureldin Sayed, M. (2021). The moderating role of perceived risks in the relationship between financial knowledge and the intention to invest in the Saudi Arabian stock market. International Journal of Financial Studies, 9(1), 9. [Google Scholar] [CrossRef]
  43. Sivaramakrishnan, S., Srivastava, M., & Rastogi, A. (2017). Attitudinal factors, financial literacy, and stock market participation. International Journal of Bank Marketing, 35(5), 818–841. [Google Scholar] [CrossRef]
  44. Spyrou, S. (2013). Herding in financial markets: A review of the literature. Review of Behavioral Finance, 5(2), 175–194. [Google Scholar] [CrossRef]
  45. Tulcanaza-Prieto, A. B., Cortez-Ordoñez, A., Rivera, J., & Lee, C. W. (2025). Is digital literacy a moderator variable in the relationship between financial literacy, financial inclusion, and financial well-being in the ecuadorian context? Sustainability, 17(6), 2476. [Google Scholar] [CrossRef]
  46. Wang, Q., Liu, C., & Lan, S. (2023). Digital literacy and financial market participation of middle-aged and elderly adults in China. Economic and Political Studies, 11(4), 441–468. [Google Scholar] [CrossRef]
  47. Wu, W., Huang, V., Chen, X., Davison, R. M., & Hua, Z. (2018). Social value and online social shopping intention: The moderating role of experience. Information Technology & People, 31(3), 688–711. [Google Scholar] [CrossRef]
  48. Xiao, J. J., & Porto, N. (2017). Financial education and financial satisfaction: Financial literacy, behavior, and capability as mediators. International Journal of Bank Marketing, 35(5), 805–817. [Google Scholar] [CrossRef]
  49. Xu, S., Yang, Z., Ali, S. T., Li, Y., & Cui, J. (2022). Does financial literacy affect household financial behavior? The role of limited attention. Frontiers in Psychology, 13, 906153. [Google Scholar] [CrossRef] [PubMed]
  50. Yang, M., Mamun, A. A., Mohiuddin, M., Al-Shami, S. S. A., & Zainol, N. R. (2021). Predicting stock market investment intention and behavior among Malaysian working adults using partial least squares structural equation modeling. Mathematics, 9(8), 873. [Google Scholar] [CrossRef]
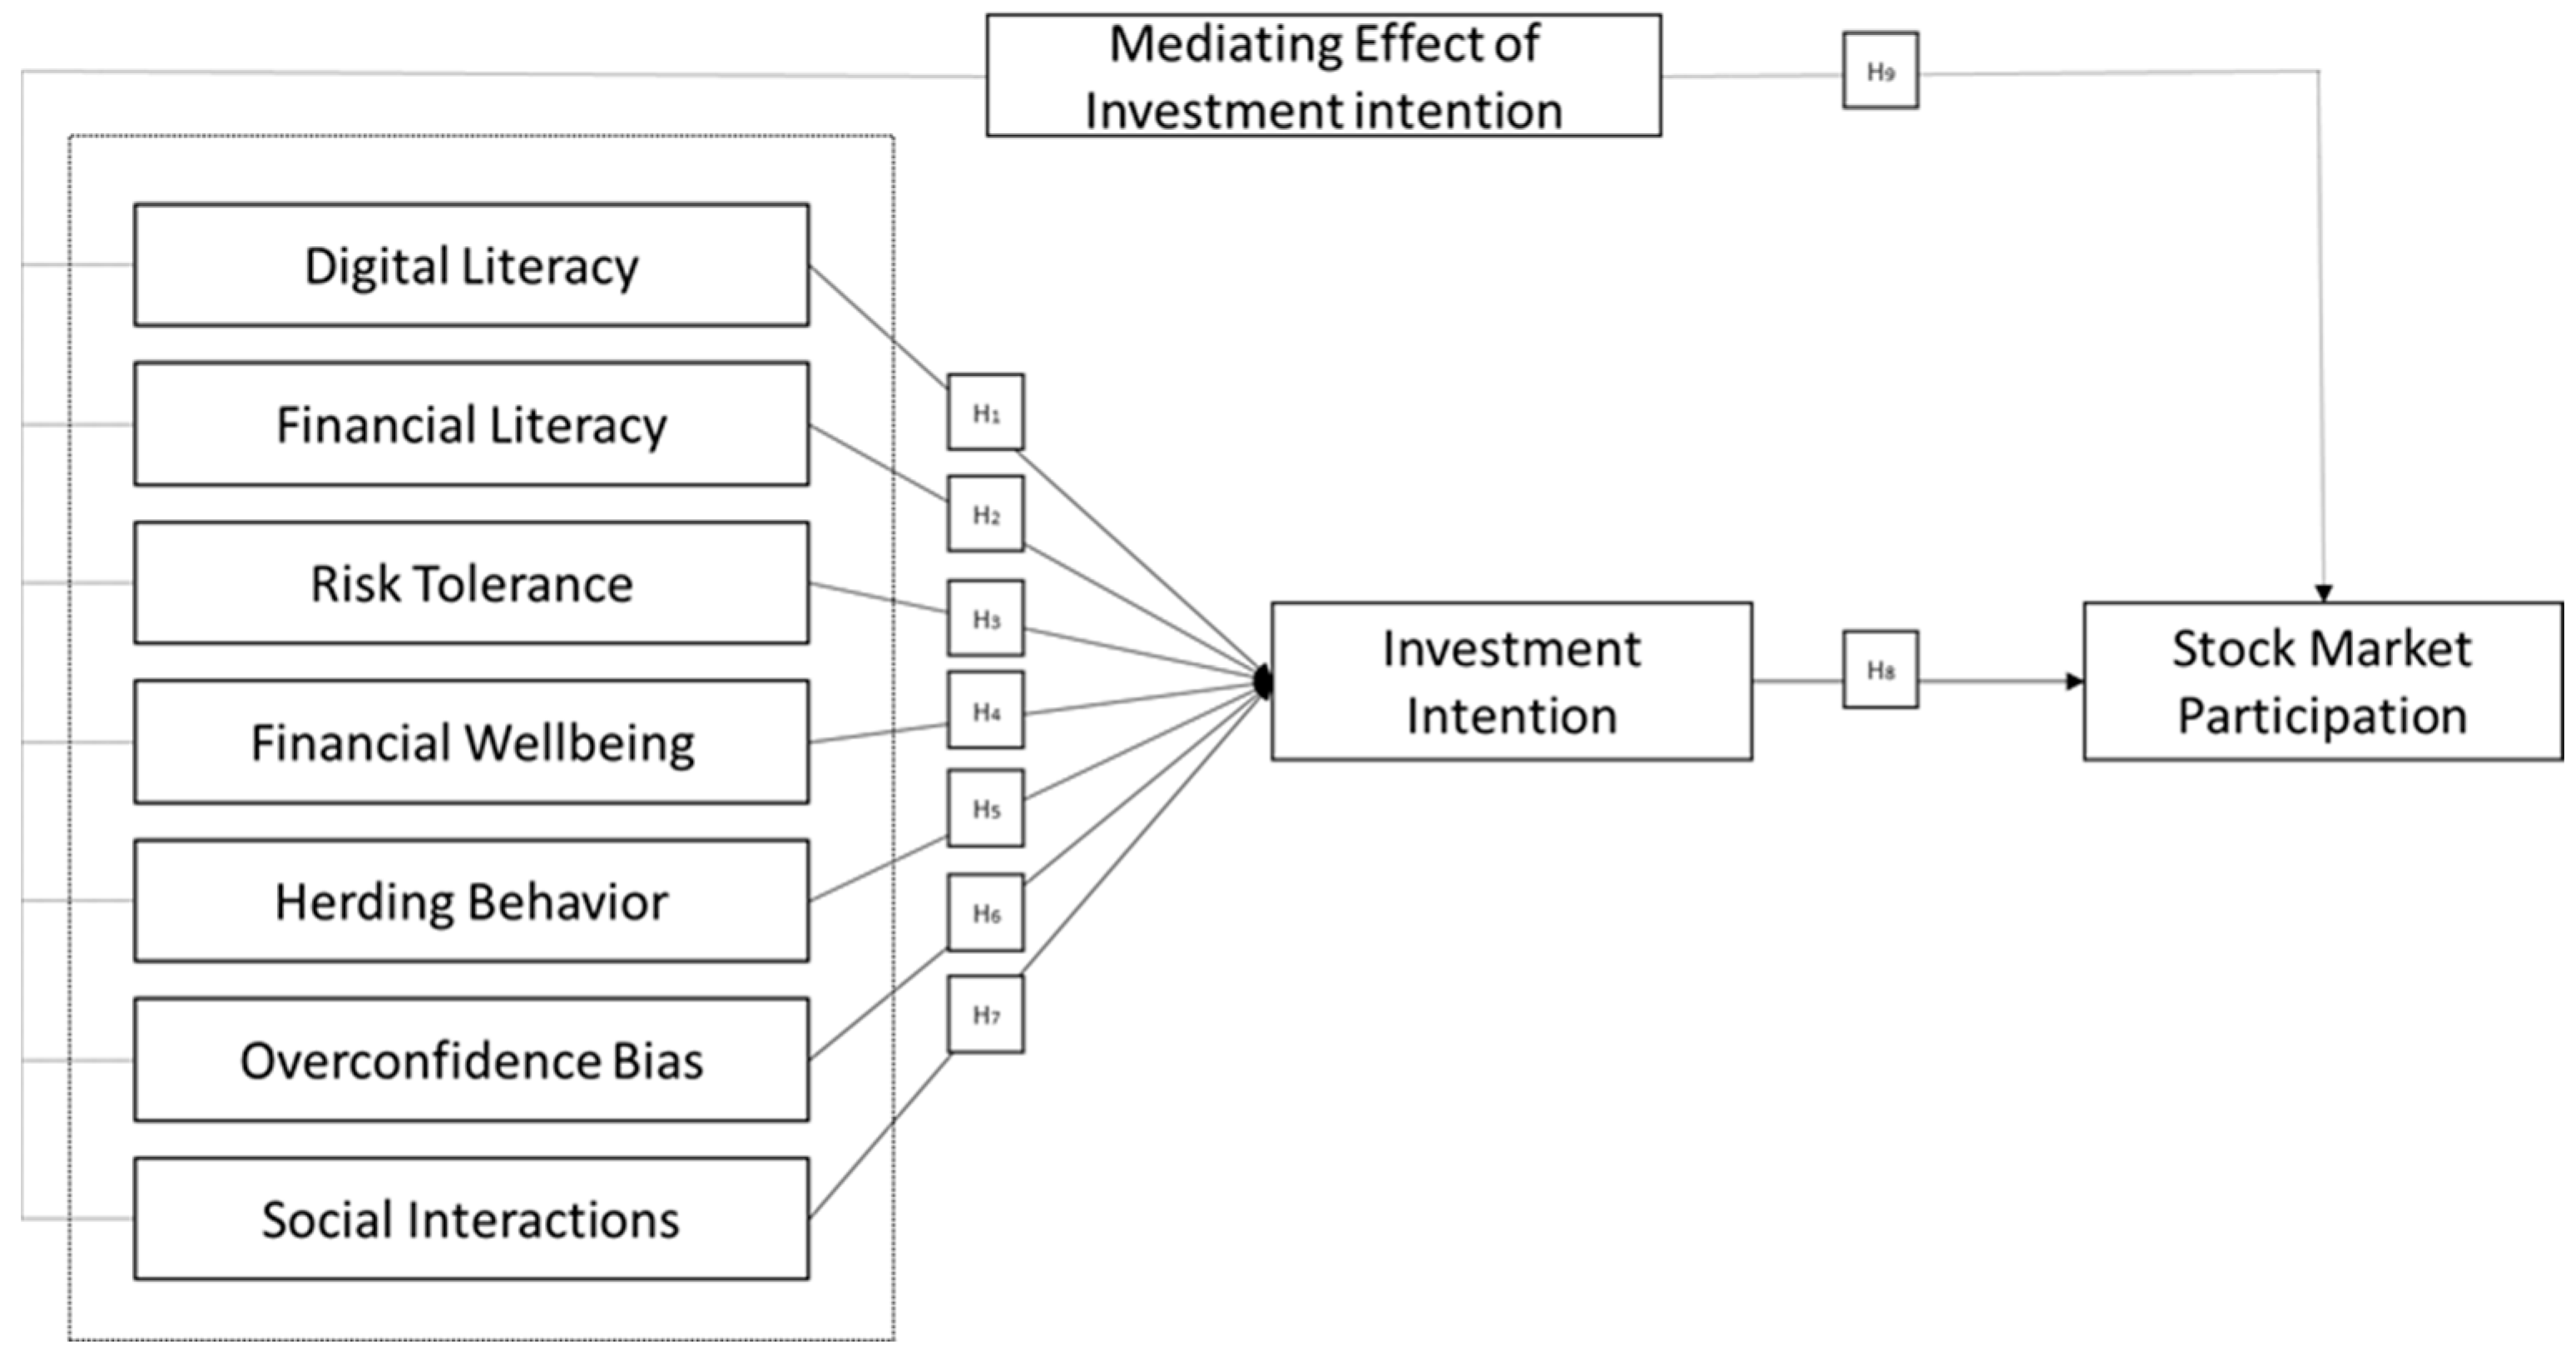
Figure 1. A visual model.
Ijfs 13 00138 g001
Table 1. Summary of hypotheses and expected relationships.
Hypothesis No.Hypothesis StatementExpected Relationship
H1Digital Literacy positively influences Investment Intention.Positive
H2Financial Literacy positively influences Investment Intention.Positive
H3Risk Tolerance positively influences Investment Intention.Positive
H4Financial Wellbeing positively influences Investment Intention.Positive
H5Herding Behavior positively influences Investment Intention.Positive
H6Overconfidence Bias positively influences Investment Intention.Positive
H7Social Interactions positively influence Investment Intention.Positive
H8Investment Intention positively influences Stock Market Participation.Positive
H9Investment intention serves as a mediating factor, channeling the influence of all independent variables on stock market participation.Mediating
Source: Author’s data analysis.
Table 2. Demographic characteristics.
n% n%
Region Gender
Andijan region51.4Female22059.6
Bukhara region82.2Male14940.4
Fergana region123.3Total369100.0
Jizzakh region4512.2
Kashkadarya region133.5Age group
Khorazm region102.717 to 2735395.6
Namangan region30.828 to 37133.5
Navoi region51.438 to 4730.8
Republic of Karakalpakistan51.4Total369100.0
Samarkand region113.0
Surkhandarya region10.3Financial literacy
Syrdarya region22661.3Not Financially Literate32889.0
Tashkent city30.8Financially Literate4111.0
Tashkent region226.0Total369100.0
Total369100.0
Affilation
Gulistan State Pedagogical Institute7821.1
Gulistan state university26471.5
National University of Uzbekistan102.7
Yangiyer University of Chemical Technologies174.6
Total369100.0
Table 3. Reliability and validity.
VariablesNo. ItemsMeanSDCACRDG rhoAVEVIF
RT53.0101.3030.8390.8850.8620.6062.070
FW52.9681.2870.6860.7900.6690.4321.694
DL193.6541.3720.9690.9710.9770.6423.347
OB52.9891.2880.9230.9420.9250.7642.975
HB52.8641.2040.8720.9080.8740.6642.483
SI53.1331.2500.9120.9340.9150.7402.831
INT42.4921.2890.8620.9060.8680.7082.575
SMP52.3601.3050.8780.9110.8890.6742.272
RT53.0101.3030.8390.8850.8620.6062.070
Note: SI: Social Interaction; FW: Financial Wellbeing; OB: Overconfidence Bias; HB: Herding Behavior; FL: Financial Literacy; INT: Investment Intention; SMP: Stock Market Participation; RT: Risk Tolerance; DG rho: Dillon-Goldstein’s rho; CA: Cronbach’s Alpha; CR: Composite Reliability; AVE: Average Variance Extracted; SD: Standard Deviation; VIF: Variance Inflation Factors. Source: Author’s data analysis.
Table 4. Discriminant validity.
DLFWHBINTOBRTSISMP
DL0.801
FW0.4850.657
HB0.4090.4230.815
INT0.2410.2870.4770.842
OB0.4850.3900.6390.4580.874
RT0.5170.4410.3610.4550.4180.779
SI0.4280.4090.6860.4380.5790.4080.860
SMP0.2210.2320.4600.6150.4240.3600.4960.821
Note: INT: Investment Intention; SI: Social Interaction; FW: Financial Wellbeing; OB: Overconfidence Bias; HB: Herding Behavior; RT: Risk Tolerance; FL: Financial Literacy; SMP: Stock Market Participation. Source: researchers’ calculations.
Table 5. Construct loadings and cross-loadings.
CodeDLFWHBINTOBRTSISMP
DL10.7230.3910.3310.1070.3380.3850.3140.102
DL110.7870.3850.3030.1570.3810.4090.3320.122
DL120.8410.4090.3140.1750.3970.4410.3500.154
DL140.8510.4350.3270.0990.3920.4570.3170.118
DL180.8090.4270.3710.2030.3760.4400.3800.196
DL190.7340.3250.2770.2010.3720.3110.3110.203
DL20.6730.3940.2850.1350.3570.3280.2600.117
DL200.7780.3080.3280.2570.4510.3710.3580.231
DL210.8530.3650.2940.1510.3540.4550.3330.118
DL240.8640.3970.3250.1920.3570.4510.3640.196
DL250.7760.3610.3210.2880.4030.3900.3460.223
DL260.8550.4050.3380.1940.4180.4410.3420.162
DL290.8530.4220.3620.2130.4440.4200.4150.195
DL30.6740.4100.3080.1890.3780.3990.2920.203
DL300.8670.4130.4220.2230.5060.4470.4160.236
DL40.8460.4210.3440.1440.3530.4730.3480.168
DL60.8320.4080.3080.1490.3210.4550.3390.105
DL70.7610.3460.2980.1800.3370.3960.2950.151
DL80.8010.4190.3220.1840.3140.4260.3100.188
FW10.5790.5960.4430.2380.4470.4760.4600.234
FW20.4310.7480.3860.2070.3640.3320.3930.223
FW30.1120.5990.1240.1540.1140.1360.0940.050
FW40.1320.6840.1530.1790.1120.1820.1240.123
FW50.1370.6460.1350.1110.0730.1930.0970.031
HB10.2750.3310.7060.3790.4410.3030.4270.321
HB20.4550.3600.7780.4400.6470.4020.5860.435
HB30.3520.3640.8820.3790.5270.2530.5820.356
HB40.3070.3450.8620.3810.4910.2720.5900.363
HB50.2430.3100.8340.3400.4580.2100.5950.383
INT10.0770.1780.3630.7700.3210.2670.3360.521
INT20.1380.2220.3610.8260.3400.3090.3350.474
INT30.2790.2620.4240.8920.4360.4550.4040.544
INT40.2920.2950.4480.8720.4320.4790.3940.529
OB10.3970.3130.5670.4130.8650.3430.5110.375
OB20.4010.3200.5120.3520.8850.3520.4810.326
OB30.4140.3750.5340.3860.8510.3550.4840.352
OB40.4230.3500.5880.4280.9060.3840.5130.389
OB50.4790.3440.5810.4120.8630.3900.5350.401
RT10.3250.3030.2940.3140.3800.7300.3240.221
RT20.4050.3490.3260.3890.4020.8310.3650.300
RT30.4540.3580.3140.4500.3330.8210.3490.372
RT40.3960.3690.2340.2560.2510.7260.3110.216
RT50.4260.3480.2180.3110.2410.7800.2240.248
SI10.4130.3590.5950.3470.5180.3950.8540.427
SI20.3230.3440.5930.3820.4690.3240.8650.428
SI30.3500.3820.5900.3450.4810.3190.8740.405
SI40.3860.3520.5920.4180.5210.3600.8690.455
SI50.3700.3250.5800.3840.4990.3540.8370.413
SMP10.0940.1400.3570.3880.2700.1550.3950.716
SMP20.2020.1710.3670.5520.3650.3520.4090.866
SMP30.2980.2460.4290.5490.4310.3960.4680.850
SMP40.0190.1340.3170.4800.2450.1460.3350.807
SMP50.2580.2450.4160.5330.4030.3780.4280.855
Note: SI: Social Interaction; FW: Financial Wellbeing; OB: Overconfidence Bias; HB: Herding Behavior; FL: Financial Literacy; INT: Investment Intention; SMP: Stock Market Participation; RT: Risk Tolerance. Source: researchers’ calculations.
Table 6. Path coefficients.
Hypo BetaCI-MinCI-Maxtpr2f2Q2Decision
Determinants of Stock Market Investment Intention
H1DL → INT−0.149−0.261−0.0312.5350.0110.4490.0340.317Accept
H2FL → INT−0.048−0.1400.0451.0020.3160.004Reject
H3RT → INT0.3350.2260.4475.8840.0000.187Accept
H4FW → INT0.003−0.1270.1340.0440.9650.002Reject
H5HB → INT0.2270.0650.3752.8970.0040.053Accept
H6OB → INT0.1830.0490.3132.7230.0060.053Accept
H7SI → INT0.113−0.0340.2681.4640.1430.004Reject
Determinants of Stock Market Participation
H8INT → SMP0.6150.5320.69215.0400.0000.4900.9610.240Accept
Note: SI: Social Interaction; FW: Financial Wellbeing; OB: Overconfidence Bias; HB: Herding Behavior; FL: Financial Literacy; INT: Investment Intention; SMP: Stock Market Participation; RT: Risk Tolerance. Source: Author’s data analysis.
Table 7. Mediating effects.
AssociationsBetaCI-MinCI-MaxtpDecision
DL → INT → SMP−0.092−0.161−0.0192.5040.012Accept
FL → INT → SMP−0.029−0.0870.0291.0000.318Reject
RT → INT → SMP0.2060.1360.2845.4300.000Accept
FW → INT → SMP0.002−0.0790.0820.0440.965Reject
HB → INT → SMP0.1400.0400.2352.8340.005Accept
OB → INT → SMP0.1130.0290.1952.6780.007Accept
SI → INT → SMP0.069−0.0200.1691.4350.151Reject
Note: SI: Social Interaction; SMP: Stock Market Participation; FW: Financial Wellbeing; HB: Herding Behavior; FL: Financial Literacy; OB: Overconfidence Bias; INT: Investment Intention; RT: Risk Tolerance. Source: researchers’ calculations.
Table 8. Multi-Group Analysis.
FemaleMaleDifference
Betap-ValueBetap-ValueBetap-ValueDecision
DL → INT−0.1040.157−0.1870.0720.0830.498No Difference
FL → INT−0.1260.0320.0100.905−0.1350.174No Difference
RT → INT0.4030.0000.2500.0030.1530.176No Difference
FW → INT−0.0940.2170.0850.398−0.1790.159No Difference
HB → INT0.2340.0230.2420.023−0.0080.965No Difference
OB → INT0.1880.0360.2250.056−0.0370.802No Difference
SI → INT0.0840.3790.1120.365−0.0280.866No Difference
INT → SMP0.5170.0000.7060.000−0.1890.015Sig. Difference
Economics FieldsNon Economics FieldsDifference
Betap-valueBetap-valueBetap-valueDecision
DL → INT−0.1640.171−0.0920.263−0.0720.566No Difference
FL → INT−0.0540.412−0.1220.1010.0680.490No Difference
RT → INT0.1980.0110.3830.000−0.1850.104No Difference
FW → INT0.0440.589−0.0060.9420.0500.665No Difference
HB → INT0.2180.0080.2280.092−0.0100.926No Difference
OB → INT0.3350.000−0.0570.6170.3920.009Sig. Difference
SI → INT0.0160.8600.3220.008−0.3060.044Sig. Difference
INT → SMP0.6280.0000.5790.0000.0490.574No Difference
Note: SMP: Stock Market Participation; FW: Financial Wellbeing; HB: Herding Behavior; FL: Financial Literacy; OB: Overconfidence Bias; INT: Investment Intention; RT: Risk Tolerance. Source: researchers’ calculations.
Disclaimer/Publisher’s Note: The statements, opinions and data contained in all publications are solely those of the individual author(s) and contributor(s) and not of MDPI and/or the editor(s). MDPI and/or the editor(s) disclaim responsibility for any injury to people or property resulting from any ideas, methods, instructions or products referred to in the content.

