Abstract
The agriculture sector is increasingly challenged to maintain productivity and sustainability amidst environmental, marketplace, and geopolitical pressures. While precision agriculture enhances physical production, the financial resilience of agricultural firms has been understudied. In this study, machine learning (ML) methods, including logistic regression (LR), decision trees (DTs), and artificial neural networks (ANNs), are employed to predict the bankruptcy risk for Central and Eastern European (CEE) farming firms. All models consistently showed high performance, with AUC values exceeding 0.95. DTs had the highest overall accuracy (95.72%) and F1 score (0.9768), LR had the highest recall (0.9923), and ANNs had the highest discrimination power (AUC = 0.960). Visegrad, Balkan, Baltic, and Eastern Europe subregional models featured economic and structural heterogeneity, reflecting the need for local financial risk surveillance. The results support the development of AI-based early warning systems for agricultural finance, enabling smarter decision-making, regional adaptation, and enhanced sustainability in the sector.
1. Introduction
The increasing importance of bankruptcy prediction models has been brought into sharp focus with rising economic uncertainties and financial risks globally, particularly in transition economies. In recent years, the rapid development of artificial intelligence (AI) has transformed various industries, including finance, manufacturing, healthcare, and public administration (Santoro et al., 2024; Perotti et al., 2024; Lazaroiu & Rogalska, 2024). Within the financial industry, AI-driven technologies have played a pivotal role in promoting operational efficiency and enabling sophisticated predictive analytics (Balcerzak & Valaskova, 2024; Dabija & Frau, 2024; Valaskova et al., 2024). Recent studies have examined the possibility of AI in other financial services like Islamic banking (Hamadou et al., 2024) and highlighted the significance of intelligent systems in data-driven decision-making. AI applications have demonstrated potential in resolving complex tasks with nonlinear relationships among financial indicators, including risk prediction, fraud detection, and bankruptcy prediction (Isimoya & Oluwaleye, 2023). Machine learning (ML) algorithms, especially artificial neural networks (ANNs) and decision trees (DTs), remain the most favored AI techniques in corporate bankruptcy prediction. They are suitable for processing large and diverse datasets, uncovering hidden patterns, and producing highly accurate forecasts, often surpassing traditional statistical models. While ANN models can capture intricate variable interactions through their multilayered framework, DT models are more interpretable and transparent and thus provide significant value to financial risk management researchers and practitioners (Rahman & Belas, 2024; Juracka et al., 2024).
The growing application of ML models, as a prominent subset of AI, is largely due to the inherent flaws of conventional statistical techniques, such as logistic regression (LR) and discriminant analysis, which are based on restrictive assumptions like linearity, normality, and homoscedasticity. These are often not satisfied in real-world finance, especially when handling firm-level data that includes abnormalities, outliers, and heterogeneity across markets (Capestro et al., 2024). On the contrary, AI methods like ANNs and DTs provide higher flexibility and resilience, rendering them effective in modeling complex, high-dimensional, and unbalanced datasets typical of financial distress scenarios. ML methods are thus increasingly prominent in bankruptcy prediction research as part of the overall digitalization movements reshaping financial services and regulatory policy (Valaskova et al., 2025).
Despite significant advances in the science of forecasting bankruptcy, there is a disparity in the application of ML techniques within the context of Central and Eastern European (CEE) countries, particularly in sector-specific domains such as agriculture. The CEE region is characterized by economic heterogeneity, a post-socialist transition history, and disintegrated financial systems, all of which contribute vastly to model formulation and examination. These countries often experience underdeveloped capital markets, varying degrees of institutional support, and excessive dependence on public subsidies, especially in agriculture, differentiating them from Western economies. The agricultural sector in the CEE area holds strategic socio-economic significance, with a tendency to serve as a prop for rural employment, food security, and territorial growth. However, it is also inherently subject to risks, including commodity price volatility, restricted access to finance, aging infrastructure, and climatic uncertainty. According to Garcia-Aguero et al. (2024), most agricultural enterprises in this area are still small- and medium-sized family farms with limited financial disclosure and risk management abilities. These circumstances, separately, pose massive challenges in the early detection of financial trouble using standard linear models, and the acceptance of sophisticated AI-based approaches is both highly likely and pressing. While increasing research has emerged on ML techniques for early warnings of bankruptcy, much of it addresses large economies or developed market economies and, therefore, misses the distinct structural and institutional dynamics in CEE agriculture. Research in this context is unique not only due to its regional focus but also because it attempts to bridge the gap between predictive modeling and the specific financial behaviors, capital structures, and regulatory compositions of typical CEE agricultural firms. Doing so, such research offers more context-specific results and better fine-tunes the applicability of early warning systems for respective stakeholders within these transition economies. This study provides answers to the following research questions:
- RQ1: How effectively do LR, ANNs, and DTs perform in predicting bankruptcy within the CEE region, based on key classification metrics such as accuracy, AUC, precision, recall, and F1 score?
- RQ2: To what extent do region-specific models (e.g., Visegrad, Balkan, Baltic, and Eastern European subregions) outperform generalized models in predicting bankruptcy across the CEE region?
- RQ3: Which financial indicators are most influential in the classification of bankruptcy within the aggregate CEE model, and how do they contribute to the predictive performance of the applied methods?
The main aim of this paper is to develop robust and accurate predictive models for assessing the bankruptcy risk of corporations in the context of CEE countries. For this purpose, three methodological approaches, LR, ANNs, and DTs, are used to examine their respective abilities in identifying financial distress among enterprises. These methods are particularly suited for such a task, as they can capture complex, nonlinear relationships between financial variables and are less constrained by the stringent assumptions typically imposed on conventional statistical procedures. The analytical framework of this study is structured in two successive steps. Initially, aggregate models are specified with the pooled data from all CEE countries, constructing a baseline assessment of model performance across the region. Following this, the analysis is extended by disaggregating the sample into four subregional groups: the Visegrad Group, the Balkan states, the Baltic states, and Eastern Europe. This stratified approach allows us to assess region-specific predictive accuracy and provides deeper insight into how distinct structural and economic characteristics within each subregion may influence model performance. Model performance is measured based on various standardized performance metrics, including area under the receiver operating characteristic curve (AUC), classification accuracy, precision, recall, and F1 score. Based on a comparative performance analysis between aggregated and regionally divided datasets, this research aims to find not only the most accurate predictive model but also to determine the extent to which regional differentiation enhances model robustness and interpretability.
The results indicate that the three models developed using LR, ANNs, and DTs are comparably effective in predicting the bankruptcy risk of agricultural firms in the CEE region, with DTs providing the best-balanced classification performance. Region-based models generally outperform the aggregate model, and this highlights the importance of considering economic as well as structural heterogeneity at the subregion level. These findings support the view that AI and ML methods enhance early warning systems, correctly identifying vulnerable businesses, thus facilitating better financial risk management and decision-making within transition economies. This research thus contributes to the growing literature on ML applications in corporate bankruptcy prediction, with a particular focus on unexplored post-transition economies in the CEE region. Moreover, this research aims to advance the development of early warning systems that incorporate country- and region-specific dynamics, enabling timely and effective financial decisions by policymakers, creditors, and enterprise stakeholders alike.
This paper is divided into several key sections. The Literature Review section surveys the existing body of research on bankruptcy forecasting and agricultural indebtedness, with particular emphasis on the financial ratios empirically linked to financial distress, as well as the most frequently used prediction methods in this context. The Methodology section outlines the research design, the data collection process using the ORBIS database, the criteria for selecting agricultural firms, and the rationale for applying LR, ANNs, and DTs as the primary modeling approaches. The Results and Discussion section presents the model outputs and compares performance in the aggregate dataset and the regional subgroups. This comparative assessment is contextualized with reference to the relevant literature, highlighting how the findings correspond to or diverge from prior empirical research. Emphasis is placed on the suitability of each model type for capturing the financial dynamics of agricultural enterprises operating within the CEE region. Finally, the Conclusions section synthesizes the main findings and examines their practical implications for policymakers, financial institutions, and agricultural business owners. It also outlines potential avenues for future research, including the incorporation of additional financial and non-financial variables to further improve the accuracy and applicability of bankruptcy prediction models in the agricultural sector.
2. Literature Review
Bankruptcy prediction modeling has evolved significantly over the past few decades, transitioning from conventional statistical techniques to more advanced and adaptive ML approaches. The earliest models primarily utilized multivariate discriminant analysis, logistic regression, and simple ratio-based analyses (Altman, 1968; Chrastinova, 1998; Gurcik, 2002). These early approaches lay the groundwork for more complex and interactive techniques, such as ANNs, DTs, support vector machines, and hybrid models that integrate multiple algorithms (Gregova et al., 2020; Horvathova et al., 2024; Y. S. Chen et al., 2021). Over time, researchers have increasingly prioritized model robustness and adaptability, emphasizing the need for techniques capable of capturing the nonlinear relationships and multicollinearity inherent in financial distress scenarios (Pendharkar, 2005; Korol, 2019). Building on these methodological advancements, the following hypothesis is proposed:
H1.
Advanced machine learning (ML) models such as artificial neural networks (ANNs) and decision trees (DTs) achieve significantly higher predictive performance (accuracy, AUC, precision, recall, and F1 score) than traditional logistic regression (LR) models in bankruptcy prediction within the CEE region.
While the global academic literature provides a broad spectrum of bankruptcy prediction methods, the context of the CEE countries presents distinct challenges and structural complexities. In these economies, bankruptcy prediction has been heavily influenced by unique transitional dynamics and region-specific institutional factors. The post-socialist transition, with its accelerated privatization, liberalization of the markets, and changing regulatory environments, has provided a multifaceted backdrop for examining financial distress (Arestis & Sawyer, 2004; Estrin et al., 2009). Several papers have pointed to the influential role of macroeconomic and institutional factors, such as corruption perceptions (Mauro, 1995; Lambsdorff, 2007), the effectiveness of law enforcement (La Porta et al., 1999; Djankov et al., 2008), and the efficiency of insolvency regimes (Claessens & Klapper, 2005), in shaping bankruptcy trends in CEE nations. Muntean et al. (2019) illustrated how weak institutional structures and pervasive corruption contribute to elevated bankruptcy rates in Moldova and other CEE countries by undermining corporate governance and distorting market signals. Building on these findings, Stef (2021) demonstrated that neighboring countries with more robust legal systems and lower corruption levels exhibit significantly reduced corporate financial distress risks, thereby affirming the protective influence of sound institutional environments. Similar conclusions were derived by Beck et al. (2006) and Virglerova et al. (2017), since they also found that institutional strength serves as a key determinant of firm survival in post-transition economies. Financial models specifically tailored to the CEE environment tend to include firm-level financial variables, such as liquidity measures, profitability ratios, and leverage variables, combined with macroeconomic and institutional variables (Jencova et al., 2024). This combined approach has been proven to enhance predictive accuracy, mirroring transitional economy bankruptcy determinants’ complexity (Balan & Iorgulescu, 2014; Mannasoo et al., 2018; Kliestik et al., 2018). The use of region-specific ML techniques has also gained traction, with tools such as DTs, random forests, and support vector machines increasingly being adapted to local data characteristics and economic conditions. Notably, Podhorska et al. (2020) reported that their DT-based bankruptcy prediction model achieved accuracy rates exceeding 90%, thereby highlighting the promise of advanced, context-sensitive analytical approaches. This finding is supplemented by Horvathova et al. (2024) and Gregova et al. (2020), who underscore the value of hybrid models that combine firm-specific financial indicators with the macroeconomic context in enhancing predictive performance. Together, the results underscore the importance of bankruptcy prediction models that account for both individual firm-level economic performance and the prevailing socio-economic environment in the CEE region. They thus highlight the potential benefits of localized model approaches. Consequently, the following hypothesis is formulated:
H2.
Region-specific bankruptcy prediction models, tailored to the economic and institutional characteristics of subregions within CEE, outperform generalized models by providing higher classification accuracy and robustness.
A closer examination of individual CEE countries highlights the heterogeneity of the modeling approaches and methodological strategies adopted across the region. In Slovakia, studies have progressed from early discriminant analysis models through LR to, more recently, advanced ML methods such as ANNs and DTs with increased predictive accuracy, frequently having classification rates of more than 90% (Kliestik et al., 2018; Gregova et al., 2020; Horvathova et al., 2021; Durica et al., 2023; Kuster et al., 2023; Citterio, 2024). These studies emphasize not only higher precision but also the importance of integrating non-financial variables and macroeconomic indicators to enhance model robustness (Tinoco & Wilson, 2013; Wang et al., 2025). The Czech Republic also favors LR and ANNs, with ANNs being, in most instances, superior to traditional techniques in bankruptcy prediction (Dvoracek et al., 2008; Vochozka et al., 2015; Nemec & Pavlik, 2016; Kocmanova et al., 2014). Moreover, Czech research has expanded to incorporate ensemble learning methods and hybrid models combining fuzzy logic with ML, leading to improved prediction stability and interpretability (Angenent et al., 2020; Sabek et al., 2024; Zelenkov, 2024). Poland’s research tradition began with classical logistic models but has evolved since then to encompass genetic algorithms, fuzzy logic, support vector machines, and deep learning, since there is ongoing work intended to depict complex financial phenomena and nonlinear connections in firm data (Korol, 2004; Pisula et al., 2015; Cakici et al., 2024; Kuiziniene et al., 2024). Explainable AI approaches have been employed to increase transparency and interpretability in model outputs for bankruptcy prediction in Poland (Pawlowski & Exchange, 2024). Hungarian models originally employed linear discriminant analysis and LR, later moving on to ANNs and DTs, while overfitting and lack of data have been mentioned as problems (Szeverin & Laszlo, 2014; Prusak & Karas, 2024). Further recent research focuses on feature selection techniques and boosting techniques (Papik & Papikova, 2024) to combat these issues and improve model generalizability (Mate et al., 2023; Gholampoor & Asadi, 2024). Bulgaria and Croatia have explored classical and advanced methods, with Croatian studies focusing on the relative performance of ANNs and LR, while recent Bayesian networks (Arneric & Mocan, 2025) and ensemble approaches have enhanced interpretability and prediction accuracy (Bogdan et al., 2021; Altman et al., 2024). Bulgarian research tends to combine macroeconomic indicators with firm-level financial data in hybrid ML frameworks, producing promising results in the context of emerging markets (Kazakov & Nikolov, 2024). The other Baltic countries, like Estonia, Latvia, and Lithuania, have also developed their country models, ranging from discriminant analysis and LR to ANNs and hybrid fuzzy logic systems, in response to the altered economic environments and firm structures of these countries (Siimon & Lukason, 2021; Kohv & Lukason, 2021; Malakauskas & Lakstutiene, 2021; Kuiziniene et al., 2022). Schwarcz (2018) notes growing interest in incorporating macroprudential indicators and stress-testing techniques to better assess systemic risk in small open economies. Belarus is remarkable, with a standout state-mandated approach highlighting liquidity and capital structure ratios, limiting the use of innovative ML techniques in spite of certain academic attempts to develop more flexible models (Trubina, 2016; Bychkov et al., 2019). Nevertheless, recent scholarship has begun to explore hybrid models combining conventional financial ratios with SVMs, aiming to mitigate the rigidity of legacy frameworks (Oner et al., 2024; Lokanan & Ramzan, 2024; Liu et al., 2025).
A consistent theme across empirical studies on bankruptcy prediction is the strategic selection and application of the key financial indicators that underpin effective forecasting models. Among these, debt-to-equity and general leverage ratios are most frequently cited, reflecting their foundational role in assessing a firm’s capital structure, solvency, and risk exposure (Pendharkar, 2005; Korol, 2019; Krajewski et al., 2020; Nagy et al., 2024). Liquidity ratios, such as current and quick ratios, also become crucial, as noted by Behr and Weinblat (2017), Mannasoo et al. (2018), and Shafiee et al. (2024), whose pioneering studies on liquidity ratios continue to be the core of the bankruptcy forecasting literature. The financial independence, interest coverage, and profitability ratios illustrate varying levels of importance with the model type and economic conditions of a nation. For instance, cash flow variables came to the forefront in some ANN models (Umar et al., 2025; Malone et al., 2025; Seretidou et al., 2025), while solvency ratios like non-current asset coverage were less likely to add incremental worth (Korol, 2013a; Altman et al., 2017, pp. 131–171; Poufinas & Siopi, 2024). Martin and Herrero (2025) and Liu et al. (2025) observe the growing use of profitability ratios such as return on assets (ROA) and return on equity (ROE) in ML models, as they are predictive in nature in every industry. The predictors employed tend to be indicative of methodological inclinations, with ML models shown to possess versatility in incorporating nonlinear associations and sophisticated interactions between financial ratios and external variables (Radovanovic & Haas, 2023; Ben Jabeur & Serret, 2023; Y. S. Chen et al., 2021). In addition, the recent literature includes macroeconomic variables and market-based determinants such as credit spreads and stock volatility for enhanced model performance (Mititean & Sarmas, 2023), especially in hybrid modeling approaches that integrate financial and external data. Following these observations, the subsequent hypothesis is formulated:
H3.
Key financial indicators such as debt-to-equity ratio, leverage, and liquidity ratios are the most influential predictors of bankruptcy in the aggregate CEE model, with their relative importance varying depending on the classification method employed.
Models for forecasting bankruptcy have experienced notable improvement, with advanced ML techniques quickly dominating the market due to their superior predictive power and adaptability. CEE research highlights the importance of considering institution-specific context as well as firm-specific financial data to make accurate projections. At the country level, models are more complex and precise but share a consensus that leverage and liquidity measures are essential predictors supported by profitability and cash flow indicators tailored to the local economic environment (Pamuk et al., 2021; Y. S. Chen et al., 2021; Kuiziniene & Krilavicius, 2024). This growing body of literature emphasizes the key value of combining methodological ingenuity with contextual awareness to ensure the enhanced early identification of financial distress.
3. Methodology
The main aim of this paper is to develop robust predictive models for estimating the bankruptcy risk of agricultural firms in the CEE countries. To accomplish this, three advanced methodological approaches are applied due to their capacity to model complex, nonlinear relationships and overcome the limitations inherent in traditional statistical techniques. Figure 1 provides a graphical representation of the data processing and modeling procedure to describe the methodological steps. The analysis is carried out in two stages. Aggregate models are estimated initially with the pooled data across all CEE countries to examine the overall predictive capacity of each approach. The data is further segmented into four regional clusters, such as the Visegrad Group, the Balkans, the Baltics, and Eastern Europe, to ascertain whether region-specific models provide improved classification outcomes, considering the structural and economic heterogeneity across subregions. The performance of the models is evaluated using standard classification metrics such as AUC, accuracy, precision, recall, and F1 score. By comparing regional and aggregated results, this study aims to identify not only the most effective predictive methodology but also the potential benefits of regional model customization. The results help progress towards the development of early warning systems tailored to the distinct financial conditions of agricultural companies in transition economies, thereby supporting informed decision-making and risk assessment.
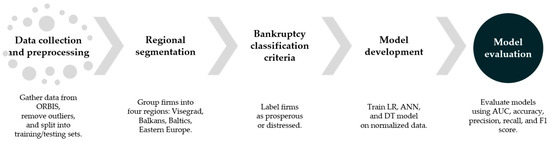
Figure 1.
Data processing and modeling workflow for bankruptcy prediction. Source: own elaboration.
This paper focuses on 15 CEE countries, selected due to their shared economic history and comparable transition pathways from centrally planned to market economies following the collapse of communism in the late 20th century. These countries underwent comprehensive structural reforms, including privatization, market liberalization, and the establishment of new legal and financial institutions, that have fundamentally changed their corporate sectors. This shared trajectory renders these nations particularly suitable for comparative analyses of corporate bankruptcy prediction, as firms operate under similar institutional constraints, economic volatility, and evolving regulatory frameworks. Moreover, the convergence of macroeconomic determinants of insolvency across these economies, specifically volatile GDP growth, credit market development, and legal enforcement efficiency, underscores the systemic drivers of bankruptcy risk in the region.
The chosen countries are grouped into relevant subregions of the CEE to capture the diversity in economic development and institutional maturity. The Visegrad Group of Poland, the Czech Republic, Slovakia, and Hungary is representative of economies that have experienced relatively rapid economic growth and early EU membership, benefiting from deeper integration into European financial markets and regulatory structures. The Balkan subregion, including Albania, Bulgaria, Croatia, North Macedonia, Romania, and Serbia, consists of countries that have either joined the EU more recently or remain in the accession process, exhibiting varying degrees of economic development and ongoing institutional transformation. The Baltic countries, comprising Estonia, Latvia, and Lithuania, are characterized by their rapid reforms, strong focus on digitalization, and early EU accession. Finally, the Eastern European subregion, comprising Belarus and Moldova, reflects economies with more postponed reform trajectories and unique political–economic conditions compared to the other groups. Due to the unavailability of accessible and dependable financial data, Kosovo, Bosnia and Herzegovina, and Ukraine were excluded from this research. Including countries with missing or irregular data would undermine the validity and robustness of the bankruptcy prediction models, potentially bias the results, and decrease their generalizability.
3.1. Sample Description
Data utilized in developing the bankruptcy prediction model for agricultural enterprises were obtained from the ORBIS database, which comprises comprehensive financial and business information on over 400 million private and public companies worldwide. The sample size initially included 28,162 agricultural firms operating in the CEE region, with financial ratios in 2022 as independent variables, while the financial stability status in 2023 served as the dependent variable. Enterprises were selected based on their NACE classification, more specifically, those included in Section A (Agriculture, Forestry, and Fishing), Division 01 (Crop and animal production, hunting and related service activities), Division 02 (Forestry and logging), and Division 03 (Fishing and aquaculture). This classification includes a range of activities in agriculture, such as crop cultivation, animal husbandry, mixed farming, auxiliary activities, and freshwater and marine aquaculture. To maintain data quality and model stability, enterprises with incomplete or missing financial data were removed. This exclusion process, as necessary as it is to decrease noise and distortions, can impact the sample representativeness by excluding some firms, which may introduce bias. Further, to address the distribution skewness of the financial ratios, often created by outliers, the dataset was adjusted for outliers using the Z-score approach. Following the approach of Zmuk (2017), the values falling outside the range of ±3 standard deviations from the mean were identified and removed as outliers. This preprocessing step enhanced the reliability of model predictions by mitigating the influence of extreme values. After adjusting for missing and outlier values, the preprocessed data consisted of 8513 agricultural enterprises, of which 7788 were prosperous and 725 were distressed. For developing models, the dataset was randomly split into a training dataset (70%) and a test dataset (30%), with stratified sampling applied to maintain the class distribution, thereby minimizing class imbalance bias during model training. After having trained and tested the bankruptcy prediction models on the whole dataset comprising firms from the CEE region, this study proceeded with regional disaggregation to control for potential subregional heterogeneity.
The entire sample is separated into four geographically and economically relevant clusters: the Visegrad Group (4872 firms, of which 4597 are prosperous and 275 distressed), the Balkan countries (3395 firms, of which 3029 are prosperous and 366 distressed), the Baltic countries (209 firms, of which 139 are prosperous and 70 distressed), and Eastern Europe (37 firms, of which 23 are prosperous and 14 distressed). This scheme enables the replication of the modeling approach within every cluster and allows for comparative analysis of predictive performance within the CEE subregions. Reliable identification of financial distress requires predictive models that have the ability to extract intricate, often nonlinear, associations among financial indicators.
While traditional methods such as discriminant analysis or Z-score models rely on linear assumptions, LR is an improvement but is nonetheless premised on parametric assumptions. In this study, traditional models of bankruptcy prediction, such as Altman’s Z-score and linear discriminant analysis (LDA), were used primarily as benchmark approaches to compare ML model performance. Traditional models depend upon a set of fixed accounting ratios, which typically span leverage, liquidity, and profitability ratios, selected for their established predictive powers in previous research (Altman, 1968; Odom & Sharda, 1990). ANNs and DTs, on the contrary, possess greater flexibility in revealing latent, nonlinear variable interactions. What makes this study special is its use of all three approaches in the context of the agricultural sector in the CEE countries, a geographic region that remains underrepresented in prediction modeling studies. By comparing the performance of models at both regional and subregional scales, this study offers new insights into how methodological choices interact with the structural and economic idiosyncrasies of the CEE agricultural environment, making the results both context-specific and broadly applicable to early warning systems. The choice of financial metrics for all the models was guided by a synthesis of classical techniques and the contemporary literature (Yu et al., 2014; Barboza et al., 2017; Svabova & Durica, 2019; Kovacova et al., 2019; Jencova et al., 2020; Alam et al., 2021). Debt ratios were in the limelight due to the important role they have in signaling financial distress and future bankruptcy in agricultural enterprises, which is an argument raised by several earlier studies (Michalkova & Ponisciakova, 2025; Gajdosikova & Michulek, 2025). The parameters represent the firm’s leverage status, serving as a fundamental determinant of insolvency risk. The debt-based indicators selected, along with the interrelationships necessary to compute them, are provided in Table 1. By leveraging the creation of models based on these strongly supported indicators, this study ensures comparability with conventional bankruptcy prediction models while utilizing the flexibility of ML techniques to gain sophisticated, nonlinear relationships.

Table 1.
Summarized formulas of financial indicators.
3.2. Classification Criteria
Enterprises in the bankruptcy prediction model are segregated into two groups: prosperous firms with acceptable levels of debt and distressed ones with high levels of indebtedness. Subsequently, this research adopts a collection of accounting-based criteria for use consistently across national settings, solely based on information derivable from financial statements. A firm is considered distressed if it meets at least one of the following criteria:
Condition (1): The firm reports negative equity, wherein the value of total liabilities (including accrued liabilities) exceeds the total assets. This indicator of possible legal insolvency is calculated as follows:
Condition (2): A bonity index of less than 1 suggests the firm’s adjusted liquidity is insufficient, as follows:
where adjusted current assets are inventories, current receivables, financial assets, cash and cash equivalents, and prepaid expenses; and adjusted current liabilities are current liabilities and accrued liabilities.
Condition (3): When the data required for the bonity index are unavailable, the model uses a second liquidity ratio, defined as:
The bonity index is an adjusted liquidity ratio for more refined current asset and liability figures to provide a more accurate indicator of corporate liquidity. The ratio, however, is a simplified alternative used where data for the calculation of the bonity index figures are incomplete, using raw, unadjusted financial statement figures. The two ratios both assess liquidity, but with the difference being that the bonity index is more precise, while ensures applicability even under incomplete information.
Condition (4): The firm recorded a net loss during the observed accounting period, an indication of insufficient revenue to meet financial obligations:
The classification process runs as follows: If Condition (1) (negative equity) is true, the firm is then classified as distressed, regardless of other indications. Otherwise, the firm is still distressed if Condition (2) or (3) and Condition (4) are simultaneously satisfied. This multi-criteria methodology covers all such companies that are distressed, even in the absence of formal announcements of bankruptcy or legal proceedings against them, as these very often do not exist or are inequitably recorded in CEE countries. Employing such universally available and standardized accounting statement variables, this approach retains cross-country comparability without sacrificing theoretical and empirical validity. The model output Y is a binary classification:
3.3. Predictive Modeling Methods
Based on the preliminary analysis, the validated and preprocessed input feature dataset was used to train three models of classification for predicting firm financial distress: logistic regression (LR), artificial neural networks (ANNs), and decision trees (DTs). These models were selected to represent a broad range of ML paradigms along the axes of interpretability and complexity. LR offers a simple statistical baseline, DTs easily interpretable rule-based classification, and ANNs the potential to model complex nonlinear relations in the financial data. This mix enables the comparative evaluation of models across simplicity, interpretability, and predictive capacity. The models were trained and validated using the processed dataset, and parameters were tuned to improve their predictive performance. Before training, the input parameters were subjected to rigorous preprocessing, such as statistical verification for significance and consistency. Additionally, all the input features were normalized using min–max scaling such that the values lay within [0,1], which facilitates stable learning and the efficient convergence of ANN models.
The data demonstrated a high class imbalance between distressed and prosperous companies. Even though stratified sampling was used to preserve class distribution for model training, no further imbalance correction methods such as SMOTE, under-sampling, or class weights were used. This approach was justified by the consistently high recall and F1 scores achieved for the minority class across all models, indicating the reliable detection of distressed firms without explicit balancing. As highlighted by Guo et al. (2017) and Krawczyk (2016), techniques for managing class imbalance are most useful when models exhibit poor performance in classifying the minority class but are not always necessarily needed. Given the high classification performance observed, not implementing additional balancing methods lowered the potential downsides of overfitting or the elimination of valuable information, thereby maintaining the generalizability of the models.
For comparative validity and generalizability, modeling was performed separately within four regional clusters. A stratified train/test split was used for each to maintain class proportions. Although k-fold cross-validation is a widely accepted model validation technique, it was not applied due to the large size of the two big clusters (Visegrad and Balkan) and the small size of the others (Baltic and Eastern Europe), where repeated partitioning can lead to overfitting or unstable estimates. This approach ensured methodological consistency across regional clusters and enabled valid comparative analysis, while the absence of k-fold cross-validation is recognized as a methodological drawback. In the modeling process, rigorous measures like rigorous data preprocessing, stratified sampling, hyperparameter tuning, and appropriate validation approaches were undertaken to mitigate overfitting and ensure the strength and reliability of the predictive models.
3.3.1. Logistic Regression
Logistic regression is a well-established statistical method commonly used for modeling binary outcomes, such as distinguishing between prosperous and distressed firms. It is also of interest in financial distress modeling due to its greater flexibility with fewer assumptions than traditional linear models (Y. S. Chen et al., 2021). Unlike multivariate discriminant analysis, LR is not reliant on predictor normality or the homogeneity of variance–covariance matrices between groups and may be used for complex real-world data (Csikosova et al., 2020). In the LR model, the cumulative logistic distribution function is used, which estimates the probability p that an observation belongs to a specific class (e.g., bankruptcy), as follows:
where is the probability that , are the parameters of the model and are the predictor variables. Then the probability that is given by the logistic function:
LR provides odds ratios that quantify the impact of independent variable changes on financial distress probability. Its capacity to handle continuous and categorical predictors and yield coefficients interpretable in terms of odds makes it particularly valuable in bankruptcy prediction (Arneric & Mocan, 2025).
3.3.2. Artificial Neural Networks
Artificial neural networks have become a widely endorsed approach in statistical modeling and predictive analysis has emerged as a highly viable alternative to conventional techniques such as nonlinear regression or cluster analysis (Sun et al., 2019). Their greater potential for generalization and the potential for modeling intricate, nonlinear relationships among variables render ANNs very suitable for bankruptcy prediction tasks. Initial studies conducted by Odom and Sharda (1990) demonstrated the efficacy of neural networks in bankruptcy prediction with performance metrics matching or surpassing classical discriminant analysis models.
One of the most significant advantages of ANNs is their limited dependence on robust statistical assumptions. Unlike most traditional approaches, ANNs are not reliant on linear, normality, and independence assumptions among predictors, which enables them to better capture highly complex data structures (Sun et al., 2019), which provides neural networks with the potential to discover concealed patterns and interactions that might otherwise be overlooked.
At the core of an ANN is the computer processing unit known as the neuron or node (Ainan et al., 2024). A typical network consists of various neurons organized in layers: an input layer to accept the predictor variables, one or more hidden layers that introduce nonlinear transformations, and an output layer that yields the final prediction. Each neuron works based on input by calling weighted coefficients on the input signals, adding a bias, and applying a nonlinear activation function to it, as follows:
where denotes the weight coefficient between the -th input and the -th neuron, is the -th input value, is the number of input variables to each neuron, is the bias term associated with neuron , and represents the activation function applied to the weighted sum of inputs.
A feedforward radial basis function neural network architecture was utilized in this research, conforming to supervised learning models (Dasilas & Rigani, 2024). The model comprised a single hidden layer provisioned with radial basis activation functions to introduce nonlinearity and enable the network to learn complex patterns from the data. The hyperbolic tangent activation function was utilized by the hidden layer specifically:
which maps real-valued inputs into the range , boosting the network’s ability to model nonlinear relationships. The ANN was trained with a stratified train/test split to maintain class distribution. The network architecture had one hidden layer with four neurons and hyperbolic tangent activation, and the standardized financial indicators were fed into the input layer. The ANN was employed as a multilayer perceptron with a single hidden layer, and trained using the backpropagation algorithm. Optimizing the hyperparameters via grid search provided an optimal number of hidden layer neurons of 10, with a balance between model complexity and generalization performance. This configuration enabled the utilization of high-quality input signals, ultimately enhancing the accuracy and stability of the bankruptcy predictions. The output layer employed a softmax activation function, and the model was optimized using the cross-entropy loss function to handle the binary classification task effectively. The training process employed an early stopping criterion based on a lack of error improvement for one iteration, thereby preventing unnecessary continuation after convergence. No regularization techniques, such as L1/L2 penalties or dropout, were employed, as the network architecture was compact and the model achieved low classification error rates for both training and testing datasets. Stratified sampling and early stopping helped avert overfitting and enabled generalizability to regional datasets.
3.3.3. Decision Trees
Decision tree models offer an understandable alternative to the often complex structure of ANNs, and therefore they are highly valued for classification tasks due to their simplicity and interpretability. Unlike traditional regression methods, DTs put no conditions on the normality of the data and can easily model nonlinear and complicated interactions among variables. DTs also conduct automatic feature selection by eliminating irrelevant predictors, thus reducing the modeling complexity.
The development of a DT model is initiated by partitioning the training dataset based on each attribute, with tree growth controlled by the predetermined rules of splitting. In this research, the Classification and Regression Tree (C&RT) algorithm (Almaskati et al., 2021) is used, which is a binary recursive partitioning technique for dividing the dataset into progressively more homogeneous subsets according to the dependent variable. C&RT strives to maximize splits that yield maximally pure resulting child nodes. A node is clean if all observations belong to the same class, hence not splitting further.
Impurity in a node is quantified using the Gini index, which is a measure that characterizes node heterogeneity by summing the squared probabilities of observations belonging to any target class. Mathematically, the Gini index is given as:
where is the probability that a randomly selected observation falls into category , and is the number of categories. The Gini index ranges from 0 (for a completely pure node) to 1 (most impure) and is utilized as the decision rule in selecting the best splits for constructing the tree (Gul & Altinirmak, 2025).
3.4. Evaluation Metrics
Once the bankruptcy prediction models are developed, their accuracy has to be assessed and compared rigorously. To achieve a comprehensive evaluation of the predictive power of each model for the outcome of interest, several complementary metrics are employed, such as the area under the curve (AUC), accuracy rate, and F1 score. These metrics provide information on overall effectiveness at classification, precision–recall balance, and the models’ discriminatory abilities at various levels of classification thresholds.
The AUC is an aggregate measure taken from the receiver operating characteristic (ROC) curve, which plots the true positive rate (sensitivity) against the false positive rate (1-specificity) at various levels of thresholds (Abid et al., 2022). Sensitivity (or recall) is employed to measure the proportion of positive cases correctly identified and is expressed as follows:
where represents the number of true positives and represents the number of false negatives. Specificity is the proportion of correctly classified negative cases and is given as follows:
where represents the number of true negatives and represents the number of false positives.
AUC is a measure of how well the model discriminates between positive and negative classes, while an AUC value of 1 represents a theoretically perfect classifier, where all positive and negative cases are correctly identified without error. The AUC is a significant measure of classification performance, particularly between prosperous and distressed enterprises.
The complement of the AUC, along with the accuracy rate derived from the confusion matrix, may represent the simplest performance measure, calculated as the number of observations correctly classified (positive and negative) divided by the total number of observations:
The F1 score is a combination of precision and recall into a single measure, especially in cases of imbalanced datasets where one class is underrepresented. Precision is the true positives divided by all predicted positives, and recall is the sensitivity. The F1 score is the harmonic mean between precision and recall:
where and . It is preferable to have a high F1 score as it indicates a good false positive to false negative ratio, and therefore the measure is good to use when both are of serious concern.
4. Results and Discussion
The classification results for CEE agricultural enterprises are reported in Table 2. The comparative analysis of LR, ANNs, and DTs revealed that all three models performed with notably high overall accuracy in classifying financially healthy firms, with more than 95% performance in the test sample for each. Specifically, the LR model correctly classified 99.2% of prosperous firms in the test sample, followed by the ANN with 98.6% and the DT with 98.2%. Yet, the more notable difference was in the ability of the models to identify distressed enterprises. The LR model correctly classified 53.7% of bankrupt firms in the test sample, which was improved upon by the ANN with 59.5% and the DT which was the best at 67.5%. Overall classification accuracy was slightly higher in the DT model (95.9% training; 95.7% testing), followed by the ANN (95.5% training; 95.4% testing) and LR (94.4% training; 95.1% testing). These findings show that while the LR and ANN yield superior performance for classifying prosperous firms (reducing false positives), the DT model yields a more balanced classification for both classes, especially for detecting early warning signs of financial distress (reducing false negatives). Given the precedence of the early identification of risky agricultural enterprises in the CEE region, where financial instability can undermine not only agricultural viability but also food system resilience, the DT model emerges as the most practically applicable tool. Its relatively higher sensitivity to bankruptcies highlights its utility in real-world financial risk measurement and early warning systems in agri-finance.
Table 2.
Classification ability of developed models for CEE countries.
The relative significance of the independent variables in bankruptcy prediction varies considerably across the LR, ANN, and DT models (Table 3). In the LR model, the equity leverage ratio emerges as the most influential predictor (100%), followed by the interest burden ratio (24.3%) and the debt-to-equity ratio (6.2%), with all remaining variables contributing only marginally. This suggests that the LR model relies heavily on a single leverage-based indicator, reflecting its limited capacity to capture more complex financial patterns. In contrast, the ANN model demonstrates a more balanced distribution of predictor significance. The highest predictors are self-financing (100%), total indebtedness (85.7%), and current indebtedness (84.5%) ratios. Financial independence, non-current indebtedness, and debt-to-equity also prove to be key predictors, highlighting the ANN model’s capacity to incorporate a broader spectrum of financial indicators and to detect intricate interdependencies among variables. The DT model, on the contrary, assigns equal and maximum importance to total indebtedness, self-financing, and financial independence ratios (all 100%), while attributing moderate importance to debt-to-equity and equity leverage (47.3%) ratios. Profitability and insolvency ratios such as the insolvency, interest coverage, and interest burden ratios are accorded lesser importance, which is indicative of the DT prioritizing leverage and internal financing in its decision weights. Overall, whereas the ANN detects more complex interdependencies, the DT offers a focused view of importance structure ratios, and LR draws extensively upon equity leverage to classify financial well-being.
Table 3.
Independent variable importance of the LR, ANN and DT models.
Bankruptcy prediction remains a vital topic of research for creditors, investors, and policymakers interested in predicting financial distress and mitigating risks. Understanding which financial variables exhibit strong predictive power helps in creating effective prediction models. The findings regarding significant financial predictors in models of bankruptcy are not dissimilar to those of several previous studies in other settings. Consistent with Pendharkar (2005) and Korol (2019), the debt-to-equity ratio was a key variable, confirming its extensively researched importance as a measure of leverage in bankruptcy prediction. This ratio measures the proportion of debt relative to equity, with a value near 1 (or 100%) indicating a balanced capital structure, suggesting sufficient equity to cover liabilities, while higher values indicate greater risk for creditors. Similarly, Krajewski et al. (2020), applying LR and survival analysis among Visegrad Group countries, concluded that leverage ratios and liquidity are excellent financial distress indicators, which substantiates the relevance of the respective variables. The total indebtedness ratio measures aggregate leverage, while optimal levels are typically 70–80% in developed economies and 30–60% elsewhere, balancing the cost of capital and market value. Its complement, the self-financing ratio, measures the extent to which firms are self-funding with shareholders’ equity and should ideally not fall below 20–30%, pointing to firm-level finance adequacy. A similar result was also confirmed by Behr and Weinblat (2017), whose random forest model utilized debt-related and liquidity measures as being central amongst European firms. Additionally, the financial independence ratio was very predictive in the developed DT model, a proportion reflecting the firm’s reliance on internal compared to external finance, while greater values reflected greater independence and reduced bankruptcy risk, and smaller values reflected vulnerability through indebtedness, as also identified by M. Y. Chen (2012) in Taiwanese companies and Tudor et al. (2015) in Romanian companies through decision trees. Interest coverage and interest burden ratios were relatively important in the developed ANN and LR, as expected with the emphasis on cash flow metrics as identified by Jeong et al. (2012), although Mihalovic (2018) concluded that leverage and profitability were more impactful than operating cash flow indicators in enterprises in Slovakia. Indicators such as non-current indebtedness and current indebtedness were relatively lower in importance in the developed ANN model. The current indebtedness ratio reflects short-term liabilities against total assets and, in large values, reflects pressure on liquidity, while non-current indebtedness is relative to long-term liabilities and reflects long-term financial stability. This pattern aligns with Korol (2013b) and Radovanovic and Haas (2023), confirming that leverage and liquidity are the definitive predictors. Insolvency ratio and non-current assets coverage contributed little to this and past research, like that of Korol (2013b), suggesting that the inclusion of such ratios does not make much of an incremental contribution to forecasting bankruptcy beyond key leverage and liquidity measures. Together, these convergent findings confirm the predictive power of financial leverage and liquidity ratios as dominant predictors in bankruptcy models, while the relative importance of operational and solvency indicators could vary with methodology.
The performance of LR, ANNs, and DTs was compared against critical classification metrics: AUC, accuracy, precision, recall, and F1 score. As is evident from Table 4 and Figure 2, the three models were found to possess predictive power with AUC scores above 0.95, representing high discriminatory power in differentiating financially sound and troubled agricultural firms. Among the evaluated models, the ANN model yielded the highest AUC (0.960), confirming its capacity to recognize complex patterns. The DT was second with an AUC of 0.956, while LR was also well-placed at 0.955. A glance at accuracy saw the DT as having highest overall classification rate at 95.72%, a slight edge over the ANN (95.41%) and LR (95.11%). The DT also registered the highest precision at 97.15%, registering fewer false positives. However, LR performed best with the highest recall (99.23%), suggesting its effectiveness in classifying firms at risk of bankruptcy. The ANN had a balanced performance with a recall of 98.57% and precision of 96.51%, thus being particularly effective in minimizing both false positives and false negatives. In the F1 score, which balances precision with recall, the DT model was the highest again at 97.68%, followed by the ANN (97.53%) and LR (97.36%). Overall, the performance of all three models achieved good predictive accuracy in classification terms, with the DT performing best overall, the ANN performing best at pattern recognition, and LR performing best at identifying financially distressed companies.
Table 4.
Evaluation metrics for developed models for CEE countries.
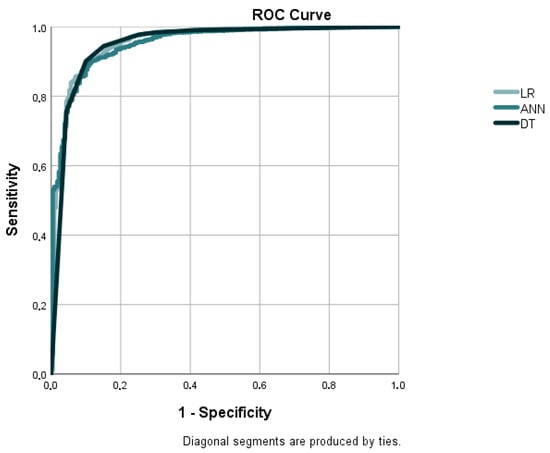
Figure 2.
ROC curves for developed models for CEE countries. Source: own elaboration.
Considering the significance of these key financial predictors having been identified, later research has gone on to formulate and test more complex prediction models in CEE, where the region-specific economic and institutional environment has come to be appreciated more profoundly. Other previous studies corroborate the high accuracy of advanced ML models in bankruptcy prediction, though with differences in terms of reported metrics. Pamuk et al. (2021) and Shetty et al. (2022) attained accuracies of approximately 82% through ANN and DT models, much lower than the demonstrated levels of performance in the present scenario. Radovanovic and Haas (2023) and Ben Jabeur and Serret (2023) achieved similar levels of accuracy at 79–77%, noting the consistent problem of having higher predictive accuracy. More recent research, nonetheless, such as Kuiziniene and Krilavicius (2024) and Hamdi et al. (2024), showed significant improvements, with an ANN accuracy of above 90% and F1 scores of 90–97%, closer to results in the present study. Y. S. Chen et al. (2021) showed that hybrid ANN models can obtain an AUC of 0.979 and accuracy above 96%, proving the utilization of sophisticated models across different economic settings. While DT models produce lower accuracy compared to ANN models, studies by Fasano et al. (2024) and Njoku et al. (2024) confirm their use in practice due to interpretability, with 84–88% accuracies. This confirms that both ANNs and DTs are excellent techniques in bankruptcy prediction, providing proper data selection and model calibration.
Various studies have addressed bankruptcy forecasting and financial distress in CEE nations, with a range of methodologies focusing on various determinants. Institutional factors were found to play a central role. Muntean et al. (2019) considered the mechanisms of corruption, weak rule of law enforcement, and poor insolvency frameworks in Moldova and across the broader CEE, highlighting the macroeconomic surroundings’ influence on governing insolvency tendencies. In support of this argument, Stef (2021) used LR to demonstrate that better legal institutions and less corruption lower the probability of corporate distress across CEE countries, while Balan and Iorgulescu (2014) used stochastic methods to estimate the bankruptcy risk among SMEs with an emphasis on the dynamicity of financial indicators across several CEE economies. Haini et al. (2023) investigated more recently the firm financial health impacts of digitalization, exports, and government support during the COVID-19 pandemic by employing panel econometric models for CEE countries with a focus on external drivers enhancing resilience. Similarly, Mannasoo et al. (2018) applied panel data regression to illustrate that credit constraints and investment barriers have substantial impacts on increasing the risk of the financial distress of CEE firms. Collectively, these results show the dynamic interaction between macroeconomic, institutional, and firm-level financial drivers of bankruptcy in CEE. Podhorska et al. (2020) proposed a recursive DT-based predictive model for forecasting financial distress in transition European economies with a 92.1% accuracy, which showed the empirical relevance and strong predictive power of DT-based models in these transition economies. These comparisons highlight that the gains in model design and data specificity are accountable for the dramatic predictive performance gains in CEE markets, which highlight the significance of tailored ML for regional financial risk measurement.
4.1. Bankruptcy Prediction in Visegrad Group Countries
Even though region-wide models for CEE exhibit high levels of predictive performance, it should be noted that there is intrinsic heterogeneity in this wide geographic cluster. The Visegrad Group, Balkan countries, Baltic nations, and Eastern European countries each have their own economic, agricultural, and financial profiles that can affect bankruptcy risk in different ways. Therefore, highlighting the development and analysis of individual models for these subregions should provide more nuanced insights and potentially increase prediction accuracy by detecting region-specific patterns, which is just common sense, as while CEE countries share a structure to some degree, particular models may be more appropriate to address the localized determinants of agricultural firm financial conditions.
The performance of the Visegrad Group countries is presented in Table 5, while the ROC analysis for the developed models is illustrated in Figure 3. The models generally exhibit strong predictive performance with deviations from the overall CEE results. There is a strong increase in AUC (0.973) but only a slight reduction in overall accuracy (91.93%), reflecting enhanced discrimination but increased classification error. The ANN model also fares very well, with precision (95.83%) and recall (98.83%) being marginally superior to the CEE-wide model, attesting to its strength in the classification of distressed firms. The DT model is the most accurate (96.63%) and the most precise (98.51%), outperforming the CEE outcomes and further attesting to its strength in correct classification for this subregion. These developments emphasize the importance of subregional modeling since different methods can acquire or lose their predictive value depending on local conditions.
Table 5.
Evaluation metrics for developed models for Visegrad Group countries.
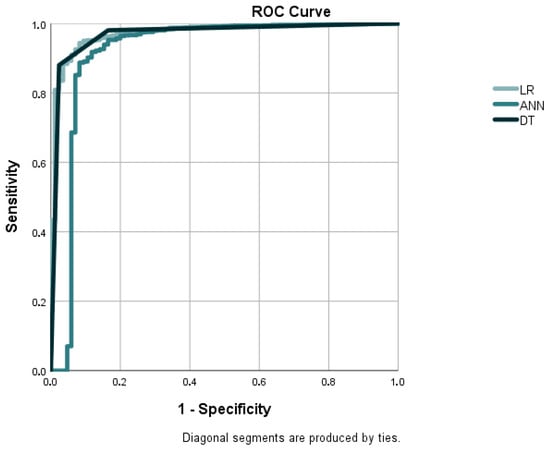
Figure 3.
ROC curves for developed models for Visegrad Group countries. Source: own elaboration.
Broadening the perspective to specific subregions within CEE involves considerable variations in methodological trends and predictive performance due to different economic structures and institutional settings. The development of bankruptcy prediction models within the Visegrad countries reveals a persistent tendency toward traditional statistical approaches over contemporary ML approaches with a series of reported predictive performances. Prusak and Karas (2024) conducted a comprehensive bibliometric review of bankruptcy prediction studies in the Visegrad Group countries, highlighting notable methodological patterns in the region. Based on their research, they concluded that LR is the most used method, while most models still rely primarily on financial variables. Moreover, they observed that most of the methods are static, and thus more adaptive, and dynamic prediction structures are appropriate for the evolving economic environment of these rising European nations. In Slovakia, early applications of multivariate discriminant analysis by Chrastinova (1998) and Gurcik (2002) laid the groundwork for innovative applications of insolvency assessment, and other research introduced LR, fuzzy set theory, and ANNs. Particularly noteworthy is the high predictive power of the Altman-based logit models used by Adamko and Svabova (2016), with the AUC ranging from 0.81 to 0.88, which supports its consistently high discriminative ability. Kral et al. (2014) and Stachova et al. (2015) demonstrated that adding temporal dynamics and expanding historical data windows improved model accuracy, although accuracy measures were not specified. Banyiova et al. (2014) used data envelopment analysis (DEA), and their models were only moderately accurate (54–70%); hence stronger classifiers like DTs and LR were indicated as needed. ML techniques became prominent in response to these challenges. Gregova et al. (2020) contrasted learning models with conventional statistical models and confirmed that the ANN was the most precise at 94.37%, surpassing LR and other conventional models. Horvathova et al. (2021) also confirmed that ANN financial health prediction was better than discriminant analysis at 95.45% precision compared to 90.91%. Further evidencing ML’s efficacy, Durica et al. (2023) developed ANN and DT models to forecast financial distress in firms, with 96.5% and 93.2% accuracy, respectively. Horak et al. (2020) also demonstrated the applicability of DTs through an in-depth evaluation framework that involved financial as well as non-financial measures with 93.75% classification accuracy. Both of these contributions highlight the growing importance of ANNs and DTs in Slovak bankruptcy forecasting and in demonstrating their obvious superiority to traditional means of predictive performance. The use of LR and ANNs has been prevalent in the Czech Republic, with the latter usually yielding only slightly superior results to the former. Dvoracek et al. (2008, 2012a, 2012b) made a comparison of ANNs with LR and found that ANNs performed superiorly in the case of bankruptcy prediction, while Nemec and Pavlik (2016) reported 83.97% accuracy for LR models applied to Czech firms. Vochozka et al. (2015, 2016) applied ANNs to manufacturing and construction sectors with over 90% accuracy, confirming the practicability of neural networks in real-world contexts. At the same time, Karas and Reznakova (2014, 2015) developed models that used boosted DTs and linear discriminant analysis, but with low reported accuracies, often below 60%, often being compared to those of the Altman and IN05 models. Bems et al. (2015) compared evolutionary algorithms, Bayes classifiers, and ANNs, and they reported close predictive powers without reliable measures of accuracy. Horak et al. (2020) proposed an integrated approach to evaluation based on financial and non-financial indicators and DT algorithms and proved its effectiveness by successfully testing it with an overall classification rate of 93.75%, making DTs robust for the prediction of corporate financial performance. Polish studies of bankruptcy prediction began predominantly with classical models of LR (Gruszczynski, 2003; Michaluk, 2003; Wedzki, 2004) based on accounting ratios. Although the researchers often omitted detailed performance measurements, among their key contributions was a model adapted to Polish economic conditions, specifically created by Zdyb (2001), which improved the efficiency of the Altman model through threshold modifications. More recent studies have embraced ANNs (Korol, 2004; Pisula et al., 2013, 2015), genetic algorithms, and DTs (Pisula et al., 2013; Pociecha et al., 2014; Gaska, 2016), with qualitative estimates suggesting ANN superiority in handling nonlinearities. Korol (2010b) and Pisula et al. (2015) also introduced support vector machines and fuzzy logic into methodological diversity. Sector models, such as logistics (Brozyna et al., 2016; Karbownik, 2017) and macro variable inclusion (Korol, 2010a), bear witness to the attempts to adapt models to the economic situation. Hajdu and Virag (2001) first predicted bankruptcy with linear discriminant analysis and LR in Hungary, followed by industry models (26 industries). Virag and Kristof (2005) demonstrated that a two-layer ANN outperformed their earlier linear discriminant analysis and LR models, as found by Bozsik (2010), who recorded the robust performance of two-layer ANN architectures. Szeverin and Laszlo (2014) compared LR, DTs, and ANNs with SMEs and found that the latter’s models were best in training samples, but validation revealed the best models with an overall error rate of 26.7%, which pointed to overfitting. Bauer and Edresz (2016) incorporated macroeconomic factors into predictor factors with financial ratios using probit models. Nyitrai and Virag (2019) examined the impact of outlier treatment on bankruptcy prediction models and ended up finding that linear discriminant analysis with CHAID-based segmentation achieved the best average AUC in test samples compared to artificial neural networks.
4.2. Bankruptcy Prediction in Balkan Countries
Following the assessment of the Visegrad Group countries, attention shifts to the Balkan subregion which possesses unique economic dynamics and institutional environments. The performance measures for the Balkan countries, as indicated by Table 6, are complemented by the ROC curves for the developed models using three methods, shown in Figure 4, which present a marginally decreased AUC (0.953) and accuracy (90.37%), which indicates a slight decline in prediction performance. Both the DT and ANN models maintain high precision (94.85% and 95.08%, respectively) with the CEE performance, although the DT model indicates a relatively lower AUC (0.929) than in the whole region. Precision and recall are high for all the models, suggesting a robust classification of successful and failing firms. The Balkan subgroup is on average slightly poorer in model discrimination but still has strong practical utility.
Table 6.
Evaluation metrics for developed models for Balkan countries.
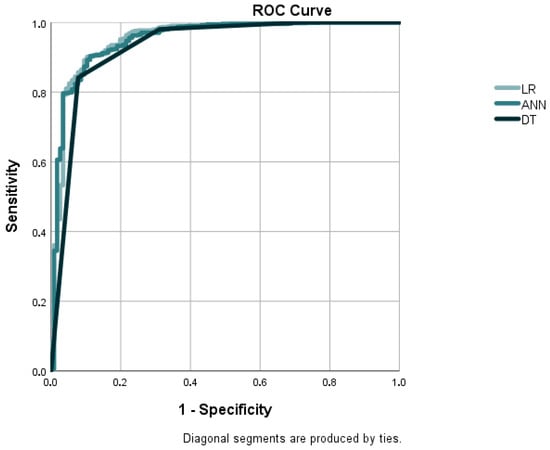
Figure 4.
ROC curves for developed models for Balkan countries. Source: own elaboration.
Countries like Bulgaria, Croatia, and Romania have developed distinctive bankruptcy modeling practices, integrating established methods with new ML techniques. Bankruptcy prediction research in Bulgaria has mostly utilized traditional models and discriminant analysis. Popchev and Radeva (2006) utilized foreign models, including Altman, Fulmer, and Springate, to categorize firms based on risk without precise performance metrics. Radkov and Minkova (2011) and Radkov (2013) used the prediction of bank failure risk with asymptotic single risk factors and Merton models. Angelov (2014) ensured that the Beaver, Altman, and Taffler models applied to Bulgarian public companies. Delev (2016) compared Western and Polish models, and the Taffler, Tischaw, and Polish models proved to be the most appropriate in Bulgaria, and they set up a local model for bankruptcy prediction with linear discriminant analysis in 60 Bulgarian non-financial corporations, though this did not have accurate accuracy statistics. In Croatia, the study of bankruptcy prediction evolved from early applications of multivariate discriminant analysis and LR to newer ML techniques. Bogdan et al. (2021) conducted a large-scale sample with the whole population of Croatian enterprises, utilizing propensity score matching to achieve a representative sample of prosperous and distressed firms. The findings revealed that both multivariate discriminant analysis and LR models had high classification accuracy, and the LR model was superior to multivariate discriminant analysis (76.3% compared to 73.7%), offering a benchmark for insolvency prediction at the national level. In a sectoral context, Bogdan (2021) applied a logit model to the Croatian restaurant industry based on only two financial metrics, such as equity ratio and EBITDA margin, and this was 82.8% accurate a year before bankruptcy and over 76% accurate at two and three years before bankruptcy. Pervan (2015) provided an important contribution to the literature by comparing basic risk index models against more advanced approaches, such as LR and ANNs. His results showed that risk index models performed effectively with solvent firms (86.4% accuracy) but did better with insolvent firms (63.5%), compared to achieving 78.9% using LR and 84.4% using an ANN. Therefore, although deployed, risk index models could be less strong in major prediction assignments, i.e., early financial distress diagnosis. ANN models’ utility for handling complex, nonlinear patterns was reaffirmed by Slavici and Mnerie (2012), who tested them in agricultural management and demonstrated their suitability for multiple financial purposes in Croatia. Most recently, Arneric and Mocan (2025) extended the methodological frontier by suggesting the use of a Bayesian LR model for uncertainty and variable selection. They obtained a cross-validated accuracy of 90.22% and correctly identified 99.61% of bankrupt firms, illustrating the potential of probabilistic modeling to enhance insolvency risk estimation. Romanian studies adopted a comparable approach, with early examples from ratio analysis and discriminant analysis, subsequently using LR. Brindescu-Olariu and Golet (2013) developed multivariate discriminant analysis and LR models based on a large sample of 4327 firms, observing a methodological transition. Similarly, Megan and Circa (2014) developed logit and probit models for medium and large firms. Further improving predictive techniques, Tudor et al. (2015) introduced an ANN-based decision support system that showed a highly accurate classification rate of 94.2%, thereby confirming the high predictive power of ANNs for the Romanian landscape. Building on these national studies, Popescu and Dragota (2018) compared post-communist countries and discovered that LR was a strong predictor of financial trouble, even with different institutions, showing its reliability in changing market situations.
4.3. Bankruptcy Prediction in Baltic Countries
Leveraging the observed performance metrics for the Baltic countries, the following section analyzes the country-level modeling environments for Estonia, Latvia, and Lithuania. The results for the Baltic countries, as reported in Table 7, reflect the high performance of the LR with an accuracy level of 92.82% and an F1 score of 94.55%, slightly higher than its performance on the overall CEE model. The ANN model exhibits a decline in accuracy to 89.95%, below the CEE average, while maintaining good precision (92.03%) and recall (92.70%). By comparison, the DT model, with a less superior AUC of 0.926 (Figure 5), achieves a high accuracy of 94.74% and the highest F1 score of the three models at 96.03%, demonstrating that it has the best balance within this regional environment.
Table 7.
Evaluation metrics for developed models for Baltic countries.
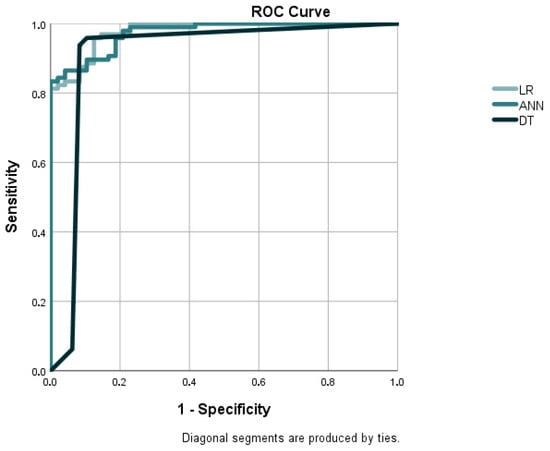
Figure 5.
ROC curves for developed models for Baltic countries. Source: own elaboration.
These countries, exhibiting analogous history and institutional conditions, have been methodologically heterogeneous in bankruptcy prediction approaches, ranging from classical statistical modeling to advanced hybrid techniques. In Estonia, modeling of bankruptcy prediction advanced more rapidly in the late 1990s after the adoption of bankruptcy law in 1992. Classical statistical approaches dominated the initial endeavors. Lukason (2006) developed national models with recursive partitioning, LR, ANNs, and linear discriminant analysis. Survival analysis techniques were used by Mannasoo (2007), while Grunberg and Lukason (2014) directly compared ANN and LR models by applying data on over 11,000 solvent firms and 58 bankruptcies. Their findings showed that ANNs generally performed better than LR in prediction accuracy, particularly for one-year forecasts, which achieved an 84% accuracy during a growth period compared to 72% using LR. The model performance reduced significantly during the recession (65% vs. 51%), and further reduced for longer prediction horizons, indicating poor temporal robustness. Kasper (2016) centered on micro-enterprises and, applying LR, discovered that classic models reported a weak classification accuracy (usually below 60%). Only in a two-year time window did his model achieve 67.9% accuracy. Lukason and Kasper (2017) validated these constraints for start-up companies and prompted the authors to include trajectory-based methodologies to better capture financial distress dynamics. In Latvia, the application of bankruptcy prediction models has advanced gradually from the start of the 1990s, beginning with adaptations of foreign models. Sorins and Voronova (1998) introduced the first national model that was tailored to local conditions. Koleda and Lace (2009) later developed a composite instrument for SMEs by combining the Altman, Tafler, two-factor, and R-models, assigning each of them different weights to capture more generic risk patterns. Sneidere and Bruna (2011) approximated insolvency risk in four sectors, such as services, manufacturing, trade, and construction, using the Altman, Fulmer, Zmijewski, and Sorins–Voronova models. The best performance was shown by the Altman and Fulmer models, each achieving over 80% accuracy on the validation sample, which clarified the meaning of the sectoral heterogeneity of predictive performance and suggested that standard models could continue to be useful in specific circumstances. One significant methodological contribution came from Genriha et al. (2011), who built a national tri-factor model through LR. It was tested against ten foreign models and ranked as the best among all the methods reviewed, validating the effectiveness of individualized LR-based methods in Latvia’s economic environment. In Lithuania, the first national model of bankruptcy forecasting was proposed by Grigaravicius (2003), who applied LR to a sample of 88 firms. Subsequently, Purvinis et al. (2005a, 2005b) even examined linear discriminant analysis and ANNs, albeit with a small initial sample. These efforts came to fruition in a broader investigation by Purvinis et al. (2008), who developed hybrid models combining ANNs and fuzzy logic among 30 stable and 200 failing firms. The best-performing model achieved a first-type precision slightly over 80%, 7 percentage points better than Altman’s model. Later, Butkus et al. (2014) also applied LR to create sector-specific models for construction, commercial, and industrial firms, with additional variations based on firm size. Such a targeted approach reflects growing sophistication in model formulation based on the types of enterprises.
4.4. Bankruptcy Prediction in Eastern European Countries
The performance of the Eastern European countries is demonstrated in Table 8, with the ROC curves for the developed models using three methods displayed in Figure 6. LR produced the highest AUC of 0.972 and an accuracy of 91.89%, which possessed a high prediction ability for this region. The ANN and DT models were slightly lower in terms of the AUC, standing at 0.953 and 0.828, respectively, and had a relatively similar accuracy within 89–92%. While the ANN’s recall and accuracy were equivalent at 91.3%, the DT model’s recall was slightly superior at 95.45% and proved its strength in risk enterprise identification even with a lower combined AUC. These observations would reflect some differences in model performance between Eastern Europe and the broader CEE view.
Table 8.
Evaluation metrics for developed models for Eastern European countries.
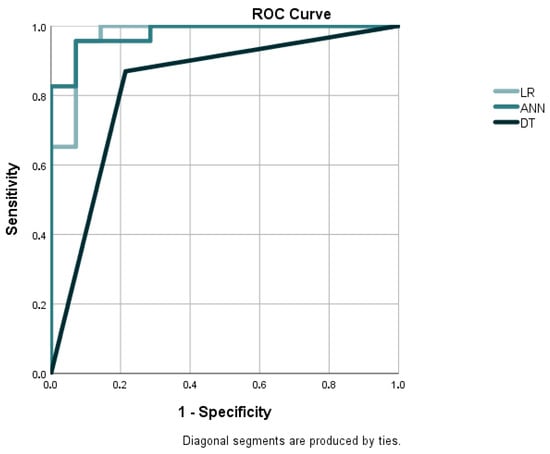
Figure 6.
ROC curves for developed models for Eastern European countries. Source: own elaboration.
It should be noted, however, that the Eastern European cluster contains a relatively small sample of 37 firms, which lowers the statistical power and extensiveness of the findings for this subregion. The increased dataset size improves the risk of overfitting as well as lowers the robustness of the model validation, necessitating cautious interpretation of these findings. Future research might be aided by larger datasets or the addition of further regional data to give them more reliability and use in forecasting bankruptcy in Eastern European agricultural companies.
Regarding regional model performance, it is particularly insightful to follow how bankruptcy prediction has evolved nationally in Eastern Europe. Belarus serves as an example due to its unique institutional setting and comparatively slower introduction of innovative predictive methods, conditions that have shaped the nature and scope of its modeling activity. The information on bankruptcy prediction models in Belarus has followed a different course under the impact of regulatory constraints and limited empirical research. Unlike in most other post-Soviet economies, where model experimentation was widespread after 2000, Belarusian law is implemented through centralized, top-down policies by legally mandating a formalized state methodology based on three specific financial ratios, most of all prioritizing liquidity and capital structure. This legislative provision has effectively limited the practical application and utilization of advanced predictive tools. There have, nevertheless, been academic attempts at developing national models using statistical methods. Specifically, Savitskaya (2006) constructed two national models aimed at the agricultural industry using linear discriminant analysis and LR. While the models had theoretical value, they were not officially adopted nor tested in applied settings to a large extent. However, their development was an important step away from the rigorous state-imposed metric system. In a comparative analysis, Shakun and Skrobko (2012) evaluated the effectiveness of these models alongside a group of foreign models, including those developed by Altman, Taffler, Beaver, Fedotov, Sajfulin, Kadykov, and Zaitsev. With agricultural companies as the empirical basis, they proved that Savitskaya’s linear discriminant analysis model was more successful than foreign ones, and its results were very similar to the outcomes of the Belarusian state-imposed insolvency assessment. Although more sophisticated approaches were experimented with briefly, e.g., fuzzy logic (Lobanova et al., 2012), this work was largely conceptual in nature and did not lead to the implementation of a viable model. Similarly, ANN and DT methods have not been applied in the Belarusian context, at least not in any published empirical studies. In the Belarusian context, research also progressed towards the development of practical tools for evaluating financial conditions and the continuity of operations. Kontsevaya et al. (2019) suggested a ranking score model for assessing the financial health and bankruptcy fears of dairy processing companies. Their model integrated financial metrics with subjective assessments of bankruptcy risk perception, hence offering a more prolonged framework customized to the sectoral specifics of Belarusian companies.
4.5. Comparative Overview of Bankruptcy Prediction Performance
Summary results of models developed for bankruptcy prediction in the CEE region and subregions are summarized in Table 9. Previous models constructed for the entire CEE region performed effectively, with ANNs and DTs working slightly better than LR using the AUC and F1 scores. After training the models separately for regional groups, such as Visegrad, Balkan, Baltic, and Eastern Europe, their performance displayed heterogeneity. The Visegrad and Balkan regions had increased AUC and F1 scores on many of the models, particularly the DT, which consistently delivered the highest balanced results. Baltic and Eastern European regions saw some declines in model performance, particularly for the ANN and DT, whereas LR remained relatively stable. These results highlight that regional modeling can enhance the accuracy of bankruptcy prediction in certain clusters, picking up on region-specific financial characteristics, but they suggest that heterogeneity across various CEE subregions can necessitate proper customized strategies.
Table 9.
Summary of evaluation metrics for developed models across regional clusters.
The developed bankruptcy prediction models have important real-world implications for financial risk management in agriculture. By facilitating the early detection of firms with rising insolvency risk through the integration of milestone financial indicators, such models facilitate prompt and informed decision-making by stakeholders and managers. The enhanced predictability of ML techniques, particularly ANNs and DTs, allows for the capture of advanced, nonlinear relationships among financial variables, thereby improving the robustness of risk estimates. This supports strategic actions such as debt restructuring, liquidity rebalancing, and resource redeployment that intend to avoid likely financial distress. Furthermore, the regional disparity in model performance emphasizes context-driven approaches when designing risk management strategies. Apart from firm-level applications, these models can also inform policymakers and financial institutions in designing credit evaluation criteria and support mechanisms to be tailored towards the various economic circumstances of agri-businesses in the CEE subregions and can eventually lead to improved financial stability and sustainable sector development.
In summary, the three methods show high predictive ability in the classification of agricultural companies in CEE. While LR and ANNs are effective in the classification of stable firms, the DT model presents a more balanced performance by being more effective in the detection of financially distressed companies, which is of the highest importance for early risk management in the agricultural business. The importance of predictor variables varies across models, reflecting different approaches to modeling financial health, such as the DT’s focus on core leverage and financing ratios. Furthermore, model performance varies across regions within CEE, suggesting that subregional, tailor-made models can provide more precise and actionable intelligence for financial risk prediction in different agricultural contexts. Together, these findings highlight the applied usefulness of combining several modeling methods in enhancing bankruptcy prediction and achieving sustainable agriculture in the region.
5. Conclusions
AI and ML algorithms, such as LR, ANNs, and DTs, have become core tools for predicting bankruptcy risk in agricultural enterprises. AI-based models are especially well-suited for capturing complex, nonlinear relationships in financial data and outperforming many traditional statistical models. The models performed well across all classification metrics, with high accuracy and power to distinguish between prosperous and distressed firms. The ability of AI methods to lower false negatives is particularly significant since the early identification of distressed enterprises enables early intervention and decision-making. This study confirms that the use of AI in predictive analytics enhances the efficiency and credibility of early warning systems in agricultural finance, which results in enhanced financial risk management in transition economies.
The main aim of this paper was to compare and develop prediction models of the bankruptcy risk of agricultural firms in CEE countries. By applying LR, ANNs, and DTs, this study sought to contrast their relative utility in a two-stage process: first by creating aggregate models by utilizing pooled data for the entire CEE region, and second by building region-specific models for the Visegrad Group, Balkans, Baltics, and Eastern Europe. The objective extended beyond merely identifying the top-performing prediction method but also examining whether regional bespoke models more accurately reflected classification accuracy by portraying regional economic and structural diversity.
The findings show that all models are effective based on overall accuracy metrics, with DTs giving the most balanced classification between prosperous and distressed companies. LR relies heavily on the equity leverage ratio as a significant predictor, while ANNs utilize a broader range of financial ratios, including self-financing and indebtedness ratios. DTs prefer leverage and internal financing ratios, which yield slightly more sensitivity in forecasting bankruptcies. The regional models generally outperformed the pooled CEE-wide model, reflecting the need to account for heterogeneity between subregions. More precisely, the Visegrad Group and Balkan models were more precise and accurate, suggesting that region-specific influences play a significant role in bankruptcy risk prediction.
Theoretically, this study informs a closer understanding of how ML techniques can be optimized for financial distress prediction in agricultural companies, especially in transition economies characterized by heterogeneous financial systems. Practically, the findings offer evidence for the implementation of early warning systems that can notify policymakers, lenders, and managers about the earlier and more accurate detection of at-risk firms, which enables better risk mitigation actions and resource allocation in the agricultural sectors and food supply chains of CEE countries, which results in increased stability.
Despite promising results, there are several limitations to this study. The models rely on historical financial data that may not be fully representative of emerging market realities or exogenous shocks such as climate change or geopolitical conflict. Particularly, imposing a single year of financial indicators (2022) on predicting bankruptcy in the year after (2023) limits the temporal stability of the model and bars it from identifying long-term periods of financial deterioration. Furthermore, the relatively small sample size for some subregions may limit generalizability. This is especially applicable for the Eastern European cluster, since the relatively small number of companies makes the model outcomes less stable and means that longer data collection is required in future studies. A further limitation is the absence of k-fold cross-validation, which might influence the robustness and stability of the estimated model performance, particularly for smaller subgroups. This study is also not based on forward-looking accounting-based variables, nor does it control for macroeconomic determinants (e.g., GDP growth, inflation, interest rates) or non-financial firm-level characteristics such as corporate governance, ownership structure, or environmental exposure. These excluded variables would likely have a significant impact on explaining financial distress, particularly in industries such as agriculture that are highly susceptible to external shocks. Although omitting missing observations and outliers from firms provides model stability, it may limit the generalizability of the results. This preprocessing step has the potential to induce selection bias by selectively removing systematically varying firms from the retained sample, such as financially troubled or smaller firms with incomplete records. Subsequent research needs to investigate other avenues, such as data imputation or robust modeling approaches, to better handle missingness and extreme values and improve the representativeness and usability of bankruptcy prediction models.
Future studies should try to include other data sources, such as macroeconomic variables or non-financial firm-level attributes, to enhance prediction robustness. Combining firm-level financial data with external and forward-looking indicators can potentially further increase the responsiveness and timeliness of predictive models to the heterogeneity of economic conditions. Additionally, applying it to longitudinal research and testing other sophisticated ML algorithms can further advance bankruptcy risk forecasting in agricultural finance. Efforts to increase the size of the dataset and diversify it will also facilitate the use of more robust validation techniques, including k-fold cross-validation and out-of-time testing, which will further increase the validity of the predictive models that follow. Moreover, future research should investigate the impact of preprocessing decisions regarding data, such as missing values and outlier removal, by employing imputation methods or robust modeling. These sensitivity tests will allow for an investigation into how potential biases are constructed and will increase the generalizability of bankruptcy models. To conclude, given that the present study relies on a static one-year model based on one-year financial history, future research should consider dynamic, time-sensitive approaches that involve multi-year financial histories. Adding temporal patterns using time series models or survival analysis would significantly improve the predictive power and practical applications of bankruptcy prediction methods.
Author Contributions
Conceptualization, D.G. and J.M.; methodology, D.G.; software, D.G.; validation, D.G., J.M. and I.T.; formal analysis, I.T.; investigation, D.G.; resources, J.M. and I.T.; data curation, D.G.; writing—original draft preparation, D.G.; writing—review and editing, J.M. and I.T.; visualization, D.G.; supervision, D.G. and J.M.; project administration, D.G.; funding acquisition, D.G. All authors have read and agreed to the published version of the manuscript.
Funding
This research was financially supported by the institutional project 4/FPEDAS/2024 of the Faculty of Operation and Economics of Transport and Communications, University of Zilina, Slovak Republic.
Institutional Review Board Statement
Not applicable.
Informed Consent Statement
Not applicable.
Data Availability Statement
The original contributions presented in this study are included in the article. Further inquiries can be directed to the corresponding author.
Conflicts of Interest
The authors declare no conflicts of interest.
Abbreviations
The following abbreviations are used in this manuscript:
| AI | Artificial Intelligence |
| ANN | Artificial Neural Network |
| AUC | Area Under Curve |
| C&RT | Classification and Regression Tree |
| CEE | Central and Eastern Europe |
| CI | Current Indebtedness Ratio |
| CULI | Current Liabilities |
| DCF | Debt-to-Cash-Flow Ratio |
| DE | Debt-to-Equity Ratio |
| DEA | Data Envelopment Analysis |
| DEBT | Debtors |
| DEPR | Depreciation and Amortization |
| DT | Decision Tree |
| EAT | Earnings After Taxes |
| EBIT | Earnings Before Interest and Taxes |
| EL | Equity Leverage Ratio |
| FI | Financial Independence Ratio |
| FIAS | Fixed Assets |
| IB | Interest Burden Ratio |
| IC | Interest Coverage Ratio |
| Ins | Insolvency Ratio |
| INTE | Interest Paid |
| LR | Logistic Regression |
| ML | Machine Learning |
| NCAC | Non-Current Assets Coverage Ratio |
| NCI | Non-Current Indebtedness Ratio |
| NCLI | Non-Current Liabilities |
| OCAS | Other Current Assets |
| ROA | Return on Assets |
| ROC | Receiver Operating Characteristic |
| ROE | Return on Equity |
| SF | Self-Financing Ratio |
| SHFD | Shareholders Funds |
| TI | Total Indebtedness Ratio |
| TOAS | Total Assets |
References
- Abid, I., Ayadi, R., Guesmi, K., & Mkaouar, F. (2022). A new approach to deal with variable selection in neural networks: An application to bankruptcy prediction. Annals of Operations Research, 313(2), 605–623. [Google Scholar] [CrossRef]
- Adamko, P., & Svabova, L. (2016, September 5–6). Prediction of the risk of bankruptcy of Slovak companies. Managing and Modelling of Financial Risks: 8th International Scientific Conference (pp. 15–20), Ostrava, Czech Republic. [Google Scholar]
- Ainan, U. H., Por, L. Y., Chen, Y. L., Yang, J., & Ku, C. S. (2024). Advancing bankruptcy forecasting with hybrid machine learning techniques: Insights from an unbalanced Polish dataset. IEEE Access, 12, 9369–9381. [Google Scholar] [CrossRef]
- Alam, T. M., Shaukat, K., Mushtaq, M., Ali, Y., Khushi, M., Luo, S., & Wahab, A. (2021). Corporate bankruptcy prediction: An approach towards better corporate world. The Computer Journal, 64(11), 1731–1746. [Google Scholar] [CrossRef]
- Almaskati, N., Bird, R., Yeung, D., & Lu, Y. (2021). A horse race of models and estimation methods for predicting bankruptcy. Advances in Accounting, 52, 100513. [Google Scholar] [CrossRef]
- Altman, E. I. (1968). Financial ratios, discriminant analysis and the prediction of corporate bankruptcy. The Journal of Finance, 23(4), 589–609. [Google Scholar] [CrossRef]
- Altman, E. I., Balzano, M., Giannozzi, A., Liguori, E., & Srhoj, S. (2024). Bouncing back to the surface: Factors determining SME recovery. Journal of Small Business Management, 64, 1856–1883. [Google Scholar] [CrossRef]
- Altman, E. I., Iwanicz-Drozdowska, M., Laitinen, E. K., & Suvas, A. (2017). Financial distress prediction in an international context: A review and empirical analysis of Altman’s Z-score model. Journal of International Financial Management & Accounting, 28(2), 131–171. [Google Scholar] [CrossRef]
- Angelov, G. (2014). Options for modelling the financial viability of Sofix companies in the post-crisis years. Ekonomicheski Vestnik Donbassa, 4(38), 102–108. [Google Scholar] [CrossRef]
- Angenent, M. N., Barata, A. P., & Takes, F. W. (2020, March 30–April 3). Large-scale machine learning for business sector prediction [Conference presentation]. 35th Annual ACM Symposium on Applied Computing (pp. 1143–1146), Brno, Czech Republic. [Google Scholar] [CrossRef]
- Arestis, P., & Sawyer, M. (2004). On the effectiveness of monetary policy and of fiscal policy. Review of Social Economy, 62(4), 441–463. [Google Scholar] [CrossRef]
- Arneric, J., & Mocan, M. (2025). A Bayesian approach to logistic regression for bankruptcy prediction of trading companies under uncertainty conditions. Ekonomski Pregled, 76(1), 15–34. [Google Scholar] [CrossRef]
- Balan, M., & Iorgulescu, R. (2014, April 10–12). Estimates using stochastic methods for SME’s risk of bankruptcy. International Conference ‘Monetary, Banking and Financial Issues in Central and Eastern EU Member Countries: How Can Central and Eastern EU Members Overcome the Current Economic Crisis?’ (pp. 235–243), Iasi, Romania. [Google Scholar]
- Balcerzak, A. P., & Valaskova, K. (2024). Artificial intelligence: Financial management under pressure of transformative technology. Equilibrium–Quarterly Journal of Economics and Economic Policy, 19(4), 1127–1137. [Google Scholar] [CrossRef]
- Banyiova, T., Bielikova, T., & Piterkova, A. (2014, June 12–13). Prediction of agricultural enterprises distress using data envelopment analysis. 11th International Scientific Conference European Financial Systems (pp. 18–25), Lednice, Czech Republic. [Google Scholar]
- Barboza, F., Kimura, H., & Altman, E. (2017). Machine learning models and bankruptcy prediction. Expert Systems with Applications, 83, 405–417. [Google Scholar] [CrossRef]
- Bauer, P., & Edresz, M. (2016). Modelling bankruptcy using Hungarian firm-level data (No. 122). MNB Occasional Papers. Magyar Nemzeti Bank. [Google Scholar]
- Beck, T., Demirguc-Kunt, A., & Levine, R. (2006). Bank concentration, competition, and crises: First results. Journal of Banking & Finance, 30(5), 1581–1603. [Google Scholar] [CrossRef]
- Behr, A., & Weinblat, J. (2017). Default patterns in seven EU countries: A random forest approach. International Journal of the Economics of Business, 24(2), 181–222. [Google Scholar] [CrossRef]
- Bems, J., Stary, O., Macas, M., Zegklitz, J., & Posik, P. (2015). Innovative default prediction approach. Expert Systems with Applications, 42(17–18), 6277–6285. [Google Scholar] [CrossRef]
- Ben Jabeur, S., & Serret, V. (2023). Bankruptcy prediction using fuzzy convolutional neural networks. Research in International Business and Finance, 64, 101844. [Google Scholar] [CrossRef]
- Bogdan, S. (2021). Bankruptcy prediction in the Croatian restaurant industry. Ekonomska Misao i Praksa—Economic Thought and Practice, 30(1), 99–119. [Google Scholar] [CrossRef]
- Bogdan, S., Sikic, L., & Baresa, S. (2021). Predicting bankruptcy based on the full population of Croatian companies. Ekonomski Pregled, 72(5), 643–669. [Google Scholar] [CrossRef]
- Bozsik, J. (2010, January 7–11). Artificial neural networks in default forecast. 8th International Conference on Applied Informatics (pp. 31–39), Toyama, Japan. [Google Scholar]
- Brindescu-Olariu, D., & Golet, I. (2013). Bankruptcy prediction ahead of global recession: Discriminant analysis applied on Romanian companies in Timis county. Timisoara Journal of Economics and Business, 6(19), 70–94. [Google Scholar]
- Brozyna, J., Mentel, G., & Pisula, T. (2016). Statistical methods of bankruptcy prediction in the logistics sector in Poland and Slovakia. Transformations in Business & Economics, 15(1), 93–114. [Google Scholar]
- Butkus, M., Zakare, S., & Cibulskiene, D. (2014). Bankroto diagnostikos modelis ir jo pritaikymas bankroto tikimybei Lietuvos imonese prognozuoti. Taikomoji Ekonomika: Sisteminiai Tyrimai, 8(1), 111–132. [Google Scholar] [CrossRef]
- Bychkov, N. A., Metlitskiy, V. N., & Artyushevskiy, N. V. (2019). Method for assessment of financial status of agricultural companies and diagnostics of critical situations. National Academy of Sciences of Belarus-Agrarian Series, 57(1), 38–50. [Google Scholar] [CrossRef]
- Cakici, N., Shahzad, S. J. H., Bedowska-Sojka, B., & Zaremba, A. (2024). Machine learning and the cross-section of cryptocurrency returns. International Review of Financial Analysis, 94, 103244. [Google Scholar] [CrossRef]
- Capestro, M., Rizzo, C., Kliestik, T., Peluso, A. M., & Pino, G. (2024). Enabling digital technologies adoption in industrial districts: The key role of trust and knowledge sharing. Technological Forecasting and Social Change, 198, 123003. [Google Scholar] [CrossRef]
- Chen, M. Y. (2012). Comparing traditional statistics, decision tree classification and support vector machine techniques for financial bankruptcy prediction. Intelligent Automation & Soft Computing, 18(1), 65–73. [Google Scholar] [CrossRef]
- Chen, Y. S., Lin, C. K., Lo, C. M., Chen, S. F., & Liao, Q. J. (2021). Comparable studies of financial bankruptcy prediction using advanced hybrid intelligent classification models to provide early warning in the electronics industry. Mathematics, 9(20), 2622. [Google Scholar] [CrossRef]
- Chrastinova, Z. (1998). Metody hodnotenia ekonomickej bonity a predikcie financnej situacie polnohospodarskych podnikov. VUEPP. [Google Scholar]
- Citterio, A. (2024). Bank failure prediction models: Review and outlook. Socio-Economic Planning Sciences, 92, 101818. [Google Scholar] [CrossRef]
- Claessens, S., & Klapper, L. F. (2005). Bankruptcy around the world: Explanations of its relative use. American Law and Economics Review, 7(1), 253–283. [Google Scholar] [CrossRef]
- Csikosova, A., Janoskova, M., & Culkova, K. (2020). Application of discriminant analysis for avoiding the risk of quarry operation failure. Journal of Risk and Financial Management, 13(10), 231. [Google Scholar] [CrossRef]
- Dabija, D. C., & Frau, M. (2024). Leveraging artificial intelligence in marketing: Trend or the new normal? Oeconomia Copernicana, 15(4), 1173–1181. [Google Scholar] [CrossRef]
- Dasilas, A., & Rigani, A. (2024). Machine learning techniques in bankruptcy prediction: A systematic literature review. Expert Systems with Applications, 255, 124761. [Google Scholar] [CrossRef]
- Delev, A. (2016). Problems and challenges in assessing the risk of bankruptcy in Bulgarian companies. Economic Studies Journal, (3), 118–136. [Google Scholar]
- Djankov, S., La Porta, R., Lopez-de-Silanes, F., & Shleifer, A. (2008). The law and economics of self-dealing. Journal of Financial Economics, 88(3), 430–465. [Google Scholar] [CrossRef]
- Durica, M., Frnda, J., & Svabova, L. (2023). Artificial neural network and decision tree-based modelling of non-prosperity of companies. Equilibrium. Quarterly Journal of Economics and Economic Policy, 18(4), 1105–1131. [Google Scholar] [CrossRef]
- Dvoracek, J., Sousedikova, R., Bartak, P., Sterba, J., & Novak, K. (2012a). Forecasting companies’ future economic development. Acta Montanistica Slovaca, 17(2), 111–118. [Google Scholar]
- Dvoracek, J., Sousedikova, R., & Domaracka, L. (2008). Industrial enterprises bankruptcy forecasting. Metalurgija, 47(1), 33–36. [Google Scholar]
- Dvoracek, J., Sousedikova, R., Repka, M., Domaracka, L., Bartak, P., & Bartosikova, M. (2012b). Choosing a method for predicting economic performance of companies. Metalurgija, 51(4), 525–528. [Google Scholar]
- Estrin, S., Hanousek, J., Kocenda, E., & Svejnar, J. (2009). The effects of privatization and ownership in transition economies. Journal of Economic Literature, 47(3), 699–728. [Google Scholar] [CrossRef]
- Fasano, F., Adornetto, C., Zahid, I., La Rocca, M., Montaleone, L., Greco, G., & Cariola, A. (2024). The dilemma of accuracy in bankruptcy prediction: A new approach using explainable AI techniques to predict corporate crises. European Journal of Innovation Management, 28(11), 1–22. [Google Scholar] [CrossRef]
- Gajdosikova, D., & Michulek, J. (2025). Artificial intelligence models for bankruptcy prediction in agriculture: Comparing the performance of artificial neural networks and decision trees. Agriculture, 15(10), 1077. [Google Scholar] [CrossRef]
- Garcia-Aguero, A. I., Castillo-Diaz, F. J., Belmonte-Urena, L. J., & Camacho-Ferre, F. (2024). Socioeconomic and technical factors in European agricultural sustainable waste management: The case of Spain. Equilibrium. Quarterly Journal of Economics and Economic Policy, 19(4), 1185–1227. [Google Scholar] [CrossRef]
- Gaska, D. (2016). Predicting bankruptcy of enterprises with the use of learning methods [Doctoral dissertation, Wroclaw University of Economics]. [Google Scholar]
- Genriha, I., Pettere, G., & Voronova, I. (2011). Entrepreneurship insolvency risk management: A case of Latvia. International Journal of Banking, Accounting and Finance, 3(1), 31–46. [Google Scholar] [CrossRef]
- Gholampoor, H., & Asadi, M. (2024). Risk analysis of bankruptcy in the US healthcare industries based on financial ratios: A machine learning analysis. Journal of Theoretical and Applied Electronic Commerce Research, 19(2), 1303–1320. [Google Scholar] [CrossRef]
- Gregova, E., Valaskova, K., Adamko, P., Tumpach, M., & Jaros, J. (2020). Predicting financial distress of Slovak enterprises: Comparison of selected traditional and learning algorithms methods. Sustainability, 12(10), 3954. [Google Scholar] [CrossRef]
- Grigaravicius, S. (2003). Corporate failure diagnosis: Reliability and practice. Management of Organizations: Systematic Research, (28), 29–42. Available online: https://www.lituanistika.lt/content/38460 (accessed on 8 July 2025).
- Grunberg, M., & Lukason, O. (2014). Predicting bankruptcy of manufacturing firms. International Journal of Trade, Economics and Finance, 5(1), 93. [Google Scholar] [CrossRef]
- Gruszczynski, M. (2003). Models of microeconometrics in the analysis and forecasting of the financial risk of enterprises. Zeszyty Polskiej Akademii Nauk, 23. [Google Scholar] [CrossRef]
- Gul, Y., & Altinirmak, S. (2025). Predicting financial failure: Empirical evidence from publicly–quoted firms in developed and developing countries. Ekonomi Politika ve Finans Arastirmalari Dergisi, 10(1), 107–126. [Google Scholar] [CrossRef]
- Guo, H., Li, Y., Shang, J., Gu, M., Huang, Y., & Gong, B. (2017). Learning from class-imbalanced data: Review of methods and applications. Expert Systems with Applications, 73, 220–239. [Google Scholar] [CrossRef]
- Gurcik, L. (2002). G-index—The financial situation prognosis method of agricultural enterprises. Agricultural Economics, 48(8), 373–378. [Google Scholar] [CrossRef]
- Haini, H., Borhanudin, S., & Loon, P. W. (2023). Digitalisation, exports, government support and firms’ finances during the COVID-19 pandemic: Evidence from Central and Eastern Europe. Economic Papers: A Journal of Applied Economics and Policy, 42(4), 408–418. [Google Scholar] [CrossRef]
- Hajdu, O., & Virag, M. (2001). A Hungarian model for predicting financial bankruptcy. Society and Economy in Central and Eastern Europe, 23(1/2), 28–46. [Google Scholar]
- Hamadou, I., Yumna, A., Hamadou, H., & Jallow, M. S. (2024). Unleashing the power of artificial intelligence in Islamic banking: A case study of Bank Syariah Indonesia (BSI). Modern Finance, 2(1), 131–144. [Google Scholar] [CrossRef]
- Hamdi, M., Mestiri, S., & Arbi, A. (2024). Artificial intelligence techniques for bankruptcy prediction of Tunisian companies: An application of machine learning and deep learning-based models. Journal of Risk and Financial Management, 17(4), 132. [Google Scholar] [CrossRef]
- Horak, J., Krulicky, T., Rowland, Z., & Machova, V. (2020). Creating a comprehensive method for the evaluation of a company. Sustainability, 12(21), 9114. [Google Scholar] [CrossRef]
- Horvathova, J., Mokrisova, M., & Petruska, I. (2021). Selected methods of predicting financial health of companies: Neural networks versus discriminant analysis. Information, 12(12), 505. [Google Scholar] [CrossRef]
- Horvathova, J., Mokrisova, M., & Schneider, A. (2024). The application of machine learning in diagnosing the financial health and performance of companies in the construction industry. Information, 15(6), 355. [Google Scholar] [CrossRef]
- Isimoya, O. A., & Oluwaleye, T. O. (2023). Financial literacy and entrepreneurial risk attitude of selected small and medium sized enterprises in Nigeria. Management Dynamics in the Knowledge Economy, 11(4), 372–384. [Google Scholar] [CrossRef]
- Jencova, S., Petruska, I., & Miskufova, M. (2024). Relationship between profitability and debt: The case of the Slovak Energy and Mining sector. Ekonomicko-Manazerske Spektrum, 18(2), 38–49. [Google Scholar]
- Jencova, S., Stefko, R., & Vasanicova, P. (2020). Scoring model of the financial health of the electrical engineering industry’s non-financial corporations. Energies, 13(17), 4364. [Google Scholar] [CrossRef]
- Jeong, C., Min, J. H., & Kim, M. S. (2012). A tuning method for the architecture of neural network models incorporating GAM and GA as applied to bankruptcy prediction. Expert Systems with Applications, 39(3), 3650–3658. [Google Scholar] [CrossRef]
- Juracka, D., Nagy, M., Valaskova, K., & Nica, E. (2024). A meta-analysis of innovation management in scientific research: Unveiling the frontier. Systems, 12(4), 130. [Google Scholar] [CrossRef]
- Karas, M., & Reznakova, M. (2014). A parametric or nonparametric approach for creating a new bankruptcy prediction model: The evidence from the Czech Republic. International Journal of Mathematical Models and Methods in Applied Sciences, 8(1), 214–223. [Google Scholar]
- Karas, M., & Reznakova, M. (2015). Predicting bankruptcy under alternative conditions: The effect of a change in industry and time period on the accuracy of the model. Procedia-Social and Behavioral Sciences, 213, 397–403. [Google Scholar] [CrossRef]
- Karbownik, L. (2017). Methods for assessing the financial risk of enterprises in the TSI sector in Poland. Wydawnictwo Uniwersytetu Lodzkiego. [Google Scholar]
- Kasper, K. (2016). Permanent insolvency prediction model in the example of Estonian microenterprises financed with start-up grant. University of Tartu. Available online: https://dspace.ut.ee/bitstream/handle/10062/52390/kasper_kaspar.pdf (accessed on 9 June 2025).
- Kazakov, D., & Nikolov, V. (2024). Predictive savings service. In Science and Information Conference (pp. 578–587). Springer Nature Switzerland. [Google Scholar] [CrossRef]
- Kliestik, T., Misankova, M., Valaskova, K., & Svabova, L. (2018). Bankruptcy prevention: New effort to reflect on legal and social changes. Science and Engineering Ethics, 24(2), 791–803. [Google Scholar] [CrossRef]
- Kocmanova, A., Pavlakova, D.-M., & Nemecek, P. (2014, September 10–13). Sustainable corporate performance index for manufacturing industry. 18th World Multi-Conference on Systemics, Cybernetics and Informatics (pp. 31–36), Orlando, FL, USA. [Google Scholar]
- Kohv, K., & Lukason, O. (2021). What best predicts corporate bank loan defaults? An analysis of three different variable domains. Risks, 9(2), 29. [Google Scholar] [CrossRef]
- Koleda, N., & Lace, N. (2009). Development of comparative-quantitative measures of financial stability for Latvian enterprises. Economics and Management, (14), 78–84. Available online: https://scispace.com/pdf/development-of-comparative-quantitative-measures-of-zi0bo64hzs.pdf (accessed on 8 July 2025).
- Kontsevaya, S., Chachotkin, S., Kostina, R., & Khoruziy, L. (2019). Ranking score of financial condition and fear of bankruptcy to evaluate operation’s continuity of dairy milk processing companies: Evidence from the Republic of Belarus. Hradec Economic Days, 9(1), 422–430. [Google Scholar]
- Korol, T. (2004). Assessment of the accuracy of the application of discriminatory methods and artificial neural networks for the identification of enterprises threatened with bankruptcy [Doctoral dissertation, University of Gdansk]. [Google Scholar]
- Korol, T. (2010a). Early warning systems of enterprises to the risk of bankruptcy. Wolters Kluwer. [Google Scholar]
- Korol, T. (2010b). Forecasting bankruptcies of companies using soft computing techniques. Finansowy Kwartalnik Internetowy “e-Finanse”, 6, 1–14. [Google Scholar]
- Korol, T. (2013a). A new approach to ratio analysis in an enterprise. Wolters Kluwer Polska. [Google Scholar]
- Korol, T. (2013b). Early warning models against bankruptcy risk for Central European and Latin American enterprises. Economic Modelling, 31, 22–30. [Google Scholar] [CrossRef]
- Korol, T. (2019). Dynamic bankruptcy prediction models for European enterprises. Journal of Risk and Financial Management, 12(4), 185. [Google Scholar] [CrossRef]
- Kovacova, M., Valaskova, K., Durana, P., & Kliestikova, J. (2019). Innovation management of the bankruptcy: Case study of Visegrad group countries. Marketing and Management of Innovations, 10(4), 241–251. [Google Scholar] [CrossRef]
- Krajewski, J., Tokarski, A., & Tokarski, M. (2020). The analysis of the bankruptcy of enterprises exemplified by the Visegrad Group. Journal of Business Economics and Management, 21(2), 593–609. [Google Scholar] [CrossRef]
- Kral, P., Stachova, M., & Sobisek, L. (2014, August 27–31). Utilization of repeatedly measured financial ratios in corporate financial distress prediction in Slovakia. Applications of Mathematics and Statistics in Economics. 17-th AMSE. Applications of Mathematics in Economics. International Scientific Conference, Wrocław, Poland. [Google Scholar]
- Krawczyk, B. (2016). Learning from imbalanced data: Open challenges and future directions. Progress in Artificial Intelligence, 5(4), 221–232. [Google Scholar] [CrossRef]
- Kuiziniene, D., & Krilavicius, T. (2024). Balancing techniques for advanced financial distress detection using artificial intelligence. Electronics, 13(8), 1596. [Google Scholar] [CrossRef]
- Kuiziniene, D., Krilavicius, T., Damasevicius, R., & Maskeliunas, R. (2022). Systematic review of financial distress identification using artificial intelligence methods. Applied Artificial Intelligence, 36(1), 2138124. [Google Scholar] [CrossRef]
- Kuiziniene, D., Savickas, P., Kunickaite, R., Juozaiteine, R., Damasevicius, R., Maskeliunas, R., & Krilavicius, T. (2024). A comparative study of feature selection and feature extraction methods for financial distress identification. PeerJ Computer Science, 10, e1956. [Google Scholar] [CrossRef]
- Kuster, D., Vukovic, B., Milutinovic, S., Pestovic, K., Tica, T., & Jaksic, D. (2023). Early insolvency prediction as a key for sustainable business growth. Sustainability, 15(21), 15304. [Google Scholar] [CrossRef]
- Lambsdorff, J. G. (2007). The institutional economics of corruption and reform: Theory, evidence and policy. Cambridge University Press. [Google Scholar]
- La Porta, R., Lopez-de-Silanes, F., & Shleifer, A. (1999). Corporate ownership around the world. The Journal of Finance, 54(2), 471–517. [Google Scholar] [CrossRef]
- Lazaroiu, G., & Rogalska, E. (2024). Generative artificial intelligence marketing, algorithmic predictive modeling, and customer behavior analytics in the multisensory extended reality metaverse. Oeconomia Copernicana, 15(3), 825–835. [Google Scholar] [CrossRef]
- Liu, W., Suzuki, Y., & Du, S. (2025). Ensemble learning algorithms based on easyensemble sampling for financial distress prediction. Annals of Operations Research, 346(3), 1–32. [Google Scholar] [CrossRef]
- Lobanova, E. N., Zmitrovich, A. I., Voshevoz, A. A., Krivko-Krasko, A. V., & Zbarouski, S. N. (2012, September 24–26). Current financial diagnostics of enterprises. International Conference (pp. 66–69), Minsk, Belarus. [Google Scholar]
- Lokanan, M. E., & Ramzan, S. (2024). Predicting financial distress in TSX-listed firms using machine learning algorithms. Frontiers in Artificial Intelligence, 7, 1466321. [Google Scholar] [CrossRef]
- Lukason, O. (2006). Pankrotistumiste modelleerimine eesti kaubandusettevotete naitel [Dissertation Abstract, University of Tartu]. [Google Scholar]
- Lukason, O., & Kasper, K. (2017). Failure prediction of government funded start-up firms. Investment Management and Financial Innovations, 14(2), 296–306. [Google Scholar] [CrossRef]
- Malakauskas, A., & Lakstutiene, A. (2021). Financial distress prediction for small and medium enterprises using machine learning techniques. Engineering Economics, 32(1), 4–14. [Google Scholar] [CrossRef]
- Malone, T. L., Pink, G. H., & Holmes, G. M. (2025). An updated model of rural hospital financial distress. The Journal of Rural Health, 41(2), e12882. [Google Scholar] [CrossRef] [PubMed]
- Mannasoo, K. (2007). Determinants of firm sustainability in Estonia. Eesti Pank. [Google Scholar]
- Mannasoo, K., Maripuu, P., & Hazak, A. (2018). Investments, credit, and corporate financial distress: Evidence from Central and Eastern Europe. Emerging Markets Finance and Trade, 54(3), 677–689. [Google Scholar] [CrossRef]
- Martin, C. J. G., & Herrero, B. (2025). Employee satisfaction, firm performance and financial distress. Journal of Risk Finance, 26(3), 393–409. [Google Scholar] [CrossRef]
- Mate, D., Raza, H., & Ahmad, I. (2023). Comparative analysis of machine learning models for bankruptcy prediction in the context of Pakistani companies. Risks, 11(10), 176. [Google Scholar] [CrossRef]
- Mauro, P. (1995). Corruption and growth. The Quarterly Journal of Economics, 110(3), 681–712. [Google Scholar] [CrossRef]
- Megan, O., & Circa, C. (2014). Insolvency prediction tools for middle and large scale Romanian enterprises. Transformations in Business & Economics, 13(2B), 661–675. [Google Scholar]
- Michalkova, L., & Ponisciakova, O. (2025). Bankruptcy prediction, financial distress and corporate life cycle: Case study of Central European enterprises. Administrative Sciences, 15(2), 63. [Google Scholar] [CrossRef]
- Michaluk, K. (2003). Effectiveness of corporate bankruptcy models in Polish economic conditions. In Corporate finance in the face of globalization processes. Wydawnictwo Gdanskiej Akademii Bankowej. [Google Scholar]
- Mihalovic, M. (2018). Applicability of scoring models in firms’ default prediction: The case of Slovakia. Politicka Ekonomie, 66(6), 689–708. [Google Scholar] [CrossRef]
- Mititean, P., & Sarmas, F. N. (2023). Harmonizing sustainability disclosure and financial performance: An in-depth exploration within the European energy industry and beyond. Management Dynamics in the Knowledge Economy, 11(4), 385–401. [Google Scholar] [CrossRef]
- Muntean, N., Plotnikov, V., Anghel, I., & Cismasu, I. D. (2019). The impact of corruption on corporate insolvencies in the Central and Eastern Europe countries. Quality-Access to Success, 20, 408–415. [Google Scholar]
- Nagy, M., Valaskova, K., Kovalova, E., & Macura, M. (2024). Drivers of S&P 500’s profitability: Implications for investment strategy and risk management. Economies, 12(4), 77. [Google Scholar] [CrossRef]
- Nemec, D., & Pavlik, M. (2016, May 25–27). Predicting insolvency risk of the Czech companies. International Conference: Quantitative Methods in Economics: Multiple Criteria Decision Making XVIII (pp. 258–263), Vratna, Slovakia. [Google Scholar]
- Njoku, A. O., Mpinda, B. N., & Awe, O. O. (2024, October 5–6). Improving the accuracy of financial bankruptcy prediction using ensemble learning techniques. Pan African Conference on Artificial Intelligence (pp. 3–29), Addis Ababa, Ethiopia. [Google Scholar] [CrossRef]
- Nyitrai, T., & Virag, M. (2019). The effects of handling outliers on the performance of bankruptcy prediction models. Socio-Economic Planning Sciences, 67, 34–42. [Google Scholar] [CrossRef]
- Odom, M. D., & Sharda, R. (1990, June 17–21). A neural network model for bankruptcy prediction. 1990 IJCNN International Joint Conference on Neural Networks (pp. 163–168), San Diego, CA, USA. [Google Scholar]
- Oner, N., Zengul, F. D., & Agirbas, I. (2024). Evaluation of the financial distress of hospitals through machine learning: An application of AI in healthcare industry. Intelligent Systems in Accounting, Finance and Management, 31(4), e70000. [Google Scholar] [CrossRef]
- Pamuk, M., Grendel, R. O., & Schumann, M. (2021, December 6–10). Towards ML-based platforms in finance industry: An ML approach to generate corporate bankruptcy probabilities based on annual financial statements [Conference presentation]. Australasian Conference on Information Systems (ACIS 2021), Sydney, Australia. [Google Scholar]
- Papik, M., & Papikova, L. (2024). Automated machine learning in bankruptcy prediction of manufacturing companies. Procedia Computer Science, 232, 1428–1436. [Google Scholar] [CrossRef]
- Pawlowski, J., & Exchange, S. (2024). Derivatives in currency risk management in non-financial entities. Silesian University of Technology. Organization & Management/Zeszyty Naukowe Politechniki Slaskiej. Seria Organizacji i Zarzadzanie, (205). [Google Scholar]
- Pendharkar, P. C. (2005). A threshold-varying artificial neural network approach for classification and its application to bankruptcy prediction problem. Computers & Operations Research, 32(10), 2561–2582. [Google Scholar] [CrossRef]
- Perotti, F. A., Dhir, A., Ferraris, A., & Kliestik, T. (2024). Investigating digital technologies’ implementation in circular businesses: Evidence from the going circular path. Journal of Management & Organization, 30(3), 421–451. [Google Scholar] [CrossRef]
- Pervan, I. (2015, May 7–8). Firm failure modeling: Risk index models vs. sophisticated techniques. 25th International Business Information Management Association Conference (pp. 826–838), Amsterdam, The Netherlands. [Google Scholar]
- Pisula, T., Mentel, G., & Brozyna, J. (2013). Predicting bankruptcy of companies from the logistics sector operating in the Podkarpacie region. Modern Management Review, 18(20), 113–133. [Google Scholar] [CrossRef]
- Pisula, T., Mentel, G., & Brozyna, J. (2015). Non-statistical methods of analysing of bankruptcy risk. Folia Oeconomica Stetinensia, 15(1), 7–21. [Google Scholar] [CrossRef]
- Pociecha, J., Pawelek, B., Baryla, M., & Augustyn, S. (2014). Statistical methods of forecasting bankruptcy in the changing economic situation. Fundacja Uniwersytetu Ekonomicznego w Krakowie. [Google Scholar]
- Podhorska, I., Vrbka, J., Lazaroiu, G., & Kovacova, M. (2020). Innovations in financial management: Recursive prediction model based on decision trees. Marketing and Management of Innovations, 2020(3), 276–292. [Google Scholar] [CrossRef]
- Popchev, I., & Radeva, I. (2006). A decision support method for investment preference evaluation. Cybernetics and Information Technologies, 6(1), 3–16. [Google Scholar]
- Popescu, M. E., & Dragota, V. (2018). What do post-communist countries have in common when predicting financial distress? Prague Economic Papers, 2018(6), 637–653. [Google Scholar] [CrossRef]
- Poufinas, T., & Siopi, E. (2024). Investment portfolio allocation and insurance solvency: New evidence from insurance groups in the era of Solvency II. Risks, 12(12), 191. [Google Scholar] [CrossRef]
- Prusak, B., & Karas, M. (2024). Bankruptcy prediction in Visegrad Group countries. Polish Journal of Management Studies, 30(1), 268–288. [Google Scholar] [CrossRef]
- Purvinis, O., Sukys, P., & Virbickaite, R. (2005a). Bankruptcy prediction in Lithuanian enterprises using discriminant analysis. Ekonomika ir Vadyba: Aktualijos ir Perspektyvos, 5, 314–318. [Google Scholar]
- Purvinis, O., Sukys, P., & Virbickaite, R. (2005b). Research of possibility of bankruptcy diagnostics applying neural network. Engineering Economics, 41(1), 16–22. [Google Scholar]
- Purvinis, O., Virbickaite, R., & Sukys, P. (2008). Interpretable nonlinear model for enterprise bankruptcy prediction. Nonlinear Analysis: Modelling and Control, 13(1), 61–70. [Google Scholar] [CrossRef]
- Radkov, P. (2013). Measuring default risk of Bulgarian public banks with meton model. Faculty of Mathematics and Informatics, Sofia University. [Google Scholar] [CrossRef]
- Radkov, P., & Minkova, L. (2011). Assessing bank’s default probability using the ASRF model. University Library of Munich. [Google Scholar]
- Radovanovic, J., & Haas, C. (2023). The evaluation of bankruptcy prediction models based on socio-economic costs. Expert Systems with Applications, 227, 120275. [Google Scholar] [CrossRef]
- Rahman, A., & Belas, J. (2024). Sectoral view on financial management of SMEs. Empirical research in V4 countries. Ekonomicko-Manazerske Spektrum, 18(2), 14–23. [Google Scholar]
- Sabek, A., Horak, J., Musa, H., & da Silva, A. F. (2024). Bankruptcy prediction using first-order autonomous learning multi-model classifier. Statistika: Statistics & Economy Journal, 104(4), 440–464. [Google Scholar] [CrossRef]
- Santoro, G., Jabeen, F., Kliestik, T., & Bresciani, S. (2024). AI-powered growth hacking: Benefits, challenges and pathways. Management Decision. ahead-of-print. [Google Scholar] [CrossRef]
- Savitskaya, G. B. (2006). The methodology of complex analysis of economic activities (pp. 1–270). INFRA-M. [Google Scholar]
- Schwarcz, S. L. (2018). Beyond bankruptcy: Resolution as a macroprudential regulatory tool. Notre Dame Law Review, 94(2), 709–750. [Google Scholar]
- Seretidou, D., Billios, D., & Stavropoulos, A. (2025). Integrative analysis of traditional and cash flow financial ratios: Insights from a systematic comparative review. Risks, 13(4), 62. [Google Scholar] [CrossRef]
- Shafiee, M., Saleh, H., & Paydar, G. A. (2024). Predict of financial distress by logistic regression, DEA-R and CAMELS indicators. Journal of Mathematical Extension, 18(3), 1–29. [Google Scholar] [CrossRef]
- Shakun, A. S., & Skrobko, V. (2012). Agricultural enterprise probability forecasting on the basis of discriminant multifactor models. Problems and Prospects, 17, 169–177. [Google Scholar]
- Shetty, S., Musa, M., & Bredart, X. (2022). Bankruptcy prediction using machine learning techniques. Journal of Risk and Financial Management, 15(1), 35. [Google Scholar] [CrossRef]
- Siimon, O. R., & Lukason, O. (2021). A decision support system for corporate tax arrears prediction. Sustainability, 13(15), 8363. [Google Scholar] [CrossRef]
- Slavici, T. I. T. U. S., & Mnerie, D. U. M. I. T. R. U. (2012). Some applications of artificial neural networks in agricultural management. Aktualni Zadaci Mehanizacije Poljoprivrede, 40, 363–373. [Google Scholar]
- Sneidere, R., & Bruna, I. (2011). Predicting business insolvency: The Latvian experience. Journal of Modern Accounting and Auditing, 7(5), 487–497. [Google Scholar]
- Sorins, R., & Voronova, I. (1998). Uzņēmuma maksātnespējas novērtējums. Ekonomiskas Problemas Uznemejdarbiba, 3, 125–131. [Google Scholar]
- Stachova, M., Kral, P., Sobisek, L., & Kakascik, M. (2015, September 2–6). Analysis of financial distress of Slovak companies using repeated measurements. 18th Applications of Mathematics and Statistics in Economics, Jindřichův Hradec, Czech Republic. [Google Scholar]
- Stef, N. (2021). Institutions and corporate financial distress in Central and Eastern Europe. European Journal of Law and Economics, 52(1), 57–87. [Google Scholar] [CrossRef]
- Sun, J., Zhou, M., Ai, W., & Li, H. (2019). Dynamic prediction of relative financial distress based on imbalanced data stream: From the view of one industry. Risk Management, 21(4), 215–242. [Google Scholar] [CrossRef]
- Svabova, L., & Durica, M. (2019). Being an outlier: A company non-prosperity sign? Equilibrium. Quarterly Journal of Economics and Economic Policy, 14(2), 359–375. [Google Scholar] [CrossRef]
- Szeverin, E.-K., & Laszlo, K. (2014). The efficiency of bankruptcy forecast models in the Hungarian SME sector. Journal of Competitiveness, 6(2), 56–73. [Google Scholar] [CrossRef]
- Tinoco, M. H., & Wilson, N. (2013). Financial distress and bankruptcy prediction among listed companies using accounting, market and macroeconomic variables. International Review of Financial Analysis, 30, 394–419. [Google Scholar] [CrossRef]
- Trubina, Y. E. (2016). Improvement of the institution of insolvency (bankruptcy) in the Republic of Belarus. Science & Technique, 15(6), 521–527. [Google Scholar] [CrossRef][Green Version]
- Tudor, L., Popescu, M. E., & Andreica, M. (2015). A decision support system to predict financial distress: The case of Romania. Romanian Journal of Economic Forecasting, 18(4), 170–179. [Google Scholar]
- Umar, U. H., Al-Faryan, M. A. S., & Osemy, A. Z. Z. (2025). Relationship between free cash flow and corporate financial distress: Evidence from listed halal food and beverage companies in Malaysia. Journal of Islamic Accounting and Business Research. [Google Scholar] [CrossRef]
- Valaskova, K., Nagy, M., & Grecu, G. (2024). Digital twin simulation modeling, artificial intelligence-based Internet of Manufacturing Things systems, and virtual machine and cognitive computing algorithms in the Industry 4.0-based Slovak labor market. Oeconomia Copernicana, 15(1), 95–143. [Google Scholar] [CrossRef]
- Valaskova, K., Nagy, M., & Juracka, D. (2025). Digital transformation and financial performance: An empirical analysis of strategic alignment in the digital age. Journal of Enterprising Communities: People and Places in the Global Economy. [Google Scholar] [CrossRef]
- Virag, M., & Kristof, T. (2005). Neural networks in bankruptcy prediction—A comparative study on the basis of the first Hungarian bankruptcy model. Acta Oeconomica, 55(4), 403–426. [Google Scholar] [CrossRef]
- Virglerova, Z., Homolka, L., Smrcka, L., Lazanyi, K., & Kliestik, T. (2017). Key determinants of the quality of business environment of SMEs in the Czech Republic. E a M Ekonomie a Management, 20(2), 87–101. [Google Scholar] [CrossRef]
- Vochozka, M., Rowland, Z., & Vrbka, J. (2016). Evaluation of solvency of potential customers of a company. Matematichne Modelovanie v Ekonomike, (1), 5–18. Available online: http://jnas.nbuv.gov.ua/article/UJRN-0000531887 (accessed on 8 July 2025).
- Vochozka, M., Strakova, J., & Vachal, J. (2015). Model to predict survival of transportation and shipping companies. NASE MORE: Znanstveni Casopis za More i Pomorstvo, 62(3), 109–113. [Google Scholar] [CrossRef]
- Wang, J., Li, M., Moorhead, M., & Skitmore, M. (2025). Forecasting financial distress in listed Chinese construction firms: Leveraging ensemble learning and non-financial variables. Construction Management and Economics, 43(3), 175–195. [Google Scholar] [CrossRef]
- Wedzki, D. (2004). Logit model of bankruptcy for the Polish economy—Conclusions from the study. In Time for money. corporate finance. Financing enterprises in the EU. Wydawnictwo Uniwersytetu Szczecinskiego. [Google Scholar]
- Yu, Q., Miche, Y., Severin, E., & Lendasse, A. (2014). Bankruptcy prediction using extreme learning machine and financial expertise. Neurocomputing, 128, 296–302. [Google Scholar] [CrossRef]
- Zdyb, M. (2001). Assessing the enterprise’s risk of bankruptcy using financial synthetic indicators. Controlling i Rachunkowosc Zarzadcza, 5, 36–40. [Google Scholar]
- Zelenkov, Y. (2024). Firm failure prediction using genetic programming generated features. Expert Systems with Applications, 249, 123839. [Google Scholar] [CrossRef]
- Zmuk, B. (2017). Speeding problem detection in business surveys: Benefits of statistical outlier detection methods. Croatian Operational Research Review, 8(1), 33–59. [Google Scholar] [CrossRef]


Disclaimer/Publisher’s Note: The statements, opinions and data contained in all publications are solely those of the individual author(s) and contributor(s) and not of MDPI and/or the editor(s). MDPI and/or the editor(s) disclaim responsibility for any injury to people or property resulting from any ideas, methods, instructions or products referred to in the content. |
© 2025 by the authors. Licensee MDPI, Basel, Switzerland. This article is an open access article distributed under the terms and conditions of the Creative Commons Attribution (CC BY) license (https://creativecommons.org/licenses/by/4.0/).