Article

Financial Performance and Corporate Governance on Firm Value: Evidence from Spain

by
Leslie Rodríguez Valencia
Department of Business and Business Analytics, Universidad Europea de Madrid, C. Tajo, s/n, 28670 Madrid, Spain
Int. J. Financial Stud. 2025, 13(3), 123; https://doi.org/10.3390/ijfs13030123
Submission received: 12 March 2025 / Revised: 12 June 2025 / Accepted: 23 June 2025 / Published: 3 July 2025

Abstract

This paper investigates the financial performance and corporate governance variables that influence firm valuation. This study analyzes 91 Spanish small and medium-sized enterprises (SMEs) listed on BME Growth using a fixed effects panel data model based on 5760 observations. This study covered a period of five years from 2015 to 2019. This study concludes that profitability, capital structure and ownership concentration are key value drivers, while liquidity and efficiency are not statistically significant and require further contextual examination. Regarding corporate governance, the presence of controlling shareholders was found to have a significant positive impact on firm value, reinforcing the importance of ownership concentration in reducing agency conflicts and enhancing oversight. Other governance frameworks, such as firm structure and managerial concentration, did not exhibit significant effects.

1. Introduction

According to the theory of the firm, the main financial objective of companies is to maximize shareholder value (Hirdinis, 2019). In recent years, researchers have attempted to develop various models based on hypotheses concerning financial and market factors, board structure, ownership and governance levels, and the cost of capital to facilitate decision-making for investors and shareholders. The determination of firm value is a systematic process in which a series of internal and external factors contribute to achieving the objective of maximizing the company’s value, which in turn maximizes shareholder wealth (Damodaran, 2012).
The share market price, which represents firm value and performance, influences investors’ decision-making processes. Information on market price can inform investors’ investment strategies. Investors tend to purchase shares that are undervalued and avoid those that are overvalued (Sudiyatno et al., 2020).
Financial ratios are widely used to evaluate a firm’s financial health and performance. This research explores the impact of profitability, liquidity, productivity, and capital structure on the firm valuation. Profitability is measured through ROA and ROE, with mixed evidence on their impact on stock prices (Arifianto & Chabachib, 2016; Laim et al., 2015). Liquidity is measured using the Current Ratio, which reflects a firm’s ability to meet short-term obligations. Productivity is measured using the Total Asset Turnover (TATO) ratio, which measures a firm’s efficiency in using its assets to generate income. Evidence on TATO’s influence on firm value is also mixed. Capital structure is calculated using Debt-to-Equity Ratio (DER) and solvency ratios. High DER can increase financial risk, but findings on its relationship with firm value vary. Some studies report negative effects of leverage, while others find positive or insignificant results (Charumanithi & Krishnan, 2016).
Corporate governance remains one of the most critical topics in finance, closely linked to market price, profitability, and the general performance and productivity of the economic system. Additionally, studies (Yermack, 1996; Gompers et al., 2003; Klapper & Love, 2004; Florackis et al., 2009) related to corporate governance highlight the importance of features that influence firm value.
The corporate governance framework serves as a mechanism to protect investors against potential conflicts of interest between shareholders and company management. Rooted in agency theory, effective corporate governance helps ensure that investors receive returns on their investments (Kurnia et al., 2020). Agency theory posits that managers and owners have significantly different interests (Fama & Jensen, 1983; Jensen & Meckling, 1976).
Previous studies have yielded inconclusive and inconsistent results regarding the factors that influence firm value. Considering the significant role of SMEs in global economies, particularly in job creation, wealth generation, and economic growth (Mateev et al., 2013; Newman et al., 2012), this research examines financial performance and corporate governance as variables influencing firm value in the context of Spanish small and medium companies listed on the alternative stock market, also known as BME Growth.1
BME Growth is a platform designed for Spanish small and medium-sized enterprises (SMEs) to access capital markets. It provides a key gateway for these growing companies to secure the funding they need for expansion and development (BME Growth, 2025). BME Growth helps by offering these companies increased visibility and credibility, making it easier for them to secure the necessary capital for growth.
According to the Spanish context, SMEs are the backbone of the economy, comprising over 99% of all businesses and employing 80% of the workforce, contributing 65% to the country’s GDP. The Spanish business landscape is characterized by several distinctive features, including a high concentration of ownership and management (Rodríguez-Valencia & Lamothe Fernández, 2023). The typical listed Spanish company has multiple major controlling shareholders, with many firms having less than 50% of their shares available for public trading. Additionally, private Spanish SMEs often trade at a premium compared to listed firms, reflecting their relative illiquidity and higher risk (Rodríguez-Valencia et al., 2023). Firms in countries such as Germany, France, Portugal and Italy tend to exhibit similar patterns in ownership structures, board composition, insider-oriented corporate governance and prevalence of family firms. However, some differences can be observed among firms in these countries. France’s corporate governance system resembles the Anglo-Saxon model, especially among large listed firms, with greater transparency and stricter regulations. Italy and Spain maintain a strong tradition of family-owned businesses, with boards often controlled by majority shareholders. Portugal, though smaller, shows similar traits to Spain, including concentrated ownership (Colli et al., 2013; Aguilera & Jackson, 2010).
The objective of this paper is to investigate the financial performance and corporate governance variables that influence firm valuation in the context of listed Spanish small and medium-sized enterprises using a fixed effect model panel data approach with 5760 observations from 91 SMEs from 2015 to 2019.
This study simultaneously examines the impact of financial performance and corporate governance on firm value since there is a complementary relationship between these two factors in fostering value creation. While financial performance serves as a proxy of a firm’s operations and profitability, corporate governance establishes the structures and mechanisms that ensure the alignment of interests between management and shareholders, reducing conflicts and improving strategic decision-making.
Our research makes several important contributions to the academic literature. First, it enhances and extends the body of work examining the impact of ownership concentration on firm value, focusing specifically on small and medium-sized enterprises, many of which are family-owned or exhibit high levels of ownership concentration. In addition, we contribute to the literature by exploring the role of independent directors in influencing firm value within a soft corporate governance framework, from which SMEs are typically exempt. Third, we estimate a model to examine the impact of profitability, capital structure and corporate governance mechanisms, specifically ownership structure, board composition and managerial structure on listed SMEs. The findings suggest that profitability and ownership concentration are significant determinants of firm value, underscoring the critical roles of operational efficiency and effective shareholder monitoring. Liquidity, operational efficiency, capital structure, and other governance mechanisms such as firm structure and managerial concentration do not exhibit statistically significant effects, emphasizing the importance of accounting for firm-specific and industry-specific contexts when assessing the determinants of firm value. Fourth, the findings of this study, based on a sample of Spanish firms, may be generalizable to companies in other countries that share similar corporate structures, such as France, Portugal, Italy, etc.
This paper is organized as follows: Section 2 discusses the theoretical framework and formulates research hypotheses; Section 3 outlines the research methodology; and Section 4 describes and examines the empirical results. Finally, Section 5 summarizes the main findings and conclusions.

2. Theoretical Background

This research draws upon recognized financial theories, including trade-off theory, pecking order theory, agency theory, and signaling theory. A brief introduction to these theories is provided before formulating hypotheses in our specific empirical context.

2.1. Trade-Off Theory

Under option pricing theory, debt can be viewed as a short put option that the lender sells to the borrower. In contrast, equity is to be considered a call option on the firm’s assets. Merton (1974) was the first to formally develop this conceptual basis, building on the initial study conducted by Black and Scholes (1974), who had already noted in their research that firm equity can be examined as a call option on the firm’s assets. The trade-off theory posits that enterprises typically finance their operations through a combination of debt and equity. Companies utilize debt to the point where the tax benefits of additional leverage are offset by the costs of financial distress, including bankruptcy, reorganization, and agency costs. According to (Titman & Wessels, 1988), firms can balance the marginal cost and benefit by trading off equity and debt financing decisions to achieve an optimal capital structure. The optimal capital structure determined by trade-off theory encompasses several factors, including agency cost (Jensen & Meckling, 1976; S. C. Myers, 1977), taxes (Modigliani & Miller, 1963; DeAngelo & Masulis, 1980), and cost of financial distress (Kim, 1978; Kraus & Litzenberger, 1973), while maintaining the assumption of market efficiency and symmetric information.
Kraus and Litzenberger (1973) initially introduced the theory, and later it was refined by S. Myers and Majluf (1984). The trade-off theory disputes Modigliani and Miller’s (1958) claim by asserting that debt benefits may be negligible or adverse, especially without corporate taxation (Dinh & Pham, 2010).
In 1963, Modigliani and Miller proposed the Modigliani–Miller Irrelevance Theorem (MMT), which states that a company’s value has no impact on its capital structure, assuming certain ideal conditions, such as the absence of taxes, transaction costs, bankruptcy costs, agency problems, or information asymmetries, and the existence of efficient markets. Building on this, Ehrhardt and Brigham (2011) developed the MM-2 model, also known as the MM model with corporate taxation, which refines the original theory by incorporating the impact of corporate taxation.
There are two ways companies can finance their assets: through debt or by issuing equity. The main advantage of the former is the tax savings from interest payments (tax shield). Therefore, there is a trade-off between the tax benefits of interest and the cost of financial distress. These tax benefits exist because interest (the cost of debt) is tax-deductible. An increase in debt can be beneficial due to the tax shield; however, it is important to consider that excessive debt can lead the company into financial distress, which is risky (Herrera et al., 2017).
Nevertheless, this theory has been criticized by many due to its lack of practicality. The firm value is influenced by numerous factors, such as information asymmetry, bankruptcy cost, agency problems, tax considerations, and industry deviations. Optimal capital structure can only be achieved if the aforementioned factors are taken into consideration for measuring the value of the firm (Sudiyatno et al., 2020; Agyei et al., 2020).

2.2. Pecking Order Theory

In 1961, Donalson proposed the pecking order, and it was then introduced by S. Myers and Majluf (1984), who postulate that a firm’s financing needs determine the level of leverage. The theory postulates that companies with higher profitability typically have smaller debts.
Enterprises tend to follow a financing hierarchy, typically preferring internal resources first, followed by debt, and turning to new equity issuance only as a last resort. This sequence reflects a progression from lower-cost to higher-cost sources of capital. Typically, firms utilize their own earnings initially because they have relatively minimal cost. This occurs in more profitable firms, as they are able to finance themselves before seeking external funding. With self-financing, the manager acts as both the provider and the user of funds, which eliminates the problem of information asymmetry. Secondly, firms request external debt, and finally, they consider the alternative of issuing new shares and generating equity (Rehman, 2016; Agyei et al., 2020).
According to (Donaldson, 1961; S. Myers & Majluf, 1984), the preference for internal funding sources is due to the floatation costs that are expected to be avoided and generally associated with external funding. They argue that while the net benefits of using external financing often outweigh flotation costs, firms prioritize internal funding to maximize the wealth of existing shareholders. Indeed, financing from debts or issuing new equity conveys signals to the market. If managers issue more shares, rational shareholders or investors may perceive that the stock is overvalued, and the stock price is likely to decline in the near future (Rehman, 2016). Notwithstanding the scenario explained above, in reality, the sources of financing for some firms may not adhere to the sequence scenario cited in the pecking order theory.
This study explores the impact of financial performance on firm value. The empirical research model is illustrated in Figure 1. Hence, we make the following hypothesis:
H1: 
Financial performance influences firm value.
Profitability is a key indicator for assessing the operational efficiency and long-term sustainability of financial institutions. Improved profitability indicates the firm’s enhanced profit-generating ability. Strong profitability not only improves their ability to withstand economic shocks but also increases their appeal to investors. This study analyzes two variables: ROA and ROE.
The return on assets (ROA) ratio assesses a firm’s profitability relative to its total assets. Several studies have found a positive relationship between ROA and stock prices, including (Jeroh, 2020; P. A. Dewi & Suaryana, 2013; Pandansari, 2012; S. Dewi & Hidayat, 2014; Kohansal et al., 2013; Daniel, 2015; Permana, 2017; Idawati & Wahyudi, 2015; Polii et al., 2014; Yulsiati, 2016). However, other research, such as (Meythi & Rusli, 2011; Safitri, 2013; Buigut et al., 2013), found no significant effect of ROA on stock prices.
Return on Equity (ROE) is a profitability ratio that evaluates a firm’s ability to generate net income relative to shareholders’ equity. High ROE tends to attract investors, boosting stock prices. Studies by (Arifianto & Chabachib, 2016; Sucuahi & Cambarihan, 2016; Suffah & Riduwan, 2016; Tiska, 2015; Hamidah & Umdiana, 2017) support the positive relationship between profitability and firm value. However, conflicting results have also been reported; while (Purba & Africa, 2019; Arifianto & Chabachib, 2016) found a positive effect of profitability on firm value, (Laim et al., 2015) identified a negative relationship, and studies by (Hirdinis, 2019) found no significant impact. Therefore, we propose the following hypotheses:
H1a: 
Higher levels of profitability are positively associated with increased firm value in small and medium-sized enterprises.
The Current Ratio (CR), a key indicator of liquidity, is determined by the ratio of current assets divided by current liabilities. The liquidity variable impacts firm value by indicating the company’s capacity to fulfill short-term obligations. A favorable liquidity condition tends to generate a positive perception of the firm’s financial health among investors, thereby enhancing the company’s overall value (Brigham & Houston, 2021; Damodaran, 2012). Therefore, we propose the following hypotheses:
H1b: 
The liquidity ratio positively affects the firm value of small and medium-sized enterprises listed on secondary markets.
The Total Asset Turnover (TATO) ratio assesses how efficiently a firm utilizes its assets to generate sales revenue. A higher TATO ratio indicates more effective asset utilization. According to (Tan et al., 2014) a positive relationship between Total Asset Turnover (TATO) and firm value can be achieved when a company effectively manages its assets to enhance productivity. As TATO increases, indicating more efficient use of assets to generate revenue, firm value is also expected to rise. Therefore, a higher TATO is expected to contribute positively to the firm’s value. Deitiana (2013) found no significant relationship. Therefore, we propose the following hypotheses:
H1c: 
The productivity of the firm positively affects the firm’s value listed on secondary markets.
Capital structure refers to the mix of debt and equity used to finance a firm’s operations and plays a crucial role in determining firm value. A company may secure additional capital to support its operations by issuing equity, debt, or hybrid securities (Stoiljković et al., 2022).
Some authors find that during the early stages of a firm’s development, debt serves as the primary source of financing. However, as firms reach maturity, they tend to replace debt with internal capital, consistent with the pecking order theory (Simatupang et al., 2019). Studies related to the capital structure impact on firm value assuming the pecking order hypothesis include (Friend & Lang, 1988; Harris & Raviv, 1991; Shah & Khan, 2007; Akhtar & Oliver, 2009; Rajan & Zingales, 1995). Agency costs are also a key component of the trade-off model. A firm’s ownership structure is reflected in its capital structure, which directly affects the extent of agency costs. Variations in capital structure result in both qualitative and quantitative differences in these costs (Jensen & Meckling, 1976).
This research draws on established theories, such as the trade-off theory and pecking order theory, which offer relevant explanations for the capital structure decisions of Spanish SMEs listed on alternative stock markets. For this purpose, three variables have been used: Debt-to-Equity Ratio (DER), leverage and Solvency.
The Debt-to-Equity Ratio (DER) is a key leverage ratio used in capital structure theory to balance the benefits and costs of debt. It is calculated by dividing total debt by shareholders’ equity. Beyond its function in a firm’s financial structure, the Debt-to-Equity Ratio (DER) provides broader insights into financial viability and risk. In investment decisions, DER significantly influences perceived firm value. Researches show that DERs influence firm value (Rompas, 2013; Lindayani & Dewi, 2016; Lestari, 2023)
Leverage is measured as the ratio of total debt to total assets, suggesting the extent of debt utilization in a firm’s capital structure. A low leverage ratio indicates a strong equity position, while a high ratio suggests higher risk, as leverage amplifies both gains and losses within the capital structure (Rehman, 2016; Fosu et al., 2016). Research by (P. A. Dewi & Suaryana, 2013; Charumanithi & Krishnan, 2016), and (Daniel, 2015) found a negative relationship between leverage ratios and stock prices, while (Pandansari, 2012; Chen, 2011; Jeroh, 2020) reported positive effects. Other studies, including (Manoppo & Arie, 2016; Sunarto & Agus, 2009; Suffah & Riduwan, 2016; Rahman, 2014), concluded that capital structure positively influences firm value.
Solvency ratio, calculated as total equity divided by total debt, assesses a firm’s capacity to meet long-term obligations. This ratio quantifies the proportion of a firm’s equity compared to its debt. It reflects how a firm finances its operations whether it’s more reliant on owner-invested funds (equity) or borrowed funds (debt). A high total equity to total debt ratio reflects the extent to which a company depends on debt financing relative to equity; a lower debt ratio indicates greater reliance on equity financing. This typically results in lower financial risk, greater flexibility, and increased investor confidence. Conversely, a low ratio reflects higher leverage, which can elevate financial risk and potentially reduce firm value.
The impact of this ratio on firm value hinges on achieving an optimal balance between risk and return. The trade-off theory posits that firms aim to balance the tax advantages of debt against the potential costs linked to financial distress (Prasetiyo, 2022). Safitri (2013) found no significant effect, whereas Tan et al. (2014) and Sondakh et al. (2015) identified a positive relationship between solvency ratios and firm value. Therefore, we propose the following hypothesis:
H1d: 
Capital structure negatively influences firm value listed on the alternative stock market.

2.3. Signaling Theory

The efficient operation of capital markets relies on the proper dissemination of corporate information among stakeholders (Ho & Wong, 2001).
The signaling theory was proposed by (Spence, 1973) in the context of the labor market. Spence explained that in situations of asymmetric information (when one party knows more than the other), individuals can use observable signals to convey characteristics that cannot be directly seen as education. Studies on signaling theory trace back to the research of Spence (1974), along with other contributions that have examined the effects of asymmetric information (Stiglitz, 2002)
Signaling theory addresses the issue of information asymmetries between a firm’s management and its stakeholders, primarily arising from uncertainties regarding the firm’s intentions or the quality of its operations (Stiglitz, 2000; Reuer et al., 2012).
The quality of information disclosed by corporate firms in their annual reports has garnered significant attention from market participants (Abdalmuttaleb & Sameh, 2018). Studies suggest that the presence of signals or other corrective mechanisms can promote exchanges and reduce the discount from the offer price of a stock (Akerlof, 1970). Lastly, signaling theory is about decision-making and communication. It describes scenarios where signalers send observable signals that carry credible information about unobservable qualities. When decision-makers have incomplete or imperfect information, signals can help them make better decisions (Connelly et al., 2024).

2.4. Agency Theory

Agency theory outlines the relationship between principals and agents. Developed by Jensen and Meckling (1976), agency theory describes the relationship between principals and agents as a contractual arrangement that involves service delegation and the transfer of some decision-making authority and responsibility.
A firm’s principal objective is the maximization of its value; accordingly, owners hire managers to protect their interests and drive firm value growth for the benefit of shareholders. Nevertheless, in practice, managers often pursue objectives that diverge from those of the owners, leading to a conflict of interest known as the agency conflict. This agency problem is a result of the split between owners and managers, as differences in opinions, priorities, and interests between managers and shareholders may lead managers to prioritize their own objectives rather than those of the shareholders’ value (Fama & Jensen, 1983; Jensen & Meckling, 1976).
Typically, shareholders with small stakes occupy a disadvantaged position, as monitoring managers is costly, leading them to depend primarily on market regulations for protection against expropriation by managers (La Porta et al., 2000). However, the presence of large shareholders tends to reduce the power of the board (Ursel & Zhong, 2018).
Blockholders, shareholders holding large stakes, play a crucial role because their significant investments incentivize them to bear the costs of monitoring management (Bonaventura et al., 2017). According to Hirschman (1982), blockholders impact corporate governance through two key mechanisms: direct intervention and the option to exit. Edmans (2014) indicates that blockholders can shape firm decisions by actively engaging through their voice.” They may also strategically delay or limit information disclosure to leverage insider knowledge and advance their objectives. Within legal and regulatory boundaries, blockholders can affect the timing and manner of voluntary disclosures. In contrast, blockholders with smaller stakes find it difficult to exert control via voice (Edmans & Manso, 2011) and may make decisions based on incomplete information, further worsening information asymmetry among shareholders (Mortazian et al., 2019).
Regarding firms with family ownership, research by (Fama & Jensen, 1983; Yammeesri et al., 2006; Anderson & Reeb, 2004) suggests that monitoring costs decrease and agency problems are alleviated, leading to higher firm value. However, Maury and Pajuste (2005) highlights that when management is not monitored by other blockholders, families with managerial or board representation are more inclined to extract private benefits.
Ownership concentration influences firm value, particularly in small and medium-sized enterprises, where many firms are family-owned or have a high level of ownership concentration. For example, research by Fama and Jensen (1983) suggests that concentrated ownership reduces monitoring costs and mitigates agency problems, leading to increased firm value. However, Maury and Pajuste (2005) highlight that when management is not adequately monitored by other blockholders, family-controlled firms with board representation may be more inclined to extract private benefits.

2.5. Corporate Governance in SMEs

SMEs exhibit a unique governance structure that addresses key agency problems commonly discussed in corporate governance literature for large firms. According to agency theory (Jensen & Meckling, 1976), management may not always act in shareholders’ best interests, especially when boards lack independence or when the CEO also serves as chairman—concentrating too much power. Prior research (Jensen & Meckling, 1976; Fama, 1980) emphasizes that independent directors are more effective monitors than insiders.
In SMEs, however, governance is characterized by a closer alignment between management and owners, with built-in mechanisms of empowerment and accountability. Small and medium-sized enterprises rarely face the classic agency problem, as their directors typically possess deep industry knowledge, are actively involved in operations, and have financial interests aligned with the company’s long-term success (Rodríguez-Valencia & Lamothe Fernández, 2023).
This study tests the following hypotheses:
H2: 
Corporate governance influences firm value.
Ownership structure is captured by the percentage of shares held by the largest and second-largest shareholders. Agency theory is commonly linked with the division of ownership and managerial control (Jensen, 1994; Li et al., 2020; Schulze et al., 2001; Liao et al., 2014). However, in small and medium-sized enterprises (SMEs), the governance structure differs, and agency conflicts are not as pronounced as in larger corporations. The second-largest shareholder reflects the distribution of power within the company, often as a result of expropriation by the largest shareholder (Mukherjee, 2022; Koh, 2022). Authors as (Maury & Pajuste, 2005; Mortazian et al., 2019; Rodríguez-Valencia & Lamothe Fernández, 2023) determine that the second-largest block size has a positive impact on the firm value.
Therefore, based on the above discussion, we formulate the following hypotheses:
H2a: 
A concentrated ownership structure is linked to increased firm value among SMEs listed on secondary markets.
Firm structure is defined by elements such as board size, cross-listing status, and the choice of auditing firm. Board size represents the total number of individuals serving as directors on the board. According to Mak and Kusnadi (2005) and Nguyen et al. (2016), an inverse relationship exists between board size and firm value in countries such as Malaysia and Singapore. However, other studies have identified a positive relationship between board size and firm value. Large board size allows greater diversity of expertise and broader networking. These factors can enhance firm value, especially in complex or dynamic business environments. Cross-listing involves the practice of listing a company’s shares on a foreign stock exchange that may be more prestigious than its domestic market. Research by Cetorelli and Peristiani (2015) supports the view that cross-listing on a more prestigious exchange can enhance firm visibility, strengthen corporate governance, and reduce both information asymmetry and the cost of capital. Additionally, audit quality is captured through a dummy variable indicating whether a company engages a Big Four auditing firm. According to Wijaya (2020), audit quality positively influences firm value among manufacturing firms listed on the Indonesian Stock Exchange. The Indonesian capital market tends to respond favorably to firms that undergo higher-quality audits. As noted by Wang and Huang (2014), better audit quality contributes to reducing agency costs and information asymmetry, thereby improving firm value.
Therefore, the following hypotheses are proposed in this study:
H2b: 
The firm structure has a positive impact on the value of small and medium-sized enterprises listed on the stock exchange.
Managerial concentration is represented by the presence of independent directors and the duality of the chairperson and CEO roles. Independent directors are expressed as the percentage of independent members relative to the total board size. Small and medium-sized enterprises (SMEs) seldom encounter the classic agency problem, as their directors typically possess in-depth industry knowledge, maintain high levels of engagement, and have financial incentives closely aligned with the company’s long-term performance. Existing literature indicates that lower board independence may, in fact, be more conducive to enhancing shareholder value in SMEs (Farag & Mallin, 2019; Ahn & Shrestha, 2013; Garg, 2013).
Furthermore, CEOs of SMEs are generally more aligned with their firms’ future outcomes than their counterparts in larger corporations (Garg, 2013; Wasserman, 2017). As a result, CEO duality is often viewed as effective in dynamic environments, and SMEs are less prone to the traditional agency conflicts such as CEO–shareholder misalignment, commonly observed in larger firms (Rodríguez-Valencia & Lamothe Fernández, 2023).
Therefore, we propose the following hypotheses:
H2c: 
In small and medium-sized enterprises listed on secondary markets, a lower concentration of managerial ownership is linked to higher firm value.

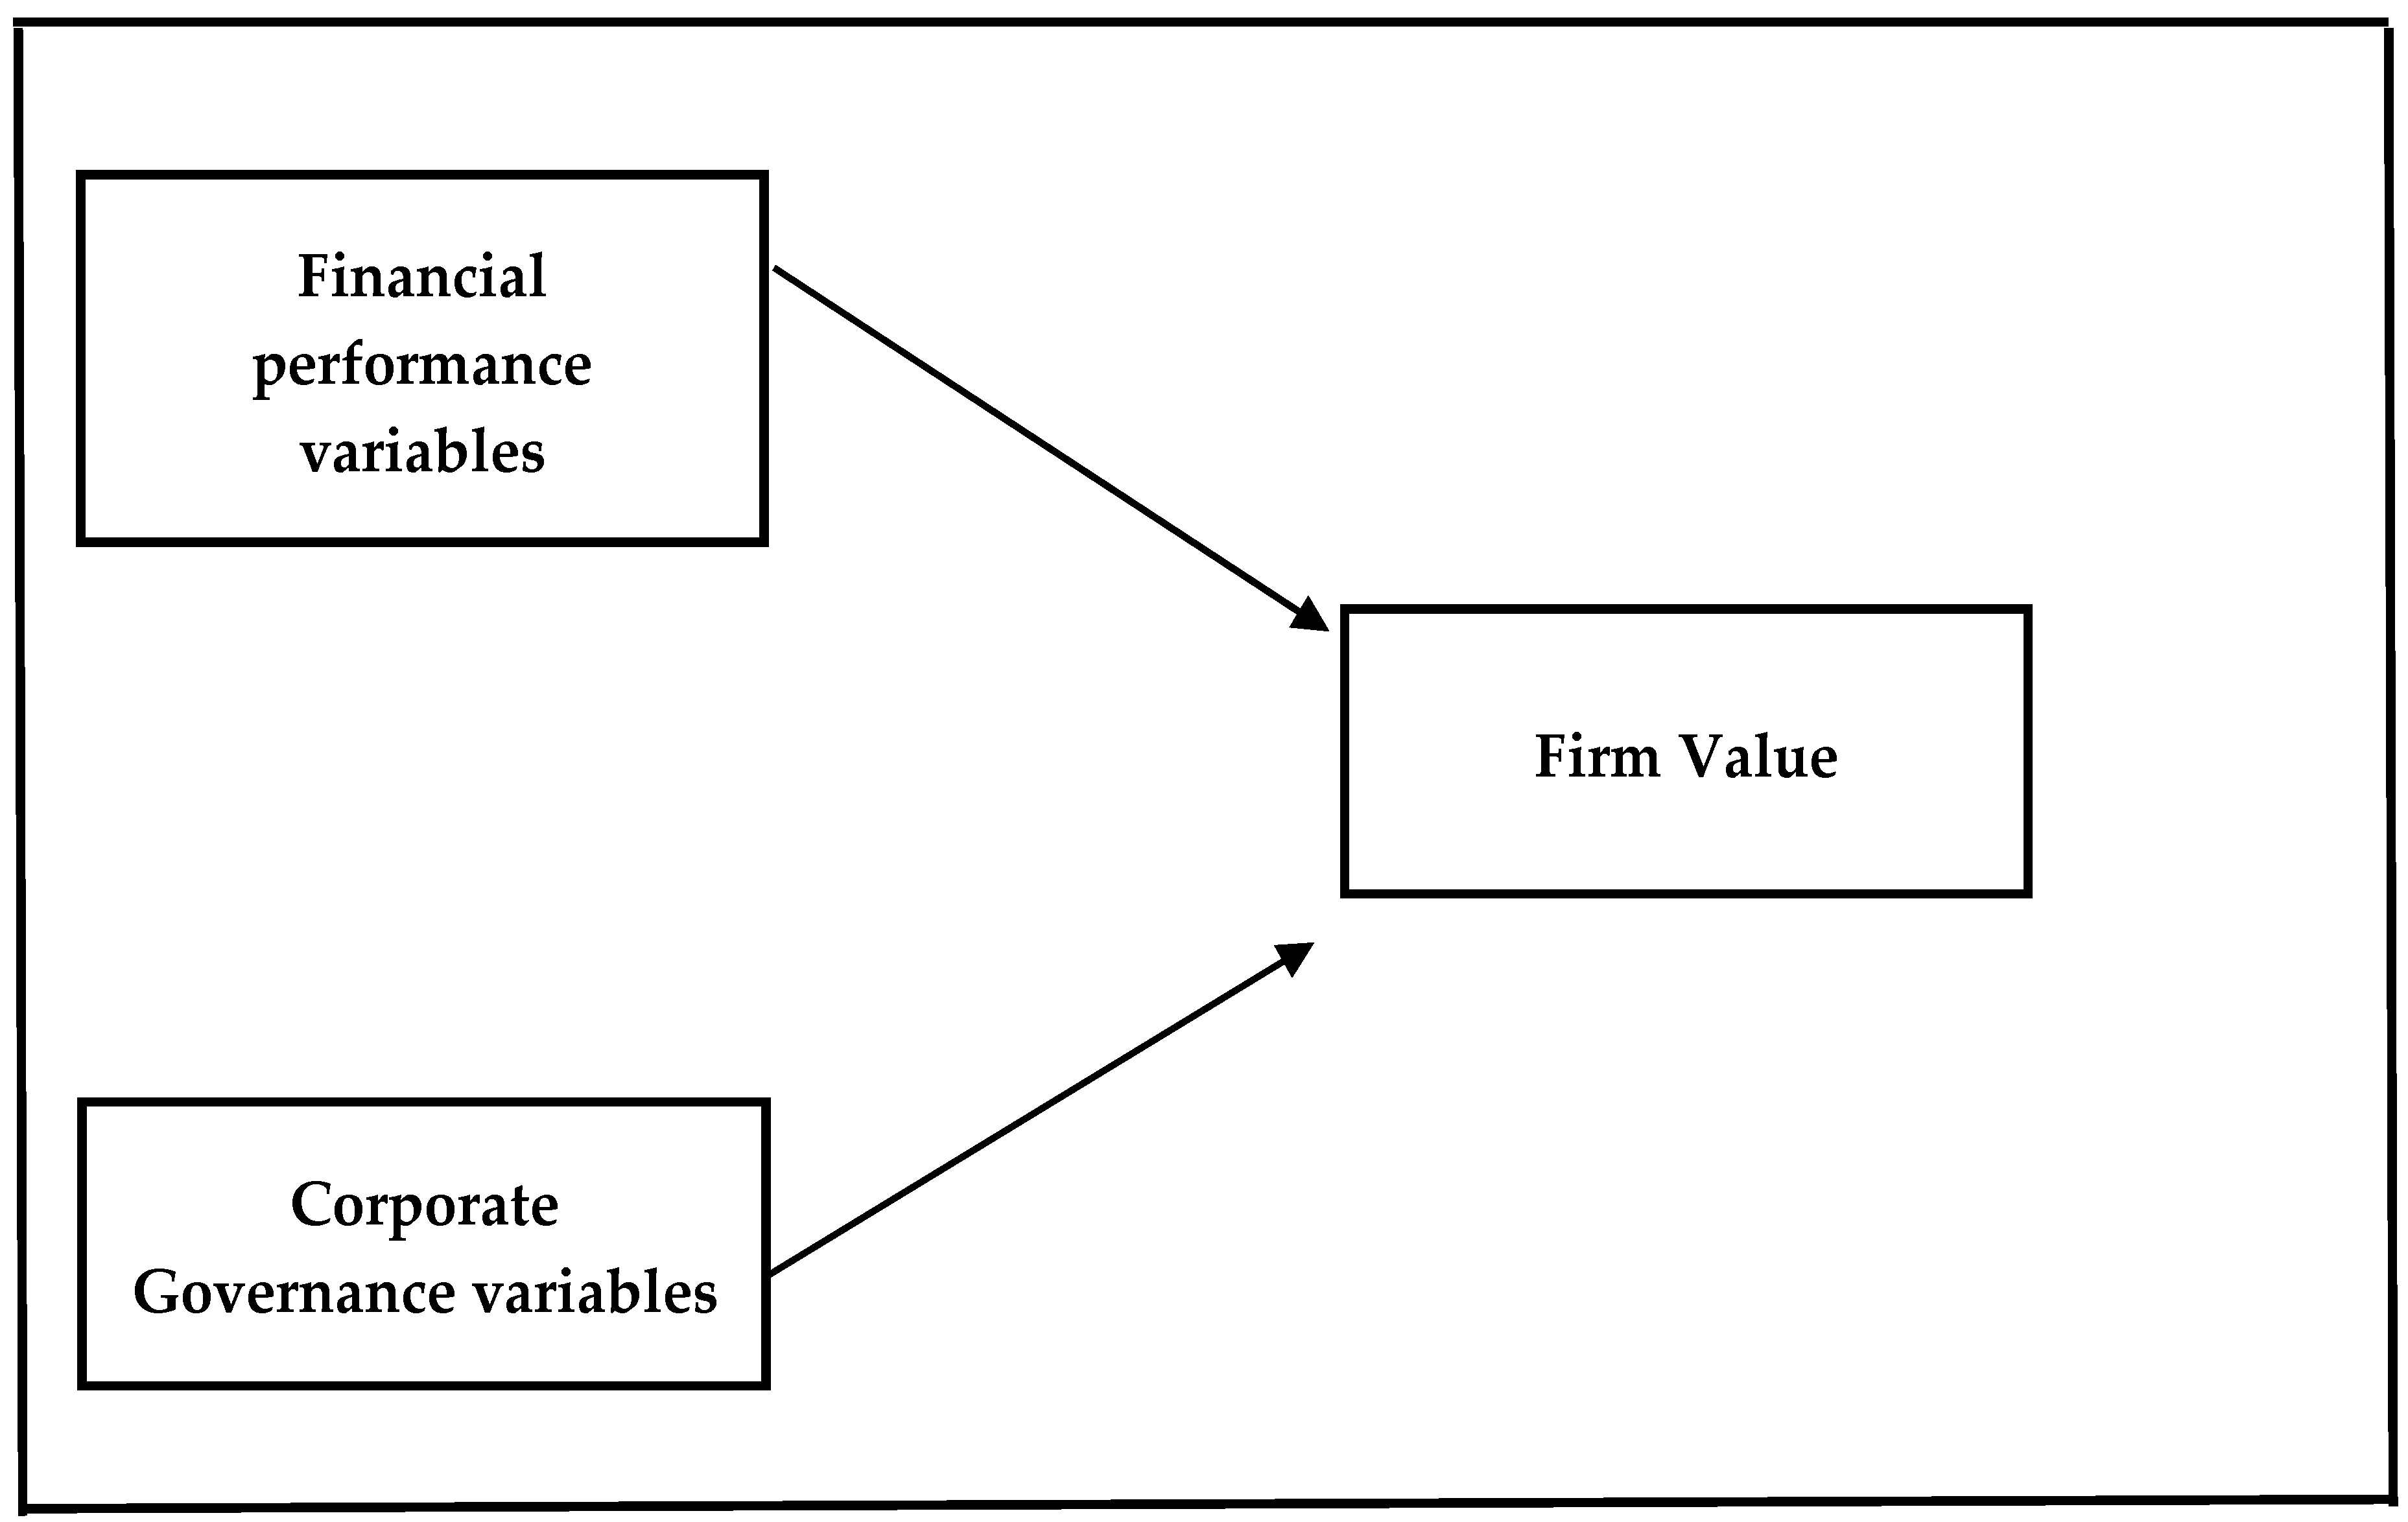
2.6. Study Framework

The conceptual model for this study is shown in Figure 1.

3. Methodology

3.1. Data

Our sample consists of 91 publicly listed Spanish SMEs on BME Growth (formerly Mercado Alternativo Bursátil). The alternative stock market (https://www.bmegrowth.es/ accessed on 3 March 2025) is a segment of the stock exchange designed to help smaller firms raise capital, access public markets, and list their shares under a regulatory framework that is more flexible than that applied to larger corporations (Rodríguez-Valencia & Lamothe Fernández, 2022).
The data, covering the period from 2015 to 2019, resulted in a total of 5760 observations. The primary sources of firm-level data were obtained from a comprehensive database with integrated company information provided by Bureau Van Dijk. Additionally, data was collected from the BME Growth and Banco de España websites. The most relevant variables in the dataset were manually gathered, filtered, and analyzed to ensure their suitability for firm-level analysis. All variables are described in detail in this section.
Also, in this study, we consider the two types of firms listed on BME Growth stock exchange: (a) expanding firms and (b) SOCIMI (real estate market investment firms).
According to the European Union, an enterprise is considered an SME if it meets the following criteria: (a) having fewer than 250 employees and (b) reporting an annual turnover of no more than 50 million euros or a balance sheet total of no more than 43 million euros.
This study benefits from using panel data, which allows for controlling unobservable heterogeneity through individual effects. Within the panel data, we identified variables categorized into three main groups: firm-specific variables, financial performance and corporate governance variables.

3.2. Variable Description and Measurement

3.2.1. Dependent Variable: Firm Valuation

Based on Craig et al. (2004), Tobin’s Q is used in this study to measure firm value and examine variable effects. Equation (1) below exhibits how Tobin’s Q is calculated:
Tobin s   Qit   = T A i t B V i t + M V i t T A i t
where i represents Spanish-listed small–medium firm i at the end of December for each year t, from 2015 to 2019. TA, BV, and MV respectively denote total assets, book value of equity, and market value of equity. All variables used in calculating Tobin’s Q are expressed in the same currency.
Tobin’s Q is commonly used to estimate firm performance, as it reflects the estimated value of intangible assets, including monopoly power, goodwill, managerial capability, and growth prospects, under the assumption that this value reflects the firm’s overall performance outcomes (Perfect & Wiles, 1994).
For the purposes of this study, we have used the simple method of Tobin’s Q, Qs, which is a simple proxy of Q that largely uses market value and company-reported information. The difficulty in finding the necessary information to calculate other versions of Tobin’s Q, as well as other firm valuation methods, makes this approach useful. Alternative formulas for calculating Tobin’s Q, such as the Lindenberg and Ross method or Hall’s method, present challenges due to the lack of firm-reported estimates of the replacement cost of assets or market value of a firm’s debt, which are generally unavailable. We also found that this ratio, Qs, can offer reliable preliminary estimates when alternative estimators are unavailable.

3.2.2. Control Variables

This study includes listing age and firm size as control variables to account for alternative explanations of the results. While these variables do have an impact on the dependent variable, they are not central to the central research question.
Listing age denotes the number of years a firm has been publicly traded on the stock exchange. Older firms are generally considered more efficient than younger counterparts, owing to the combined effects of accumulated experience (learning curve) and survival bias (Ang, 2000).
Firm size significantly impacts firm value, as larger companies often inspire greater investor confidence. It is commonly used as an estimator for assessing potential bureaucratic inefficiencies. In this study, firm size is calculated by the natural logarithm of the book value of total assets. The empirical evidence on the relationship between firm size and firm performance remains inconclusive. Lang and Stulz (1994) and Hirdinis (2019) have reported a considerable negative association, suggesting that increased size may lead to inefficiencies. In contrast, Arifianto and Chabachib (2016) found a positive relationship, indicating that larger firms may benefit from economies of scale and enhanced market presence. Meanwhile, studies by Suffah and Riduwan (2016) and Hamidah and Umdiana (2017) detected no significant link between firm size and firm value.

3.2.3. Financial Performance

Financial ratios are a commonly used method for analyzing financial statements. These ratios provide a practical way to assess a firm’s financial position and operations, enabling comparisons across different periods or companies (Simamora, 2000).
In this study, we will analyze the influence of certain financial variables on firm value, which are as follows: profitability, analyzed by ROA and ROE; liquidity ratio; firm productivity, analyzed by the TATO ratio; and capital structure, analyzed by the DER (Debt-to-Equity Ratio), leverage and solvency indicators.
This comprehensive framework integrates control variables and financial performance metrics to provide a nuanced understanding of their combined impact on firm value.

3.2.4. Corporate Governance Variables

The corporate governance factors examined in this study include board structure, ownership and governance levels, and cross-listing. Building on (Bai, 2004), these variables encompass cross-listing, listing history, auditing firms, controlling shareholder, second-largest shareholder, chairperson–CEO duality, board size and independent directors.
Cross-listing, auditing, and chairperson–CEO duality are represented as dummy variables, where a value of 1 indicates that the firm is cross-listed on international markets, employs one of the Big Four accounting firms, or has the same individual serving as both chairperson of the board and CEO, and 0 indicates otherwise.
In this study, we will analyze the influence of corporate governance variables on firm value, which are as follows: ownership concentration, analyzed by two indicators as controlling shareholder and second-largest shareholder; firm structure, analyzed by board size, cross-listing and auditing firm; and managerial concentration, analyzed by independent directors and chairperson and CEO duality.
The variables are summarized and described in detail in Table 1.
The following model Equation (2) is developed for testing the hypotheses:
Tobin s   Qit   =   α + K = 1 3 β   C o n t r o l   V a r i a b l e s   k + l = 1 6 β   F i n a n c i a l   p e r f o r m a n c e   V a r i a b l e s   l   + m = 1 8 β     C o r p o r a t e   g o v e r n a n c e   v a r i a b l e s   m + ε i t    
Tobin’s Qit is stated as in Equation (2); α denotes the constant term; control variables represent the firm-specific variables such as firm size, listing ages, leverage; financial variables represent ROE, ROA, CR, DER, TATO, and solvency ratio; corporate governance variables represent cross-listing, board size, chairman and CEO duality, auditing companies, controlling shareholder, second-largest shareholder, and the proportion of independent directors to the board. The coefficient β quantifies the sensitivity of each of these variables to Tobin’s Q.

3.3. Hypothesis Testing

To test the hypotheses, this study employs an unbalanced panel data approach, as the dataset spans multiple firms over time. Panel data analysis increases the effective sample size and is well-suited for capturing dynamic changes within and across firms. Three primary regression models are commonly used in panel data analysis: Pooled Ordinary Least Squares (POLS), Fixed Effects Model (FEM), and Random Effects Model (REM).
In this study, the Hausman test was applied to determine the most appropriate model. Under the null hypothesis, the FEM serves as an efficient estimator.
The FEM is utilized for panel data analysis where the intercept varies across cross-sectional units while the slope remains constant. Typically, the FEM assumes cross-sectional effects without considering temporal effects. However, in some cases, both the slope and intercept may vary over time (D. N. Gujarati, 2004).

4. Results and Discussion

4.1. Descriptive Statistics and Correlations

Table 2 presents descriptive statistics for firm-specific control variables, financial performance metrics, and corporate governance indicators. The summary includes key data attributes such as the total number of observations, averages, standard deviations, and range (minimum and maximum) for non-financial firms listed on BME Growth between 2015 and 2019.
The mean value of firm size is 17.0322, and the mean values of financial performance ratios such as leverage, CR, TATO, DER, and solvency are 0.47, 5.3975, 0.2046, 0.5496 and 0.5852, respectively. Profitability variables, ROA and ROE, show negative mean values of −3.6264 and −2.7404, respectively.
Firm size also demonstrates substantial variability, ranging from 8.0290 to 21.2646. Due to the skewed distribution of total assets, the natural logarithm was applied in the regression analysis to mitigate skewness and approximate a normal distribution.
Moreover, the correlation coefficients between variables are presented in Table 3. According to (D. Gujarati & Porter, 2010), a correlation coefficient above 0.7 between explanatory variables indicates potential collinearity issues.
The cross-listing variable shows zero correlation with all other variables; therefore, it will be excluded from the model. Additionally, the ROE variable exhibits a high correlation—greater than the 0.7 threshold (Churchill & Iacobucci, 2006)—with the ROA variable. Similarly, the solvency variable shows strong correlations with leverage and DER. This is expected, as most leverage ratios are inherently linked to the solvency ratio and DER, which measures the ratio of total debt to total shareholders’ equity.
To mitigate multicollinearity issues, variables with high correlations were excluded into the same model during the data analysis.
As shown in Table 3, the remaining correlation coefficients among the explanatory variables are generally low, suggesting an absence of significant multicollinearity. As such, the observed high correlations do not pose a concern for the data analysis, as the affected variables were excluded from the regression models.

4.2. Cross-Sectional Time Series Fixed Effects Regression Results

The outcomes of the Fixed Effects Model (FEM) regression are presented in Table 4. Model 1 (FEM 1) includes only firm-specific variables, serving as control variables. Model 2 (FEM 2) assesses the impact of profitability on firm value, directly testing the relevance of the profitability effect (Hypothesis 1a). Model 3 (FEM 3) expands on this by analyzing the individual effects of all financial performance, such as profitability, liquidity, productivity and capital structure variables on firm value (Hypothesis 1a-1b-1c-1d). Model 4 (FEM 4) explores the effects of corporate governance variables on firm value (Hypothesis 1a-1b-1c-1d and Hypothesis 2a-2b-2c), and Model 5 (FEM 5) incorporates all variables except ROA, solvency, and cross-listing due to high correlations, providing evidence to support or reject Hypothesis 1 and Hypothesis 2 and its sub-hypotheses (Hypothesis 1a-1b-1c-1d and Hypothesis 2a-2b-2c).
Table 4 and Table 5 also report the results of the Wald Chi-square test (for heteroskedasticity), the Hausman test (to determine fixed or random effects), and the Wooldridge test (for autocorrelation). The Wald Chi-square test is used to assess the presence of heteroskedasticity in the model. If the null hypothesis is rejected, it indicates that heteroskedasticity is present. On the other hand, the Wooldridge test is used to detect autocorrelation; rejection of the null hypothesis indicates the presence of autocorrelation in the model. In all cases, the p-values for these tests are below 0.05, leading to the rejection of the null hypotheses. In this study, the Hausman test was applied to determine the most appropriate model. Under the null hypothesis, the FEM serves as an efficient estimator. The significant p-values indicate the presence of autocorrelation and heteroskedasticity in the data. To address these issues, we applied the Prais–Winsten regression using the Stata 18 module xtpcse [het c(ar1)].
Some coefficients of all independent variables are positive, others are negative and the R-squared values show that Tobin’s Q (firm value) is explained by 61.88%, 69.65%, 71.83%, 71.35%, and 67.66% in Models 1, 2, 3, 4, and 5, respectively.
Model 1 presents the regression results, where α represents the intercept; if leverage, firm size, and listing age are all equal to 0, the firm value is 12.88517. The coefficient β1 shows that an increase in firm size reduces firm value by 0.0722, and β2 reveals that an increase in listing history lowers firm value by 0.6975. Among these firm-specific variables, only firm size significantly influences firm value at the 1% significance level. However, although the coefficient for listing age is negative and its significance values exceed 0.05, it does not appear to affect firm value.
Model 2 reveals a statistically significant negative association between firm size and firm value (p < 0.001). Regarding profitability variables, ROA has a negative effect on firm value, while ROE has a positive effect, both at a 5% significance level. Listing age does not impact firm value, as its significance values are greater than 0.05.
Model 3 reports the impact of financial performance on firm value. Leverage, firm size, TATO (Total Asset Turnover), and solvency ratio exhibit a significant negative relationship with firm value. The regression results show that ROE positively affects firm value at the 10% significance level, leverage negatively affects firm value at the 5% level, and firm size, TATO, and solvency ratio negatively affect firm value at the 1% level. Listing history, CR, and DER ratios do not influence firm value, as their significance values exceed 0.05.
Model 4 examines the impact of corporate governance variables on firm valuation. The results include the effects of eight variables: cross-listing, auditing, CEO–chairman duality, controlling shareholder, independent director representation, second-largest shareholder and board size. Among these, only the controlling shareholder variable is statistically significant (p < 0.05). Therefore, out of the eight corporate governance variables, only one shows a significant effect, while the others do not.
Ultimately, the findings indicate that concentrated equity ownership, reflected in the presence of a controlling shareholder, positively and significantly influences firm valuation.
After conducting the respective regressions, we proceeded to use the final model (FEM5) to explain the hypotheses proposed in this study. Due to high correlations, the variables’ ROA, solvency ratio, and cross-listing were omitted from the analysis.
The Effect of Profitability on Firm Value:
The Z-test results for the profitability variable (ROE) reveal a regression coefficient of 0.08956 and a significance value of 0.1. Since the significance value is smaller than the acceptable threshold of 0.1 and the coefficient is positive, it can be concluded that profitability influences firm value, leading to the rejection of the null hypothesis (H1a). Specifically, the regression analysis indicates that ROE positively impacts firm value at a 10% significance level. Overall, this suggests that profitability is a significant determinant of firm value. Previous studies by (Purba & Africa, 2019; Arifianto & Chabachib, 2016) also found a positive relationship between profitability and firm value.
The Effect of Liquidity Ratio on Firm Value:
The Z-test result for liquidity ratio—CR (Current Ratio) and firm value—shows the following regression coefficient: −0.0770. The analysis shows that liquidity ratio has a negative effect on firm value. This ratio did not show statistical significance and did not affect firm value.
The Effect of Efficiency Ratio on Firm Value:
The Z-test result for the efficiency ratio—TATO (Total Asset Turnover) and firm size—shows the following regression coefficient: −0.4834. The analysis shows that the Total Asset Turnover (TATO) and firm size negatively affect firm value at a 1% significance level. This is in contrast with the principles of this activity ratio. A negative TATO value may be related to the industry in which the firm operates. In companies with low profit margins, the market tends to interpret this negatively, leading to a reduction in firm value. A high TATO may also reflect a very limited asset base, indicating low investment in fixed assets or outdated technology. This can be perceived as a lack of growth potential, limited operational capacity, or infrastructure deterioration, which raises concerns among investors. Therefore, statistically, Hypothesis 1c is rejected.
The Effect of Capital Structure on Firm Value:
The Z-test results for the capital structure variables (Debt-to-Equity Ratio, DER and leverage) and firm size indicate a regression coefficient of −0.0091. According to trade-off theory, capital structure choices are influenced by agency costs, taxation, and the potential costs of financial distress. As debt increases, it impacts the company’s value. This study’s results align with prior findings by Purba and Africa (2019), Tarigan et al. (2018), and Hirdinis (2019), who identifies a negative relationship between capital structure and firm value. Although the analysis suggests a negative relationship between DER and firm value, the effect is not statistically significant (p > 0.05) and does not affect firm value. A statistically significant negative effect of leverage on firm value is observed, with a coefficient of −0.1516.
The Effect of Corporate Governance on Firm Value:
Only the controlling shareholder variable was statistically significant (p < 0.01). Therefore, this corporate governance variable aligns with the detailed hypothesis. Since the coefficient is positive and the significance value is less than 0.05, it indicates that ownership concentration has a significant positive effect on firm value. This finding supports Hypothesis 2a, suggesting that controlling shareholders’ presence influences firm value. This is aligned with prior researches of (Ang, 2000; Edmans et al., 2013; Bonaventura et al., 2017; Thomsen et al., 2006; Basu & Rahnamaei, 2016; Khan et al., 2005), who explore that controlling shareholders may establish monitoring mechanisms to mitigate agency conflicts and protect minority shareholders from wealth expropriation.
Conversely, the remaining corporate governance variables did not show statistical significance (p > 0.05) and did not affect firm value. The empirical results suggest that factors such as firm structure and managerial concentration do not significantly influence firm value.

5. Conclusions

This study examined the impact of key financial performance and corporate governance variables on firm value in the context of small and medium-sized enterprises (SMEs). The findings reveal that profitability, measured by Return on Equity (ROE), exerts a positive and statistically significant effect on firm value at the 10% level. This aligns with previous studies (Purba & Africa, 2019; Arifianto & Chabachib, 2016) and reinforces the importance of firm profitability as a key driver of investor perception and firm valuation. Additionally, the results support signaling theory, as they show that the market responds favorably to firm profitability, with investors using this information to guide their investment decisions (Ho & Wong, 2001; Spence, 1974).
In contrast, liquidity, as measured by the Current Ratio (CR), showed a negative but statistically insignificant relationship with firm value.
The efficiency ratio, represented by Total Asset Turnover (TATO), had a strong negative and statistically significant effect on firm value at the 1% level. This counterintuitive result may be industry-specific. In sectors with low profit margins or minimal investment in fixed assets, a high TATO may indicate underinvestment or limited capacity, leading to investor concern and reduced valuation. It also suggests that high turnover does not necessarily equate to value creation, particularly if it compromises long-term growth potential.
Regarding capital structure, the Debt-to-Equity Ratio (DER) displayed a negative but statistically insignificant relationship with firm value. While the sign of the coefficient aligns with the trade-off theory and previous research (e.g., Purba & Africa, 2019; Hirdinis, 2019), the lack of significance implies that the firms in the sample may not be sensitive to debt levels. However, leverage indicates the opposite. It is statistically significant, leading us to suggest that there is some evidence that a leverage may decrease firm value.
In the domain of corporate governance, the only variable with a significant impact was the presence of controlling shareholders, which had a positive and statistically significant effect on firm value. It can be concluded that the presence of a controlling shareholder enhances firm value. This supports the notion that ownership concentration can reduce agency conflicts and improve oversight (Edmans et al., 2013; Thomsen et al., 2006). Furthermore, our findings contribute to agency theory by highlighting the positive impact of concentrated ownership on firm value, which in turn reduces agency costs. Shareholders are incentivized to bear the costs of monitoring managers and can influence firm decisions, ultimately improving firm performance (Bonaventura et al., 2017; Thomsen et al., 2006; Basu & Rahnamaei, 2016; Edmans, 2014; Khan et al., 2005).
Other governance variables—such as firm structure and managerial concentration—did not show a significant effect, suggesting their limited relevance in the Spanish SME context or possible measurement limitations.
This study contributes to the understanding of how financial performance and governance structures affect firm value, particularly within SMEs. The results indicate that profitability, capital structure and ownership concentration are key determinants of firm value, reinforcing the importance of operational performance and effective shareholder oversight. Conversely, liquidity, efficiency and other governance mechanisms such as firm structure and managerial concentration do not show significant effects, highlighting the need to consider firm-specific and industry-specific contexts when evaluating value drivers.
The findings of this study can be extended to companies with similar characteristics. Firms in Germany, France, Portugal, and Italy share common characteristics such as ownership concentration, insider-oriented governance, and a prevalence of family firms, but notable distinctions remain. France stands apart with a corporate governance model closer to the Anglo-Saxon system, emphasizing transparency and regulatory rigor, particularly among large publicly listed companies. Meanwhile, Italy, Spain, and Portugal exhibit stronger family ownership traditions and more concentrated board control. These similarities and differences highlight the importance of contextual factors in shaping corporate governance practices across European countries.
This study has some limitations. First, endogeneity presents a notable methodological concern. The application of year-firm fixed effects is intended to mitigate potential endogeneity issues. Second, the data were collected within a single geographic context (Spain), which may restrict the external validity and limit the generalizability of the findings to other regions or institutional environments. Third, the sample size is relatively limited, approaching the minimum threshold required for statistical representativeness of the broader population. Fourth, while the study seeks to minimize omitted variable bias through the inclusion of widely used control variables, it is recognized that additional, unobserved factors may influence firm performance but are not captured in the analysis. The use of year-firm fixed effects further contributes to addressing this potential source of bias.
A possible avenue for future research is to examine the relationship between corporate governance variables and firm valuation in non-listed small and medium-sized enterprises (SMEs). Additionally, extending the analysis to other developed economies with comparable ownership structures and board compositions, such as Germany, France, and Italy, would be valuable, and eventually conducting cross-country comparisons at a global level may yield further insights, despite notable differences in corporate governance systems across jurisdictions. Other comparative studies could investigate the specific effects of the Anglo-Saxon-like governance system in France versus the insider-oriented, family-controlled governance prevalent in Italy, Spain, and Portugal. Additionally, research might examine how regulatory environments and cultural factors influence governance practices and their effectiveness in these countries.

Funding

This research received no external funding.

Institutional Review Board Statement

Not applicable.

Data Availability Statement

The original contributions presented in this study are included in the article. Further inquiries can be directed to the corresponding author.

Conflicts of Interest

The author declares no conflicts of interest.

Note

1
BME: Bolsas y Mercados Españoles.

References

  1. Abdalmuttaleb, M. A.-S., & Sameh, R. (2018). Signaling theory and the determinants of online financial disclosure. Journal of Economic and Administrative Sciences, 34(3), 237–247. [Google Scholar]
  2. Aguilera, R. V., & Jackson, G. (2010). Comparative and international corporate governance. The Academy of Management Annals, 4(1), 485–556. [Google Scholar] [CrossRef]
  3. Agyei, J., Sun, S., & Abrokwah, E. (2020). Trade-off theory versus pecking order theory: Ghanaian evidence. Sage Open, 10(3). [Google Scholar] [CrossRef]
  4. Ahn, S., & Shrestha, K. (2013). The differential effects of classified boards on firm value. Journal of Banking and Finance, 37, 3993–4013. [Google Scholar] [CrossRef]
  5. Akerlof, G. (1970). The market for “lemons”: Qualitative uncertainty and the market mechanism. Quarterly Journals of Economics, 84, 488–500. [Google Scholar] [CrossRef]
  6. Akhtar, S., & Oliver, B. (2009). Determinants of capital structure for Japanese multinational and domestic corporations. International Review of Finance, 9(1–2), 1–26. [Google Scholar] [CrossRef]
  7. Anderson, R. C., & Reeb, D. M. (2004). Board composition: Balancing family influence in S&P 500 firms. Administrative Science Quarterly, 49(2), 209–237. [Google Scholar]
  8. Ang, J. C. (2000). Agency costs and ownership structure. The Journal of Finance, 55(1), 81–106. [Google Scholar] [CrossRef]
  9. Arifianto, M., & Chabachib, M. (2016). Analysis of factors affecting firm value (a case study of companies listed on the LQ-45 Index for the 2011–2014 period). Diponegoro Journal of Management, 5, 1–12. [Google Scholar]
  10. Bai, C.-E. L. (2004). Corporate governance and market valuation in China. Journal of Comparative Economics, 32(4), 599–616. [Google Scholar] [CrossRef]
  11. Basu, N. P., & Rahnamaei, M. (2016). Multiple blockholders, power, and firm value. Journal of Banking & Finance, 66, 66–78. [Google Scholar]
  12. Black, F., & Scholes, M. (1974). From theory to a new financial product. The Journal of Finance, 29(2), 399–412. [Google Scholar] [CrossRef]
  13. BME Growth. (2025). Obtenido de. Available online: https://www.bmegrowth.es/ (accessed on 3 March 2025).
  14. Bonaventura, M., Giudici, G., & Vismara, S. (2017). Valuation and performance of reallocated IPO shares. Journal of International Financial Markets, 54, 15–26. [Google Scholar] [CrossRef]
  15. Brigham, E., & Houston, J. (2021). Fundamentals of financial management (16th ed.). Cengage Learning. [Google Scholar]
  16. Buigut, K., Soi, N., Koskei, I., & Kibet, J. (2013). The Effect of Capital Structure on Share Price on Listed Firms in Kenya. European Journal of Business and Management, 5(9), 29–34. [Google Scholar]
  17. Cetorelli, N., & Peristiani, S. (2015). Firm value and cross listings: The impact of stock market prestige. Journal of Risk and Financial Management, 8(1), 150–180. [Google Scholar] [CrossRef]
  18. Charumanithi, B., & Krishnan, M. (2016). On the determinants of the firm value of Indian companies. Global Business Review, 13(2), 251–267. [Google Scholar]
  19. Chen, L. J. (2011). The influence of profitability on firm value with capital structure as the mediator and firm size and industry as moderators. Investment Management and Financial Innovations, 8(3), 120–129. [Google Scholar]
  20. Churchill, G., & Iacobucci, D. (2006). Marketing research: Methodological foundations (5th ed.). The Dryden Press. [Google Scholar]
  21. Colli, A., García-Canal, E., & Guillén, M. F. (2013). Family character and international entrepreneurship: A historical comparison of Italian and Spanish ‘new multinationals’. Business History, 55(1), 119–138. [Google Scholar] [CrossRef]
  22. Connelly, B. L., Certo, S. T., Reutzel, C. R., DesJardine, M. R., & Zhou, Y. S. (2024). Signaling theory: State of the theory and its future. Journal of Management, 51(1), 24–61. [Google Scholar] [CrossRef]
  23. Craig, D., Karoly, A., & Stulz, R. (2004). Why are foreign firms listed in the U.S. worth more? Journal of Financial Economics, 71(2), 205–238. [Google Scholar]
  24. Damodaran, A. (2012). Investment Valuation. John Wiley and Sons, Inc. [Google Scholar]
  25. Daniel, H. (2015). The effect of internal factors on stock price of the company LQ 45. EMBA Journals, 3(1), 45–59. [Google Scholar]
  26. DeAngelo, H., & Masulis, R. (1980). Capital structure under corporate and personal taxation. Journal of Financial Economics, 8, 3–29. [Google Scholar] [CrossRef]
  27. Deitiana, T. (2013). Influence of Current Ratio, Return on Equity and Total Asset Turn Over against Dividend Payout Ratio and Implication on Stock Price Company LQ 45. Journal of Business and Accounting, 15(1), 82–88. [Google Scholar]
  28. Dewi, P. A., & Suaryana, I. (2013). Effect of EPS, DER, and PBV on Share Price. Journal of Accounting Udayana University, 7(2), 100–110. [Google Scholar]
  29. Dewi, S., & Hidayat, R. (2014). Effect of net profit margin and return on assets on stock prices on automotive companies listed in indonesia stock exchange. ILMAN, 1, 1–10. [Google Scholar]
  30. Dinh, H., & Pham, C. (2010). The effect of capital structure on the financial performance of Vietnamese listing pharmaceutical enterprises. Journal of Asian Finance, Economics and Business, 7(9), 329–340. [Google Scholar] [CrossRef]
  31. Donaldson, G. (1961). Corporate debt capacity: A study of corporate debt policy and the determination of corporate debt capacity. Division of Research, Graduate School of Business Administration, 113, 387–432. [Google Scholar]
  32. Edmans, A. (2014). Blockholders and corporate governance. Annual Review of Finance and Economics, 6(1), 23–50. [Google Scholar] [CrossRef]
  33. Edmans, A., Fang, V., & Zur, E. (2013). The effect of liquidity on governance. Review of Financial Studies, 26(6), 1443. [Google Scholar] [CrossRef]
  34. Edmans, A., & Manso, G. (2011). Governance through trading and intervention: A theory of multiple blockholders. Review of Financial Studies, 24(7), 2395–2428. [Google Scholar] [CrossRef]
  35. Ehrhardt, M., & Brigham, E. (2011). Financial management: Theory and practice. Cengage Learning. [Google Scholar]
  36. Fama, E. (1980). Agency problems and the theory of the firm. Journal of Politics Economics, 88, 288–307. [Google Scholar] [CrossRef]
  37. Fama, E., & Jensen, M. (1983). Separation of ownership and control. The Journal of Law & Economics, 26(2), 301–325. [Google Scholar]
  38. Farag, H., & Mallin, C. (2019). Monitoring corporate boards: Evidence from China. European Journal of Finance, 25, 524–549. [Google Scholar] [CrossRef]
  39. Florackis, C., Kostakis, A., & Ozkan, A. (2009). Managerial ownership and performance. Journal of Business Research, 62(12), 1350–1357. [Google Scholar] [CrossRef]
  40. Fosu, S., Danso, A., Ahmad, W., & Coffie, W. (2016). Information asymmetry, leverage and firm value: Do crisis and growth matter? International Review of Financial Analysis, 46, 140–150. [Google Scholar] [CrossRef]
  41. Friend, I., & Lang, L. (1988). An empirical test of the impact of managerial self-interest on corporate capital structure. Journal of Finance, 43(2), 271–281. [Google Scholar]
  42. Garg, S. (2013). Venture boards: Distinctive monitoring and implications for firm performance. Academy of Management Review, 38(1), 90–108. [Google Scholar] [CrossRef]
  43. Gompers, P., Ishii, J., & Metrick, A. (2003). Corporate governance and equity prices. The Quarterly Journal of Economics, 118(1), 107–156. [Google Scholar] [CrossRef]
  44. Gujarati, D., & Porter, D. (2010). Econometría (5th ed.). McGraw Hill. [Google Scholar]
  45. Gujarati, D. N. (2004). Applied econometrics. McGraw-Hill. [Google Scholar]
  46. Hamidah, G., & Umdiana, N. (2017). The effect of profitability and investment opportunity set (IOS) on firm value with stock price as an intervening variable. Accounting Journal, 2, 90–106. [Google Scholar]
  47. Harris, M., & Raviv, A. (1991). The theory of capital structure. The Journal of Finance, 46(1), 297–355. [Google Scholar] [CrossRef]
  48. Herrera, D. C., Montalvo, C. M., & Valencia, L. R. (2017). Prueba de la teoría del intercambio y la teoría del orden jerárquico de la estructura de capital, evidencia ecuatoriana. Revista Ciencias Pedagógicas e Innovación, 5(3), 109–117. [Google Scholar]
  49. Hirdinis, M. (2019). Capital structure and firm size on firm value moderated by profibility. International Journal of Economics and Business Administration, 7(1), 174–191. [Google Scholar]
  50. Hirschman, A. (1982). Rival interpretation of market society: Covilizing, destructure, or feeble? Journal of Economics Literature, 20(1), 1463–1484. [Google Scholar]
  51. Ho, S., & Wong, K. (2001). A study of the relationship between corporate governance structures and the extent of voluntary disclosure. Journal of International Accounting, Auditing & Taxation, 10(2), 139–157. [Google Scholar]
  52. Idawati, W., & Wahyudi, A. (2015). Effect of earning per shares (EPS) and return on assets (ROA) against share price on coal mining company listed in indonesia stock exchange. Journal of Resources Development and Management, 7, 79–91. [Google Scholar]
  53. Jensen, M. (1994). Self-interest, altruism, incentives, and agency theory. Journal of Applied Corporate Finance, 7(2), 40–45. [Google Scholar] [CrossRef]
  54. Jensen, M., & Meckling, W. (1976). Theory of the firm: Managerial behavior, agency costs and ownership structure. Journal of Financial Economics, 3(4), 305–360. [Google Scholar] [CrossRef]
  55. Jeroh, E. (2020). Corporate financial tarributes and the value of listed financial services firms: The Nigerian evidence. Academy of Accounting and Financial Studies Journal, 24(2), 45–60. [Google Scholar]
  56. Khan, R., Dharwadkar, R., & Brandes, P. (2005). Institutional ownership and CEO compensation: A longitudinal examination. Journal of Business Research, 58(8), 1078–1088. [Google Scholar] [CrossRef]
  57. Kim, E. (1978). A Mean-variance theory of capital structure and corporate debt capacity. The Journal of Finance, 33, 45–63. [Google Scholar]
  58. Klapper, L. F., & Love, I. (2004). Corporate governance, investor protection, and performance in emerging markets. Journal of Corporate Finance, 10(3), 703–728. [Google Scholar] [CrossRef]
  59. Koh, A. (2022). Shareholder withdrawal in close corporations: An Anglo-German comparative analysis. Journal of Corporate Law Studies, 22(1), 97–134. [Google Scholar] [CrossRef]
  60. Kohansal, M., Dadrasmoghaddam, A., Karmozdi, K., & Mohseni, A. (2013). Relationship between financial ratios and stock prices for the food industry firms in stock exchange of Iran. World Applied Programming, 10, 512–521. [Google Scholar]
  61. Kraus, A., & Litzenberger, R. (1973). A state-preference model of financial leverage. The Journal of Finance, 28, 911–922. [Google Scholar]
  62. Kurnia, P., Darlis, E., & Putra, A. (2020). Carbon emission disclosure, good corporate governance, financial performance, and firm value. Journal of Asian Finance, Economics and Business, 7(12), 223–231. [Google Scholar] [CrossRef]
  63. Laim, W., Nangoy, S., & Murni, S. (2015). Analysis of factors that influencing dividend payout ratio on companies that listed in LQ-45 index stock exchange Indonesia. Jurnal EMBA, 3(1), 1129–1140. [Google Scholar]
  64. Lang, L., & Stulz, R. (1994). Tobin’s q, corporate diversification, and firm performance. Journal of Political Economy, 102(6), 1248–1280. [Google Scholar]
  65. La Porta, R., Lopez-de-Silanes, F., Shleifer, A., & Vishny, R. (2000). Investor protection and corporate governance. Journal of Financial Economics, 58(1–2), 3–27. [Google Scholar] [CrossRef]
  66. Lestari, E. (2023). Debt to equity ratio (DER) and firm size toward firm value: The mediating role of return on asset. Return: Study of Management, Economic and Bussines, 2(11), 1095–1109. [Google Scholar] [CrossRef]
  67. Li, H., Terjesen, S., & Uman, T. (2020). Corporate governance in entrepreneurial firms: A systematic review and research agenda. Small Busess Economics, 54, 43–74. [Google Scholar] [CrossRef]
  68. Liao, W., Lu, C., & Wang, H. (2014). Venture capital, corporate governance, and financial stability of IPO firms. Emerging Markets Review, 18, 19–33. [Google Scholar] [CrossRef]
  69. Lindayani, N. W., & Dewi, S. K. S. (2016). Dampak struktur modal dan inflasiterhadap profitabilitas dan return saham perusahaan keuangan sektor perbankan. E-Jurnal Manajemen Uuud, 5(8), 123–135. [Google Scholar]
  70. Mak, Y. T., & Kusnadi, Y. (2005). Size really matters: Further evidence on the negative relationship between board size and firm value. Pacific-Basin Finance Journal, 13(3), 301–318. [Google Scholar] [CrossRef]
  71. Manoppo, H., & Arie, F. (2016). The influence of capital structure, company size and profitability towards automotive company value of IDX Period 2011–2014. Journal EMBA, 4(2), 485–497. [Google Scholar]
  72. Mateev, M., Poutziourisb, P., & Ivanovc, K. (2013). On the determinants of SME capital structure in Central and Eastern Europe: A dynamic panel analysis. Research in International Business and Finance, 27, 28–51. [Google Scholar] [CrossRef]
  73. Maury, B., & Pajuste, A. (2005). Multiple large shareholders and firm value. Journal of Banking & Finance, 29(7), 1813–1834. [Google Scholar]
  74. Merton, R. C. (1974). On the pricing of corporate debt: The risk structure of interest rates. The Journal of Finance, 29(2), 449–470. [Google Scholar]
  75. Meythi, E., & Rusli, L. (2011). The influence of liquidity and profitability on stock price of manufacturing companies listed on Indonesia stock exchange. Journal of Business Management and Economics, 10(2), 2671–2684. [Google Scholar]
  76. Modigliani, F., & Miller, M. (1963). Corporate income taxes and the cost of capital: A correction. The American Economic Review, 53(3), 433–443. [Google Scholar]
  77. Modigliani, F., & Miller, M. H. (1958). The cost of capital, corporation finance and the theory of investment. The American Economic Review, 261–296. [Google Scholar]
  78. Mortazian, M., Tabaghdehi, S., & Mase, B. (2019). Large shareholding and firm value in the Alternative Investment Market (AIM). Asia-Pacific Financial Markets, 26(2), 229–252. [Google Scholar] [CrossRef]
  79. Mukherjee, P. (2022). Revisitng the Indian Financial Sector. In Recent issues ans perspectives. Springer. [Google Scholar]
  80. Myers, S., & Majluf, N. (1984). Corporate financing and investment decisions when firm s have information that investors do not have. Journal of Financial Economics, 13(2), 187–221. [Google Scholar] [CrossRef]
  81. Myers, S. C. (1977). Determinants of corporate borrowing. Journal of Financial Economics, 5, 147–175. [Google Scholar] [CrossRef]
  82. Newman, A., Gunessee, S., & Hilton, B. (2012). The applicability of financial theories of capital structure to the Chinese cultural context: A study of privately-owned SMEs. International Small Business Journal, 30, 65–83. [Google Scholar] [CrossRef]
  83. Nguyen, P., Rahman, N., Tong, A., & Yusof, M. (2016). Board size and firm value: Evidence from Australia. Journal of Management & Governance, 20(4), 851–873. [Google Scholar] [CrossRef]
  84. Pandansari, F. (2012). Analysis of fundamental factors against stock price. Accounting Analysis Journal, 1(2), 25–34. [Google Scholar]
  85. Perfect, S., & Wiles, K. (1994). Alternative constructions of Tobin’s Q: An empirical comparison. Journal of Empirical Finance, 1, 313–341. [Google Scholar] [CrossRef]
  86. Permana, D. (2017). Toward the best model of strategy implementation in Indonesian islamic banking from the lens of strategic clarity. European Research Studies Journal, 4B, 3–15. [Google Scholar] [CrossRef]
  87. Polii, P., Saerang, I., & Mandagie, Y. (2014). The influence of financial ratios on stock price in national private foreign-exchange commercial bank listed on indonesia stock exchange. EMBA Journals, 2, 993–1004. [Google Scholar]
  88. Prasetiyo, Y. (2022). Analysis of company size, profitability, and solvency on firm value at BUMN IDX20. Formosa Journal of Science and Technology, 1(7), 853–864. [Google Scholar] [CrossRef]
  89. Purba, J., & Africa, L. (2019). The effect of capital structure, institutional ownership, managerial ownership, and profitability on company value in manufacturing companies. The Indonesian Accounting Review, 9(1), 27–38. [Google Scholar]
  90. Rahman, S. (2014). The role of intellectual capital in determining differences between stock market and financial performance. International Research Journal of Finance and Economics, 89, 46–77. [Google Scholar]
  91. Rajan, R. G., & Zingales, L. (1995). What do we know about capital structure? Some evidence from international data. The Journal of Finance, 50(5), 1421–1460. [Google Scholar] [CrossRef]
  92. Rehman, O. (2016). Impact of capital structure and dividend policy on firm value. Journal of Poverty, Investment and Development, 21, 45–60. [Google Scholar]
  93. Reuer, J., Tong, T., & Cheng-Wei, W. (2012). A signaling theory of acquisition premiums: Evidence from IPO targets. Academy of Management Journal, 55(3), 667–683. [Google Scholar] [CrossRef]
  94. Rodríguez-Valencia, L., & Lamothe Fernández, P. (2022). Insights into alternative stock markets: A systematic review of academic literature. Modern Economy, 13(06), 789–809. [Google Scholar] [CrossRef]
  95. Rodríguez-Valencia, L., & Lamothe Fernández, P. (2023). Managerial concentration, ownership concentration, and firm value: Evidence from Spanish SMEs. Small Business International Review, 7(1), e541. [Google Scholar] [CrossRef]
  96. Rodríguez-Valencia, L., Lamothe-Fernández, P., & Alaminos, D. (2023). The market value of SMEs: A comparative study between private and listed firms in alternative stock markets. Annals of Finance, 19(1), 95–117. [Google Scholar] [CrossRef]
  97. Rompas, G. P. (2013). Likuiditas solvabilitas dan rentabilitas terhadap nilai perusahaan bumn yang terdaftar dibursa efek Indonesia. Jurnal EMBA, 1(3), 252–262. [Google Scholar]
  98. Safitri, A. (2013). Influence of earning per share, price earnings ratio, return on asset, debt to equity ratio and market value added on stock price of the jakarta islamic index. Management Analysis Journal, 2(2), 1–8. [Google Scholar]
  99. Schulze, W., Lubatkin, M., Dino, R., & Buchholtz, A. (2001). Agency relationships in family firms: Theory and evidence. Organization Science, 12(2), 99–116. [Google Scholar] [CrossRef]
  100. Shah, A., & Khan, S. (2007). Determinants of capital structure: Evidence from Pakistani panel data. International Review of Business Research Papers, 3(4), 265–282. [Google Scholar]
  101. Simamora, H. (2000). Accounting base for business decision making. Salemba Empat. [Google Scholar]
  102. Simatupang, H. J., Purwanti, L., & Mardiati, E. (2019). Determinants of capital structures based on the pecking order theory and trade-off theory. Jurnal Keuangan dan Perbankan, 23(1), 84–96. [Google Scholar] [CrossRef]
  103. Sondakh, F., Tommy, P., & Mangantar, M. (2015). Current ratio, debt to equity ratio, return on asset, return on equity effect on stock prices of LQ 45 index in BEI period 2010–2014. EMBA Journals, 3, 749–756. [Google Scholar]
  104. Spence, A. (1973). Job market signaling. The Quarterly Journal of Economics, 87(3), 355–374. [Google Scholar] [CrossRef]
  105. Spence, A. (1974). Market signaling: Informational transfer in hiring and related screening processes. Harvard University Press. [Google Scholar]
  106. Stiglitz, J. (2000). The contributions of the economics of information to twentieth century economics. Quarterly Journal of Economics, 115(4), 1441–1478. [Google Scholar] [CrossRef]
  107. Stiglitz, J. (2002). Information and the change in paradigm in economics. American Economic Review, 92, 406–501. [Google Scholar] [CrossRef]
  108. Stoiljković, A., Tomić, S., Leković, B., & Matić, M. (2022). Determinants of capital structure: Empirical evidence of manufacturing companies in the Republic of Serbia. Sustainability, 15(1), 778. [Google Scholar] [CrossRef]
  109. Sucuahi, W., & Cambarihan, J. (2016). Influence of profitability to the firm value of diversified companies in the Philippines. Journal of Accounting and Finance Research, 2, 149–153. [Google Scholar] [CrossRef]
  110. Sudiyatno, B., Puspitasari, E., Suwarti, T., & Asyif, M. M. (2020). Determinants of firm value and profitability: Evidence from Indonesia. Journal of Asian Finance, Economics and Business, 7, 769–778. [Google Scholar] [CrossRef]
  111. Suffah, R., & Riduwan, A. (2016). Effect of profitability, leverage, company size and dividend policy on firm value. Ilmudan Journal of Accounting Research, 2, 1–17. [Google Scholar]
  112. Sunarto, P., & Agus, B. (2009). Effect of leverage, size and growth of companies on profitability. TEMA Journal, 6(1), 86–103. [Google Scholar]
  113. Tan, S., Syarif, A., & Ariza, D. (2014). Analysis of factors that affecting the stock price of industry transportation services which is listed on the Indonesian stock exchange years of 2009 to 2012. Journal of Management Dynamics, 2, 116–129. [Google Scholar]
  114. Tarigan, J., Hervindra, C., & Hatane, S. E. (2018). Does board diversity influence financial performance? International Research Journal of Business, 11(3), 193–215. [Google Scholar] [CrossRef]
  115. Thomsen, S., Pedersen, T., & Kvist, H. (2006). Blockholder ownership: Effects on firm value in market and control based governance systems. Journal of Corporate Finance, 12(2), 246–269. [Google Scholar] [CrossRef]
  116. Tiska, S. (2015). Effect of profitability and investment opportunity on firm value. Bakrie University Scientific Journal, 3(1), 1–7. [Google Scholar]
  117. Titman, S., & Wessels, R. (1988). The determinants of capital structure choice. The Journal of Finance, 43(1), 1–19. [Google Scholar] [CrossRef]
  118. Ursel, N., & Zhong, L. (2018). Why do firms pay high underwriting fees? SEO withdrawal, underwriter certification and CEO turnover. Journal of International Financial Markets, Institutions and Money, 54, 98–113. [Google Scholar] [CrossRef]
  119. Wang, Y. F., & Huang, Y. T. (2014). How do auditors increase substantially firm value. International Journal of Economics and Finance, 6(10), 76–82. [Google Scholar] [CrossRef]
  120. Wasserman, N. (2017). The throne vs. the kingdom: Founder control and value creation in startups. Strategic Management Journal, 38(2), 255–277. [Google Scholar] [CrossRef]
  121. Wijaya, A. L. (2020). The effect of audit quality on firm value: A case in Indonesian manufacturing firm. Journal of Accounting, Finance and Auditing Studies, 6(1), 1–15. [Google Scholar] [CrossRef]
  122. Yammeesri, J., Lodh, S. C., & Herath, S. K. (2006). Influence of ownership structure and corporate performance precrisis: Evidence from Thailand. International Journal of Electronic Finance, 1(2), 181–199. [Google Scholar] [CrossRef]
  123. Yermack, D. (1996). Higher market valuation of companies with a small board of directors. Journal of Financial Economics, 40(2), 185–211. [Google Scholar] [CrossRef]
  124. Yulsiati, H. (2016). Influence of earning per share, return on equity and debt to equity ratio against stock price on jakarta islamic index (JII) listed in Indonesia stock exchange (BEI) period 2010–2014. Journal of Administration, 2(1), 104–127. [Google Scholar]
Figure 1. Empirical research model.
Ijfs 13 00123 g001
Table 1. Definition of variables.
VariablesMeasurement
Dependent Variable
Tobin’s Q(Total assets − book value of equity + market value of equity)/total assets
Control Variables
Firm sizeNatural logarithm of total assets of the firm
Listing historyYears listed on the stock exchange
Independent Variables
Financial performance
ROENet income/Total equity
ROAProfit before interest and taxes/Book value of total assets
CRCurrent assets/Current liabilities
DERTotal liabilities/Shareholders’ equity
LeverageTotal liabilities relative to total assets
TATONet sales/Total assets
SolvencyTotal equity/Total debt
Corporate Governance
Cross-listingEquals 1 when the firm is cross-listed internationally; otherwise, it equals 0
Auditing firmEquals 1 if firms appointing one of the Big Four auditing firms. Equals 0 otherwise
Controlling shareholderPercentage of the largest shareholder (%)
Second-largest shareholderPercentage of the second-largest shareholder (%)
Board sizeNumber of directors on the board
Independent directorsPercentage of independent directors on the board (%)
Chairperson and CEO dualityA value of 1 indicates that the CEO also serves as the chairperson of the board; 0 indicates otherwise
Table 2. Descriptive statistics.
MeanStandard DeviationMinimumMaximumObservation
Control Variables
Firm size17.03222.14278.029021.2646361
Listing history0.78520.67030.00002.1972227
Independent Variables
ROE−2.74041.6890−7.42172.6327198
ROA−3.62641.4868−8.39581.6572192
CR5.397512.3890.0000126.959355
DER0.54966.74270.0000108.600327
Leverage0.470.40680.0015.99359
TATO0.20460.42000.00005.2600320
Solvency0.58521.9966−4.68778.3964351
Corporate Governance
Cross-listing0.00830.09090.00001.0000361
Auditing firm0.59000.49250.00001.0000361
Controlling shareholder0.51330.33950.00001.0000361
Second-largest shareholder0.11370.10850.00000.4638361
Board size6.27092.93911.000014.0000361
Independent directors0.76370.32150.00001.0000360
Chairperson and CEO duality0.31580.46550.00001.0000361
Table 3. Correlation matrix.
(1)(2)(3)(4)(5)(6)(7)(8)(9)(10)(11)(12)(13)(14)(15)(16)(17)
Tobin’s QLeverageROEROAFirm SizeCRDERTATOSolvencyListing HistoryControlling ShareholderSecond-Largest ShareholderBoard SizeIndependent DirectorsCross-ListingAuditing FirmChairperson–CEO Duality
(1)Tobin’s Q1
(2)Leverage−0.05821
(3)ROE0.00730.24041
(4)ROA0.02260.01520.93891
(5)Firm size−0.65130.0697−0.0682−0.17171
(6)CR−0.0390−0.1922−0.0490−0.00640.00461
(7)DER−0.03640.67500.22930.0004−0.0284−0.41141
(8)TATO−0.11960.45620.39820.2787−0.2225−0.12950.72971
(9)Solvency0.0575−0.9674−0.27720.0075−0.14580.1854−0.7273−0.46871
(10)Listing history−0.07820.28040.11840.0130.0157−0.37710.48560.4389−0.31271
(11)Controlling shareholder0.0084−0.12090.0567−0.00210.13130.12780.15140.14850.03340.02551
(12)Second-largest shareholder0.22340.35840.0269−0.1046−0.2192−0.04720.29140.1667−0.39160.0760−0.17001
(13)Board size0.10080.11160.0238−0.0114−0.07050.13440.06690.1233−0.11720.1269−0.08630.12451
(14)Independent directors−0.1489−0.11830.09250.08540.2043−0.0692−0.04110.00720.07820.05520.0976−0.22870.56921
(15)Cross-listing000000000000001
(16)Auditing firm0.0072−0.23890.07590.07340.15230.1917−0.2664−0.30110.17330.01860.0862−0.18640.02620.120101
(17)Chairperson–CEO duality0.14210.19950.05410.0559−0.15650.0157−0.01050.1021−0.1497−0.0493−0.10060.35350.0804−0.20690−0.06771
Table 4. Cross-sectional time series fixed effects.
Dependent Variable: Tobin’s QFEM 1FEM 2FEM 3FEM 4FEM 5
Constant12.885 ***13.727 ***13.050 ***12.029 ***12.572 ***
(11.44)(10.68)(11.26)(8.30)(7.28)
Control variable (firm-specific variable)
Firm size−0.072 ***−0.769 ***−0.768 ***−0.766 ***−0.734 ***
(−10.90)(−10.17)(−10.66)(−9.09)(−7.86)
Listing history−0.697−0.0650.0900.0600.069
(−0.79)(−0.58)(0.76)(0.55)(0.57)
Independent variables
Financial variables
ROE 0.497 **0.072 *00.089 *
(2.12)(1.53)0(1.59)
ROA −0.501 **00.766
(−2.17)0(1.46)
CR −0.018−0.095 *−0.077
(−0.35)(−1.60)(−1.25)
DER −0.098−0.0620698−0.009199
(−1.15)(−0.66)(−0.10)
Leverage −0.594 **−1.070 ***−0.151 *
(−2.43)(−4.41)(1.60)
TATO −0.296 ***−0.461 ***−0.483 ***
(−3.27)(−4.01)(−4.15)
Solvency −0.605 ***−1.059 ***
(−2.63)(−4.93)
Governance variables
Cross-listing 0
0
Auditing firm −0.1050.102
(0.74)(0.16)
Controlling shareholder 0.232 **0.274 **
(1.93)(2.14)
Second-largest shareholder −0.067−0.0009
(−0.61)(−0.01)
Board size 0.2870.187
(1.30)(0.78)
Independent directors −0.102−0.002
(−0.76)(−0.01)
Chairperson and CEO duality 0.1360.033
(0.74)(0.16)
No. of firms8654544444
No. of observations227127126108108
Hausman test41.8649.3433.9728.1750.35
R-sq 0.6180.6960.7180.7130.676
Wald (Chi-sq)123.62112.44137.0695.5972.78
Note: FEM = Fixed Effects Model; z-values are reported in parentheses; * Significance at 0.1 level; ** Significance at 0.05 level; *** Significance at 0.01 level.
Table 5. Regression analysis.
VariableModel FEM 5
Tobin’s QCoefPSE
Listing history0.06910.5660.120438
Firm size−0.73450.0000.0934592
ROE0.08950.1110.0562399
CR−0.07700.21110.0615767
DER−0.00910.9220.0935102
Leverage−0.15160.1090.0946662
TATO−0.48340.0000.1164236
Controlling shareholder0.27480.0330.1286467
Second-largest shareholder−0.000940.9940.1178343
Board size0.18720.4380.2412099
Independent directors−0.00220.9880.1484875
Auditing firm0.10200.6250.2087649
Chairperson and CEO duality0.03300.8760.2120663
Constant12.57290.0001.728036
Hausman test50.350.000Prob > Chi2
R-sq 0.6766
Wald (Chi-sq)72.780.000
No. of observations108
P = Standard Error
Fixed effects
Autocorrelation and heteroscedasticity problem corrected with regression of
Prais–Winsten
Variables in natural logarithm
Note: Based on the Models 1 and 4 presented in Table 4, Model 5 (Table 5) presents regression results excluding variables with correlations such as ROA, solvency ratio and cross-listing.
Disclaimer/Publisher’s Note: The statements, opinions and data contained in all publications are solely those of the individual author(s) and contributor(s) and not of MDPI and/or the editor(s). MDPI and/or the editor(s) disclaim responsibility for any injury to people or property resulting from any ideas, methods, instructions or products referred to in the content.

