

A Study on Factors Influencing Continuous Usage Intention of Chatbot Services in South Korean Financial Institutions


Abstract
1. Introduction
2. Theoretical Background
2.1. Chatbot Services: Concept and Necessity in Financial Institutions
2.2. Literature Review
2.2.1. Chatbot Services in Financial Institutions
2.2.2. Service Quality Measurement Model (SERVQUAL Model)
2.2.3. Information System Success Model (IS-SUCCESS Model)
2.2.4. Post-Acceptance Model (PAM)
3. Research Design
3.1. Research Model
3.2. Hypothesis Development
3.2.1. Relationship Between Financial Chatbot Service Characteristics and Expectation Confirmation
3.2.2. Relationship Between Information System Quality Characteristics and Expectation Confirmation
3.2.3. Relationship Between Expectation Confirmation and Perceived Usefulness
3.2.4. Relationship Between Expectation Confirmation and Satisfaction
3.2.5. Relationship Between Perceived Usefulness and Satisfaction
3.2.6. Relationship Between Perceived Usefulness and Continuous Usage Intention
3.2.7. Relationship Between Satisfaction and Continuous Usage Intention
4. Research Results
4.1. Data Collection
4.2. Demographic Analysis
4.3. Reliability and Validity Analysis
4.4. Path Analysis Results
5. Discussion
6. Conclusions
6.1. Significance and Implications of the Study
6.1.1. Theoretical Implications
6.1.2. Practical Implications
6.2. Limitations and Future Study
Author Contributions
Funding
Institutional Review Board Statement
Informed Consent Statement
Data Availability Statement
Conflicts of Interest
References
- Alksasbeh, M., Abuhelaleh, M., Almaiah, M. A., AL-Jaafreh, M., & Abu Karaka, A. (2019). Towards a model of quality features for mobile social networks apps in learning environments: An extended information system success model. International Journal of Interactive Mobile Technologies, 13, 75–93. [Google Scholar]
- Ashfaq, M., Yun, J., Yu, S., & Loureiro, S. M. C. (2020). I, chatbot: Modeling the determinants of users’ satisfaction and continuance intention of AI-powered service agents. Telematics and Informatics, 54, 101473. [Google Scholar]
- Bailey, J. E., & Pearson, S. W. (1983). Development of a tool for measuring and analyzing computer user satisfaction. Management Science, 29, 530–545. [Google Scholar]
- Bhattacherjee, A. (2001). Understanding information systems continuance: An expectation confirmation model. MIS Quarterly, 25, 351–370. [Google Scholar]
- Byun, S. H., & Cho, C. H. (2020). The effect of the anthropomorphism level and personalization level on AI financial chatbot recommendation messages on customer response. The Korean Journal of Advertising and Public Relations, 22, 466–502. [Google Scholar]
- Chang, J. H. (2016). The emergence and development trends of AI-based ‘Chatbot’ services. Issues & Trends in ICT Convergence. National Information Society Agency. Available online: https://www.nia.or.kr/common/board/Download.do?bcIdx=17512&cbIdx=39485&fileNo=1 (accessed on 31 December 2024).
- Davis, F. D. (1989). Perceived usefulness, perceived ease of use, and user acceptance of information technology. MIS Quarterly, 13, 319–340. [Google Scholar]
- DeLone, W. H., & McLean, E. R. (1992). Information systems success: The quest for the dependent variable. Information Systems Research, 3, 60–95. [Google Scholar]
- DeLone, W. H., & McLean, E. R. (2003). The DeLone and McLean model of information systems success: A ten-year update. Journal of Management Information Systems, 19, 9–30. [Google Scholar]
- Expert Market Research. (2024). Global chatbot market size, trends, analysis, forecast: 2024–2032. Available online: https://www.expertmarketresearch.com/reports/chatbot-market (accessed on 19 April 2024).
- Garrison, D. R., Anderson, T., & Archer, W. (2000). Critical inquiry in a text-based environment: Computer conferencing in higher education. The Internet and Higher Education, 2, 87–105. [Google Scholar]
- Gefen, D., & Straub, D. (2005). A practical guide to factorial validity using PLS-Graph: Tutorial and annotated example. Communications of the Association for Information Systems, 16, 91–109. [Google Scholar]
- Goodman, R. S., Patrinely, J. R., Stone, C. A., Zimmerman, E., Donald, R. R., Chang, S. S., Berkowitz, S. T., Finn, A. P., Jahangir, E., Scoville, E. A., & Reese, T. S. (2023). Accuracy and reliability of chatbot responses to physician questions. JAMA Network Open, 6(10), e2336483. [Google Scholar] [CrossRef] [PubMed]
- Grönroos, C. (1984). A service quality model and its marketing implications. European Journal of Marketing, 18, 36–44. [Google Scholar] [CrossRef]
- Hair, J. F., Hult, G. T. M., Ringle, C. M., & Sarstedt, M. (2014). A primer on partial least squares structural equation modeling (PLS-SEM). Sage Publications. [Google Scholar]
- Han, B., Ahn, Y., & Han, K. (2016). An empirical study on the effect of store IT management service quality on continuance intention. Journal of Digital Convergence, 14, 115–125. [Google Scholar] [CrossRef]
- Han, S. U., Han, K. S., Kwon, T. H., Koh, I. S., & An, Y. J. (2020). An empirical study on the effect of unmanned store kiosk management quality on sustainable use intention. Journal of Digital Contents Society, 21, 761–770. [Google Scholar] [CrossRef]
- Hill, J., Ford, W. R., & Farreras, I. G. (2015). Real conversations with artificial intelligence: A comparison between human-human online conversations and human-chatbot conversations. Computers in Human Behavior, 49, 245–250. [Google Scholar] [CrossRef]
- Hong, D. S. (2022). Prospects and current status of the financial AI market: Focusing on the banking sector. Korea Credit Information Services CIS Issue Report, 22, 1–10. [Google Scholar]
- Huang, Y. (2022). The impact of sports center service quality on customer satisfaction, trust, engagement, loyalty: Moderating effect of sports involvement [Unpublished doctoral dissertation, Pukyong National University]. [Google Scholar]
- Jeon, S. Y., & Yu, H. J. (2023). A study on the effect of chatbot service quality on intention to use and a comparative study between industries. Journal of Korea Service Management Society, 19, 39–50. [Google Scholar]
- Jeong, K. S., Park, D. M., Bae, H. K., & Kim, J. H. (2023). A study on factors affecting continuous usage intention with AI chatbot service quality and service value. Journal of the Korea IT Policy and Management Society, 15, 3351–3357. [Google Scholar]
- Jung, J. H. (2019). Major issues and challenges of artificial intelligence (AI) policy. Journal of Korean Association for Regional Information Society, 19, 39–50. [Google Scholar]
- Kim, D. H., & Lee, S. B. (2023). A study on factors affecting the intention to use AI-based financial services. Journal of Financial Services Research, 16, 43–67. [Google Scholar]
- Kim, J. T., & Choi, D. Y. (2022). A study on the effect of chatbot service support quality on user satisfaction, loyalty, and continuous usage intention: Focusing on the moderating effect of social presence. Journal of Service Research, 12, 106–124. [Google Scholar]
- Kim, S. J., & Choi, J. I. (2023). The impact of AI chatbot attributes on user satisfaction and continuous use intention. Journal of Digital Convergence, 21, 191–197. [Google Scholar]
- Kim, S. J., Jung, O. K., & Park, C. (2020). An exploratory study on the effect of chatbot’s characteristics on intention of acceptance: Focusing on the moderate effect of personal innovativeness. Journal of Industrial Innovation, 36(4), 107–133. [Google Scholar]
- Kim, T. H., Cha, H. S., Park, C. H., & Wi, J. H. (2020). An empirical study on factors affecting user intention to use chatbots in online shopping malls. Knowledge Management Research, 21(4), 211–225. [Google Scholar]
- Konya-Baumbach, E., Stieler, M., & Weigert, M. (2023). A consumer acceptance perspective of chatbot companions. Journal of Consumer Marketing, 40, 339–352. [Google Scholar]
- Kotler, P., & Armstrong, G. (2004). Principles of marketing (10th ed.). Pearson-Prentice Hall. [Google Scholar]
- Lee, H. Y. (2023, November 14). Bank tellers disappearing: Acceleration of digitalization in bank branches. Dailian. [Google Scholar]
- Lee, J. H., Ko, K. A., & Ha, D. K. (2018). A study on the viewing motivation and user response of personal live streaming broadcast: Focusing on Post-Acceptance Model(PAM). The Korean Journal of Advertising and Public Relations, 20, 178–215. [Google Scholar]
- Lee, S. E. (2022, December 26). Increased non-face-to-face transactions in the financial sector lead to proactive chatbot adoption: Utilized in counseling by distribution companies as well. Korea Economic Daily. [Google Scholar]
- Lee, S. J. (2023). A study on factors affecting intention to continuous use of CM channel service of general insurance companies [Ph.D. thesis, Graduate School of Soongsil University]. [Google Scholar]
- Lee, S. J., Lee, J. H., & Jung, D. H. (2021). A study on the factors affecting the acceptance intention of chatbot service in the financial industry. Journal of Korea Technology Innovation Society, 24(5), 845–869. [Google Scholar] [CrossRef]
- Lin, C. S., Wu, S., & Tsai, R. J. (2005). Integrating perceived playfulness into expectation-confirmation model for web portal context. Information & Management, 42, 683–693. [Google Scholar]
- Meyer-Waarden, L., Pavone, G., Poocharoentou, T., & Prayatsup, P. (2020). How service quality influences customer acceptance and usage of chatbots? Journal of Service Management Research, 4, 35–51. [Google Scholar] [CrossRef]
- Miller, G. A. (1956). The magical number seven, plus or minus two: Some limits on our capacity for processing information. Psychological Review, 63, 81–97. [Google Scholar]
- Moon, J. H. (2010). The effect of interactivity on satisfaction and word of mouth in internet shopping malls by types. Journal of the Korea Contents Association, 10, 239–246. [Google Scholar]
- Nguyen, D. M., Chiu, Y.-T. H., & Le, H. D. (2021). Determinants of continuance intention towards banks’ chatbot services in Vietnam: A necessity for sustainable development. Sustainability, 13, 7875. [Google Scholar] [CrossRef]
- Oghuma, A. P., Libaque-Saenz, C. F., Wong, S. F., & Chang, Y. (2016). An expectation-confirmation model of continuance intention to use mobile instant messaging. Telematics and Informatics, 33, 34–47. [Google Scholar]
- Oh, J. H., Oh, J. W., & Cho, K. M. (2019). Research on consistent use intention of home-training program on personal media service YouTube based on post-adoption model. Journal of the Korea Convergence Society, 10, 183–193. [Google Scholar]
- Oliver, R. L. (1980). A cognitive model of the antecedents and consequences of satisfaction decisions. Journal of Marketing Research, 17, 460–469. [Google Scholar]
- Oliver, R. L. (1993). Cognitive, affective, and attribute bases of the satisfaction response. Journal of Consumer Research, 20, 418–430. [Google Scholar]
- Parasuraman, A., Zeithaml, V. A., & Berry, L. L. (1988). SERVQUAL: A multiple-item scale for measuring consumer perceptions of service quality. Journal of Retailing, 64, 12–40. [Google Scholar]
- Park, J. H., Yoon, K. I., & Min, S. T. (2019). Trends in AI-based chatbot system technology. Korea Information Processing Society Review, 26, 39–46. [Google Scholar]
- Park, S. H. (2023). A study on the effect of chatbot service quality on customer loyalty and satisfaction in online shopping. The e-Business Studies, 24, 19–28. [Google Scholar]
- Pitt, L. F., Watson, R. T., & Kavan, C. B. (1995). Service quality: A measure of information systems effectiveness. MIS Quarterly, 19, 173–187. [Google Scholar]
- Seddon, P. B. (1997). A respecification and extension of the DeLone and McLean model of IS success. Information Systems Research, 8, 240–253. [Google Scholar] [CrossRef]
- Seo, G. R. (2018). Analysis of domestic and international trends and development prospects of AI-based chatbot services. National Information Society Agency, 18, 1–34. [Google Scholar]
- Yeo, I. K. (2002). A test of the multivariate normality based on likelihood functions. The Korean Journal of Applied Statistics, 15, 223–232. [Google Scholar] [CrossRef]
- Yoo, S. M. (2021). Easy Learning of SPSS Practical Statistical Analysis for Thesis Writing (Rev. ed.). Hwangso-Gulum Academy. [Google Scholar]
- Yoon, J. H., & Kim, K. S. (2006). A study on the effect of logistics service quality factors on customer satisfaction and post-purchase behavior in internet shopping malls. Journal of Information Systems, 15, 21–48. [Google Scholar]
- Yu, H. R., & Min, Y. (2023). A study on the intention to use the generative AI chatbot ChatGPT: Focusing on the technology acceptance model and affordance. Journal of Broadcasting and Telecommunication Research, 116, 141–169. [Google Scholar] [CrossRef]


| Category | Frequency (n) | Percentage (%) | Group | |
|---|---|---|---|---|
| Gender | Male | 136 | 54.4 | |
| Female | 114 | 45.6 | ||
| Total | 250 | 100 | ||
| Age | 20–29 years | 62 | 24.8 | |
| 30–39 years | 63 | 25.2 | ||
| 40–49 years | 61 | 24.4 | ||
| 50–59 years | 47 | 18.8 | ||
| 60 years or older | 17 | 6.8 | ||
| Total | 250 | 100 | ||
| Generation | Generation Z (after 1995) | 65 | 26 | MZ Generation |
| Millennials (1980–1994) | 96 | 38.4 | ||
| Generation X (1965–1979) | 74 | 29.6 | Older Generation | |
| Baby Boomers (1950–1964) | 15 | 6 | ||
| Total | 250 | 100 | ||
| Financial Institution Usage | Bank | 228 | 45 | |
| Securities | 74 | 14.6 | ||
| Insurance | 58 | 11.4 | ||
| Credit Card | 123 | 24.3 | ||
| Savings Bank | 20 | 3.9 | ||
| Other | 4 | 0.8 | ||
| Total | 507 | 100 | ||
| Usage Frequency | 1 time | 4 | 1.6 | 1–3 times |
| 2–3 times | 57 | 22.8 | ||
| 4–5 times | 58 | 23.2 | 4 or more times | |
| 6–7 times | 38 | 15.2 | ||
| 8 or more times | 93 | 37.2 | ||
| Total | 250 | 100 | ||
| Device Used | Mobile | 179 | 71.6 | Mobile |
| PC | 17 | 6.8 | PC | |
| Both | 54 | 21.6 | ||
| Total | 250 | 100 | ||
| Latent Variable | Observed Variable | Mean | Standard Deviation | Skewness | Kurtosis |
|---|---|---|---|---|---|
| Social Presence | SP1 | 4.328 | 1.200 | −0.427 | 0.678 |
| SP2 | 4.104 | 1.377 | −0.003 | −0.370 | |
| SP3 | 3.804 | 1.478 | 0.034 | −0.523 | |
| SP4 | 4.040 | 1.446 | −0.284 | −0.442 | |
| Response Accuracy | RA1 | 4.468 | 1.251 | −0.492 | 0.078 |
| RA2 | 4.456 | 1.297 | −0.403 | −0.150 | |
| RA3 | 4.396 | 1.355 | −0.413 | −0.022 | |
| Assurance | AS1 | 4.408 | 1.373 | −0.415 | −0.266 |
| AS2 | 4.784 | 1.349 | −0.640 | 0.328 | |
| AS3 | 4.284 | 1.428 | −0.267 | −0.382 | |
| AS4 | 4.424 | 1.339 | −0.283 | −0.157 | |
| AS5 | 4.336 | 1.269 | −0.154 | −0.155 | |
| Responsiveness | RE1 | 4.868 | 1.182 | −0.601 | 0.502 |
| RE2 | 5.288 | 1.223 | −0.666 | 0.441 | |
| RE3 | 4.524 | 1.292 | −0.559 | 0.195 | |
| RE4 | 4.380 | 1.338 | −0.464 | −0.101 | |
| RE5 | 4.432 | 1.351 | −0.328 | −0.265 | |
| Reliability | RL1 | 4.760 | 1.246 | −0.458 | 0.392 |
| RL2 | 4.816 | 1.197 | −0.469 | 0.251 | |
| RL3 | 4.776 | 1.210 | −0.608 | 0.561 | |
| RL4 | 4.884 | 1.149 | −0.548 | 0.808 | |
| Usability | US1 | 5.096 | 1.211 | −0.874 | 1.343 |
| US2 | 5.012 | 1.326 | −0.660 | 0.134 | |
| US3 | 5.364 | 1.146 | −0.470 | −0.040 | |
| US4 | 5.100 | 1.232 | −0.794 | 0.988 | |
| Security | SE1 | 4.732 | 1.102 | −0.067 | 0.050 |
| SE2 | 4.720 | 1.115 | −0.195 | 0.439 | |
| SE3 | 4.804 | 1.187 | −0.336 | 0.391 | |
| SE4 | 4.708 | 1.204 | −0.252 | 0.372 | |
| Interactivity | IN1 | 4.444 | 1.312 | −0.452 | 0.115 |
| IN2 | 4.452 | 1.390 | −0.384 | −0.117 | |
| IN3 | 4.304 | 1.442 | −0.339 | −0.406 | |
| IN4 | 4.480 | 1.323 | −0.408 | 0.288 | |
| Expectation Confirmation | EC1 | 4.224 | 1.409 | −0.331 | −0.040 |
| EC2 | 4.204 | 1.494 | −0.336 | −0.390 | |
| EC3 | 4.104 | 1.503 | −0.226 | −0.497 | |
| EC4 | 4.444 | 1.363 | −0.304 | 0.012 | |
| Perceived Usefulness | PU1 | 4.660 | 1.364 | −0.659 | 0.366 |
| PU2 | 4.592 | 1.396 | −0.440 | −0.156 | |
| PU3 | 4.576 | 1.403 | −0.525 | 0.205 | |
| PU4 | 4.488 | 1.396 | −0.337 | −0.214 | |
| Satisfaction | SA1 | 4.600 | 1.410 | −0.615 | 0.182 |
| SA2 | 4.448 | 1.452 | −0.619 | −0.114 | |
| SA3 | 4.416 | 1.531 | −0.430 | −0.329 | |
| Continuous Usage Intention | CI1 | 4.560 | 1.386 | −0.507 | 0.043 |
| CI2 | 4.400 | 1.519 | −0.412 | −0.317 | |
| CI3 | 4.132 | 1.612 | −0.420 | −0.528 | |
| CI4 | 4.424 | 1.539 | −0.473 | −0.322 |
| Latent Variable | MVs | C.alpha | DG.rho | Eig.value |
|---|---|---|---|---|
| Social Presence | 4 | 0.881 | 0.918 | 2.951 |
| Response Accuracy | 3 | 0.922 | 0.950 | 2.594 |
| Assurance | 5 | 0.909 | 0.932 | 3.674 |
| Responsiveness | 5 | 0.902 | 0.928 | 3.614 |
| Reliability | 4 | 0.895 | 0.927 | 3.044 |
| Usability | 4 | 0.874 | 0.914 | 2.907 |
| Security | 4 | 0.923 | 0.945 | 3.248 |
| Interactivity | 4 | 0.912 | 0.938 | 3.167 |
| Expectation Confirmation | 4 | 0.940 | 0.957 | 3.390 |
| Perceived Usefulness | 4 | 0.941 | 0.958 | 3.399 |
| Satisfaction | 3 | 0.933 | 0.957 | 2.644 |
| Continuous Usage Intention | 4 | 0.951 | 0.965 | 3.489 |
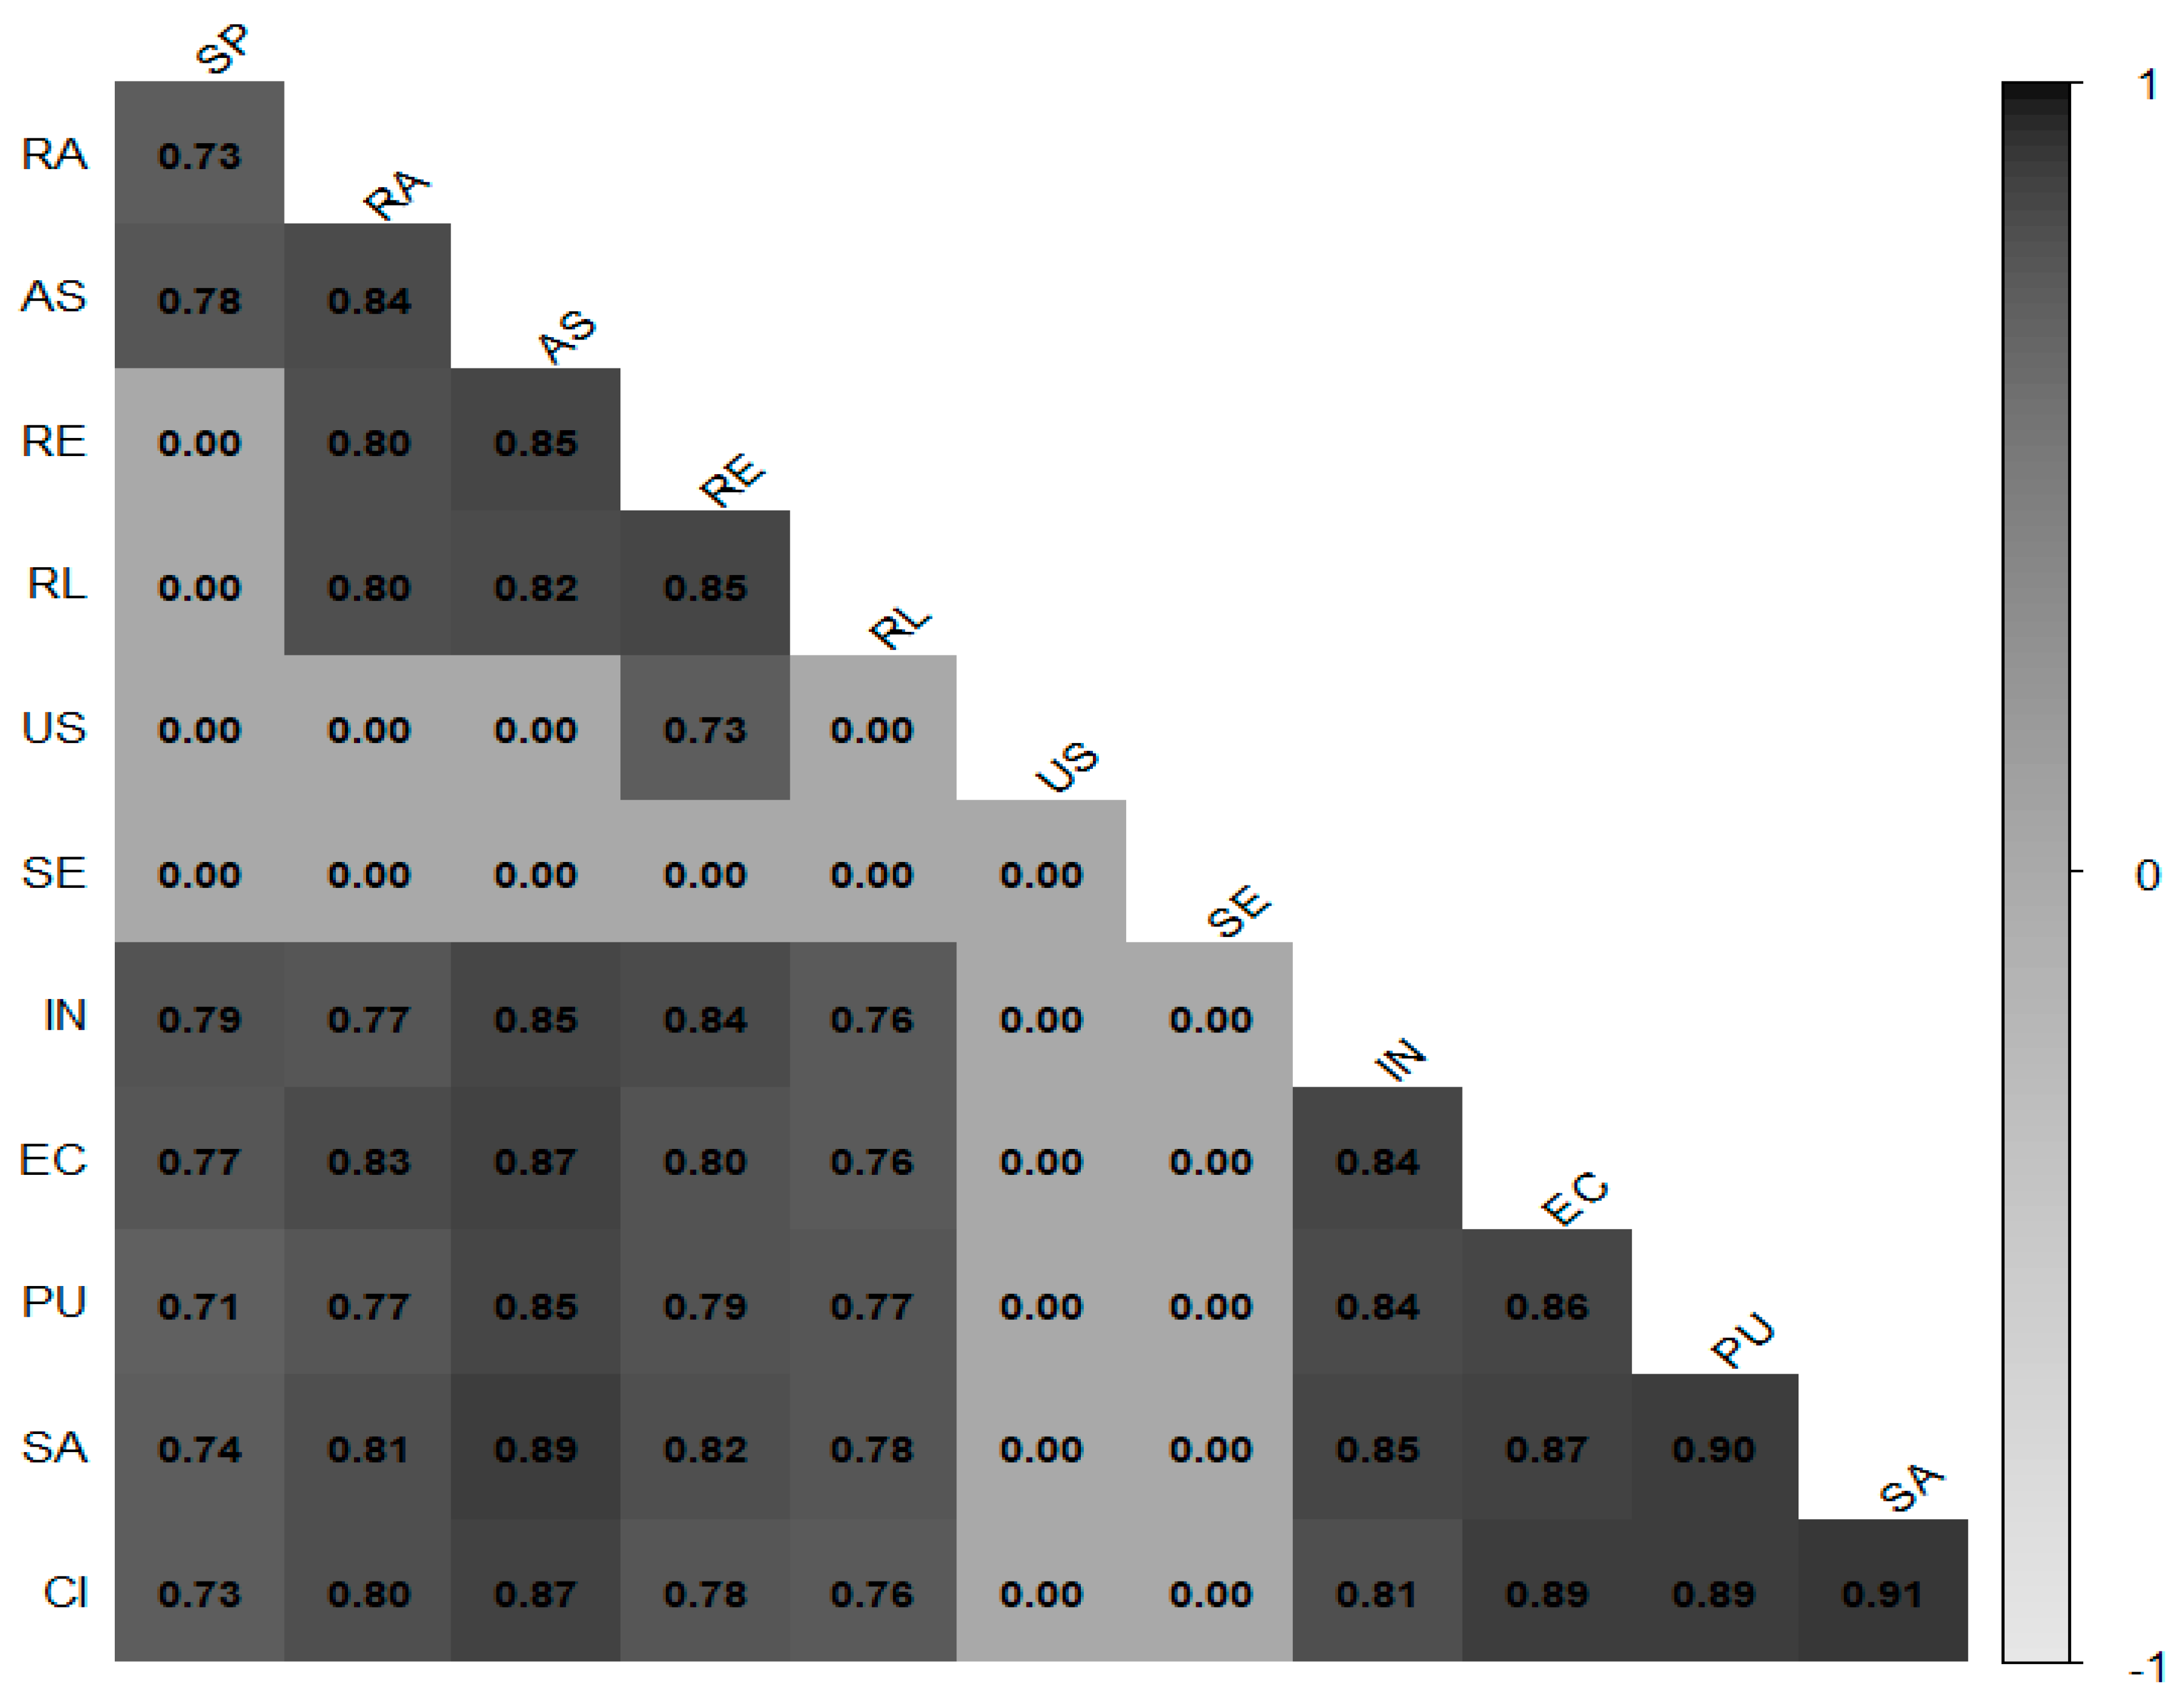
| Vars. | SP | RA | AS | RE | RL | US | SE | IN | EC | PU | SA | CI | √AVE |
|---|---|---|---|---|---|---|---|---|---|---|---|---|---|
| SP | 0.737 | 0.859 | |||||||||||
| RA | 0.729 | 0.865 | 0.930 | ||||||||||
| AS | 0.777 | 0.839 | 0.735 | 0.857 | |||||||||
| RE | 0.690 | 0.804 | 0.851 | 0.722 | 0.850 | ||||||||
| RL | 0.631 | 0.801 | 0.822 | 0.846 | 0.761 | 0.872 | |||||||
| US | 0.538 | 0.654 | 0.673 | 0.726 | 0.695 | 0.726 | 0.852 | ||||||
| SE | 0.554 | 0.584 | 0.641 | 0.655 | 0.693 | 0.601 | 0.812 | 0.901 | |||||
| IN | 0.788 | 0.772 | 0.849 | 0.837 | 0.760 | 0.677 | 0.679 | 0.791 | 0.890 | ||||
| EC | 0.772 | 0.832 | 0.868 | 0.795 | 0.759 | 0.627 | 0.579 | 0.843 | 0.847 | 0.921 | |||
| PU | 0.710 | 0.772 | 0.849 | 0.792 | 0.769 | 0.662 | 0.629 | 0.839 | 0.858 | 0.850 | 0.922 | ||
| SA | 0.737 | 0.807 | 0.888 | 0.816 | 0.780 | 0.691 | 0.585 | 0.847 | 0.870 | 0.896 | 0.881 | 0.939 | |
| CI | 0.730 | 0.800 | 0.868 | 0.777 | 0.759 | 0.655 | 0.587 | 0.811 | 0.889 | 0.888 | 0.907 | 0.872 | 0.934 |
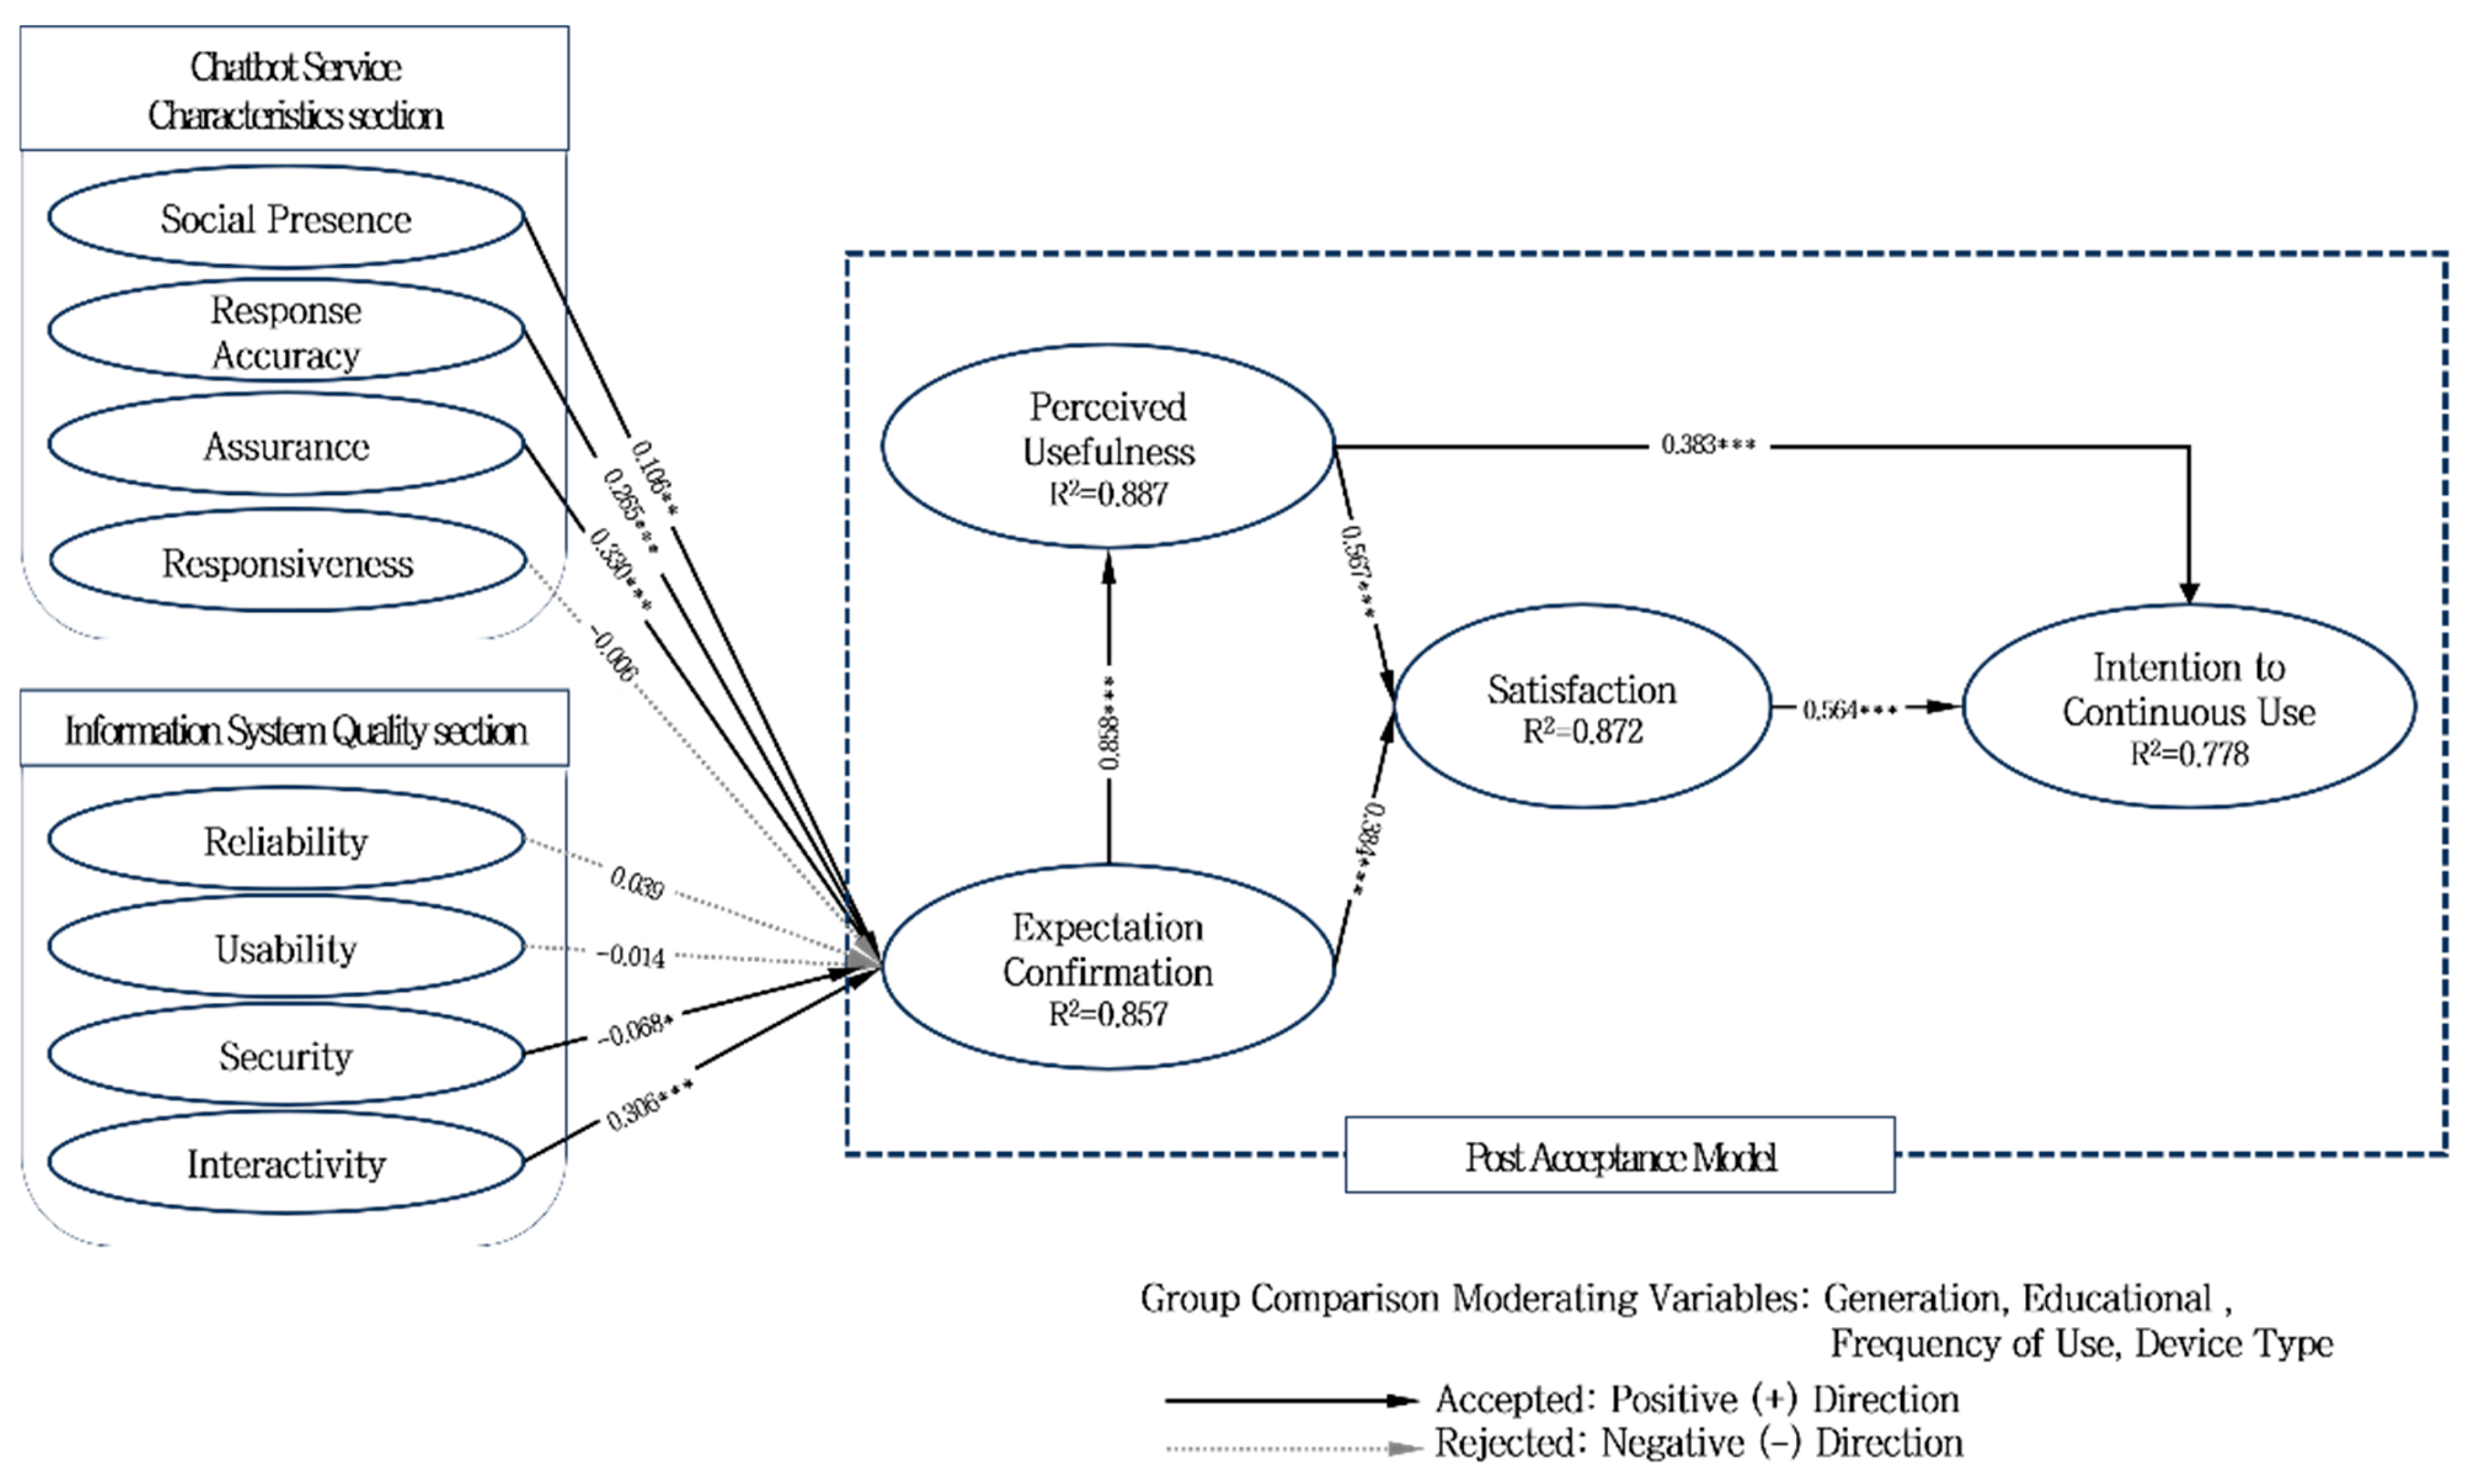
| Hypothesis | Path | Estimate | Std.Error | t-Value | p-Value | Result | ||||
|---|---|---|---|---|---|---|---|---|---|---|
| H1 | H1-1 | Social Presence | → | Expectation Confirmation | 0.106 | 0.034 | 3.137 | 0.002 | ** | Supported |
| H1-2 | Response Accuracy | 0.265 | 0.039 | 6.735 | 0.000 | *** | Supported | |||
| H1-3 | Assurance | 0.330 | 0.048 | 6.867 | 0.000 | *** | Supported | |||
| H1-4 | Responsiveness | −0.006 | 0.046 | −0.134 | 0.894 | Rejected | ||||
| H2 | H2-1 | Reliability | 0.039 | 0.042 | 0.921 | 0.357 | Rejected | |||
| H2-2 | Usability | −0.014 | 0.029 | −0.476 | 0.634 | Rejected | ||||
| H2-3 | Security | −0.068 | 0.028 | −2.396 | 0.017 | * | Supported | |||
| H2-4 | Interactivity | 0.306 | 0.044 | 6.903 | 0.000 | *** | Supported | |||
| H3 | Expectation Confirmation | → | Perceived Usefulness | 0.858 | 0.023 | 37.264 | 0.000 | *** | Supported | |
| H4 | Expectation Confirmation | → | Satisfaction | 0.384 | 0.035 | 11.076 | 0.000 | *** | Supported | |
| H5 | Perceived Usefulness | 0.567 | 0.035 | 16.364 | 0.000 | *** | Supported | |||
| H6 | Perceived Usefulness | → | Continuous Usage Intention | 0.383 | 0.039 | 9.824 | 0.000 | *** | Supported | |
| H7 | Satisfaction | 0.564 | 0.039 | 14.473 | 0.000 | *** | Supported | |||
Disclaimer/Publisher’s Note: The statements, opinions and data contained in all publications are solely those of the individual author(s) and contributor(s) and not of MDPI and/or the editor(s). MDPI and/or the editor(s) disclaim responsibility for any injury to people or property resulting from any ideas, methods, instructions or products referred to in the content. |
© 2025 by the authors. Licensee MDPI, Basel, Switzerland. This article is an open access article distributed under the terms and conditions of the Creative Commons Attribution (CC BY) license (https://creativecommons.org/licenses/by/4.0/).
Share and Cite
Choi, Y.-s.; Lee, S.-z.; Choi, J. A Study on Factors Influencing Continuous Usage Intention of Chatbot Services in South Korean Financial Institutions. Int. J. Financial Stud. 2025, 13, 56. https://doi.org/10.3390/ijfs13020056
Choi Y-s, Lee S-z, Choi J. A Study on Factors Influencing Continuous Usage Intention of Chatbot Services in South Korean Financial Institutions. International Journal of Financial Studies. 2025; 13(2):56. https://doi.org/10.3390/ijfs13020056
Chicago/Turabian StyleChoi, Yeun-su, Seung-zoon Lee, and Jeongil Choi. 2025. "A Study on Factors Influencing Continuous Usage Intention of Chatbot Services in South Korean Financial Institutions" International Journal of Financial Studies 13, no. 2: 56. https://doi.org/10.3390/ijfs13020056
APA StyleChoi, Y.-s., Lee, S.-z., & Choi, J. (2025). A Study on Factors Influencing Continuous Usage Intention of Chatbot Services in South Korean Financial Institutions. International Journal of Financial Studies, 13(2), 56. https://doi.org/10.3390/ijfs13020056