1. Introduction
One of the main causes that induce energy poverty in the long term, at world and European level as well, is income inequality. This issue is all the more acute as income inequality grows during an expected financial crisis because of slowed growth and rising unemployment, especially among low-income people.
From a theoretical perspective, income inequality may have a negative impact on energy poverty. A significant wealth gap in the EU can exacerbate energy poverty. Low-income households dedicate a larger portion of their income to energy bills, leaving less for other necessities. Furthermore, they may reside in older, less energy-efficient buildings, further increasing their energy costs. Conversely, a potential positive impact is theorized, based on the notion that economic growth associated with income inequality can lead to increased investment in the energy sector. This could, in turn, reduce overall energy prices, potentially benefiting low-income households. However, the effectiveness of this ’trickle-down’ effect in mitigating energy poverty remains debatable.
A higher Gini coefficient, with the same average income, implies a larger proportion of individuals with lower incomes. This directly translates to a higher risk of energy poverty, as these individuals struggle to afford basic energy needs. This is more accurately described as the effect of low income within a context of inequality, rather than a direct effect of inequality itself. It is the concentration of poverty that drives the issue.
High inequality can negatively impact even wealthier individuals through increased crime rates, elevated stress levels, decreased social cohesion, and infrastructure deficiencies. Inequality can breed social unrest and desperation, leading to higher crime. This, in turn, can increase energy costs (e.g., security lighting, alarm systems) and reduce overall well-being (
Lofstrom & Raphael, 2016). The constant awareness of vast economic disparities can lead to chronic stress, affecting mental and physical health. High inequality can reduce trust in society, and in turn reduce the ability to cooperate on solving societal problems, such as energy poverty. High inequality can result in the underfunding of public infrastructure, which can have an impact on the availability and reliability of energy (
Klinenberg, 2018). This is where the “real influence” of inequality lies, as it creates systemic issues that affect the entire population, regardless of individual income level.
Renewable Energy is a path forward, but not without challenges. First, transitioning to renewable energy sources like solar and wind power can offer a long-term solution to energy poverty. These sources are often cheaper and more stable in price compared to traditional fossil fuels. Additionally, government subsidies for renewable energy installations can make them more accessible to low-income households. Second, the upfront costs of installing renewable energy technologies can be high, creating an initial barrier for low-income households. Furthermore, a rapid shift towards renewables might require grid upgrades, which could lead to temporary price increases, impacting vulnerable populations in the short term.
The EU needs to address both income inequality and the transition to renewables to effectively tackle energy poverty. One strategy might focus on targeted policies, implementing targeted subsidies or social safety net programs that specifically assist low-income households with energy costs. A second strategy might take into account the energy efficiency upgrades by investing in programs that improve the energy efficiency of low-income housing, leading to long-term cost savings. One strategy might focus on targeted policies, such as implementing targeted subsidies or social safety net programs that specifically assist low-income households with energy costs.
The main objective of this paper is to assess the impact of income inequality on energy poverty and associated indicators in the EU during 2005–2023. The primary research question is the following: Does income inequality increase energy poverty? A significant contribution of this paper is the consideration of another indicator to measure income inequality besides the Gini index. Gender pay gap is also considered for robustness as an indicator for income inequality. It reflects pay discrimination and other issues encountered by women in their access to labour market opportunities, rewards, and promotion. European policy initiatives have intensified in recent years to reduce gender discrimination. However, to our knowledge, gender pay gap has not been analysed before in literature from the perspective of its effects on energy poverty.
Despite this severe issue for the EU-27, the theoretical background identifies several shortcomings for which policymakers and researchers alike make efforts to find solutions. These limitations consist of the lack of a widely accepted definition for energy poverty and the large diversity of indicators used to measure energy poverty. A recent step forward has been made by the European Parliament, which drafted a common accepted definition that is integrated into the EU Social Climate Fund overhaul. According to the European Commission, energy poverty is defined as “a household’s lack of access to essential energy services that provide basic levels and decent standards of living and health, including adequate heating, hot water, cooling, lighting, and energy to power appliances” (
Tinarwo et al., 2025). The European definition that should be discussed and considered by all the EU-27 state members provides precise quantitative targets. The households experiencing energy poverty are placed in the lowest income deciles, and their energy costs should be two times higher than the median ratio between disposable income and energy costs. However, the European policymakers have not yet established a common set of indicators to measure energy poverty across EU member states. In this study, several Eurostat indicators are used to represent energy poverty based on data availability: common variables found in other studies (total arrears on utility bills, population unable to keep their home adequately warm) and indicators not previously used in other research (arrears on utility bills for households with dependent children, energy imports dependency rate, housing cost overburden rate).
Our analysis is limited to explaining energy poverty based on income inequality and other determinants using panel data models (method of moments quantile regressions and mean group estimators).
Energy poverty is a matter of social justice and equity. Access to affordable and clean energy is a fundamental human right, and inequality undermines this right. Interconnectedness of energy poverty, income inequality, and other social issues like gender inequality should be addressed in a holistic manner to lead to more sustainable and equitable outcomes. High inequality reduces the resilience of society to cope with external shocks, such as energy crises. When a society is highly unequal, the poorest are much more vulnerable to energy price spikes and other disruptions. Specific targets for reducing income inequality and gender pay gaps are necessary, and these targets can be integrated into energy poverty reduction strategies. Addressing income inequality is essential for achieving the EU’s climate goals and ensuring a just transition that leaves no one behind.
Our macroeconomic policy recommendations aim to mitigate the negative consequences of energy poverty at the individual level: minimization of income inequality through suitable policies (such as improvement of human capital through better education, higher minimum wage, better protection of intellectual property, changes in corporate governance, better infrastructure), reformulation of renewable energy policies to reduce the burden of renewable energy taxes and surcharges on end users, and the promotion of foreign investment in renewable energy and the green sector. While policies focused on reducing income inequality should consider energy poverty, the relationship between energy poverty and income inequality is not the focus of this paper. The energy poverty–income inequality nexus might be analysed in its bidirectional perspective. Income inequality might also be explained starting from energy poverty, but the extension of the analysis will be the subject of a future study. Moreover, this paper provides an overall analysis of the EU-27 countries neglecting the differences between the EU old member states and new member states, since a common energy policy should be designed for all the EU countries. Nevertheless, a future study will conduct a separate and comparative analysis of these two groups of countries and develop specific policy recommendations.
2. Literature Review: Energy Poverty and Its Determinants
This section provides an overview of the modern concept of “energy poverty”, indicators used to measure it, and determinants that are also used in this study. Existing empirical findings in the literature inform the hypotheses related to the influence of various factors on energy poverty.
Energy poverty presents a significant challenge within the European Union, impacting over 100 million individuals who struggle to maintain adequate indoor thermal comfort. The ongoing conflict in Ukraine exacerbates this issue, leading to increasingly dire energy poverty scenarios.
The precise definition of energy poverty remains a subject of ongoing debate (
Bouzarovski, 2014). Historically, the concept of “fuel poverty”—defined as the inability to afford sufficient home heating (
Bradshaw & Hutton, 1983)—partially encompasses energy poverty. While some scholars consider these terms synonymous, others differentiate them, viewing energy poverty as a specific type of fuel poverty (
Li et al., 2014).
Early research focused on the link between energy poverty and household income, recognizing the heightened vulnerability of low-income households in meeting energy expenses (
Boardman, 1991). This perspective, prevalent in developed countries, led to the development of expenditure-based indicators to measure energy poverty (
Pachauri & Spreng, 2011).
A widely accepted definition of energy poverty centres on the lack of access to modern energy services, encompassing household access to electricity, clean cooking, and commercial energy (
IEA, 2010).
Parajuli (
2011) expanded this definition, linking energy poverty to broader social and economic development goals. This perspective views energy poverty as a multifaceted concept, incorporating both subjective and objective factors. The subjective component considers household members’ perceptions of insufficient warmth, while the objective component assesses whether household net income, after energy expenses, falls below the national poverty line and whether energy costs exceed the national average. These multidimensional factors encompass a range of social, economic, and environmental determinants.
Boardman (
1991) identified a range of factors influencing energy poverty, including household economic and social characteristics, energy prices, and energy efficiency.
Recalde et al. (
2019) emphasized the importance of structural determinants such as economic, labour, market, and housing policies in a multidimensional understanding of energy poverty.
Nussbaumer et al. (
2012) developed a multidimensional energy poverty index based on the IEA energy development index. This index measures not only the lack of access to modern energy services but also reflects economic and social aspects, considering accessibility, affordability, and the use of energy for various needs. In essence, the
Nussbaumer et al. (
2012) index assesses energy poverty as a form of deprivation related to access to modern energy services.
Pachauri and Spreng (
2011) identified three primary approaches to measuring energy poverty: physical, technological, and economic thresholds. The physical threshold, similar to the World Bank’s concept of absolute poverty, establishes a minimum energy consumption level necessary to meet basic needs. The technological threshold focuses on the lack of access to essential energy services. Conversely, the economic threshold defines energy poverty based on the proportion of income required for acceptable energy expenditure.
Empirical studies have employed various indicators to measure energy poverty based on data availability. These include access to different energy sources (
Pachauri et al., 2004;
Chakravarty & Tavoni, 2013), access to electricity (
Chevalier & Ouédraogo, 2009;
Churchill & Smith, 2020;
Nguyen & Su, 2022), access to modern cooking technologies (
Parajuli, 2011;
Nguyen & Su, 2022), access to modern energy fuels (
Sesan, 2012;
El-Katiri, 2014;
Nguyen & Su, 2022), number of households with inadequate heating (
Buzar, 2007), energy bill arrears, inability to maintain adequate home warmth, health issues related to poor heating, dwellings with leaks and dampness, restriction of other essential needs (
Papada & Kaliampakos, 2016;
Halkos & Gkampoura, 2021), proportion of income spent on fuel or energy (
Churchill et al., 2020), households spending over 10% of income on energy (
Churchill & Smith, 2020;
Wang et al., 2021), fuel poverty index, structural energy poverty vulnerability index, energy vulnerability composite index (
Siksnelyte-Butkiene et al., 2021), and percentage of energy-poor households across income quartiles (
Awan & Bilgili, 2022).
This study adopts a multidimensional approach to measuring energy poverty, drawing inspiration from the work of
Papada and Kaliampakos (
2016) and
Halkos and Gkampoura (
2021). We utilize two key indicators: the inability to maintain adequate indoor warmth and arrears on utility bills. Recognizing the heightened vulnerability of households with dependents, we specifically examine utility bill arrears within this sub-group. Furthermore, to contribute to the existing literature, we incorporate two novel indicators: energy import dependence and housing cost overburden rate.
These energy poverty measures are correlated with various economic and social indicators. Most of the previous studies explain energy poverty based on energy efficiency, low incomes and energy prices (
Okushima, 2017). In this study, since the main aim is to study the impact of income inequality on energy poverty, few indicators were selected as explanatory variables in the models to reflect economic and social characteristics in the analysed countries. Moreover, the consideration of the following indicators is conditioned by data availability for the EU-27 countries: Gini index and gender pay gap as income inequality measures, GDP per capita, foreign direct investment, human capital index, renewable energy consumption (REC), and urban population. Since there are differences between males and females related to energy consumption (
Pachauri & Rao, 2013), one can make the assumption that gender pay gap, like a measure of income inequality, might affect energy poverty.
From a theoretical point of view, income inequality and urban population should have a positive impact on energy poverty indicators. On the other hand, foreign direct investment, human capital index, and REC are expected to reduce energy poverty. Previous studies from literature that considered these determinants provide mixed evidence. In most of the studies, greater economic growth reduces energy poverty (
Acharya & Sadath, 2019;
Bardazzi et al., 2021), but contrary evidence is bought by
Amin et al. (
2020) for some South Asian countries in the period 1995–2017 and by
Nguyen and Su (
2022) for 56 developing countries in the period 2002–2016. A growing economy generally leads to higher incomes for people across the board. This gives low-income households more disposable income, allowing them to afford the cost of energy bills and potentially invest in more energy-efficient appliances or home improvements. However, in some cases, economic growth can exacerbate income inequality. If the benefits are concentrated at the top, the poorest households might see little to no improvement in their income. This can leave them struggling to afford even basic necessities like energy (
Bardazzi et al., 2021).
In all previous studies, higher level of education has the capacity to reduce energy poverty (
Hassan et al., 2022;
Nguyen & Su, 2022;
Apergis et al., 2022;
Rafi et al., 2021). Education can make people more conscious of energy use and environmental issues. This can lead them to adopt behaviours that reduce energy consumption, like switching off lights, using natural light, or air-drying clothes (
Apergis et al., 2022). People with higher education tend to have better jobs and higher incomes. This allows them to afford more energy-efficient appliances and potentially even homes with better insulation, leading to lower energy bills (
Nguyen & Su, 2022). Those with higher education may be better equipped to navigate complicated energy plans and choose the most cost-effective option for their needs. They might also be more likely to switch providers for a better deal. Higher education can open doors to better job opportunities, potentially leading to living in areas with more modern housing stock. These homes might be built with energy efficiency in mind, further reducing energy costs (
Rafi et al., 2021).
The positive impact of FDI might be explained by infrastructure development. FDI can bring in funds for building new power plants, transmission lines, and distribution networks. This expands access to electricity in previously unserved areas, directly reducing energy poverty. Moreover, foreign investment can introduce new technologies like solar panels or wind turbines. This can create a more sustainable and affordable energy mix, reducing reliance on expensive traditional fuels (
Nguyen & Nasir, 2021). In the case of negative effect of FDI, foreign companies may prioritize short-term profits over long-term development goals. This could lead to neglecting investments in expanding access to poorer areas or focusing on expensive technologies that don’t benefit the most vulnerable. In addition, reliance on foreign investment can make energy prices more susceptible to global market fluctuations, impacting affordability for low-income households (
Nguyen & Su, 2022).
Income inequality might increase energy poverty because, when the gap between rich and poor widens, low-income households have a smaller share of the total income. This translates to less money for basic necessities, including energy bills. They might have to choose between essentials like food and heating their homes (
Bardazzi et al., 2021). Government subsidies for energy may not be well-targeted towards the poorest. A flat subsidy might benefit wealthier households more, as they consume more energy overall. On the other hand, income inequality might reduce energy poverty. Trickle-down effect theory suggests that economic growth driven by a wealthy segment can eventually benefit everyone. In some cases, increased investment in the energy sector due to a growing economy might lead to lower energy prices overall, including for low-income households (
Nguyen & Su, 2022).
Urban population has an indirect impact on energy poverty (
Nguyen & Nasir, 2021). Cities can benefit from economies of scale when it comes to energy infrastructure. District heating and cooling systems, for example, can be more efficient than individual heating and cooling units in homes, potentially lowering energy costs for residents. Cities can design targeted subsidy programs for energy efficiency upgrades or renewable energy installations in low-income housing. This can make these technologies more affordable and directly reduce energy bills.
Given the previous studies from the literature, this paper covers some specific gaps and brings a novel contribution. Most of the previous contributions on panel data focused on GMM, while none of the papers considered the MMQ regression models that present the benefit of following the short-run and long-run evolution of the relationship of energy poverty and other variables. The long-run effect suggests that the relationship establishes stability over time, whereas the short-run analysis indicates validity only within specific periods. Moreover, the nonlinear effect is captured by analysing the potential changes in the sign of a coefficient associated with an explanatory variable. Moreover, this paper introduces gender pay gap as a measure of income inequality since it is a current issue for more EU states, and it is directly connected with energy consumption. Moreover, none of the previous studies resumed the analysis of EU-27, which is essential for a balanced design of economic, social, and energy policies that are interconnected. The empirical findings of this paper allow the formulation of specific policy recommendations that take into account income inequality, while previous studies did not connect energy policies with income inequality.
3. Data and Methodology
The dependent variables employed in this study are provided by Eurostat and serve as proxies for energy poverty and other indicators related to this phenomenon:
Total arrears on utility bills (%) denoted by total arrears;
Arrears on utility bills households with dependent children (% of households with dependent children) written as arrears—children;
Population unable to keep home adequately warm (% of households) denoted by pop;
Energy imports dependency rate defined as share of total energy needs of a state that are met by imports, denoted by energy imports:
import—import of energy (energy brought in from other countries through pipelines, electricity grids, or physical transportation of fuels);
export—export of energy (energy sold to other countries);
gross available energy—the total amount of energy a country or region has access to for all activities within its borders.
Housing cost overburden rate (%), denoted by overburden rate: percentage of population that belongs to households characterized by more than 40% of disposable income allocated to overall housing costs.
The measures of income inequality used in this study are the following: Gini index, denoted by Gini (the extent to which the distribution of income deviates from a perfectly equal distribution in an economy), from World Bank; and gender pay gap (difference between mean of gross hourly earnings of males and females as a percentage of the average gross hourly earnings of males) from Eurostat denoted by gap. Other control variables are GDP per capita (GDP), FDI, urban population (urban), human capital index (HCI), and renewable energy consumption (REC) provided by World Bank. GDP is expressed in constant prices (2015 US $) to eliminate the influence of inflation. Data for energy price are not available for the analysed period, and this variable is not included to avoid too many missing values. By incorporating climate considerations, research on energy poverty can provide more valuable insights and inform more effective policy interventions.
This analysis examines panel data for the EU-27 member states spanning the period from 2005 to 2023. As shown in
Table 1, Hungary experienced the highest economic growth rate in 2019, while Lithuania recorded the lowest in 2007. In terms of utility bill arrears, Luxembourg consistently reported the minimum values for both total arrears and arrears faced by households with dependent children throughout 2008. Conversely, Greece exhibited the maximum level of total arrears in 2016, potentially linked to the country’s high public debt in 2015. Similarly, Luxembourg had the lowest share of the population struggling to keep their homes adequately warm. Bulgaria, on the other hand, emerged as the most vulnerable country based on this indicator. Estonia was the least dependent on energy imports in 2018, while Malta was the most vulnerable in terms of energy imports in 2013. Luxemburg registered the minimum housing cost overburden rate, while Estonia was the most vulnerable in 2015. The correlation matrix showed no significant correlations between the explanatory variables.
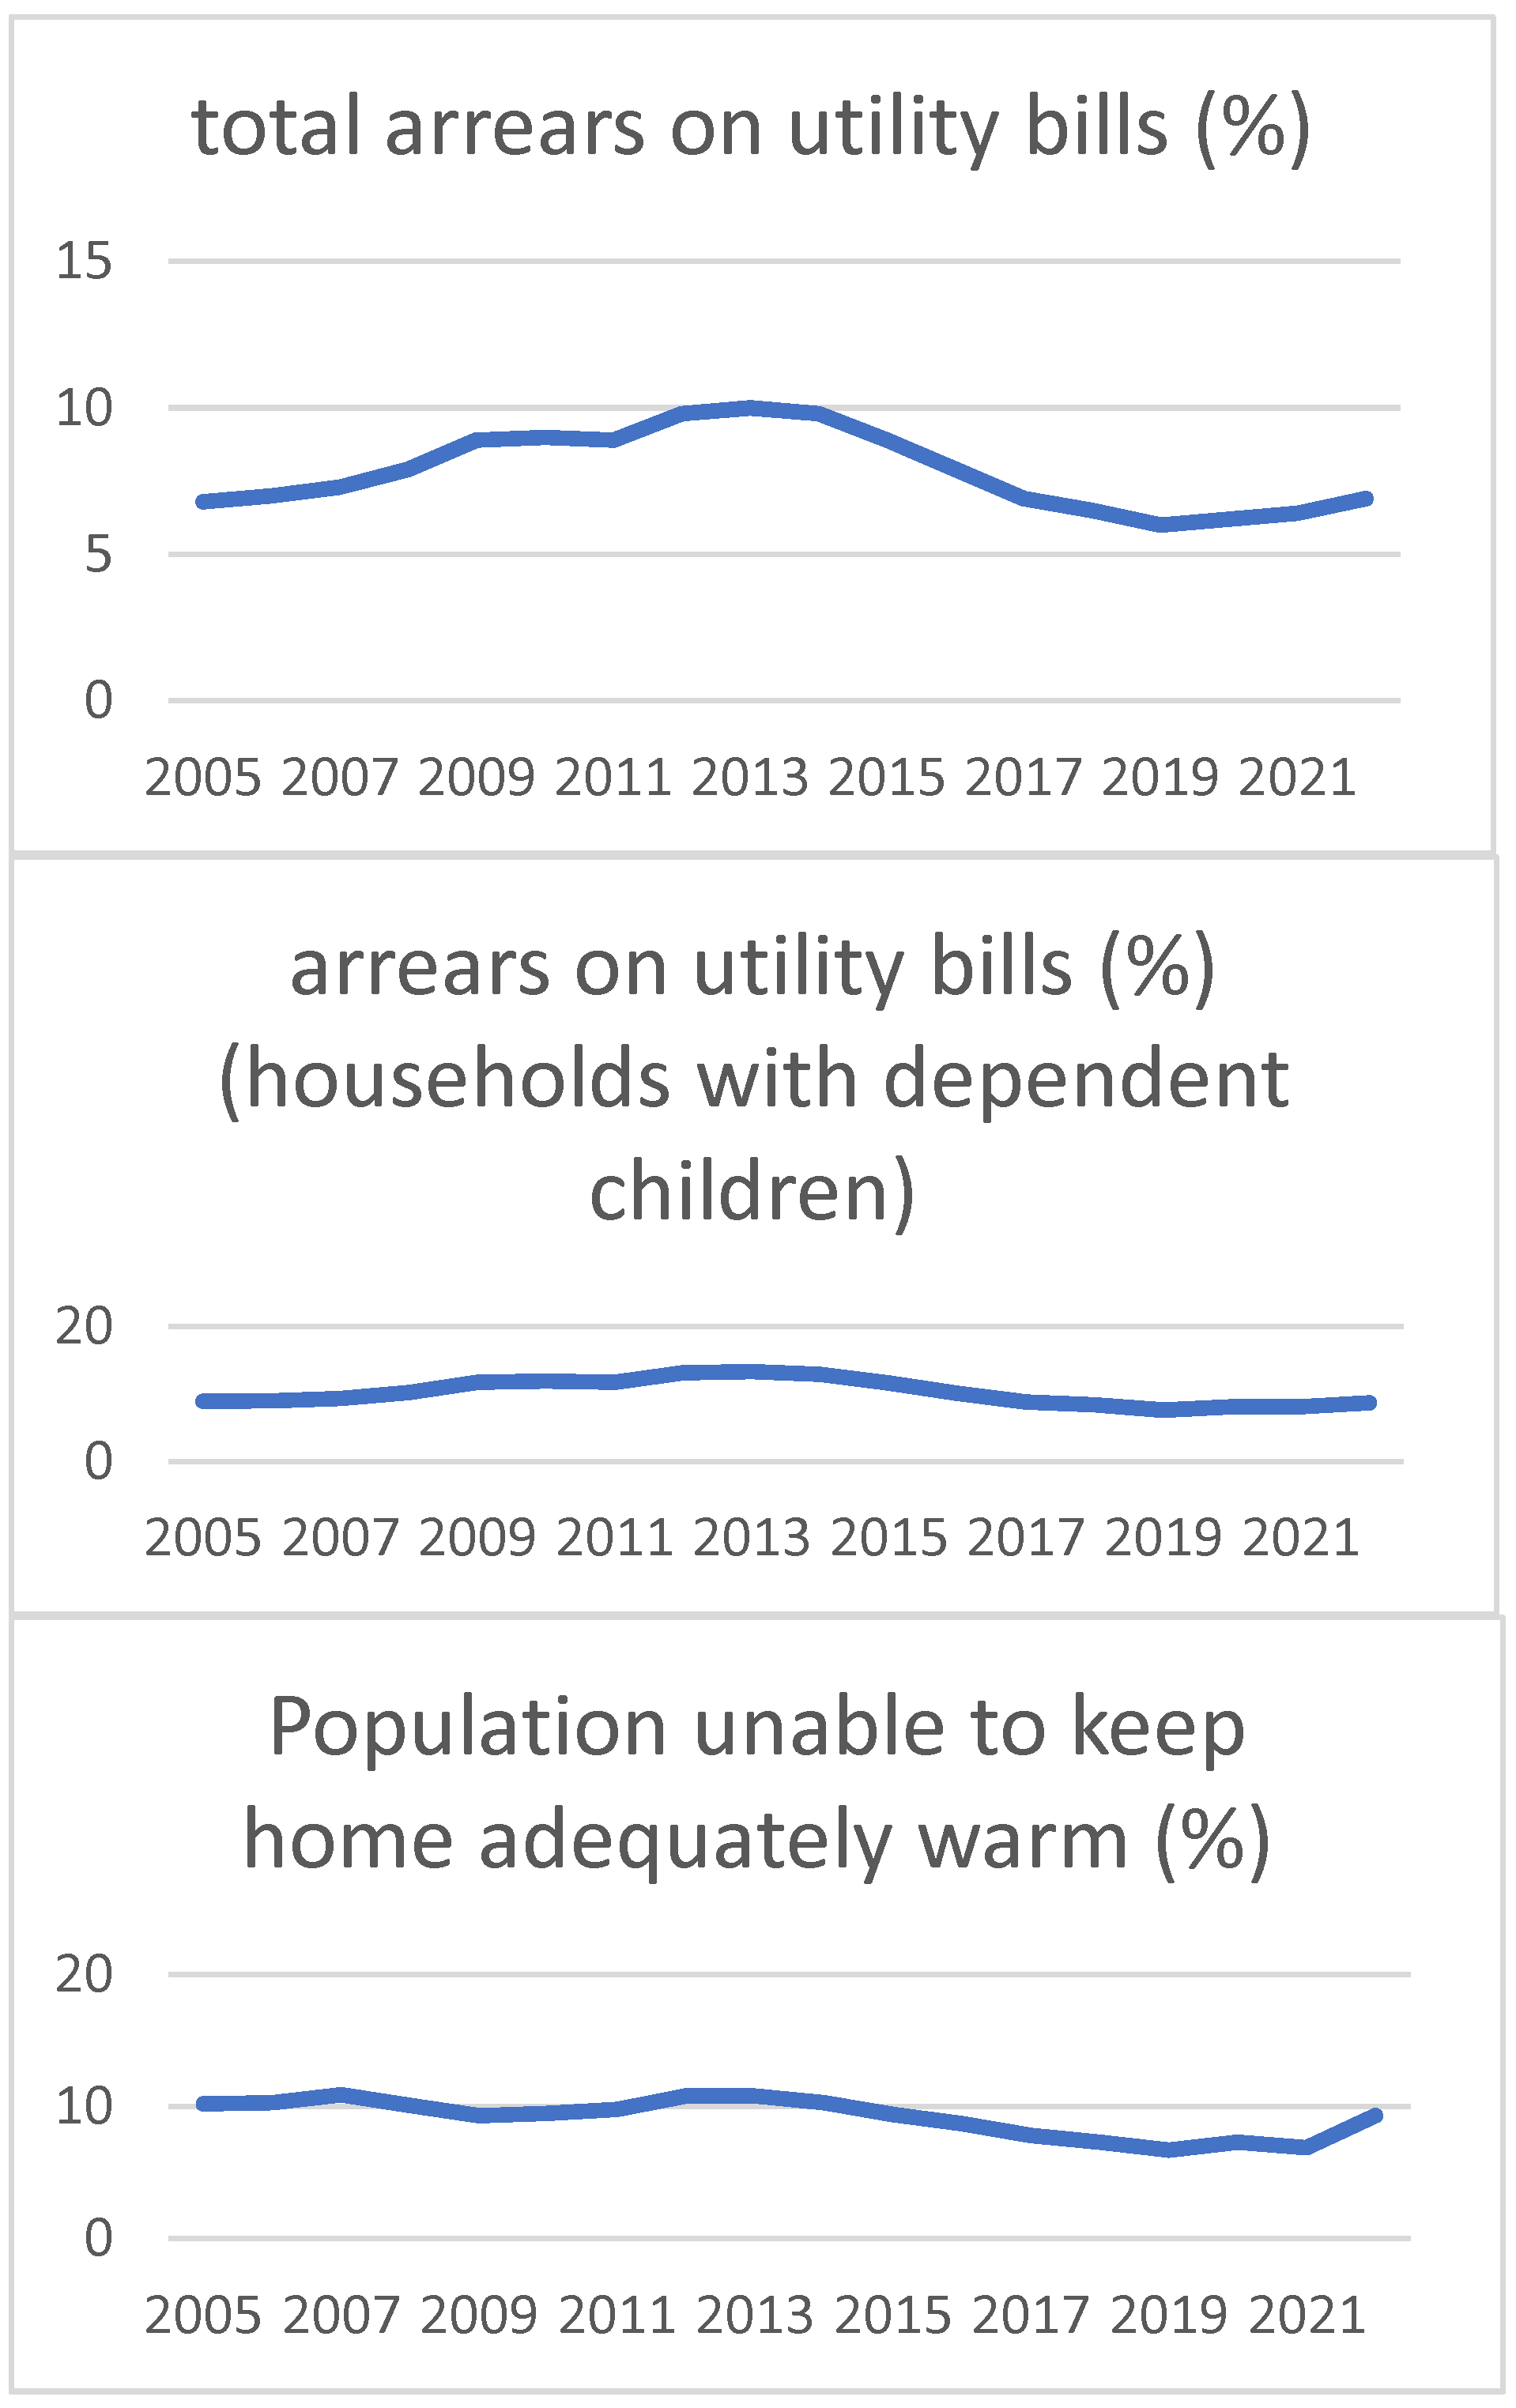
Figure 1 presents the evolution of total arrears on utility bills aggregated at the EU level in the period 2005–2023. The maximum value of the indicator (10%) is reached in 2013, while the minimum was registered in 2019 (6%), the value increasing slowly in 2020 because of the pandemic.
Figure 1 also reflects the evolution of arrears on utility bills in households with dependent children aggregated at the EU level in the period 2005–2023. The maximum value (13.3%) is reached in 2013, while the minimum is registered in 2019 (7.6%), the value increasing in 2020 because of the pandemic. In 2007, the population unable to keep home adequately warm reaches its maximum value (10.9%), while in 2019, the minim of 6.7% is registered.
There is a general trend of improvement between 2005 and 2019, with a decrease in the number of people struggling to afford utilities and keep their homes warm. The COVID-19 pandemic appears to have reversed this trend to some extent in 2020.
Specific models are used in this study: method of moments quantile models that make no assumption on data distribution and mean group estimator for robustness. Economic factors likely influenced these trends. An improving economy between 2005 and 2019 may have allowed more people to afford their utility bills. The pandemic’s economic downturn in 2020 may explain the increase in arrears. The figure only shows EU-level data. There may be significant variations among different countries within the EU.
Let us consider two models’ specifications to explain EP (energy poverty) with the representations in Equation (1):
The panel quantile regression is applied for models in (1) and (2), with superior results in the estimation compared to conditional median and mean distribution. The time index t ranges from 2005 to 2023 and cross-sectional index i takes the values from 1 to 27 corresponding to the 27 member states of the EU.
Panel quantile regression offers several benefits. Unlike traditional methods, it doesn’t require assumptions about the existence of moments (averages) or the specific distribution of the data. This makes it well-suited for analysing data with unobserved factors that vary between individuals (individual heterogeneity) and for capturing how the effects of variables differ across the entire distribution (distributional heterogeneity). Additionally, panel quantile regression can produce more robust and accurate results when dealing with outliers or data with heavy tails (distributions with more probability mass in the tails) (
Salman et al., 2019).
Considering
and
as unobserved country effects, the equations are rewritten as in Equations (3)–(6):
In this case,
is the
quantile level described in relationship (7), where
takes the values 0.15, 0.25, 0.35, 0.45, 0.55, 0.65, 0.75, 0.85, and 0.95, for different conditional quantile functions.
The parameter size
ranges between 0 and 1 to consider the minimum of the weighted sum of deviation in absolute value. The conditional quantile of the energy poverty for different exogenous variables
is expressed in Equations (8) and (9):
For robustness, MG estimator is considered starting from ordinary least squares method. It supposes the construction of time-series regressions of the 27 countries. Then, the average slope coefficients are calculated to reflect panel heterogeneity. In this case, coefficients and error variances may change across countries. However, preliminary tests are applied to justify the use of MG estimator: cross-sectional dependence, heterogeneity, unit root tests. The flowchart in
Figure 2 indicates the steps followed in applying the presented methodology.
4. Results
4.1. Preliminary Tests
Our analysis suggests the presence of cross-sectional dependence among the variables. This could be attributed to the common regulations that apply across all 27 EU member states. Tests for cross-sectional dependence, such as the Pesaran CD and Breusch–Pagan LM, provide statistical support for this dependence at the 10% significance level (refer to
Table 2 for details).
The test employed to check for slope heterogeneity of
Pesaran and Yamagata (
2008) indicates that the homogeneity characterizes the logarithmic data series for all variables excepting GDP per capita and gender pay gap at 1% significance level (see
Table 3).
Given the presence of cross-sectional dependence and the unbalanced nature of our panel data, we employ the CADF test to assess the existence of unit roots. This test is known to be sensitive to the selection of lag lengths. To address this sensitivity, we estimate the CADF test with both one and two lags included in the model. When testing for unit roots in levels (original data), we consider models with both a constant and a trend term. However, for data in first differences (differenced data), the model only includes an intercept term (see
Table 4 for details).
The CADF test results indicate that unit roots are not present in the first difference of GDP per capita, population unable to keep home adequately warm, energy imports dependency, Gini index, renewable energy consumption (REC), and foreign direct investment (FDI) at the 5% significance level. This suggests these variables are stationary after differencing. Conversely, the remaining variables appear to be stationary in their level form (original data) based on the test.
4.2. Estimation Results
Given the nature of the data series, method of moments quantile regressions are constructed. Moreover, MG (Mean Group) estimators are calculated for robustness analysis. The traditional OLS (ordinary least squares) regression is valid in the case of normally distributed data. If normality hypothesis is not checked, MMQ (method of moments quantile regression) model is recommended.
The Shapiro–Wilk and Shapiro–Francia tests are used to check for normal distribution of the data under the null hypothesis of normality.
Table 5 indicates that both tests reject the null hypothesis at 1% significance level, since
p-values are less than 0.01.
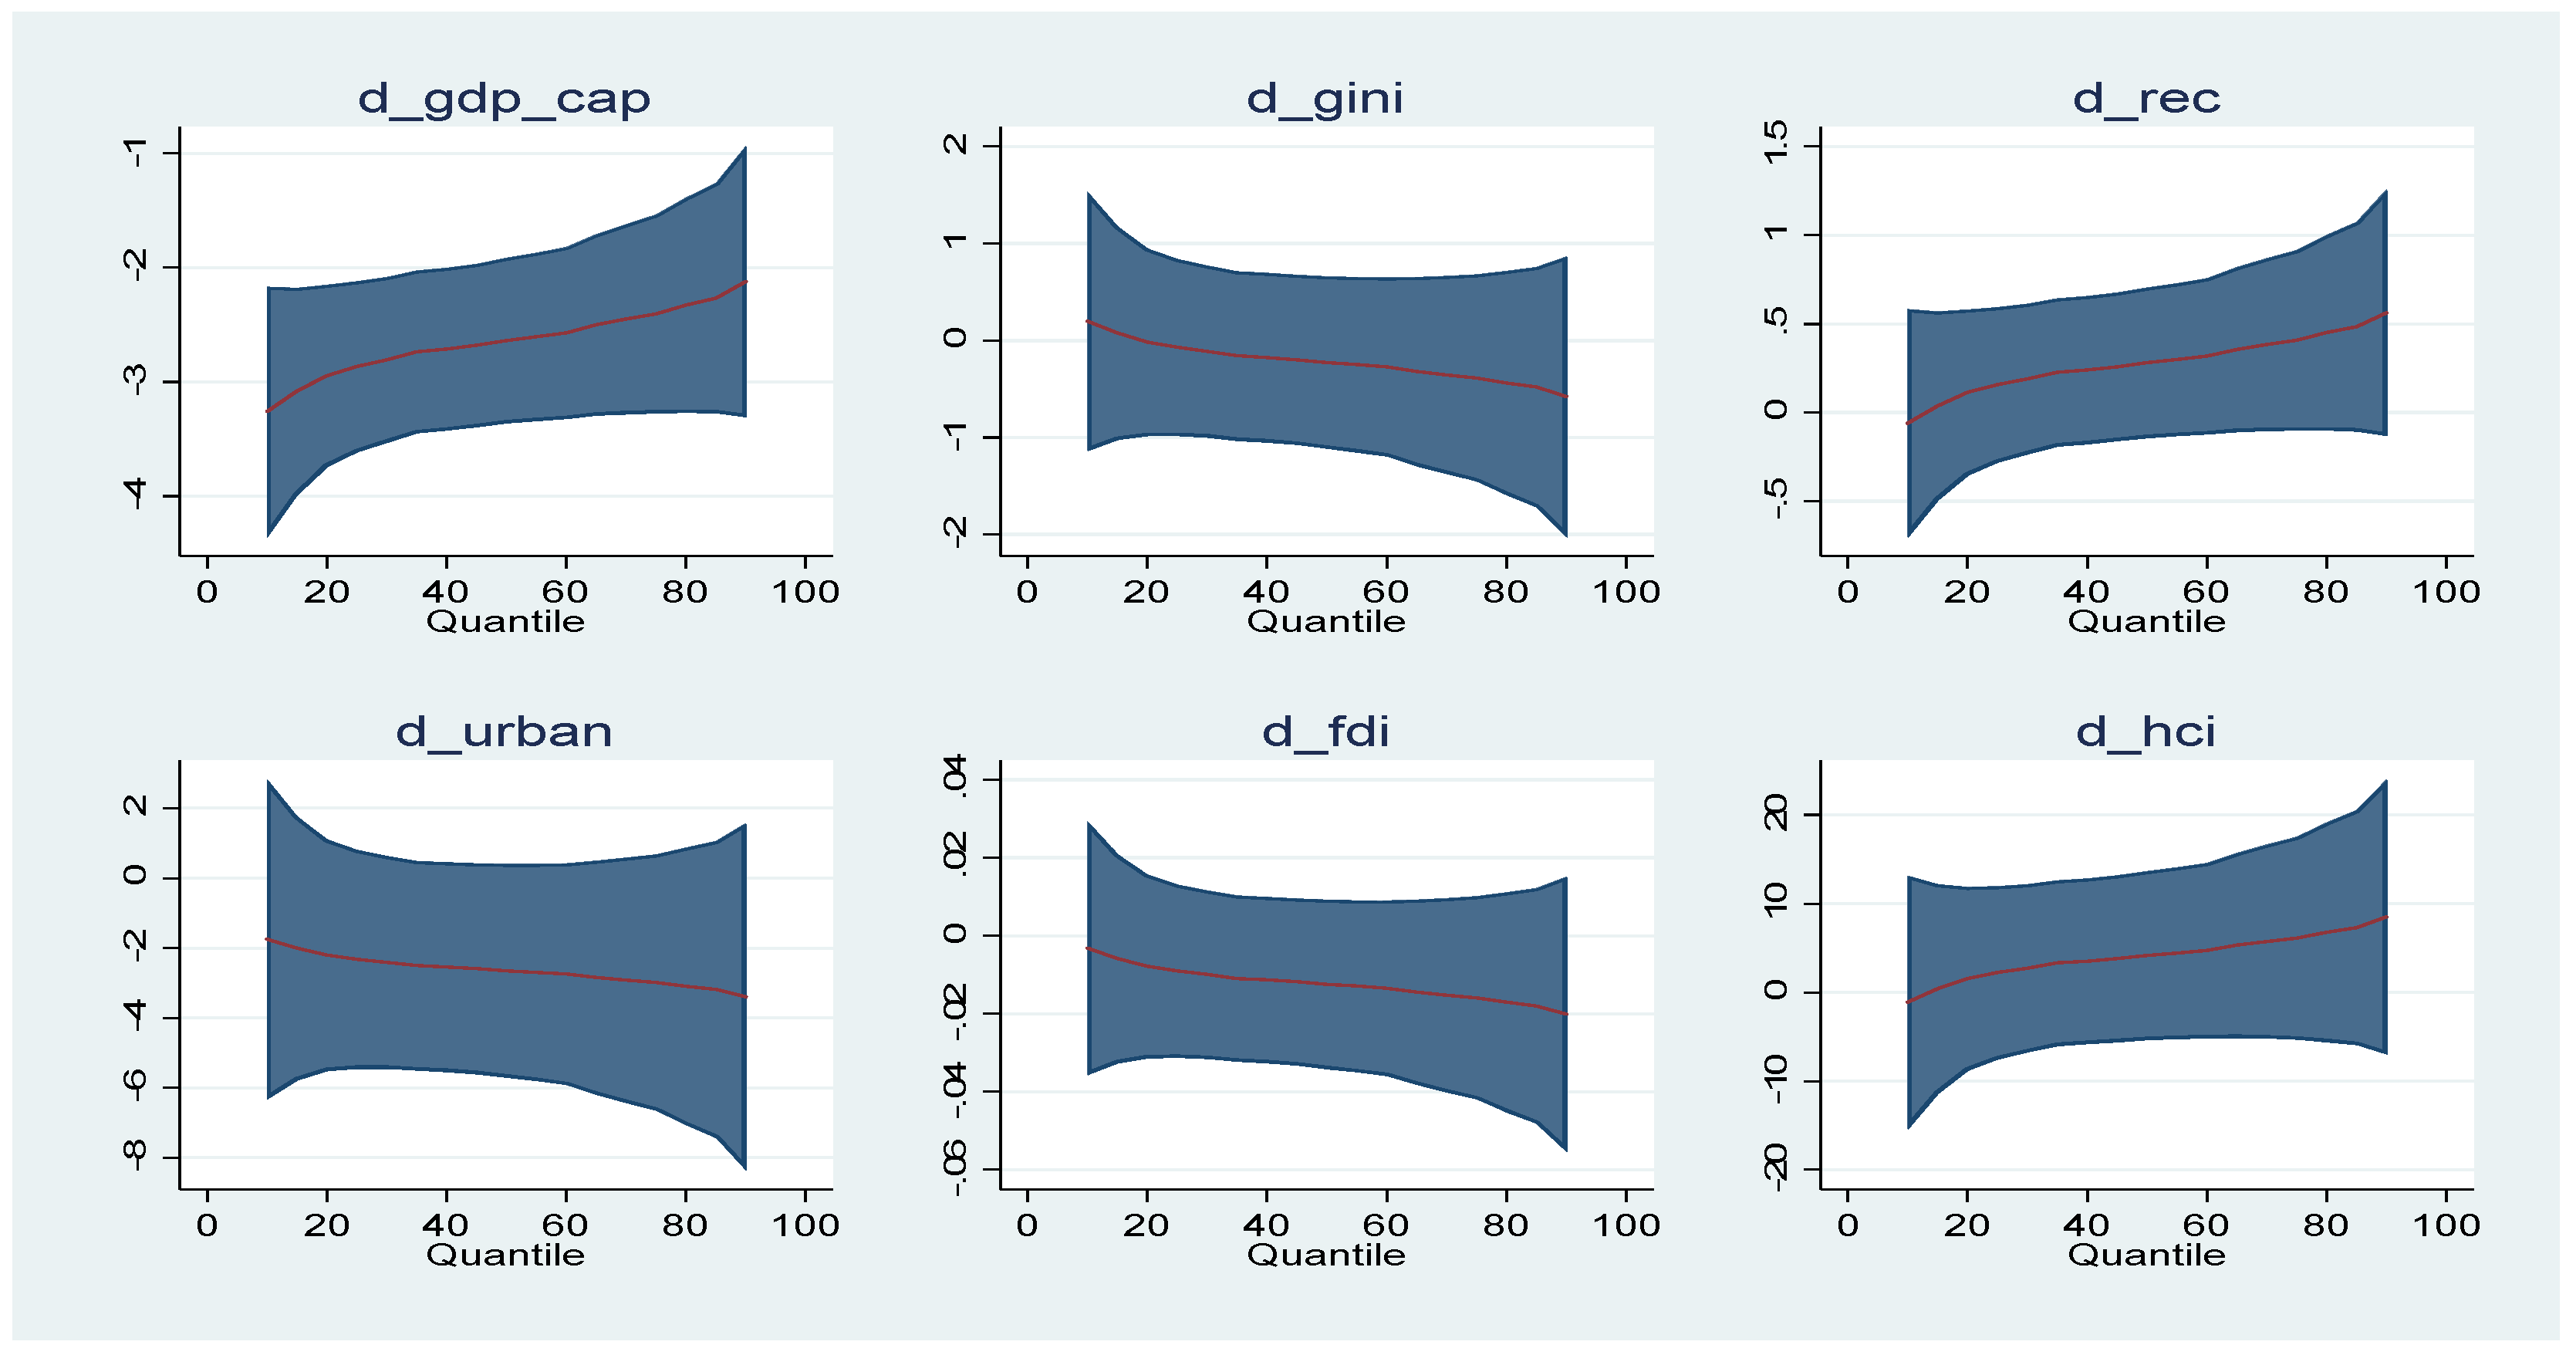
As normality tests rejected a normal distribution for the data, we employed MMQ regressions for analysis (details in
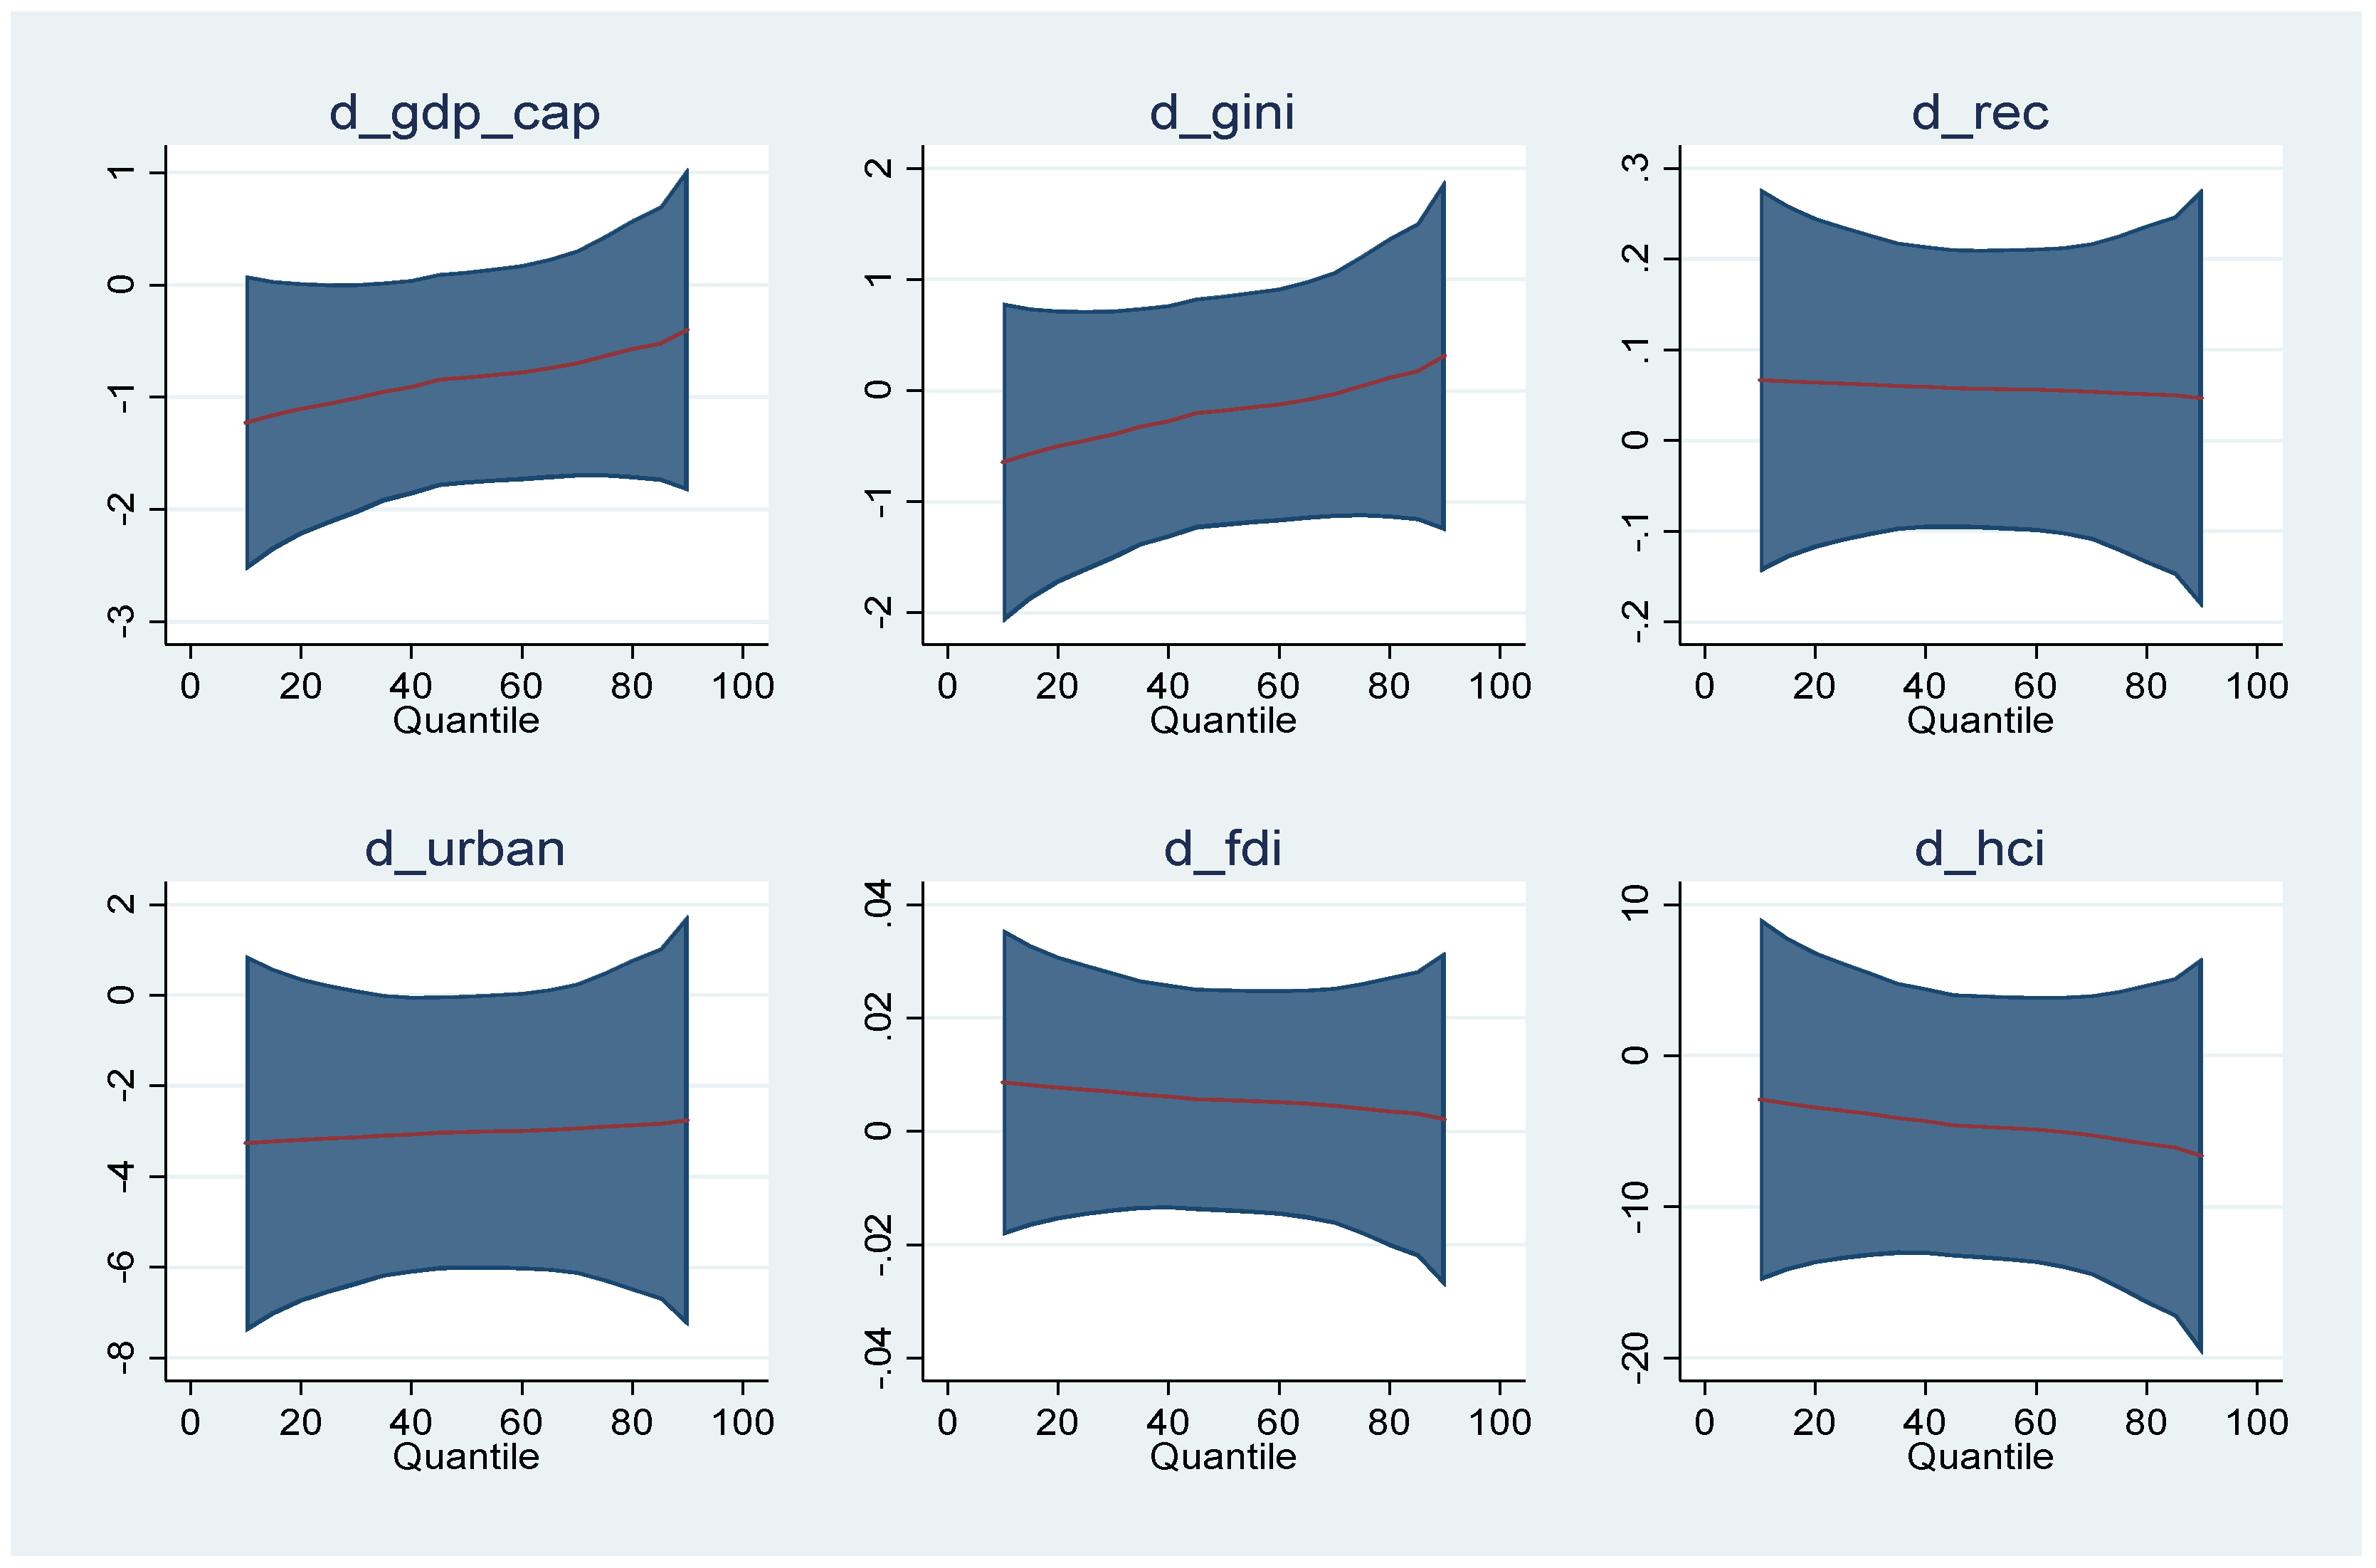
Table 6). The results reveal that the Gini coefficient, a measure of income inequality, has a positive and statistically significant impact on total utility bill arrears. This suggests that greater income inequality is associated with higher levels of arrears. Conversely, both a higher urban population share and foreign direct investment (FDI) are negatively associated with arrears. The impact of GDP per capita on arrears is relevant. It has a negative effect, but only up to the 55th percentile of the distribution. This implies that economic growth is effective in reducing arrears, but this effect weakens as income levels rise. FDI potentially reduces arrears by creating jobs and boosting economic activity. Finally, a larger urban population likely has higher average incomes compared to rural areas, leading to a greater capacity to pay utility bills.
Only some coefficients corresponding to the 65th and 75th quantile levels were significant in the panel data models explaining energy imports dependence (see
Table 7). Economic growth, urban population growth, and higher HCI reduce energy imports dependence only at the 75th quantile level. REC reduces energy imports dependence at the 65th and 75th quantile levels. This finding supports the hypothesis that REC has a long-run effect on energy import dependency by reducing it.
Table 7 suggests a negative and significant impact of GDP per capita on housing cost overburden rate for all quantile levels. A wealthier nation can allocate more resources to building affordable housing units or providing rental assistance programs. This increases housing supply and helps regulate prices. Gini index has a positive influence on housing cost overburden rate at the 65th, 75th, and 85th quantile levels, while the positive impact of HCI refer to quantile levels 45th, 55th, 65th, 75th, 85th, and 95th. It seems that in the long-run, in situations with high income inequality, wages for low- and middle-income earners may not keep pace with rising housing costs, particularly rents. This creates a situation where a growing portion of their income goes towards housing, leaving them struggling to afford other necessities. In the long-run, human capital improvement enhances housing cost overburden rate. If access to quality education and training is not equitable, the benefits of human capital improvement might not be evenly distributed. This highlights the importance of inclusive education policies.
Urban population has a negative effect for three quantile levels: 55th, 65th, 75th, 85th, and 95th. REC has a positive contribution for the 45th and 95th quantile levels, while FDI has no impact on housing cost overburden rate.
GDP per capita and urban population have a negative effect on total arrears on utility bills for all quantile levels excepting the 15th (
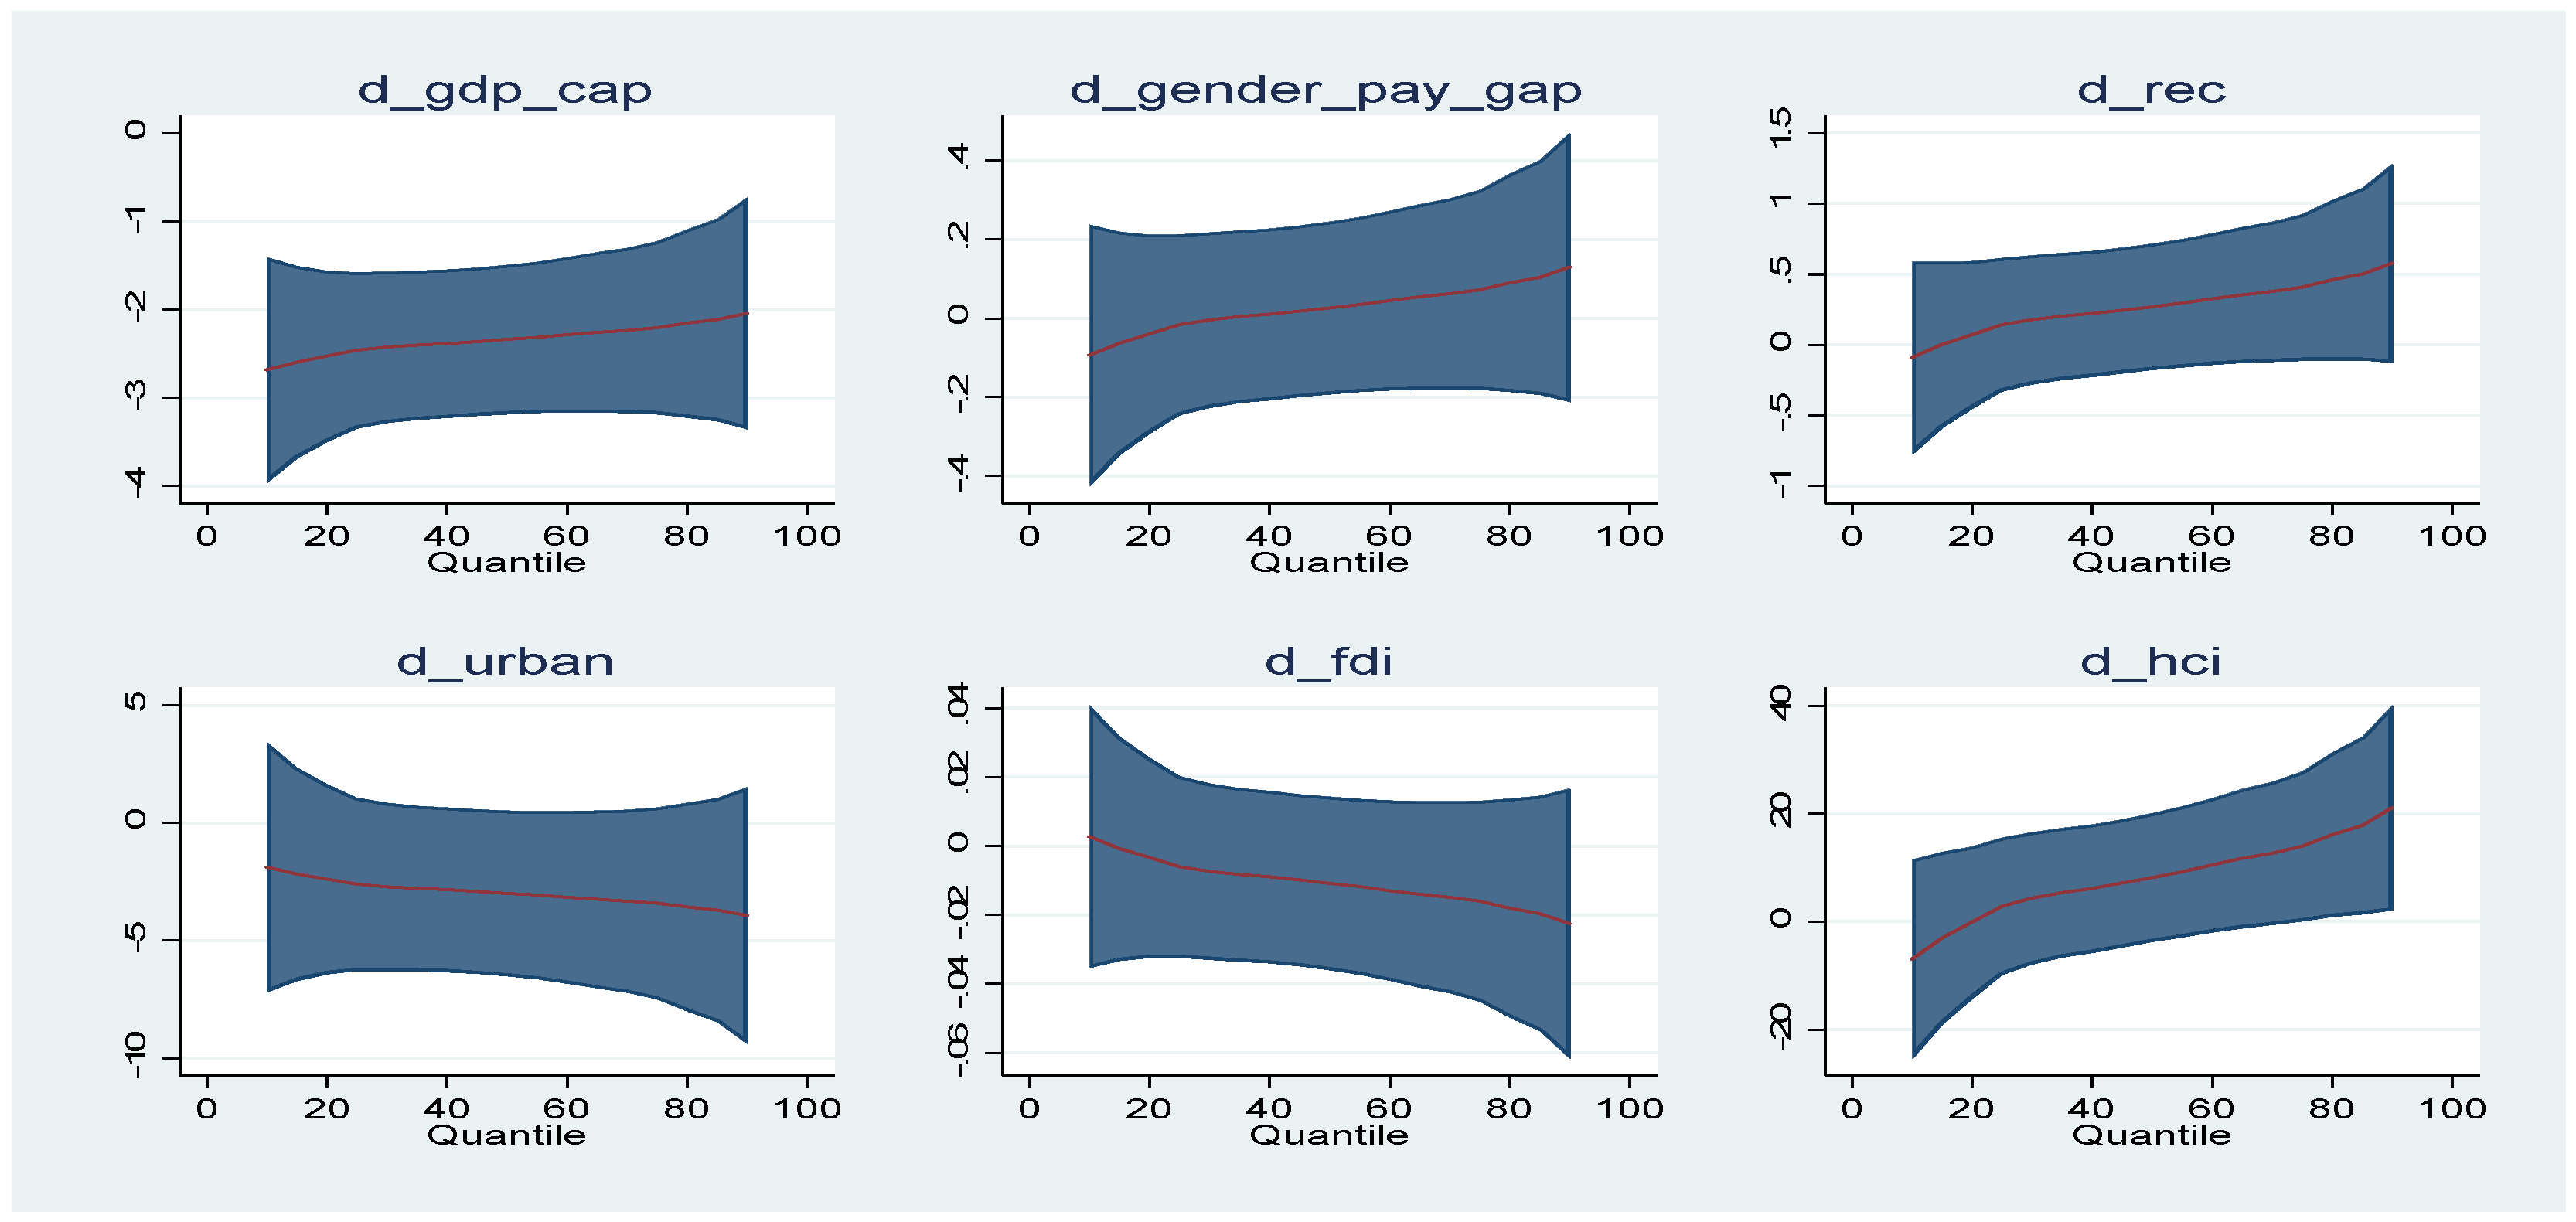
Table 8). The negative effect of HCI resumes only in the last five quantile levels. REC has a positive and significant impact on total arrears on utility bills for all quantile levels excepting the 75th. Gender pay gap growth significantly reduces the total arrears on utility bills. A stronger economy with overall wage growth, not just for women, could lead to more households being able to afford their utility bills, reducing total arrears. Effective government or social program initiatives that specifically target low-income households with assistance for utility bills can help reduce arrears.
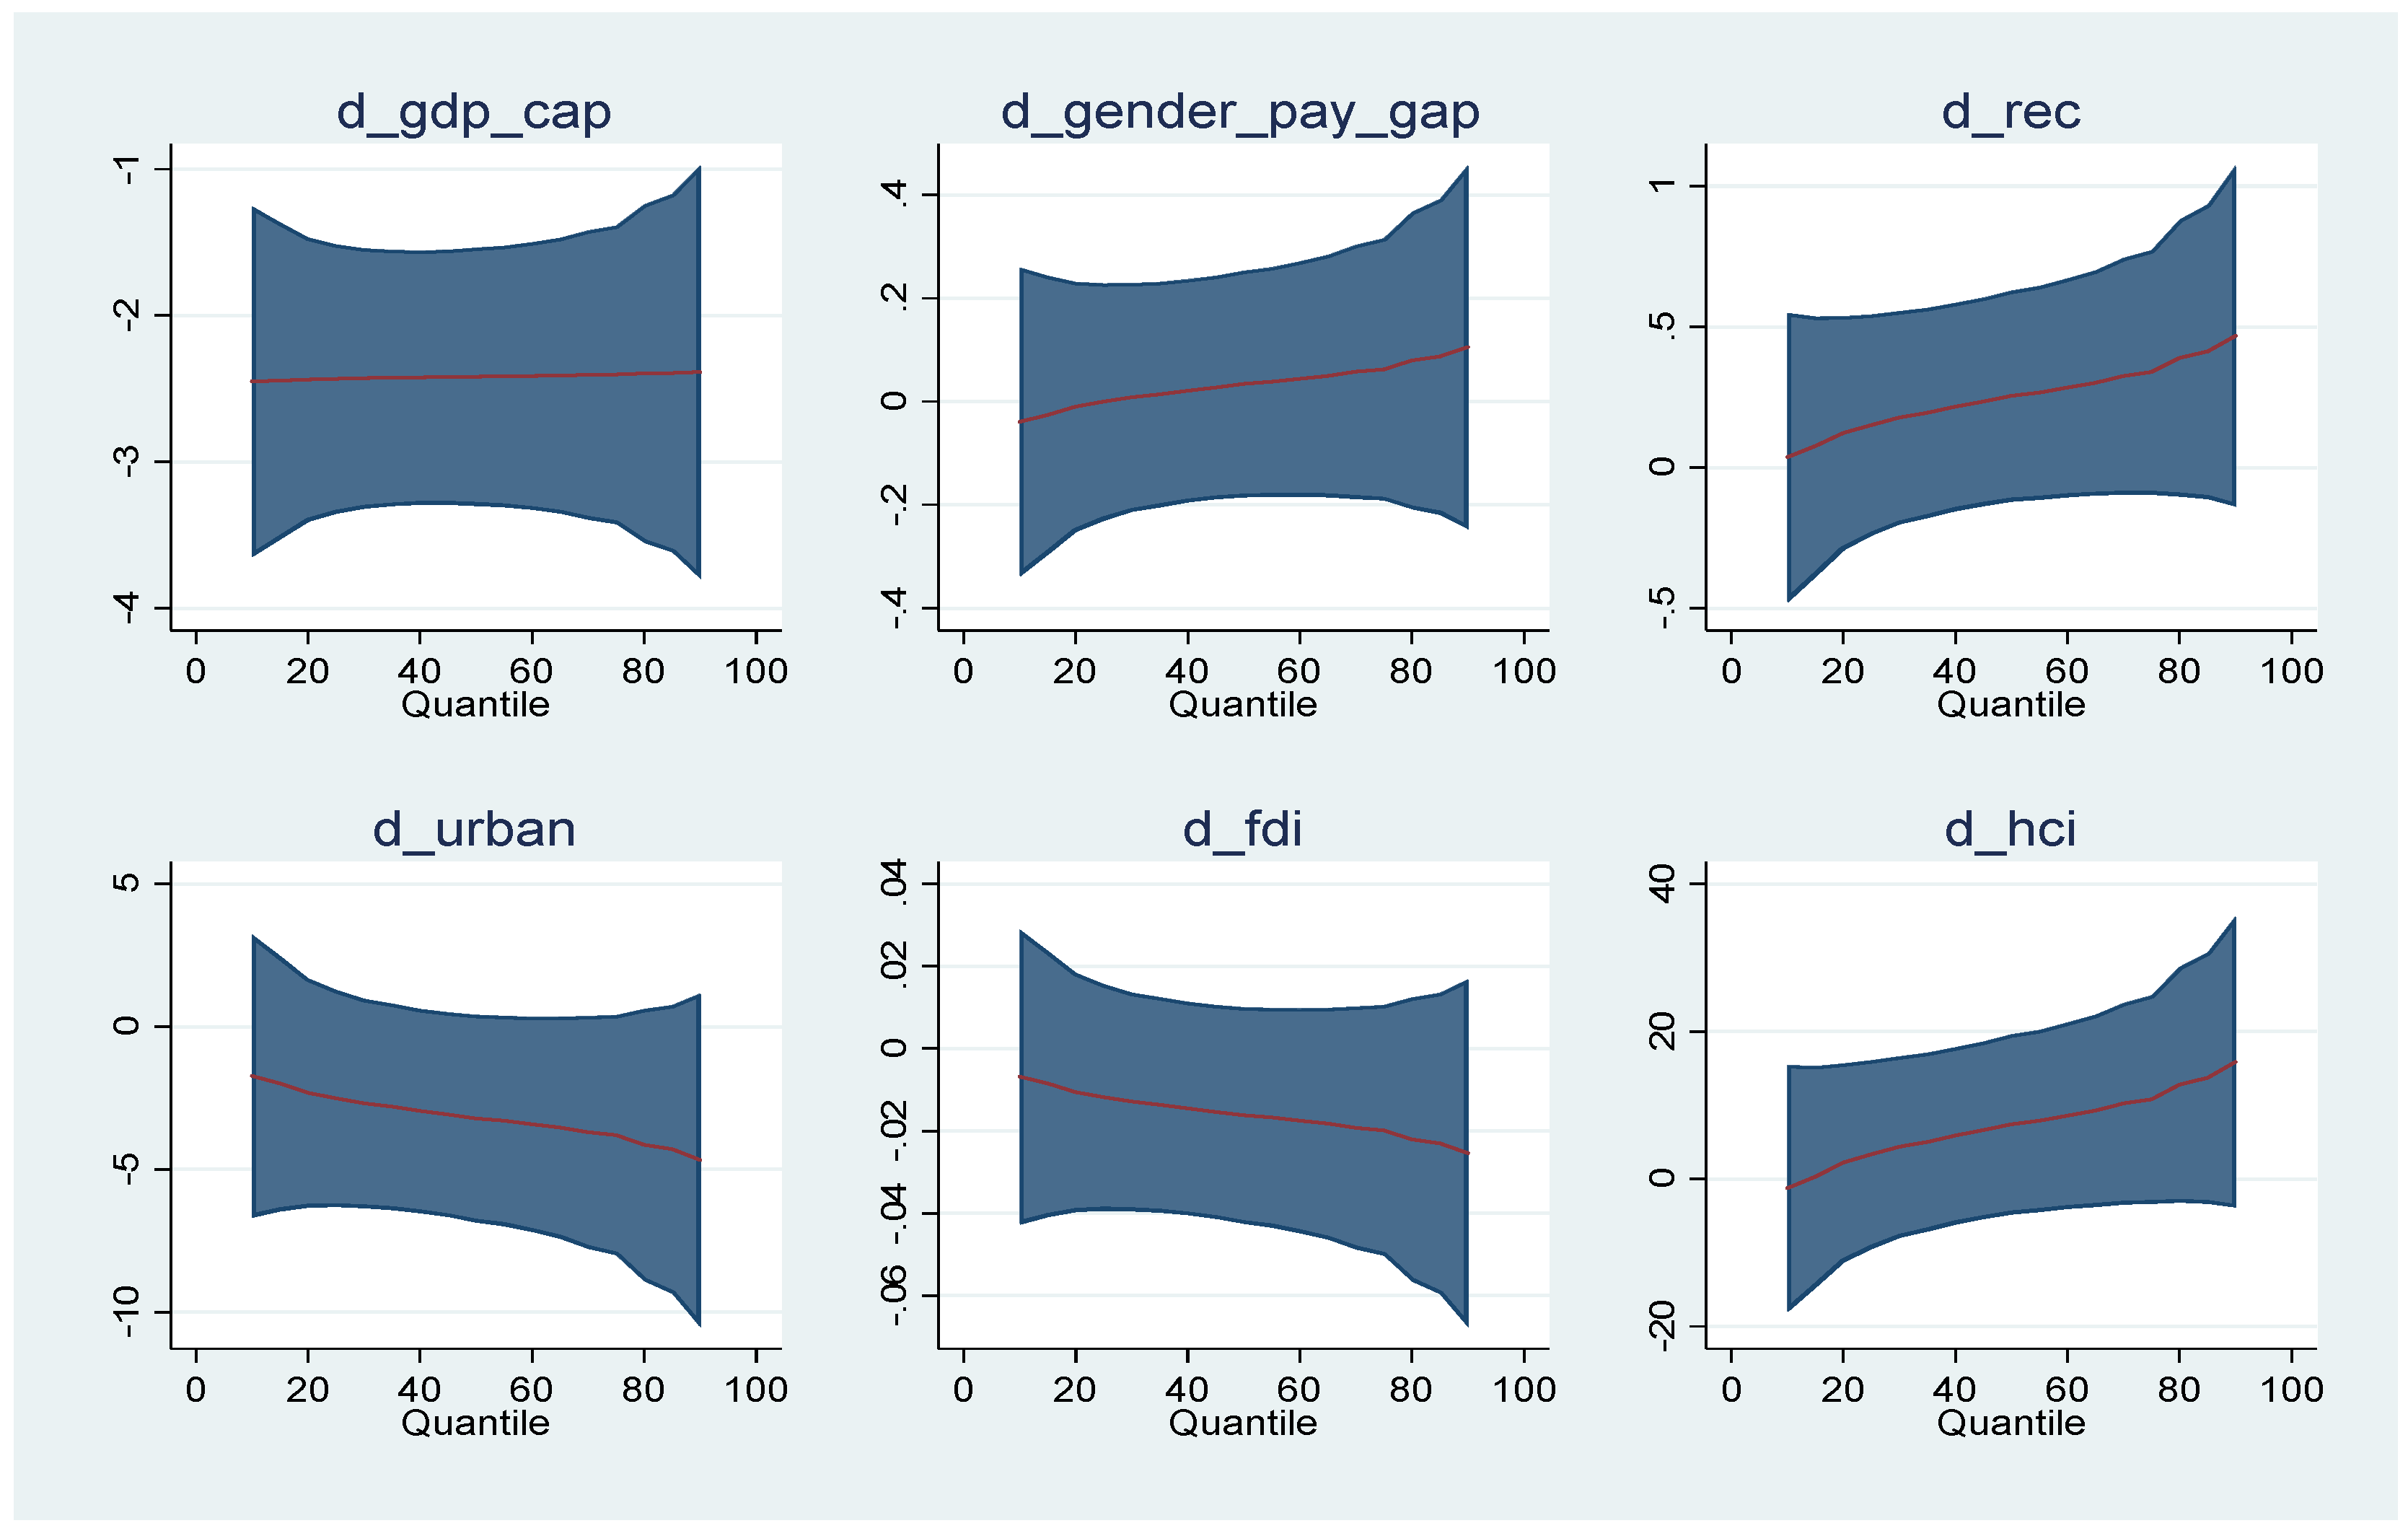
GDP per capita has a significant and negative impact on arrears on utility bills for households with dependent children for all quantiles excepting the 75th and 85th. Gender pay gap has a negative effect on total arrears on utility bills for households with dependent children for all quantile levels (
Table 9), while urban population has a negative effect for all levels excepting the 15th and 25th quantile levels. The negative and significant effect of HCI refers to the six quantile levels. REC has a positive and significant impact on total arrears on utility bills for households with dependent children for all quantile levels excepting the 15th.
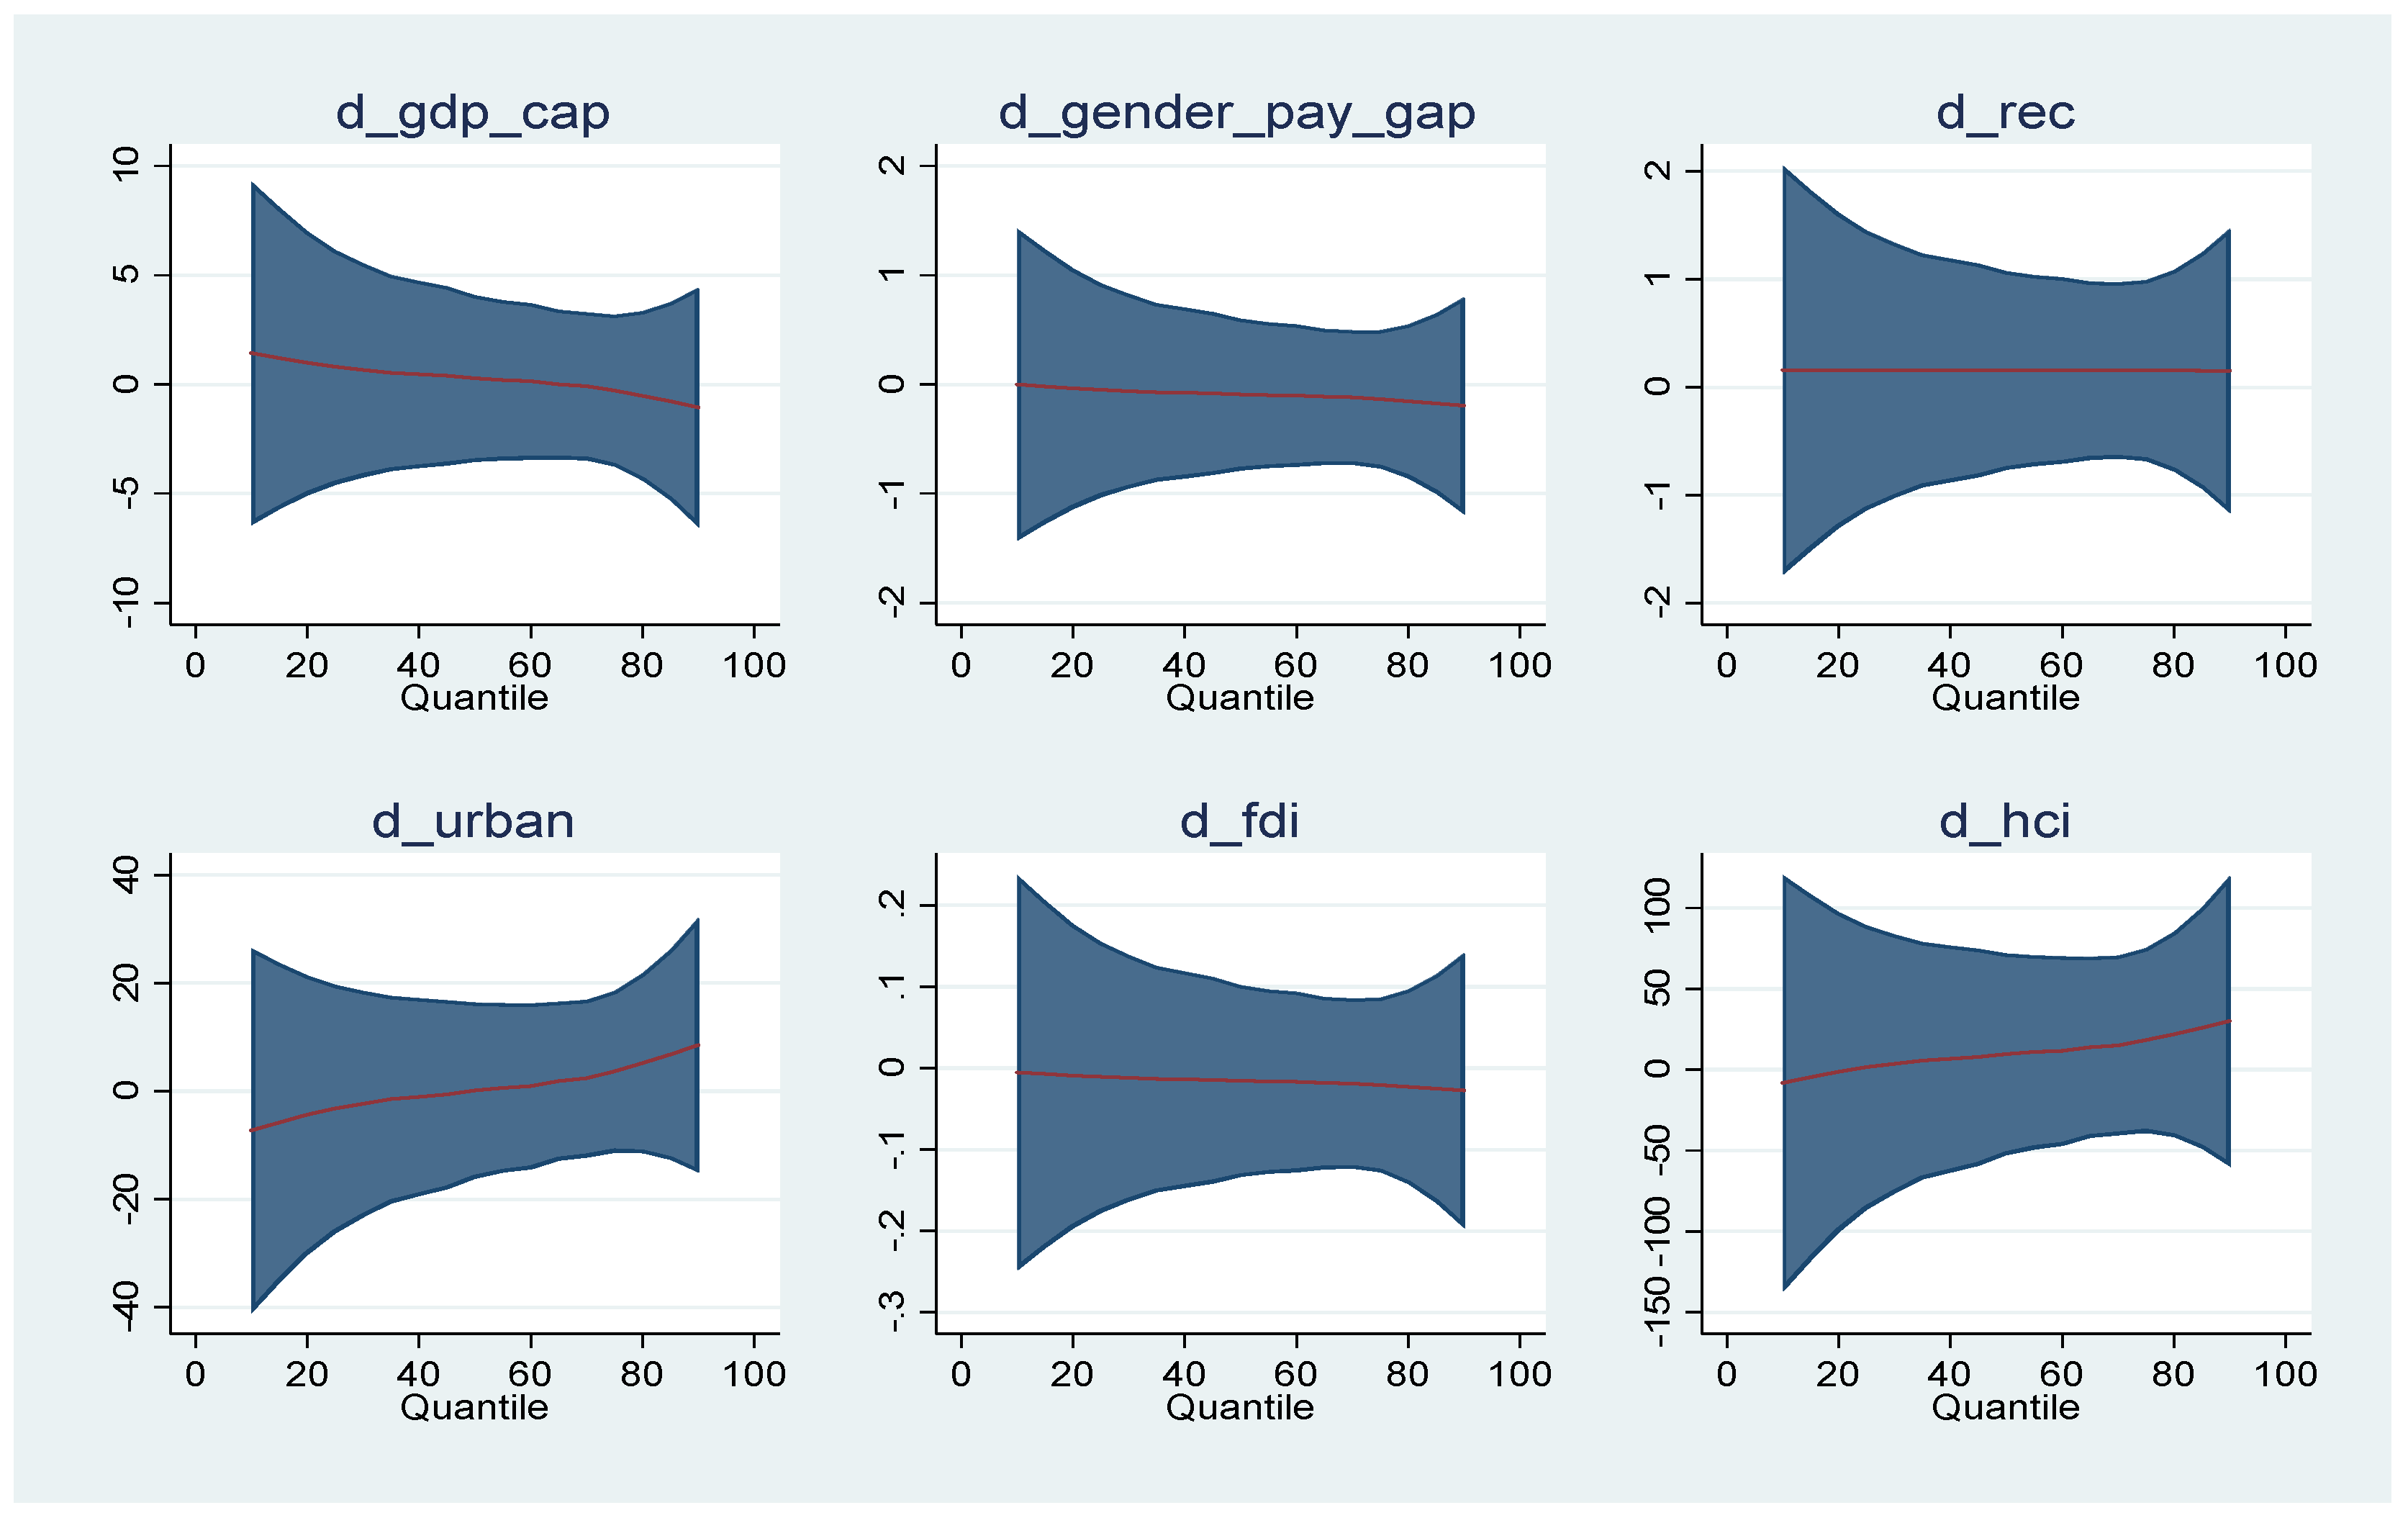
The negative influence of gender pay gap on population unable to keep home adequately warm reduces in time and becomes non-significant for the 65th and 75th quantile levels (
Table 10). GDP per capita has a negative and significant impact on population unable to keep home adequately warm for all quantile levels, excepting the last two. The negative impact of HCI is significant for all quantiles. FDI negative effect reduces to the 15th, 25th, and 35th quantiles. Urban population has a positive and significant impact on population unable to keep home adequately warm at 15th and 25th quantiles and a negative one at the 95th quantile level. Urban areas often have higher energy costs due to factors like denser populations placing a greater strain on infrastructure and potentially higher fuel costs for heating/cooling. This can make it harder for low-income households to afford adequate heating, especially in cold climates.
REC has a significant and negative impact on energy imports dependence. Renewable sources like solar, wind, geothermal, and hydropower generate electricity within a country’s borders. This reduces the need to import fossil fuels like coal, oil, and natural gas for electricity generation.
The negative influence of HCI is significant for all quantiles excepting the 95th. A skilled workforce can drive innovation in the energy sector. This could lead to the development of new renewable energy technologies, more efficient energy production methods, and better energy management practices. These advancements can reduce a country’s overall energy needs and potentially decrease its dependence on imports.
Urban population has a significant and negative influence only for the 55th, 65th, 75th, and 85th quantiles. GDP per capita exerts a negative influence on this indicator only starting with the 55th quantile level, while gender pay gap has no impact on energy imports dependence (
Table 11).
HCI has a positive influence on housing cost overburden rate starting with the 55th quantile level, while the positive influence of REC is observed for the 45th, 55th, 65th, and 75th quantiles (
Table 12). GDP per capita exerts a negative impact on housing cost overburden rate for all quantiles, while urban population negative influence is observed for the 45th, 55th, 65th, 75th, 85th, and 95th quantile levels. Cities often have limited space for new construction, especially compared to the influx of people seeking jobs and opportunities. This creates a situation where demand for housing outpaces supply, pushing prices upwards.
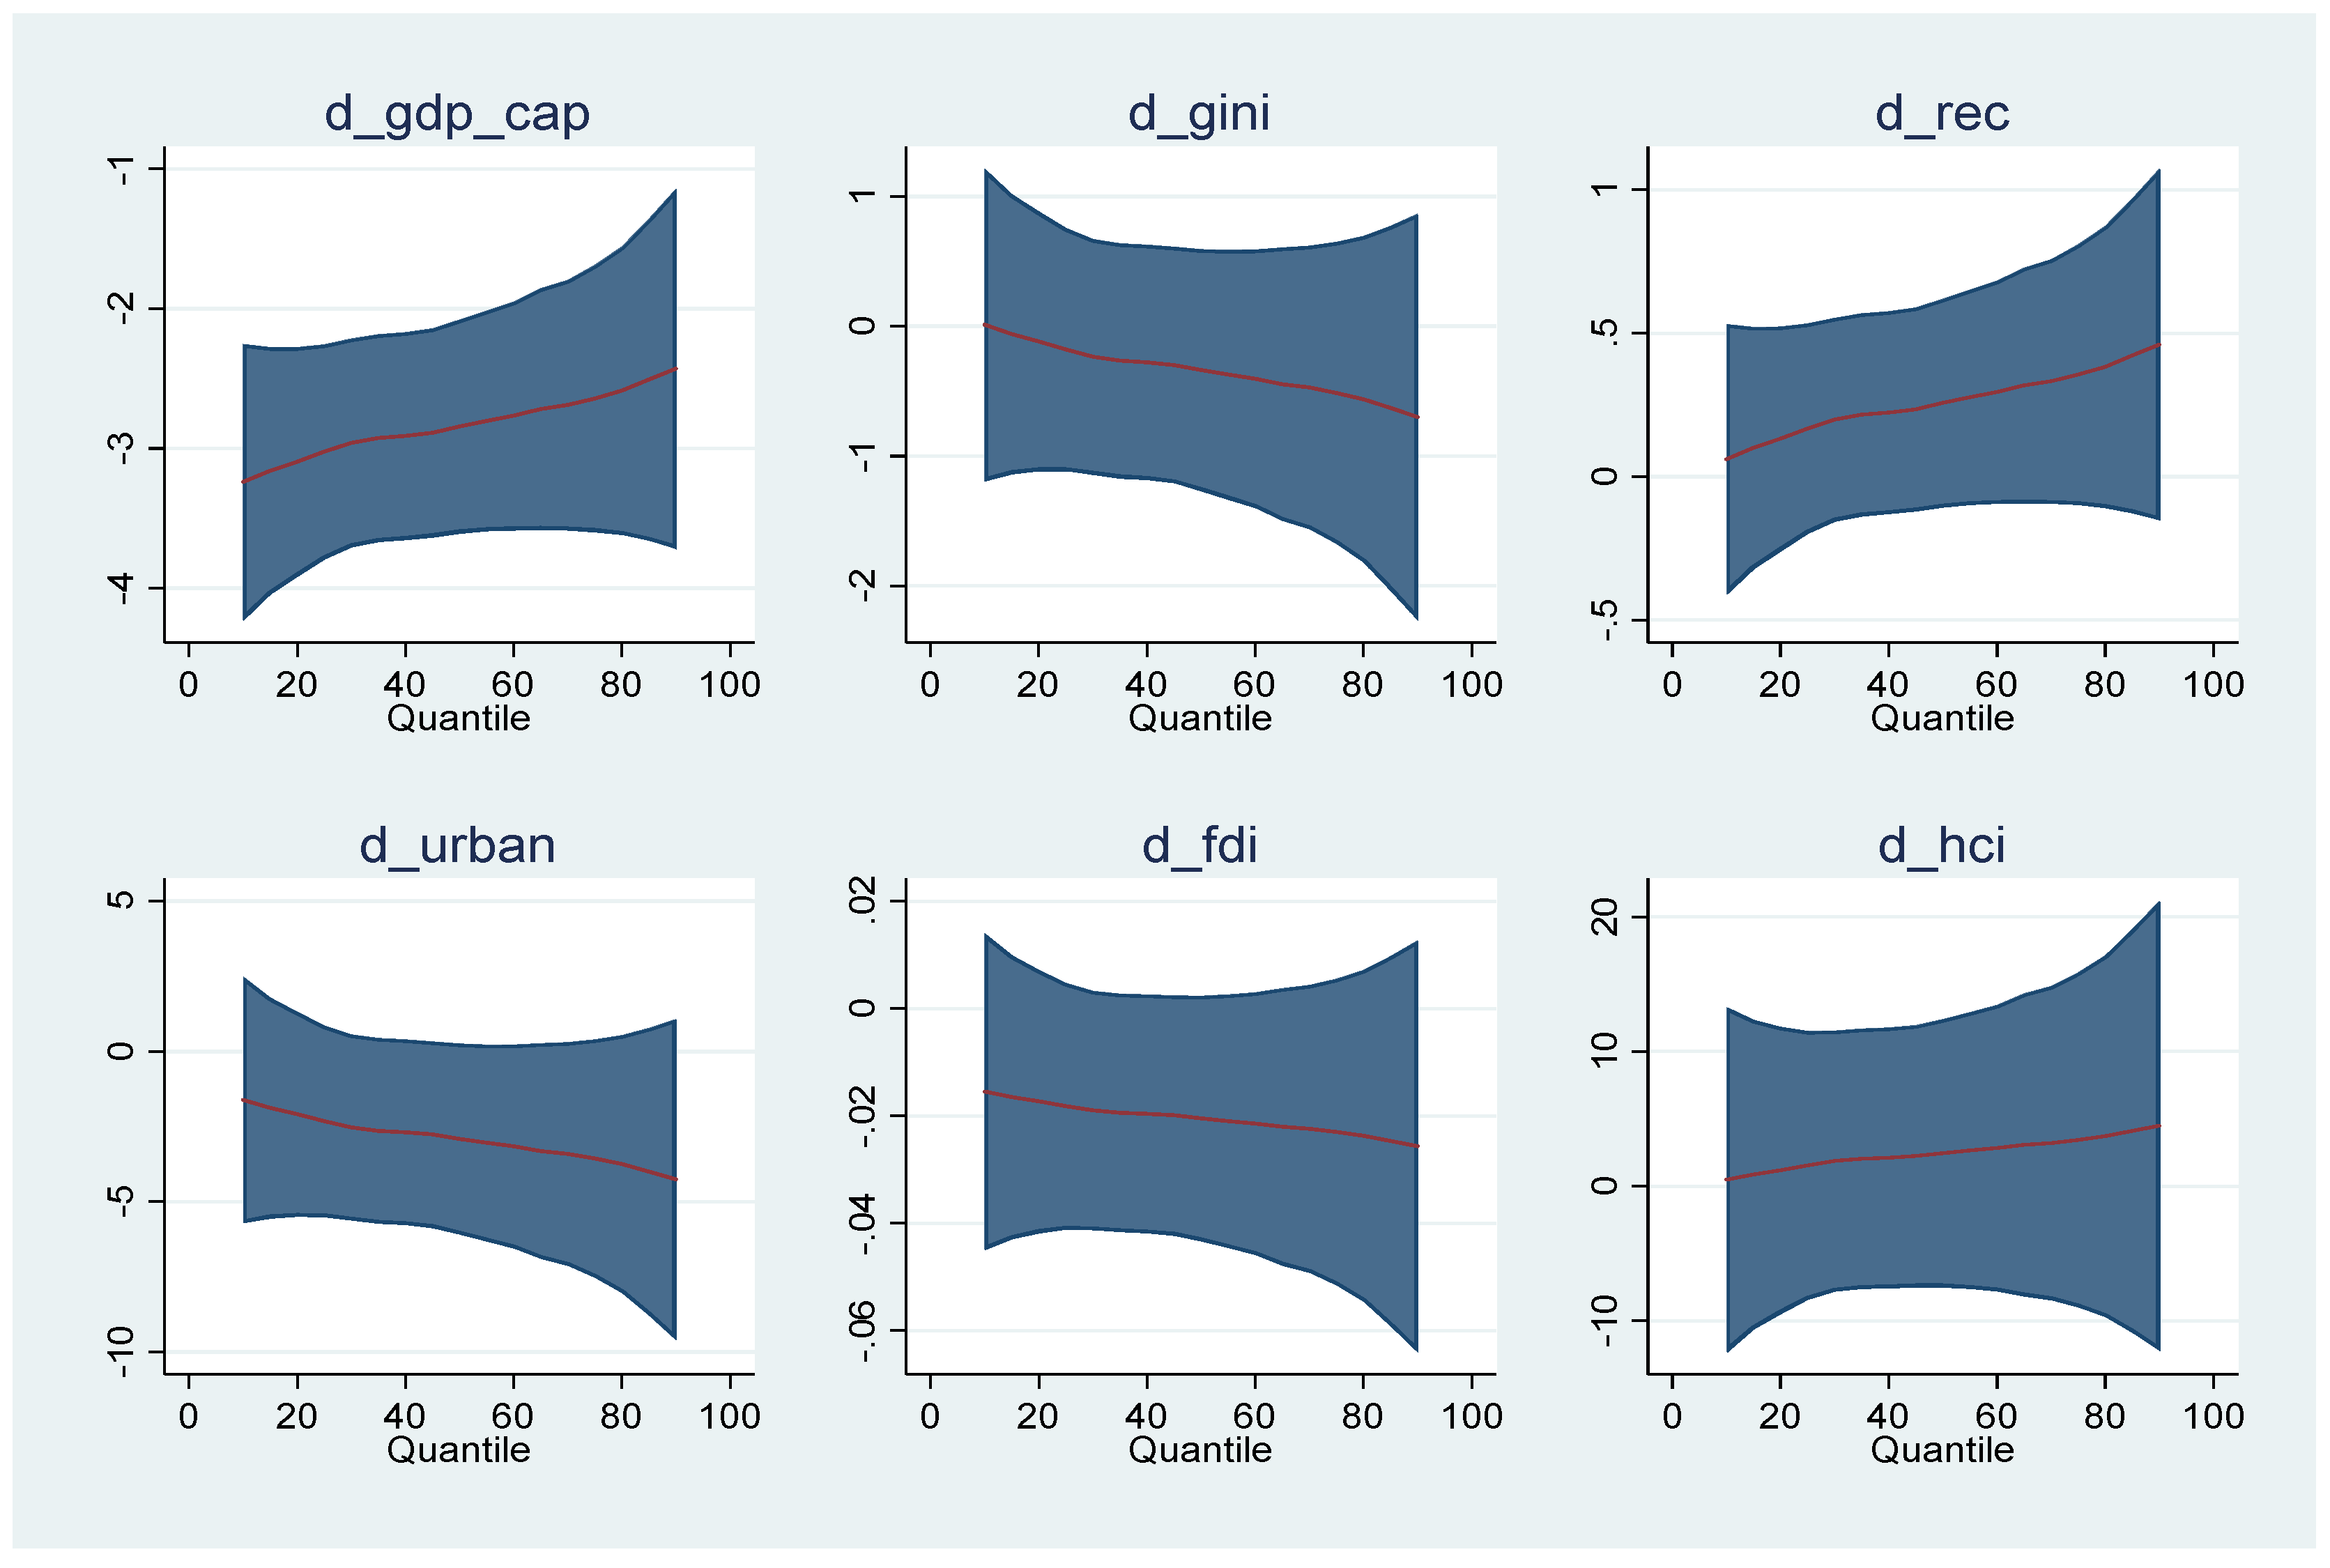
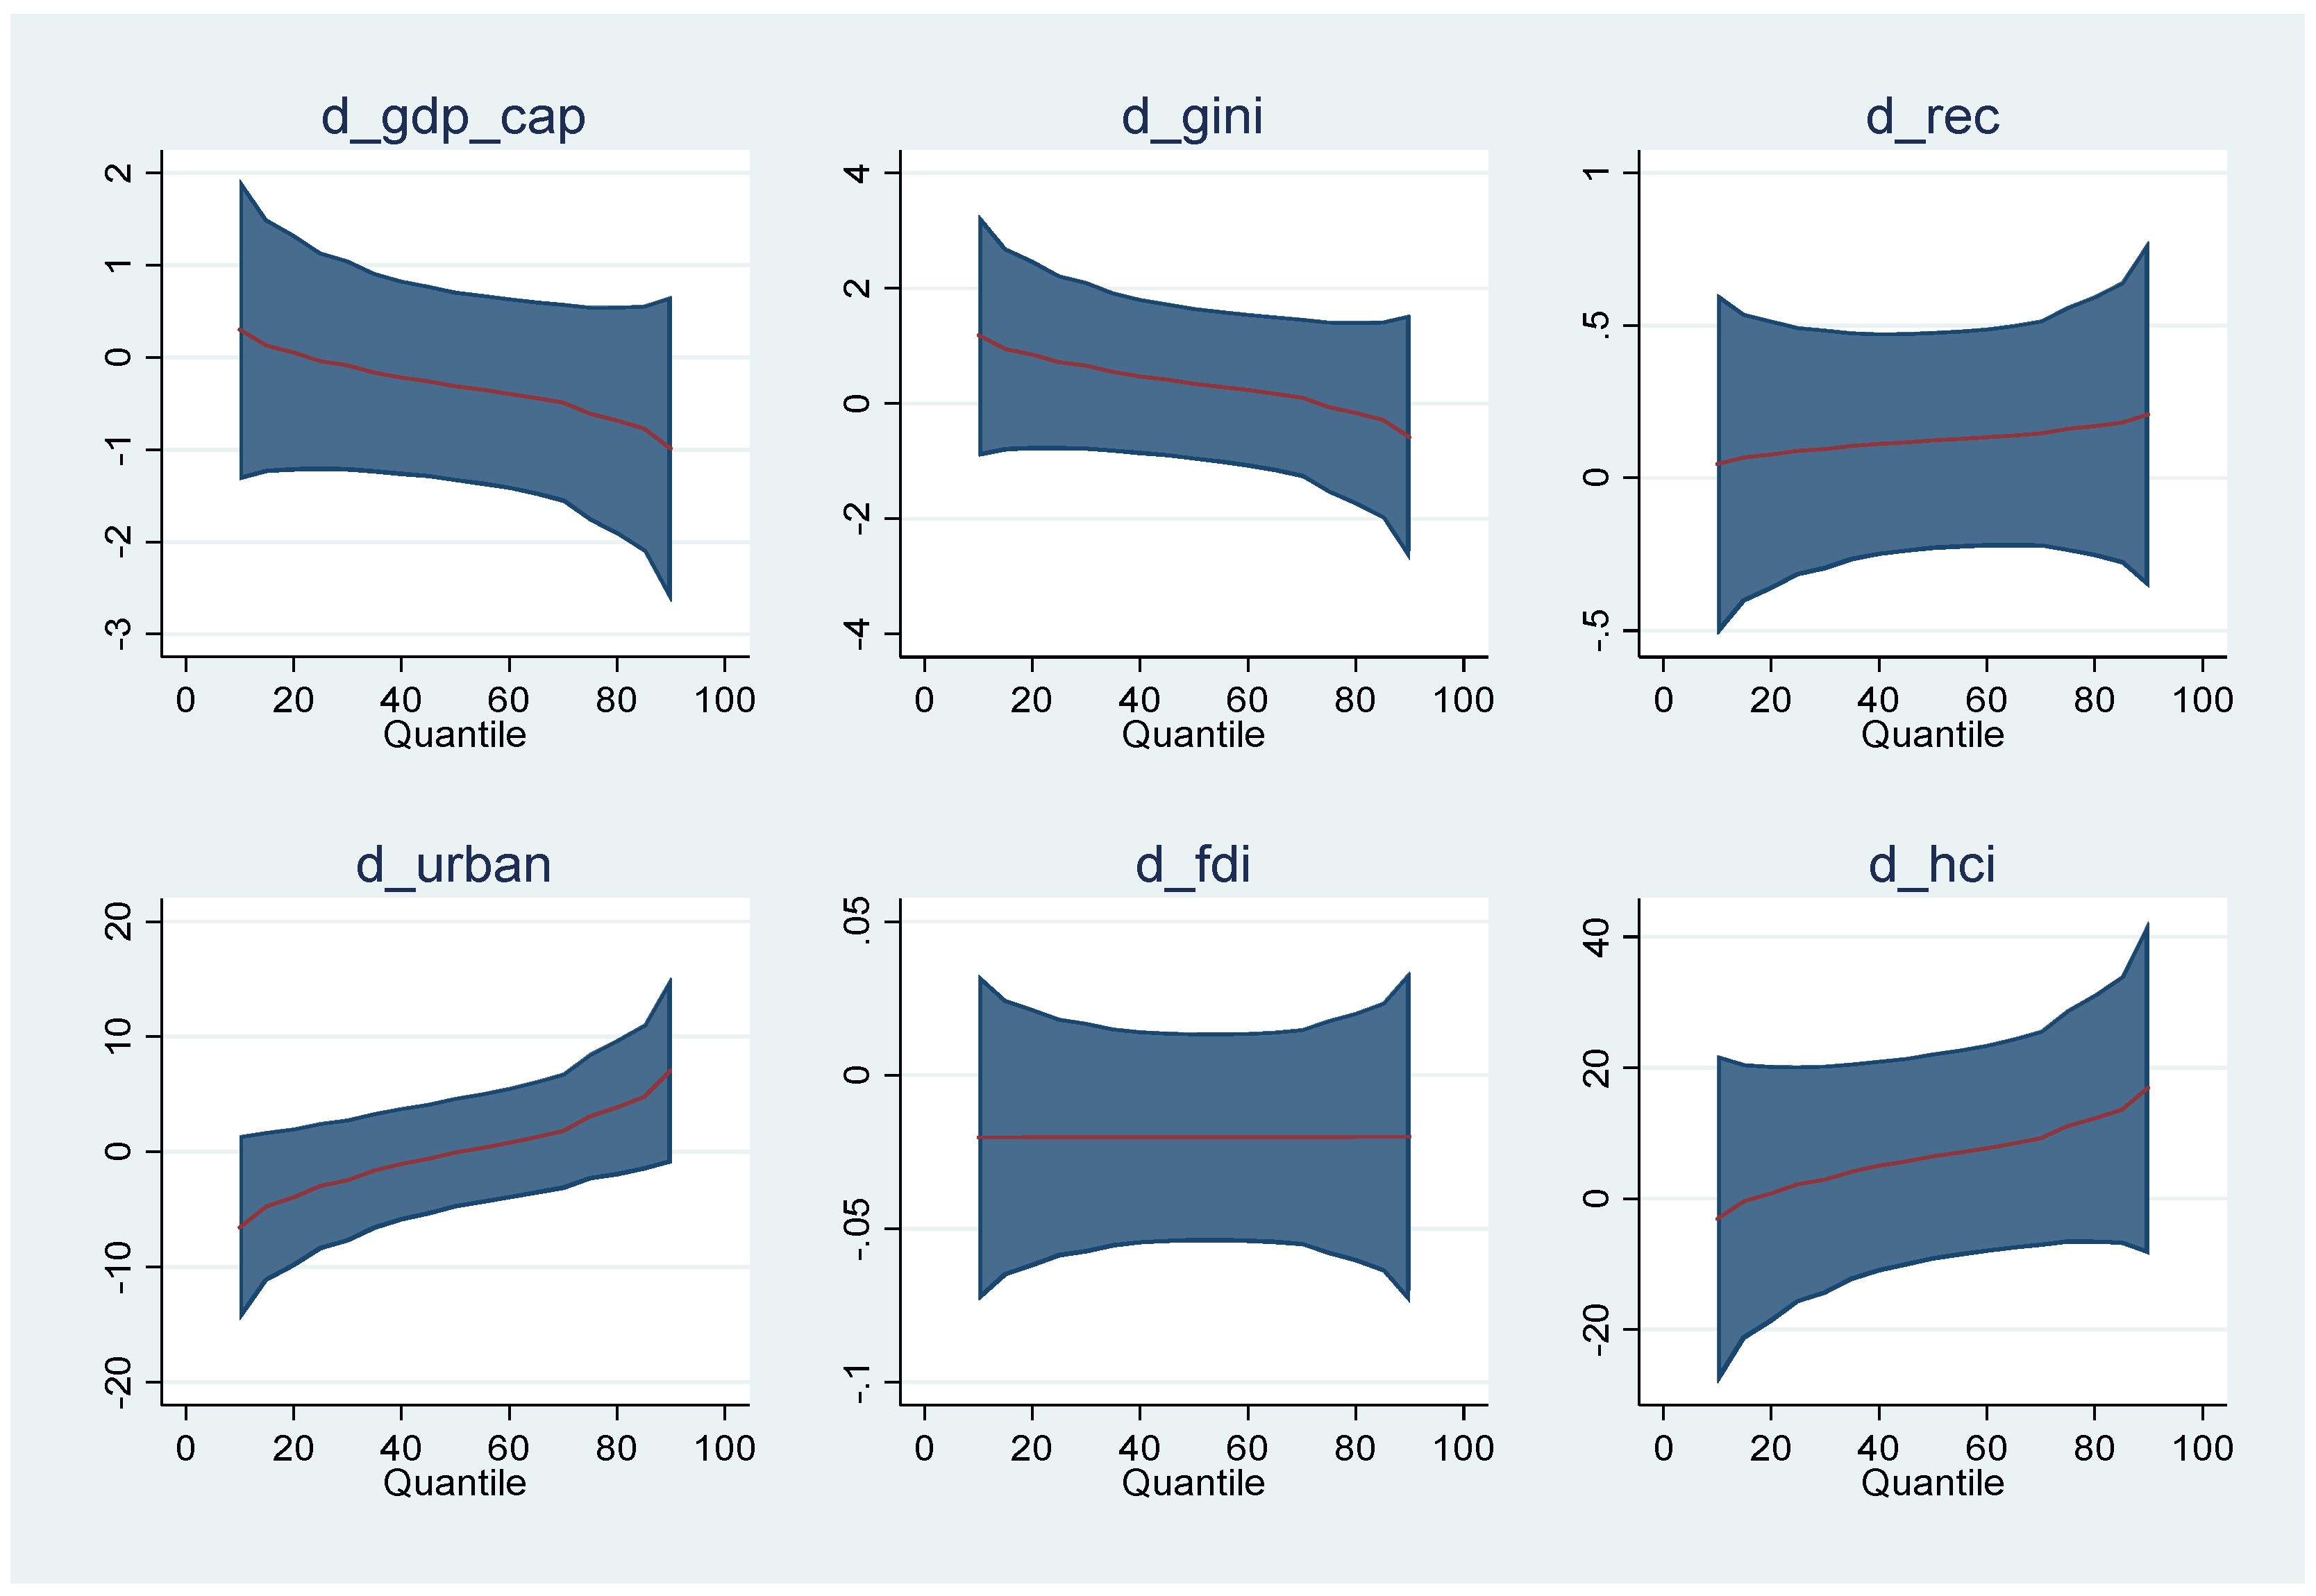
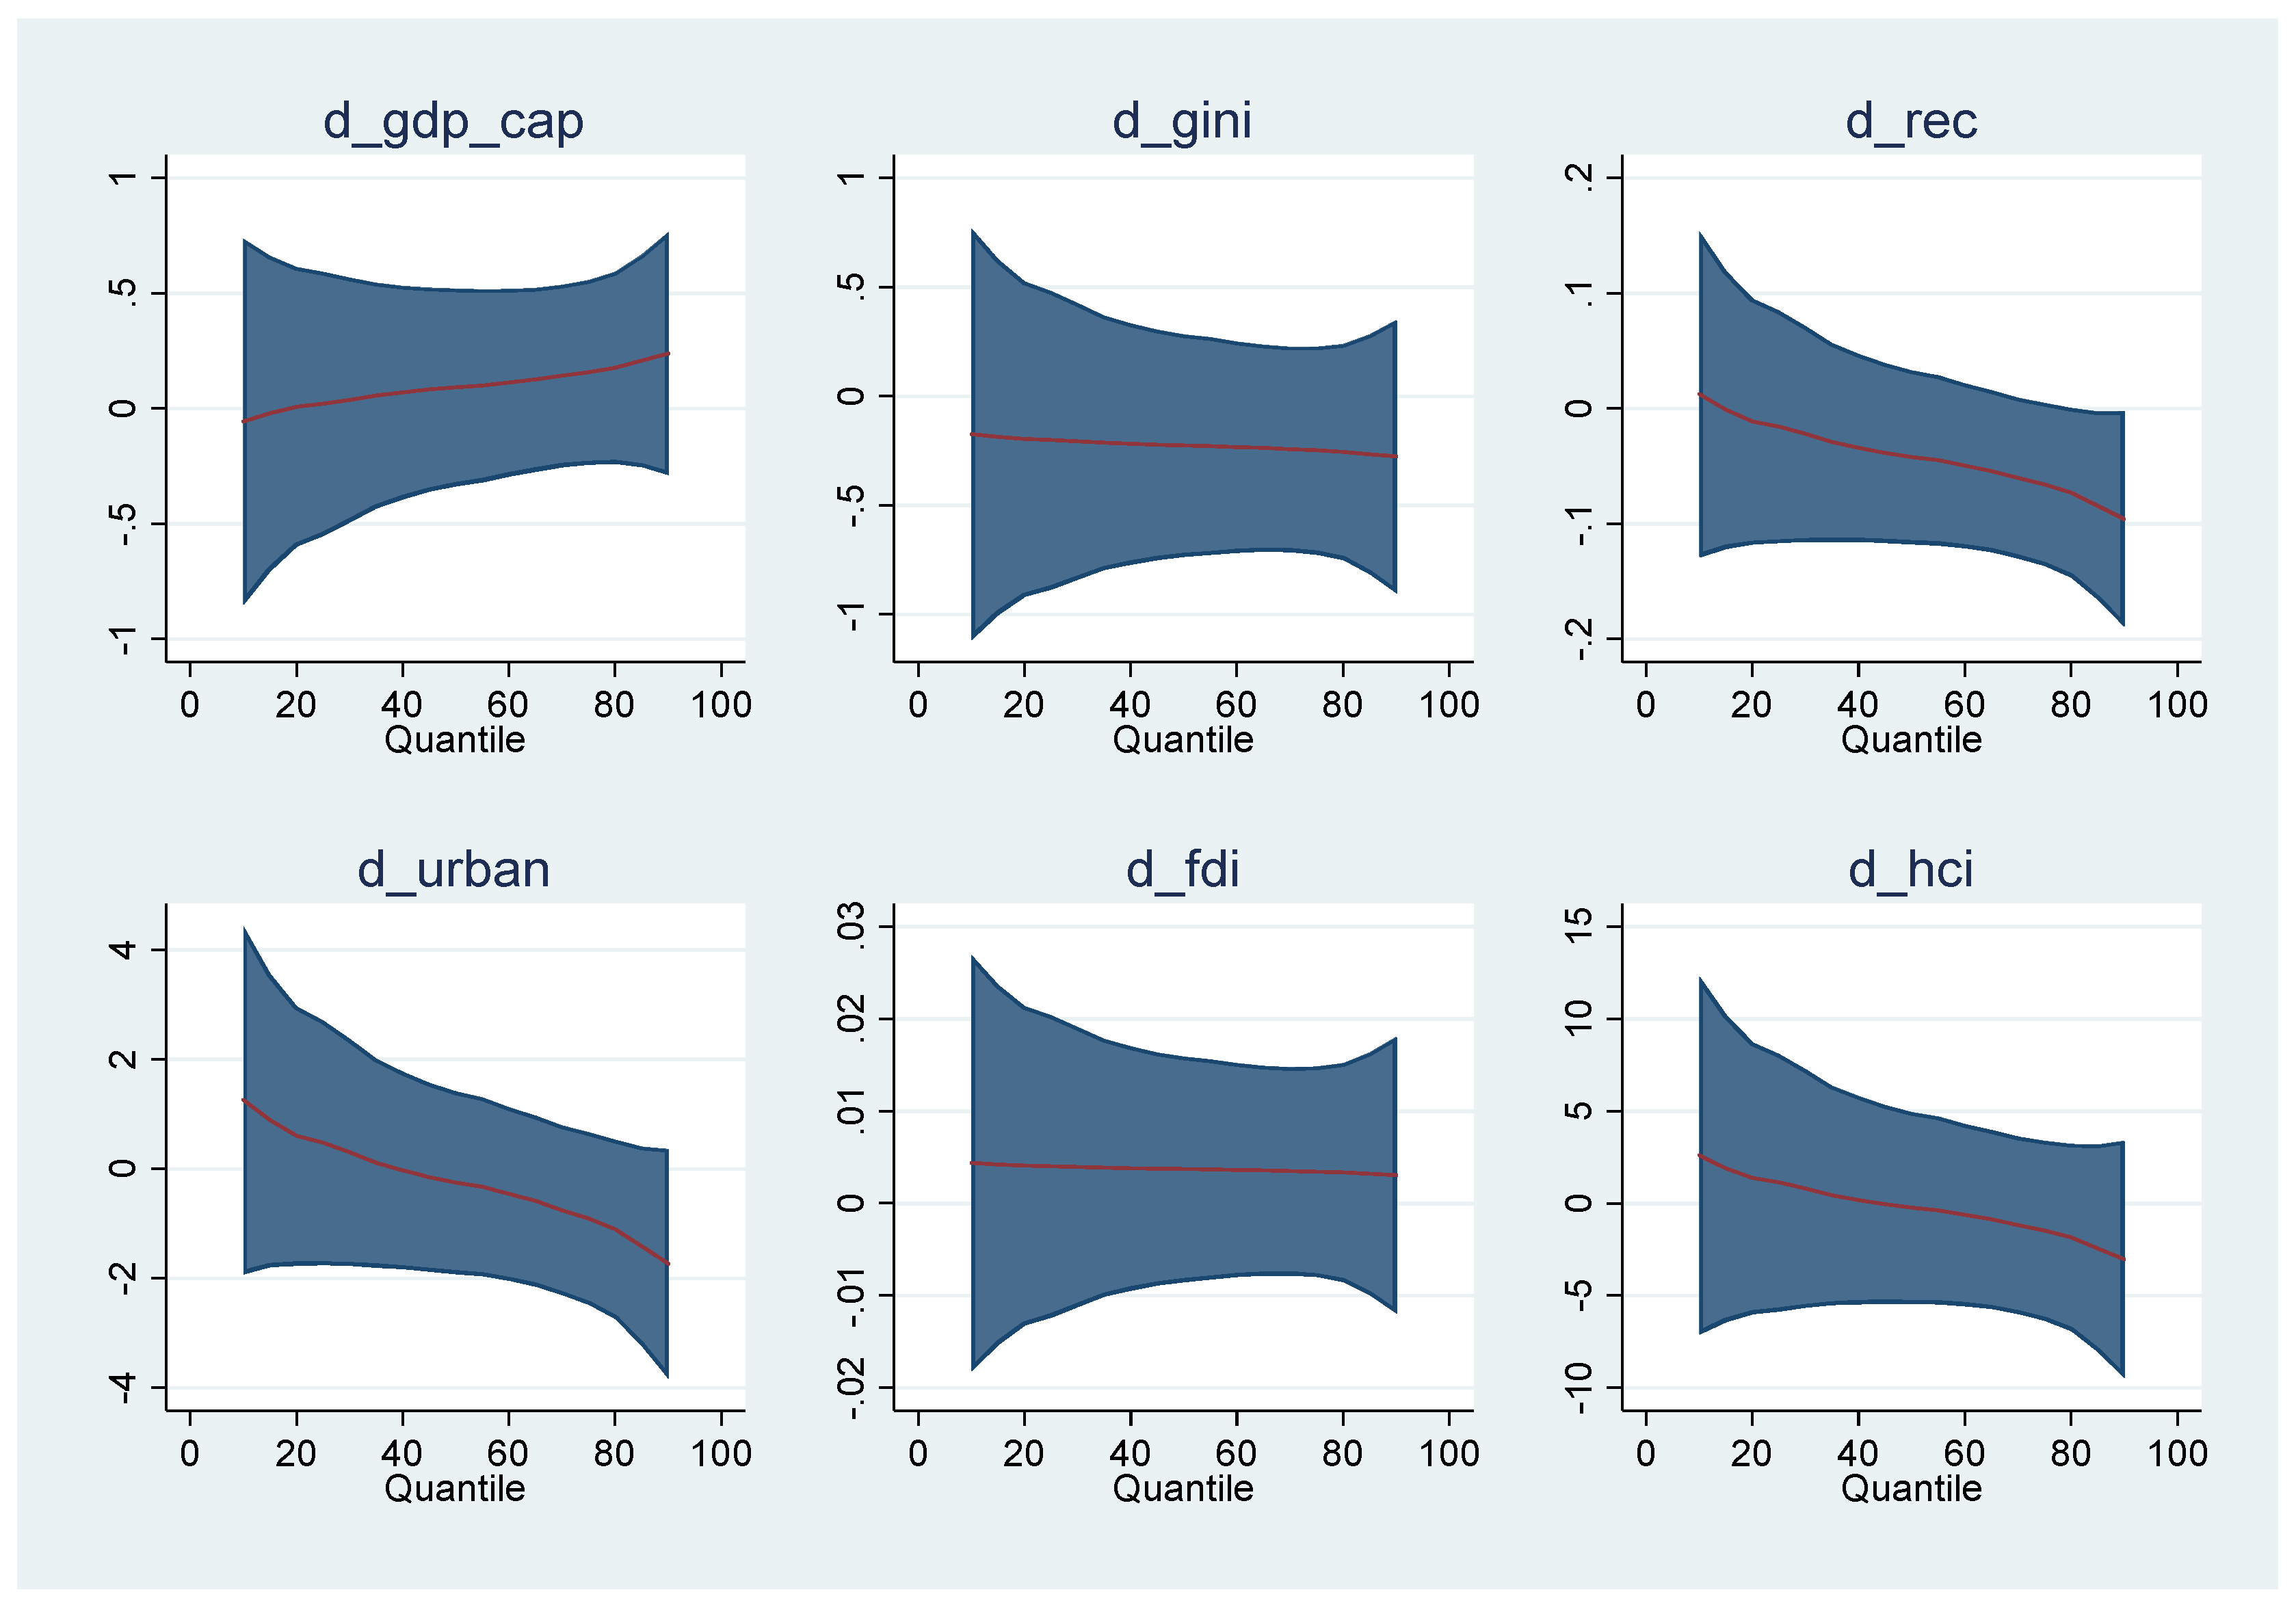
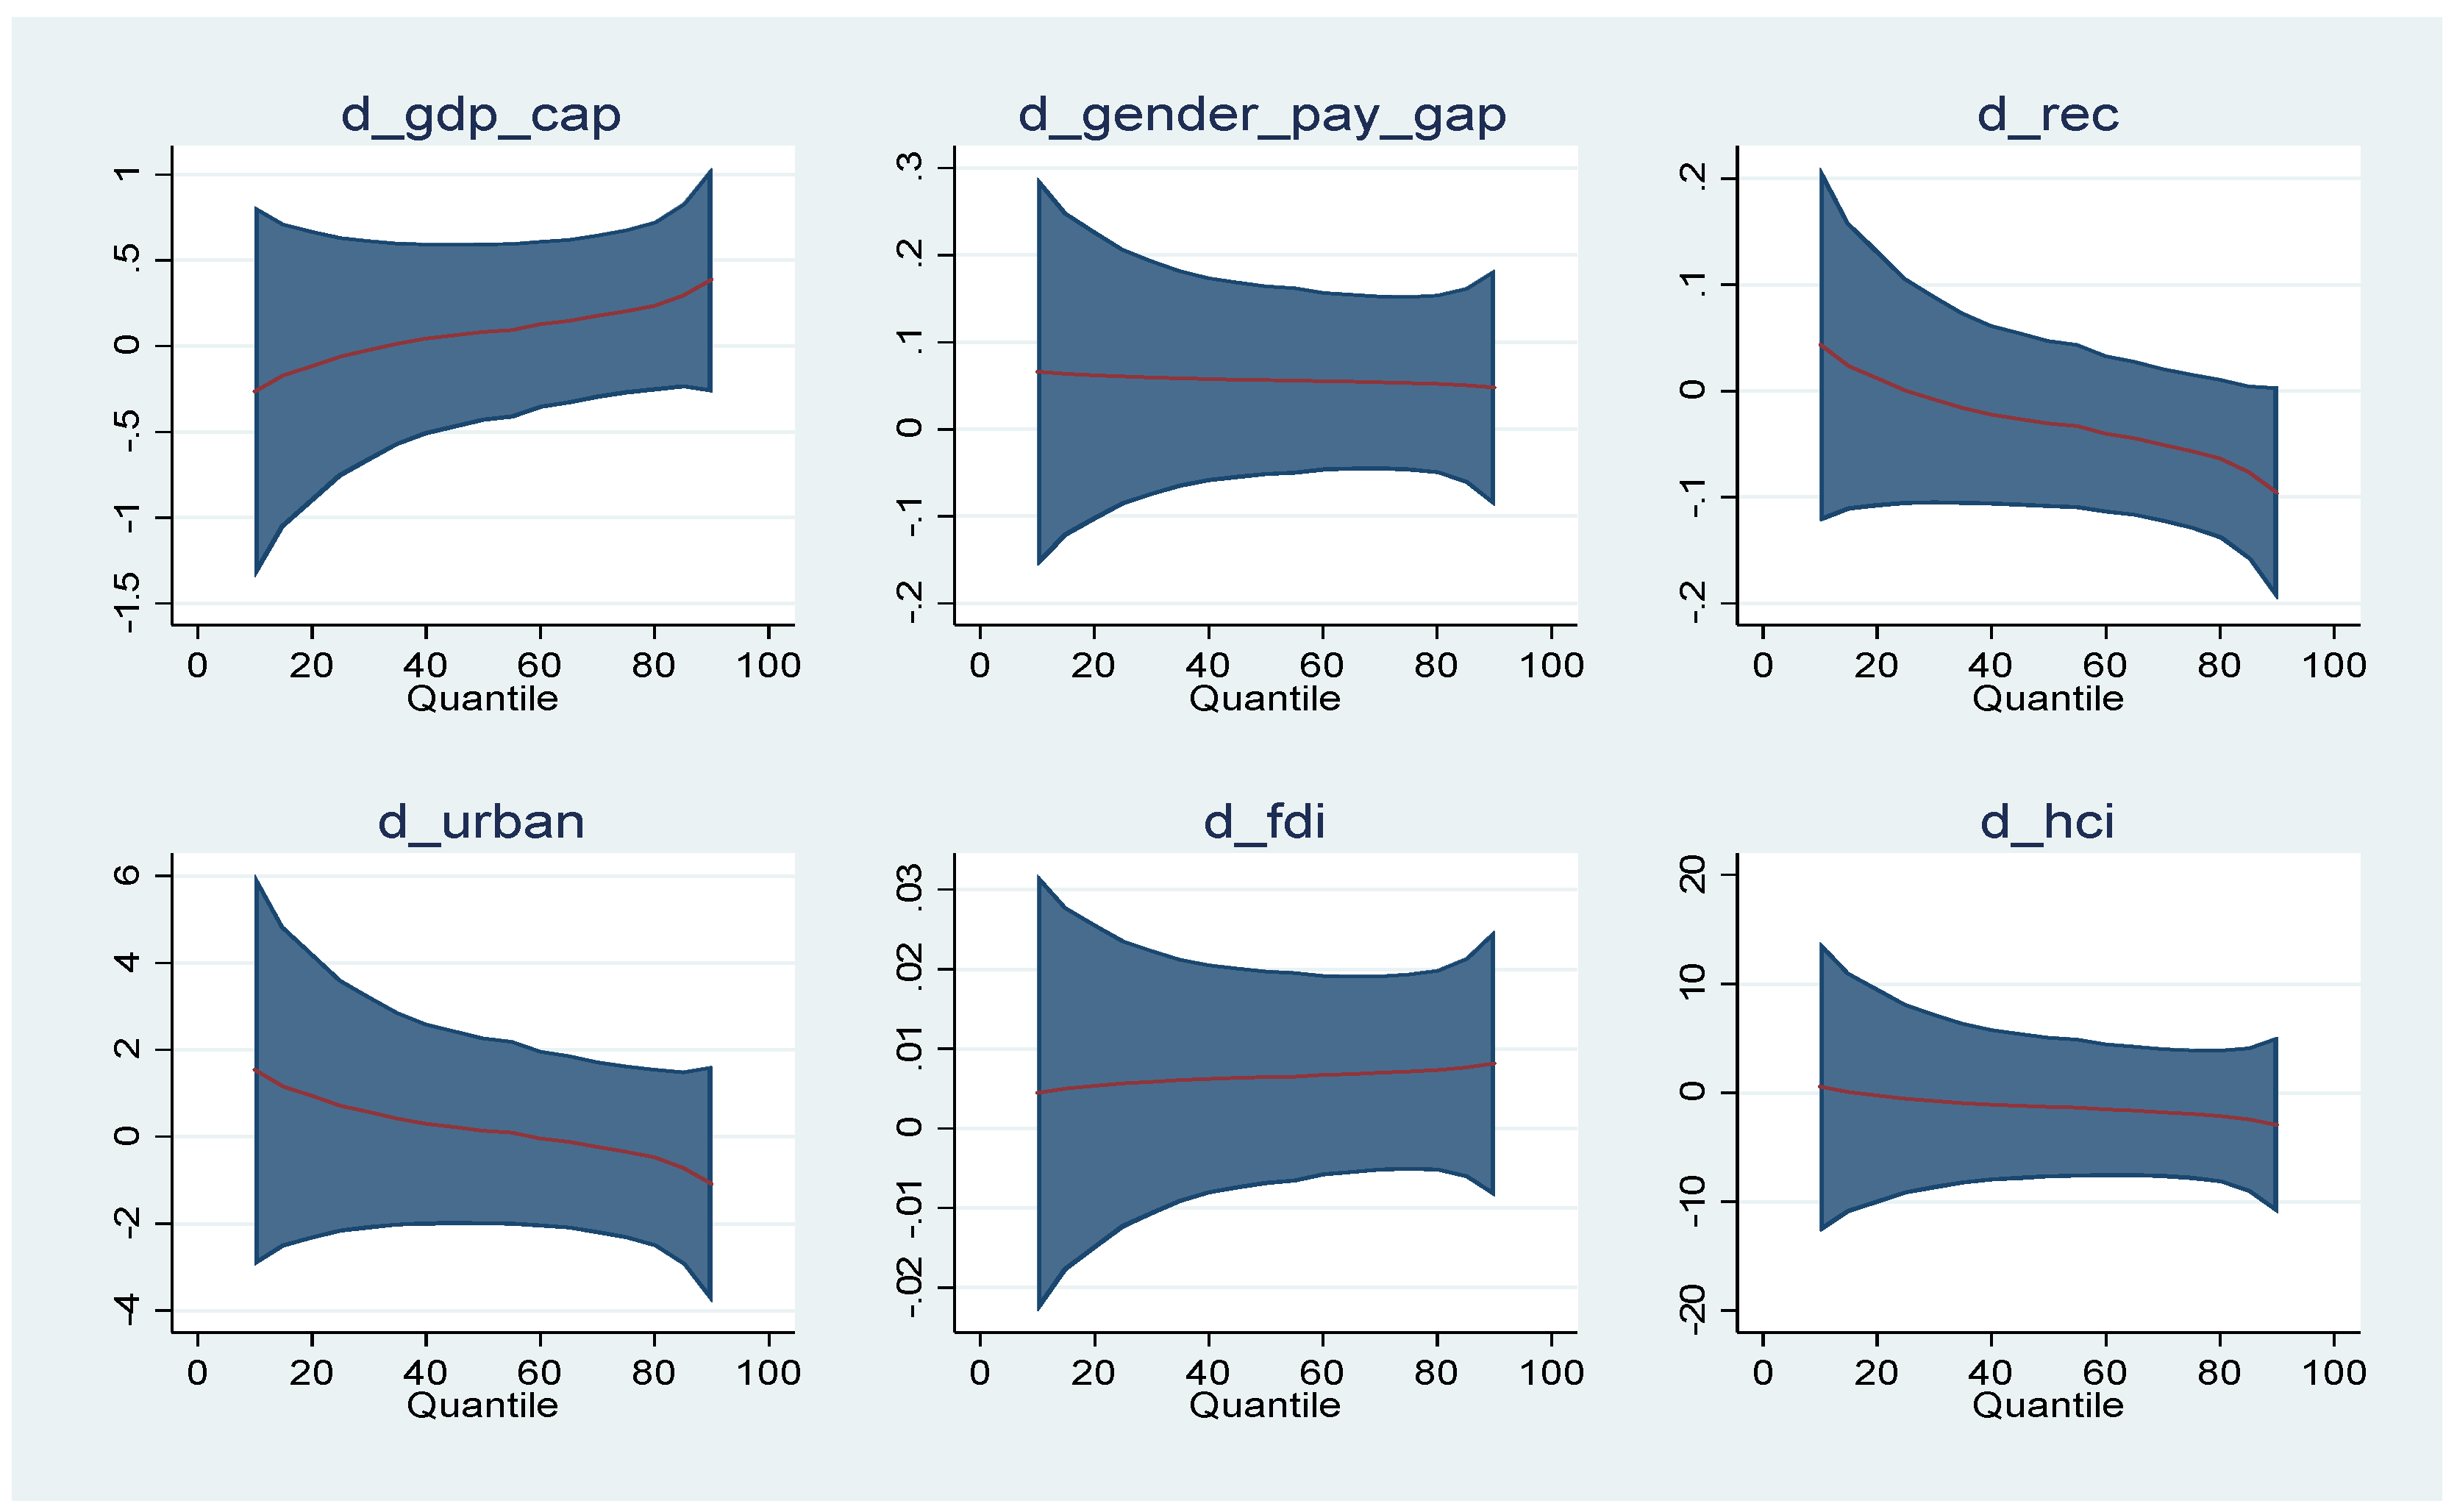
Figures associated to all MMQ regression models are presented in the
Appendix A of this paper.
4.3. Robustness Check
The approach based on MG estimator that tackles endogeneity partially confirms the previous results, as
Table 13 indicates. GDP per capita has a significant and negative impact on total arrears on utility bills, arrears on utility bills for households with dependent children, and housing cost overburden rate. Gini index has positive effect on total arrears on utility bills, arrears on utility bills for households with dependent children and population unable to keep home adequately warm, and negative effect on energy imports dependence. More REC reduces population unable to keep home adequately warm and energy imports dependence. Urban population has a significant and negative impact on all EP indicators. FDI reduces total arrears on utility bills, arrears on utility bills for households with dependent children, and population unable to keep home adequately warm, but increases housing cost overburden rate. HCI has positive impact on housing cost overburden rate and negative effect on population unable to keep home adequately warm and energy imports dependence.
According to
Table 14, GDP per capita and gender pay gap have a negative and significant impact on total arrears on utility bills, arrears on utility bills for households with dependent children, population unable to keep home adequately warm, and housing cost overburden rate. REC enhances total arrears on utility bills, arrears on utility bills for households with dependent children, and housing cost overburden rate, but it reduces population unable to keep home adequately warm and energy imports dependence. Urban population has a negative and significant impact on all EP indicators excepting population unable to keep home adequately warm.
Lower GDP and wider gender pay gap make it harder for people to afford utilities and housing, leading to higher arrears and energy insecurity. While REC helps with energy independence and keeping homes warm, it can put a strain on household budgets in the short term. People in urban areas are generally better off regarding keeping homes warm but might face higher overall energy costs.
FDI reduces population unable to keep home adequately warm and energy imports dependence, but enhances housing cost overburden rate. HCI has an indirect and significant impact on total arrears on utility bills, arrears on utility bills for households with dependent children, population unable to keep home adequately warm, and energy imports dependence. However, HCI is positively correlated with housing cost overburden rate.
FDI might take the form of technologies or resources that improve energy efficiency in homes or promote access to cleaner, more affordable heating solutions. It could also lead to a more diverse energy mix, reducing reliance on expensive imports. Conversely, FDI enhances housing cost overburden rate. This could be because FDI might be driving economic activity and increasing wages, which is a good thing. However, it can also lead to a rise in housing prices, making it harder for people to afford housing even with higher incomes.
A higher HCI likely leads to better jobs and higher incomes. This can indirectly help people afford utilities, improve energy efficiency through knowledge, and potentially even advocate for better energy policies. Similar to FDI, a higher HCI can lead to economic growth and higher wages. While this is positive overall, it can also contribute to rising housing costs, putting a strain on household budgets despite increased income.
5. Discussion and Policy Implications
Different explanatory variables exhibit a heterogeneous effect across different EP indicators, i.e., total arrears on utility bills, arrears on utility bills–households with dependent children, population unable to keep home adequately warm, energy imports dependency, and housing cost overburden rate. GDP per capita exerts a negative impact on all energy poverty indicators across a majority of the quantiles. This indicates that better economic situation and high-income level uplift the financial condition of individuals and help them afford energy for their daily basic needs, such as paying utility bills and keeping their house warm. GDP per capita indicates the income level where increase in PGDP (price index for GDP) boosts the purchasing power of the marginalized population group to afford energy for heating and cooking, etc., which eventually helps to reduce energy poverty. Our results support the findings of
Rodriguez-Alvarez et al. (
2021) and
Zhao et al. (
2022), who also confirmed the negative effect of income per capita on energy poverty.
Regarding the Gini index, the results show that income inequality increases all energy poverty indicators, excepting energy import dependence. Income inequality is regarded as one of the core causes of growing energy poverty, as people with high income level can afford energy and install an in-house solar system, while low-income households are usually deprived of this luxury. Low-income households are certainly more vulnerable to being energy poor; however, its severity varies and depends on the income level of the country (
Igawa & Managi, 2022). In the existing literature, a majority of researchers unanimously agree that income inequality promotes energy poverty. For example,
McGee and Greiner (
2019) and
Nguyen and Nasir (
2021) validated that increase in income inequality enhances energy poverty.
When the Gini index is replaced by another measure of income inequality, namely gender pay gap, the results are different. Higher difference in average salaries of males and females reduces the energy poverty based on total arrears on utility bills, arrears on utility bills–households with dependent children, and population unable to keep home adequately warm. However, gender pay gap has no significant impact on energy imports dependency and housing cost overburden rate. These results might be explained by the fact that in households with large differences between males and females’ salaries, women tend to develop savings behaviour and consume less energy for heating, cooling, and cooking. Psychological factors might be under this saving behaviour. Knowing her poor contribution to household expenses, a female can try to minimize them. Furthermore, these significant differences in women and men’s incomes might be due to the fact that some females assign more importance to family, children care, and household duties compared to a job and prefer a lower salary. Under this condition, women assume to create less expense and consume less energy. Our findings are in line with
Räty and Carlsson-Kanyama (
2010), who showed that women in the EU tend to consume less energy compared to males because men travel longer distances and make more physical effort, which are justified by a more tiring job, but a better paid one.
Renewable energy consumption exerts a heterogeneous effect across different EP indicators. The results indicate that renewable energy has a negative effect and reduces energy import dependence of EU countries. Actually, the EU countries import more than 60% of their required energy consumption; therefore, the installation of renewable energy projects at local level will reduce its dependence on foreign energy import. The results further show that renewable energy consumption promotes total arrears on utility bills and population unable to keep home adequately warm. The reason for this might be the higher cost of renewable energy across EU countries due to policies like FIT (feed in tariffs) and RPS (renewable portfolio standard) (
Iimura & Cross, 2018). In this case, governments provide financial subsidies and above market tariff price to support companies to facilitate new renewable energy projects and to minimize their investment risk. However, the costs of these subsidies and incentives are usually transferred to end consumers in the form of taxes and surcharges, which push consumers behind the energy poverty line.
Regarding urban population, the results indicate that urbanization has a negative impact and reduces energy poverty. This supports the argument of agglomeration effect and compact city theory. According to these principles, people in urban areas live nearby in a compact environment, utilize economies of scale, and share cooling, heating and electricity systems in a single community or a single building. This state helps them to exploit these resources at a much lower cost and, consequently, energy poverty reduces. In addition, urbanization is the sign of wealth creation and economic activities. In this context, the income level of people living in urban areas is much higher, and they can afford better heating and cooking facilities. Our result supports the findings of
Zhao et al. (
2022) for 64 states in the period 2000–2014 that also confirmed the negative impact of urbanization on energy poverty.
FDI exerts an indirect effect mostly in the long-run and reduces all energy poverty indicators excepting energy imports dependence. This indicates that foreign investments coming into the EU countries are helpful in uplifting the economic condition of individuals by providing job opportunities and enhancing economic activities, which eventually leads to energy poverty reduction. The empirical results also show that FDI has no significant impact on energy imports dependence. This finding indicates that the inward FDI in the EU countries are not going toward the renewable and green energy sector. Our results are in line with the findings of
Nguyen and Nasir (
2021) for 51 countries in the period 2002–2014.
With respect to the human capital index, the results show that HCI reduces all energy poverty indicators, excepting housing cost overburden rate. This indicates that higher level of education and a better health system can help individuals get a better paid job and live a financially viable life so they can afford energy for daily basic needs. However, it might not be enough to cover their housing costs. Our results support the findings of
Nguyen and Nasir (
2021).
Considering these empirical findings, one may suggest further policy recommendations. As income inequality is one of the main causes of energy poverty, governments should take serious steps to minimize income inequality through suitable policies (improvement of human capital through better education, higher minimum wage, better protection of intellectual property, changes in corporate governance, better infrastructure). However, in the short term, governments should provide financial subsidies to volatile income households to help them meet energy requirements. The results show that renewable energy increases energy poverty. Therefore, governments should reformulate the renewable policies in order to release the burden of renewable taxes and surcharges from end users. In addition, governments should subsidize small-scale solar panels for household units. Furthermore, governments should facilitate foreign investment in the green and renewable energy sector to reduce its dependence on foreign energy import and produce cheap renewable energy at a local level for the population.
There are further monetary benefits of reducing income inequality and energy poverty. First, healthcare costs are reduced. Energy poverty can lead to health problems due to inadequate heating or cooling. Reducing energy poverty can lead to significant cost savings in the healthcare system. Second, the productivity is increased. When people have access to reliable and affordable energy, they can be more productive at work and school. This translates to economic benefits for both individuals and businesses. Third, social welfare spending is reduced. Energy poverty can force people to rely on social welfare programs to afford basic necessities like heat and electricity. Reducing energy poverty can free up government funds for other social programs.
Quantifying the impact supposes the projection of the potential cost savings from reduced energy poverty based on the number of affected households and average energy costs. If data are available, it is necessary to estimate the increase in productivity due to improved access to reliable energy.
Cost–benefit analysis of policy recommendations implies the estimation of the costs of implementing policies to reduce income inequality and promote renewable energy. This could include social programs, tax reforms, or infrastructure investments. These costs should be compared to the projected monetary benefits of reduced energy poverty and economic growth.
The policymakers and the public should understand the social justice aspect of energy access. Everyone deserves a decent standard of living, which includes access to affordable energy. Moreover, one should highlight the environmental benefits of reducing reliance on fossil fuels.
The EU has a comprehensive policy framework to promote renewable energy sources (RES) and tackle energy poverty. The EU’s renewable energy policy is based on a few pillars. The first is targets. The EU has ambitious targets for increasing the share of renewables in the overall energy mix. The current target is for at least 32% of final energy consumption to come from renewables by 2030, rising to 40% or more under the proposed revision of the Renewable Energy Directive (RED III). Second, the EU employs various mechanisms to support renewable energy development: feed-in tariffs (guaranteed payments to producers for electricity generated from renewable sources), auctions (competitive bidding processes for renewable energy projects, ensuring cost-effectiveness), and renewable energy certificates (RECs) (tradable certificates representing the environmental benefits of renewable energy production). Third, significant funding is dedicated to research and development of new renewable energy technologies and improved energy storage solutions.
Our results are in line with
Igawa and Managi (
2022), which showed that income inequality increased energy poverty in 37 countries. Moreover, the same hypothesis is supported by
Nguyen and Nasir (
2021) in 51 economies in the period 2002–2014. Income inequality enhances energy poverty due to many causes. First, low-income households have a smaller portion of their income to spend on essentials like energy. When energy prices rise (even slightly), a larger portion of their income goes towards energy bills, leaving less for food, medicine, and other necessities. This forces them to choose between essential needs, leading to energy poverty. Second, energy-efficient appliances and home improvements can significantly reduce energy consumption and bills. However, these upgrades often require upfront costs that low-income households may struggle to afford. This traps them in a cycle of high energy bills due to inefficient homes and appliances. Third, energy infrastructure upgrades and access to cleaner energy sources are often concentrated in wealthier areas. Low-income communities may be left behind with outdated infrastructure and limited access to efficient and affordable energy options. Fourth, even if government programs exist to help low-income households with energy bills, navigating the application process and eligibility requirements can be challenging. Additionally, funding for these programs may be limited, leaving many in need without assistance.
Policy implications are related to implementation of progressive taxation, stronger social safety nets, investment in education and skills development, and reduction of wage disparities to tackle income inequality. It is necessary to focus on policies that directly target the lower income brackets, as they are most vulnerable. Corporate governance should be improved to prevent excessive executive compensation.
Since GDP per capita consistently reduces energy poverty, government should promote sustainable economic growth that benefits all segments of society, and ensure that economic growth translates into higher disposable income for low-income households. The policies should prevent “trickle down” economics from being stopped by the upper classes (
Greenwood & Holt, 2010). The policy should be to close the gender pay gap, but to also take into account that women have learned to cope with less income, so there should be education and help available to women to help them to change their energy consumption habits. It is necessary to explore innovative financing mechanisms to make renewable energy more affordable for low-income households, encourage FDI in the renewable energy sector to reduce import dependence and promote affordable clean energy and to invest in public transportation and shared heating/cooling systems in urban areas. By focusing on these strong results and implementing targeted policies, the EU can make significant progress in reducing energy poverty and achieving a just and sustainable energy transition.
The fact that less income reduces energy consumption is not obvious if energy is considered a good necessary for survival, as in the Nordic countries. In future studies, additional data per country may be necessary to show how many people are affected.


