
Does Disproportionate Financial Inclusion Reduce Gender and Income-Group Inequality? Global Evidence


Abstract
1. Introduction
2. The Background
2.1. Global Financial Inclusion and Gender and Rich-Poor Inequalities
2.2. Financial Inclusion and Overall Gender Inequality
3. Literature Review
3.1. Financial Inclusion and Economic Development
3.2. Financial Inclusion and Demographic Inequality
3.3. Constructing Financial Inclusion Indices
4. The Theoretical Framework
4.1. The Construction of the Financial Inclusion Index (FII)
4.2. Empirical Specification
5. Sample and Data Sources
6. Results
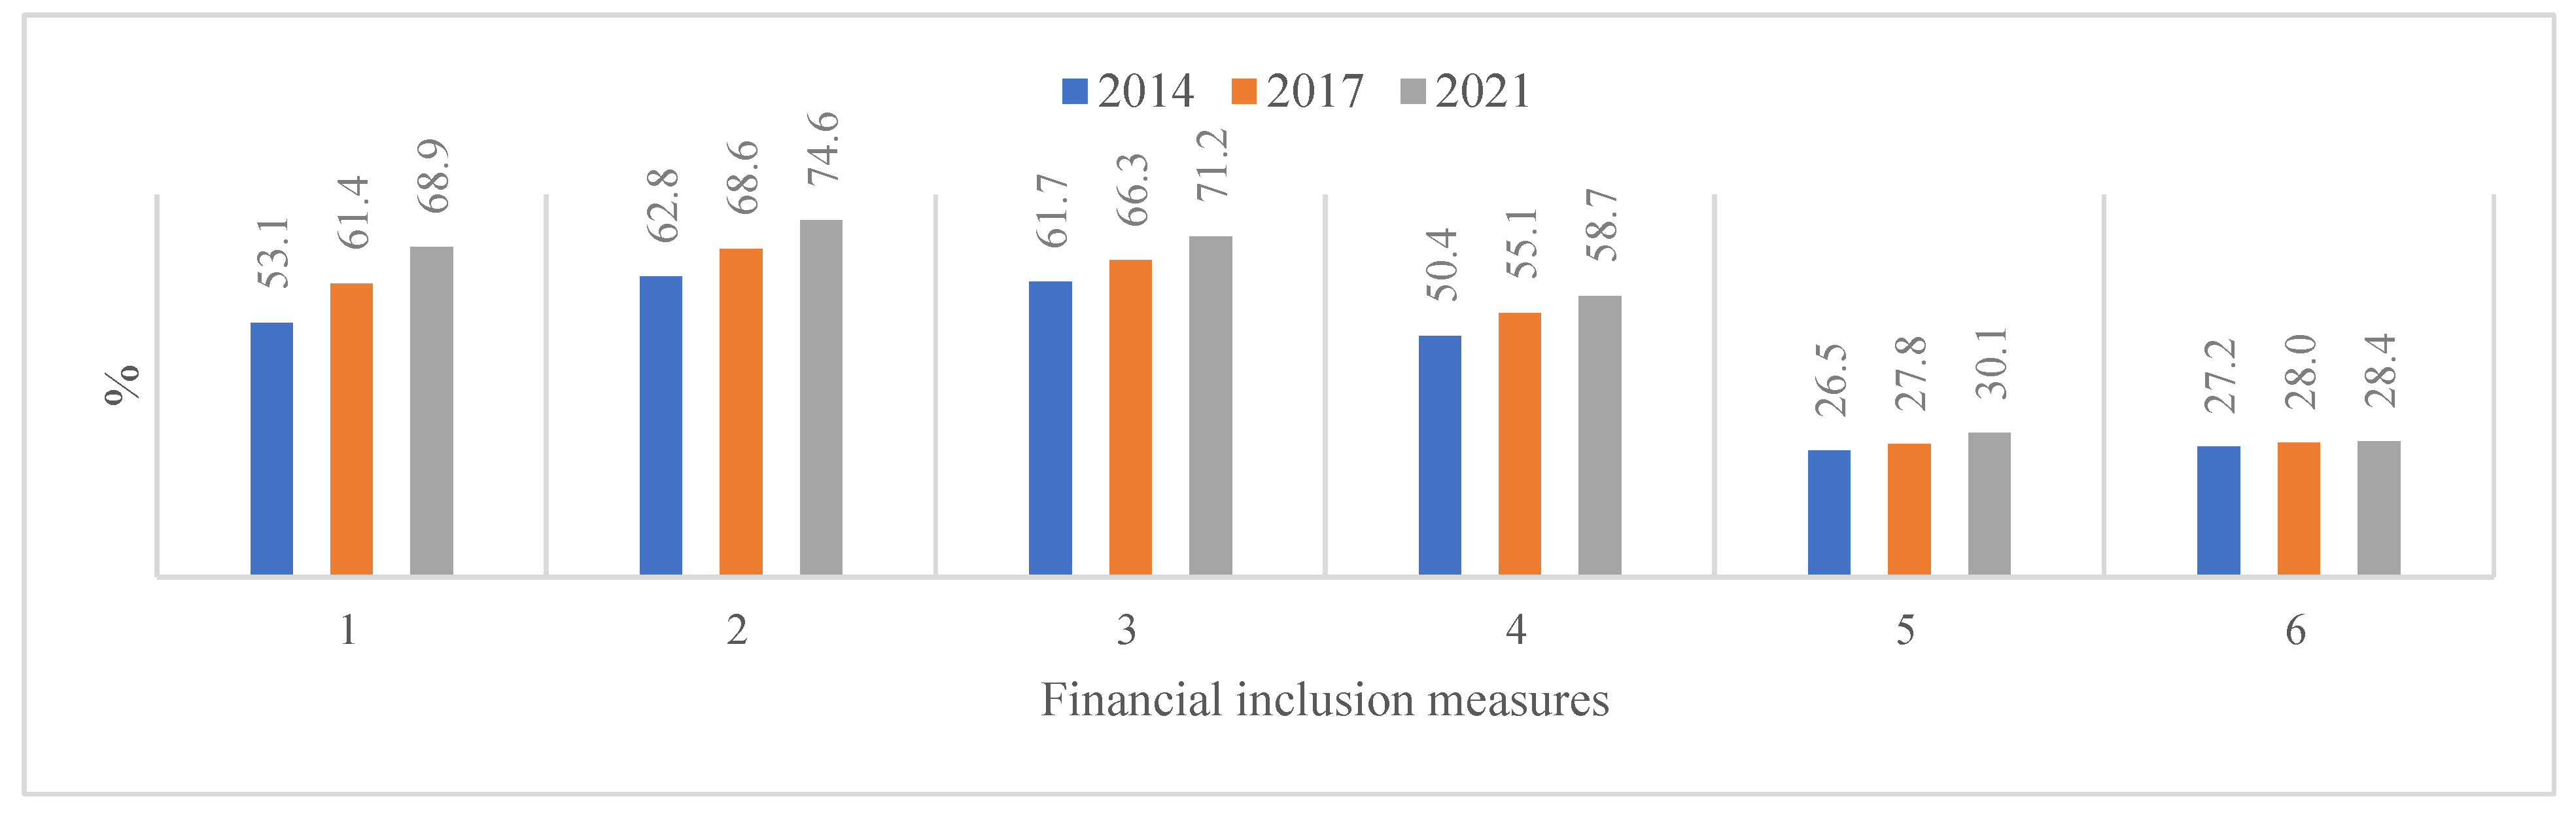
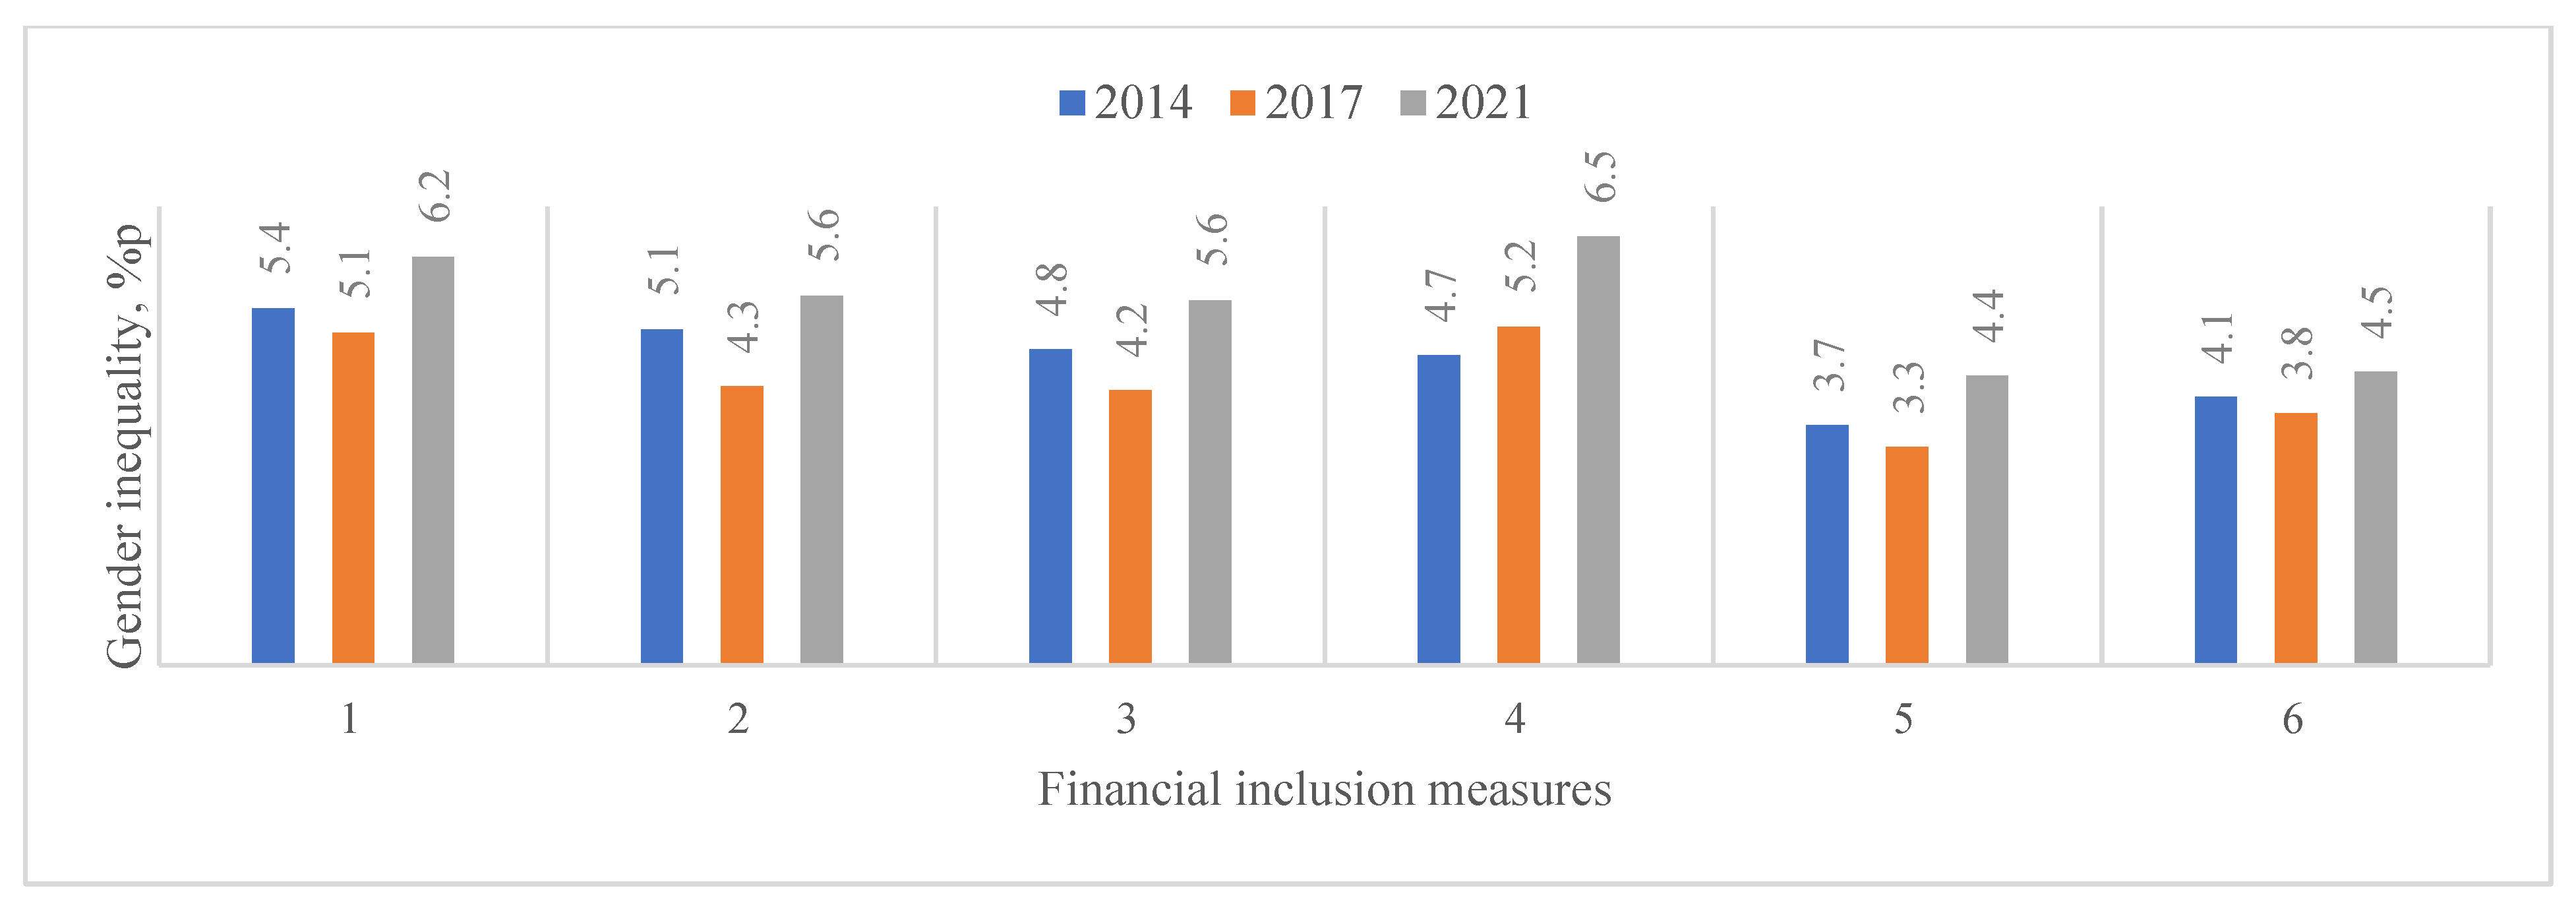
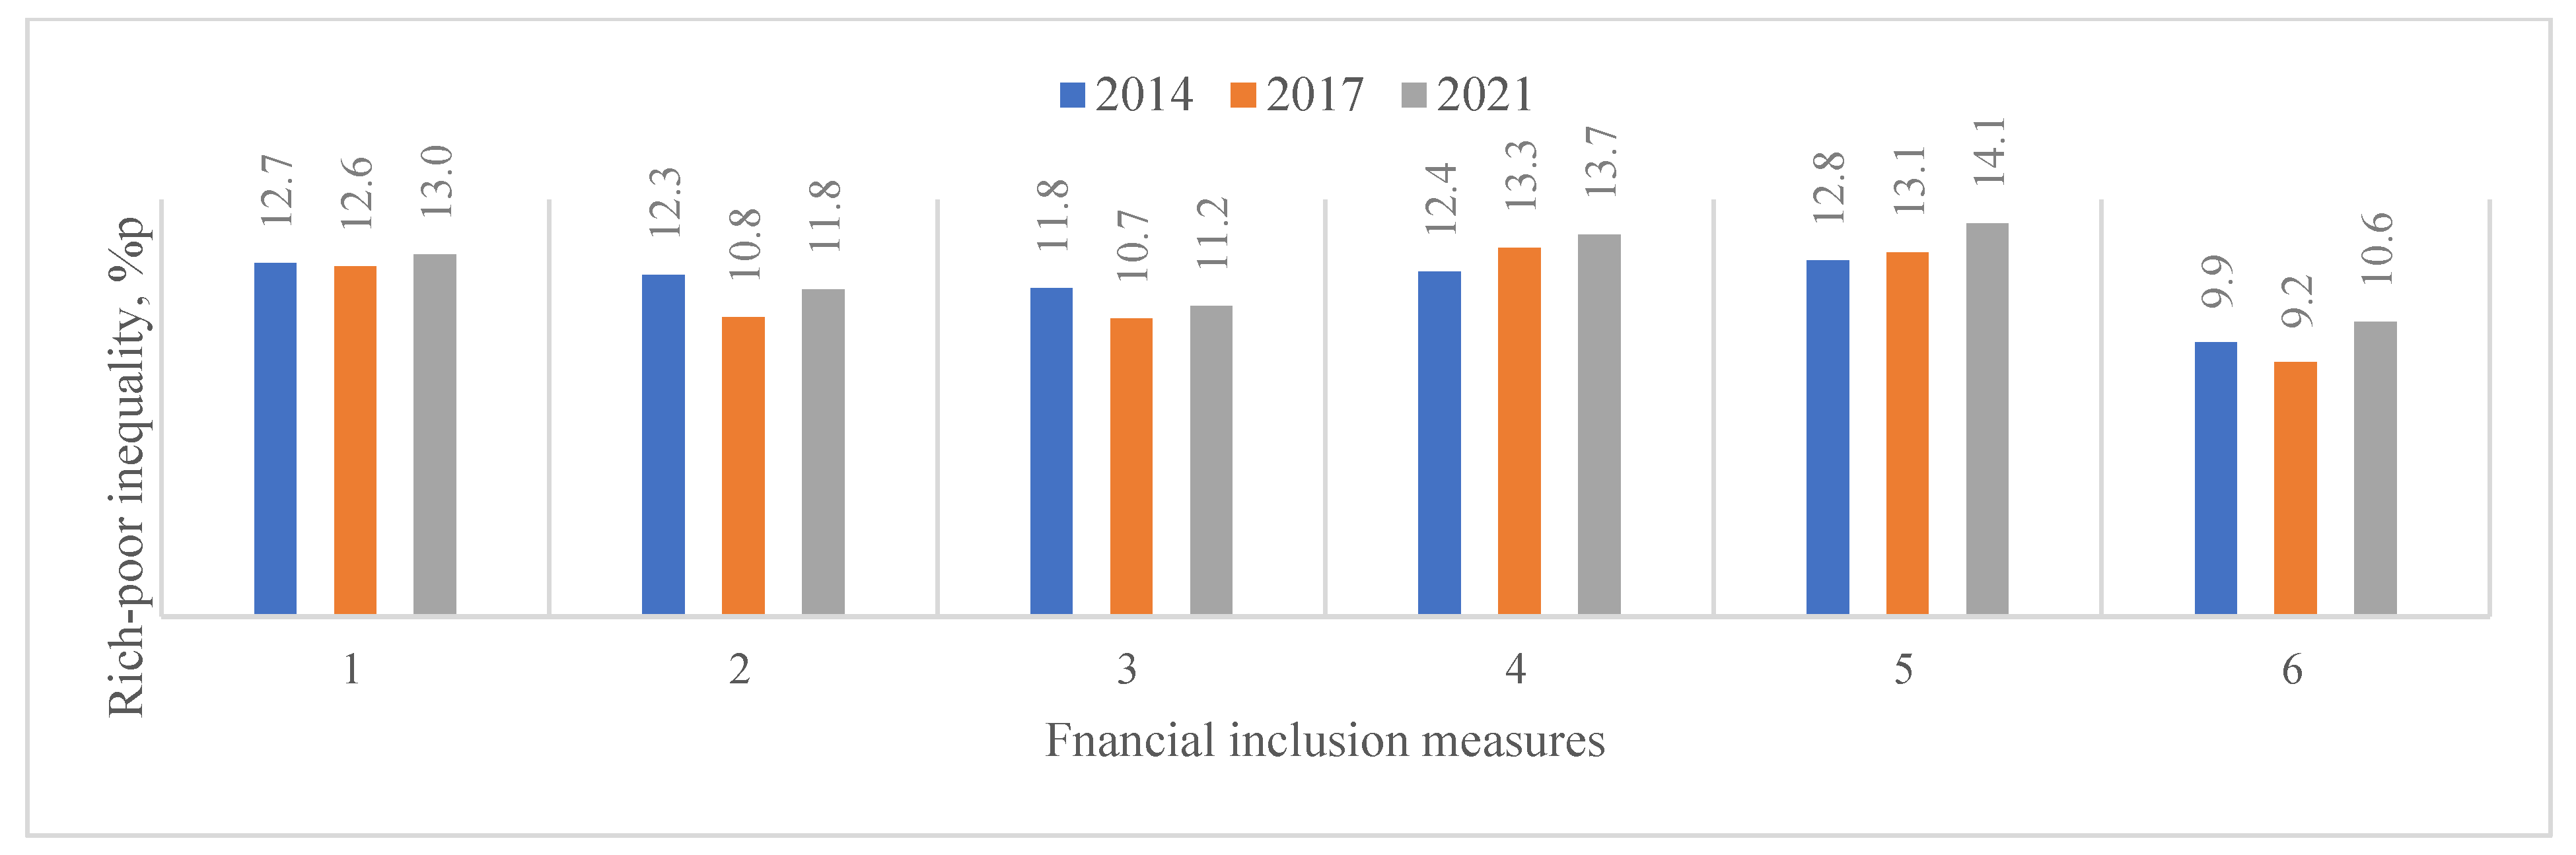
6.1. Descriptive Statistics
6.2. Univariate Analysis
6.3. Baseline Multivariate Analysis
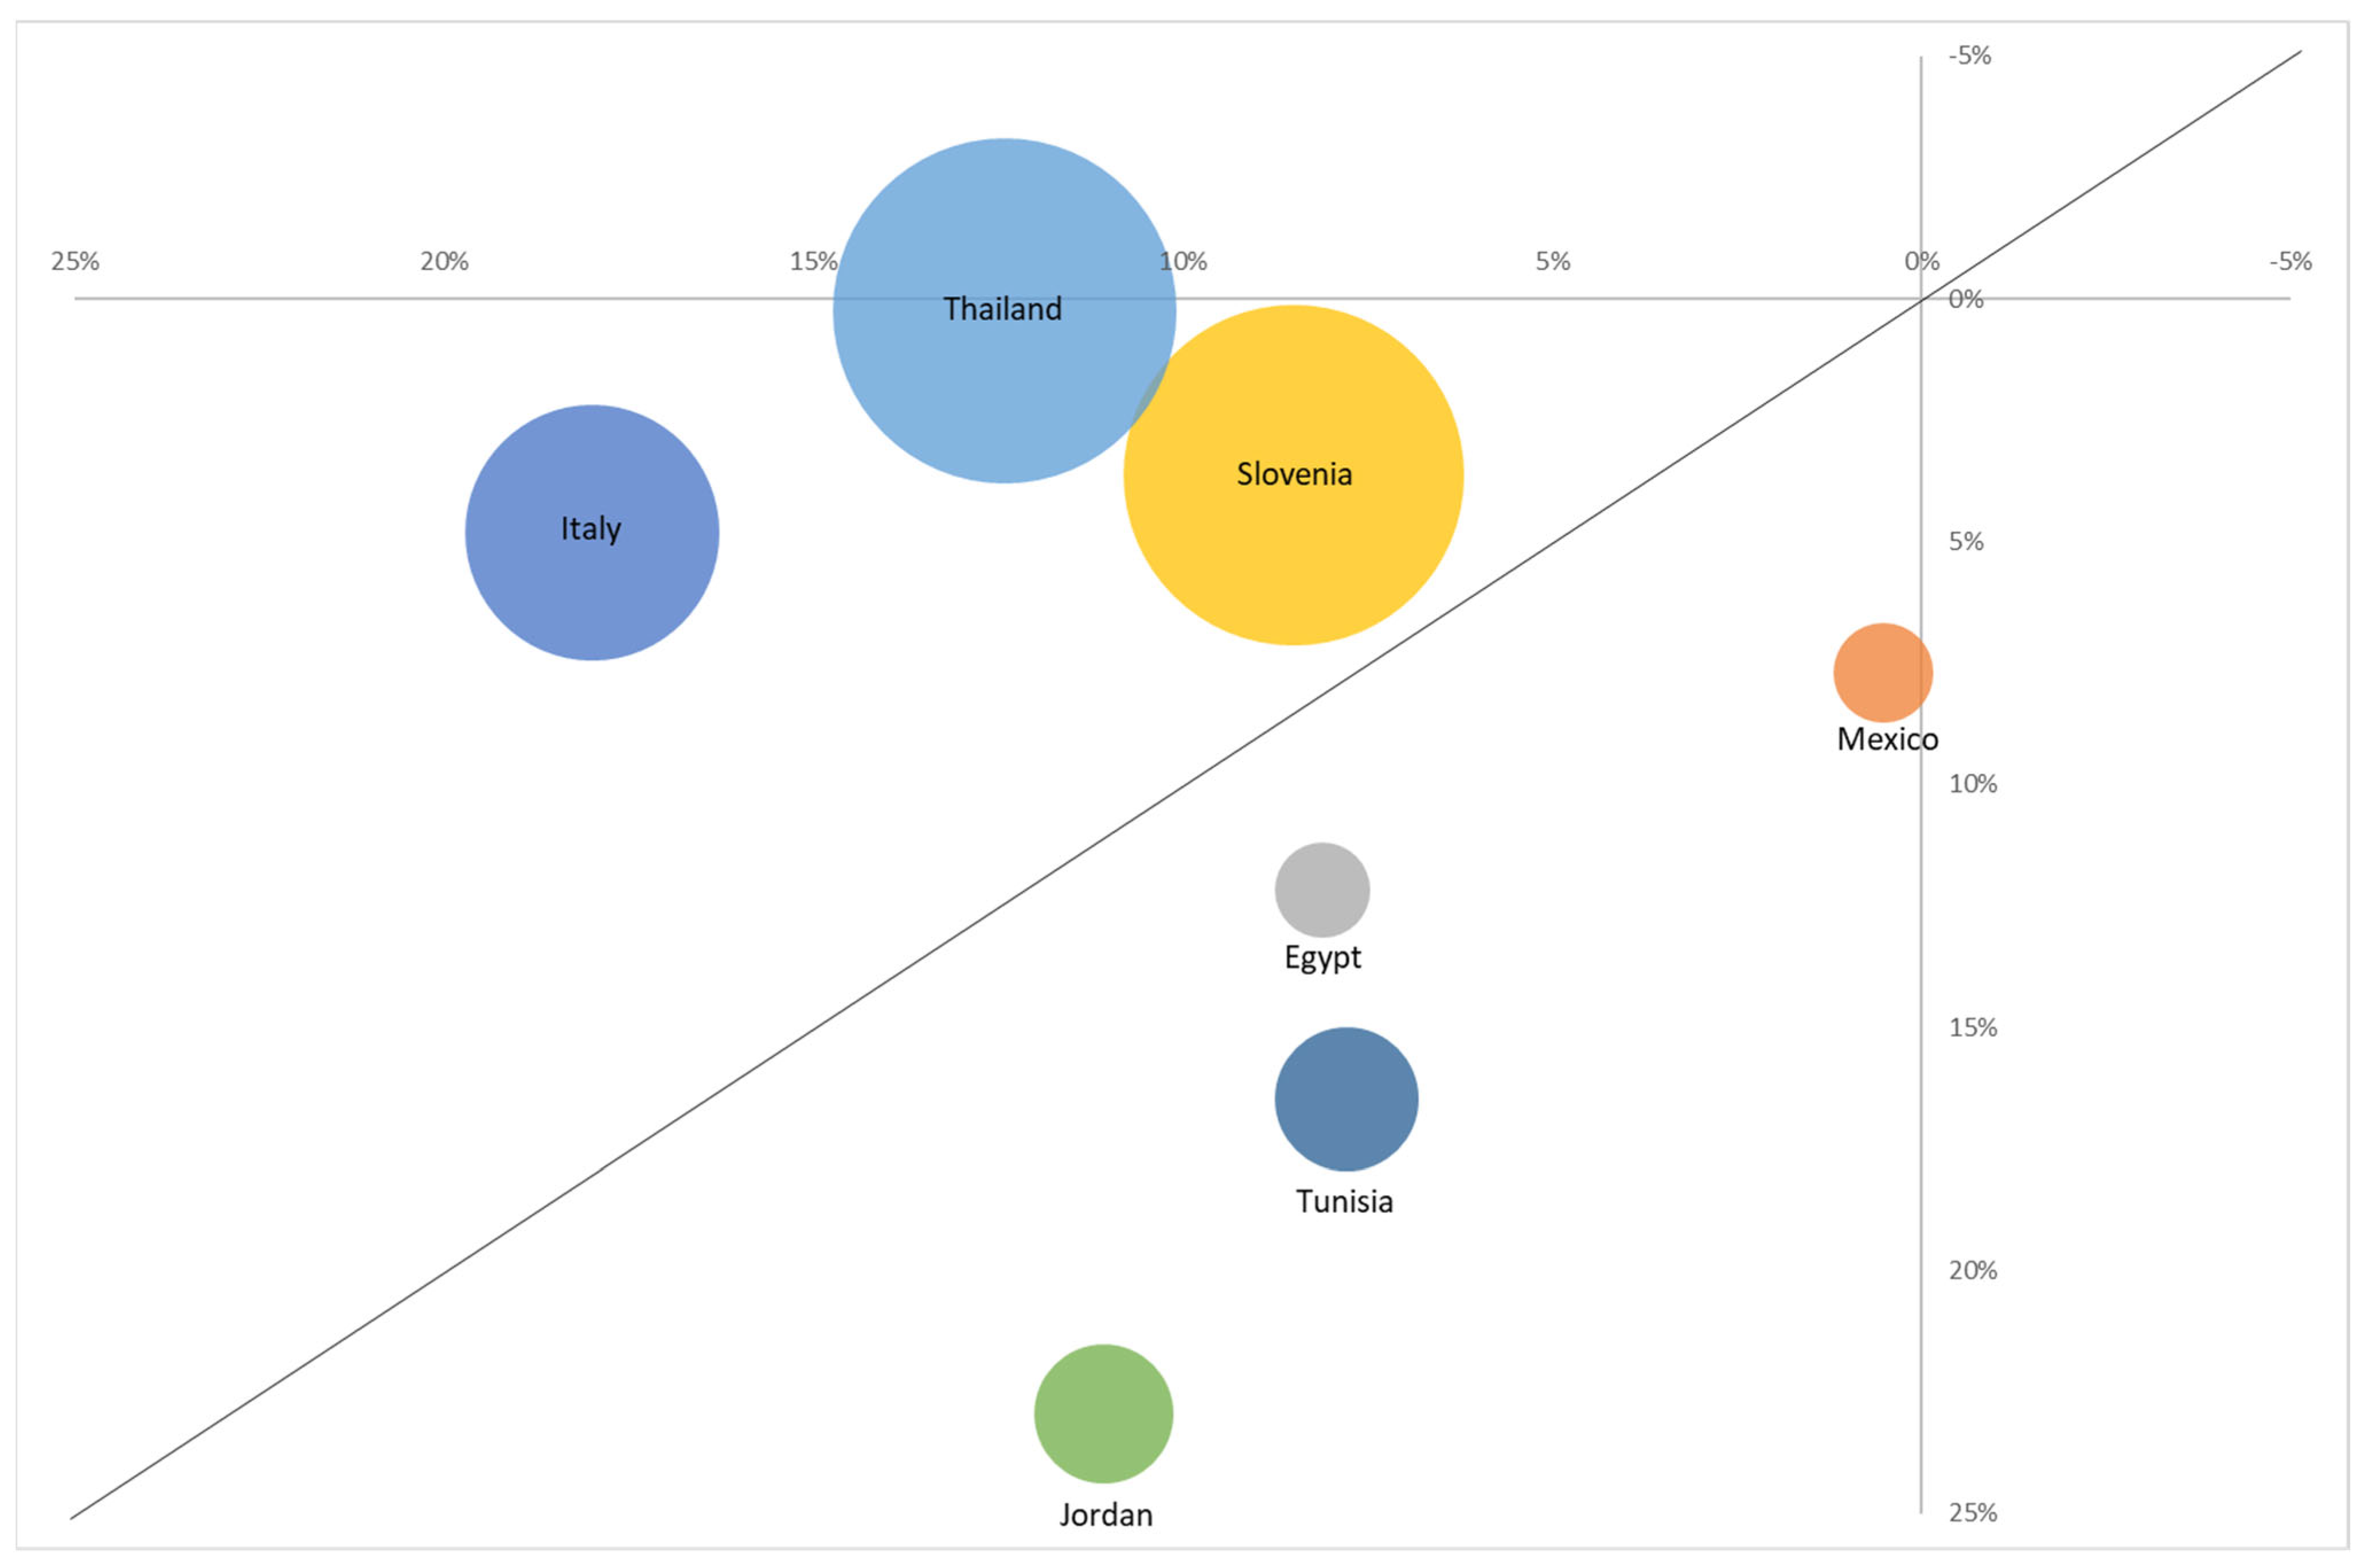
6.4. Heterogeneity in the Impact of Abnormal FII on Inequality in Financial Inclusion
6.5. Does Abnormal FII Improve Overall Gender Inequality?
6.6. Robustness Checks
7. Conclusions
Author Contributions
Funding
Institutional Review Board Statement
Informed Consent Statement
Data Availability Statement
Conflicts of Interest
Abbreviations
| FII | Financial inclusion index |
| AbFII | Abnormal financial inclusion index |
| GDP | Gross domestic product |
| UNDP | the United Nations Development Programme |
| EFA | Exploratory factor analysis |
| PCA | Principal component analysis |
| 2SLS | Two-stage least squares |
Appendix A

| Variable | Definition |
|---|---|
| FII (financial inclusion index) | The financial inclusion index based on the first factor from an exploratory factor analysis with six financial inclusion variables |
| AbFII (abnormal financial inclusion index) | The residuals from the regression of FII on GDP |
| DP (digital payments) | The percentage of respondents who report using mobile money, a debit or credit card, or a mobile phone to make a payment from an account—or report using the internet to pay bills or to buy something online or in a store—in the past year |
| ACCT (accounts) | The percentage of respondents who report having an account (by themselves or together with someone else) at a bank or another type of financial institution or report personally using a mobile money service in the past year |
| FIN_ACCT (financial institution accounts) | The percentage of respondents who report having an account (by themselves or together with someone else) at a bank or another type of financial institution |
| CARD (debit or credit cards) | The percentage of respondents who report having a debit or credit card |
| SAVING (saved at financial institutions) | The percentage of respondents who report saving or setting aside any money at a bank or another type of financial institution in the past year |
| BORROW (borrowed from financial institutions) | The percentage of respondents who report borrowing any money from a bank, credit union, microfinance institution, or another financial institution such as a cooperative in the past 12 months |
| GDP | GDP per capita |
| GROWTH | Annual GDP growth rate |
| POP | Population (in millions) |
| GE | The Worldwide Governance Indicators (WGI) Government Effectiveness index |
| ROL | The Worldwide Governance Indicators (WGI) Rule of Law index |
| GII | The UNDP’s Gender Inequality Index |
| GINI | Gini coefficient |
| INTERNET | The number of fixed-broadband internet service subscribers relative to the country’s population |
| 1 | In the UN’s 17 Sustainable Development Goals, Goal 5 is to achieve gender equality and empower all women and girls by undertaking reforms to give women equal rights to economic resources and financial services. Goal 10 states that we achieve the reduction of inequality within and among countries: Improve the regulation and monitoring of global financial markets and institutions and strengthen the implementation of such regulations (10.5); Ensure enhanced representation and voice for developing countries in global economic and financial institutions to deliver more effective, credible, accountable and legitimate institutions (10.6) (https://www.un.org/sustainabledevelopment/ accessed on 20 May 2023). |
| 2 | In our sample, for instance, the correlation coefficient between the financial inclusion index and GDP per capita is over 0.8. |
| 3 | Using the residuals of a regression of a variable of interest on established explanatory variables to calculate abnormal levels of the variable is a common practice in finance and accounting research. For example, Markarian and Michenaud (2019) regress capital expenditures on traditional controls for investment and use the residuals of this regression to construct an abnormal investment variable. Similarly, in Kalelkar and Nwaeze (2015), the residual from the regression of the top management’s liability insurance coverage on its economic determinants is used to estimate abnormal insurance coverage of top management. |
| 4 | Although AbFII is constructed as an outcome-based measure, we interpret it here as reflecting policy-driven efforts. This interpretation assumes that the deviation from predicted financial inclusion reflects policy emphasis, which may not fully hold in all contexts. We thank an anonymous reviewer for prompting this clarification. |
| 5 | In the untabulated analysis, we also include various gender inequality variables to control for the overall level of gender inequality in the country. We find that the inclusion of gender inequality variables does not have a marginal impact on our results as it is highly correlated with control variables already included in the model, such as GDP and POP. |
| 6 | They are (1) East Asia and Pacific, (2) Europe and Central Asia, (3) Latin America and the Caribbean, (4) Middle East and North Africa, (5) South Asia, (6) Sub-Saharan Africa, and (7) high-income regions. |
| 7 | While the heterogeneity patterns are consistent with our hypotheses, we acknowledge that unobserved country-specific characteristics within certain subgroups may confound the results. Therefore, interpreting subgroup differences in causal terms should be cautiously approached. We thank an anonymous reviewer for pointing out this issue. |
| 8 | In untabulated falsification test results, we reverse the temporal ordering between the financial inclusion gap outcomes and the explanatory variable, AbFII, by regressing current outcomes on future values of AbFII. These results further support the robustness of our main findings. |
References
- Aslan, G., Deléchat, C., Newiak, M. M., & Yang, M. F. (2017). Inequality in financial inclusion and income inequality. International Monetary Fund. [Google Scholar] [CrossRef]
- Aterido, R., Beck, T., & Iacovone, L. (2013). Access to finance in Sub-Saharan Africa: Is there a gender gap? World Development, 47, 102–120. [Google Scholar] [CrossRef]
- Beck, T., Demirguc-Kunt, A., & Levine, R. (2004). Finance, inequality, and poverty: Cross-country evidence. Working Paper 10979. Available online: http://www.nber.org/papers/w10979 (accessed on 20 June 2023).
- Bosma, N., Hill, S., Ionescu-Somers, A., Kelly, D., Guerrero, M., & Schott, T. (2021). Global entrepreneurship monitor 2020/2021 global report. Available online: https://www.gemconsortium.org/report (accessed on 22 June 2023).
- Brei, M., Ferri, G., & Gambacorta, L. (2023). Financial structure and income inequality. Journal of International Money and Finance, 131, 102807. [Google Scholar] [CrossRef]
- Camara, N., & Tuesta, D. (2014). Measuring financial inclusion: A multi-dimensional index. BBVA Working Paper No. 14/26. Available online: www.bbvaresearch.com (accessed on 5 August 2023).
- Chandra-Mouli, V., Camacho, A. V., & Michaud, P. A. (2013). WHO guidelines on preventing early pregnancy and poor reproductive outcomes among adolescents in developing countries. Journal of Adolescent Health, 52(5), 517–522. [Google Scholar] [CrossRef] [PubMed]
- Checchi, D., Fiorio, C. V., & Leonardi, M. (2014). Parents’ risk aversion and children’s educational attainment. Labour Economics, 30, 164–175. [Google Scholar] [CrossRef]
- Chen, W., & Yuan, X. (2021). Financial inclusion in China: An overview. Frontiers of Business Research in China, 15(4), 1–21. [Google Scholar] [CrossRef]
- Chinnakum, W. (2023). Impacts of financial inclusion on poverty and income inequality in developing Asia. The Singapore Economic Review, 68(4), 1375–1391. [Google Scholar] [CrossRef]
- Cicchiello, A. F., Kazemikhasragh, A., Monferrá, S., & Girón, A. (2021). Financial inclusion and development in the least developed countries in Asia and Africa. Journal of Innovation and Entrepreneurship, 10(49), 1–13. [Google Scholar] [CrossRef]
- Comfort, A. B., Peterson, L. A., & Hatt, L. E. (2013). Effect of health insurance on the use and provision of maternal health services and maternal and neonatal health outcomes: A systematic review. Journal of Health, Population, and Nutrition, 31(4)(Suppl. 2), S81. [Google Scholar]
- Cull, R., Ehrbeck, T., & Holle, N. (2014). Financial inclusion and development: Recent impact evidence. Policy Research Working Paper 88169. The World Bank Group. [Google Scholar]
- Demirgüç-Kunt, A., Klapper, L., & Singer, D. (2013). Financial inclusion and legal discrimination against women: Evidence from developing countries. Policy Research Working Paper 6416. The World Bank Group. Available online: https://ssrn.com/abstract=2254240 (accessed on 15 June 2023).
- Demirgüç-Kunt, A., Klapper, L., Singer, D., & Ansar, S. (2022). The global findex database 2021: Financial inclusion, digital payments, and resilience in the age of COVID-19. World Bank Publications. [Google Scholar] [CrossRef]
- Demirgüç-Kunt, A., Klapper, L. F., Singer, D., & Van Oudheusden, P. (2015). The global findex database 2014: Measuring financial inclusion around the world. Policy Research Working Paper 7255. The World Bank Group. [Google Scholar]
- Fouejieu, A., Sahay, R., Cihak, M., & Chen, S. (2020). Financial inclusion and inequality: A cross-country analysis. The Journal of International Trade & Economic Development, 29(8), 1018–1048. [Google Scholar] [CrossRef]
- Ghosh, S., & Vinod, D. (2017). What constrains financial inclusion for women? Evidence from Indian micro data. World Development, 92, 60–81. [Google Scholar] [CrossRef]
- Hanmer, L., & Elefante, M. (2019). Achieving universal access to ID: Gender-based legal barriers against women and good practice reforms. Available online: http://hdl.handle.net/10986/32474 (accessed on 15 August 2023).
- Jain-Chandra, S., Kochhar, K., Newiak, M., Zeinullayev, T., & Zhuang, L. (2017). Gender inequality around the world. In Women, work, and economic growth: Levelling the playing field (pp. 13–27). International Monetary Fund. [Google Scholar]
- Kalelkar, R., & Nwaeze, E. (2015). Directors and officers liability insurance: Implications of abnormal coverage. Journal of Accounting, Auditing & Finance, 30(1), 3–34. [Google Scholar]
- Kaur, S., & Kapuria, C. (2020). Determinants of financial inclusion in rural India: Does gender matter? International Journal of Social Economics, 47(6), 747–767. [Google Scholar] [CrossRef]
- Kling, G., Pesqué-Cela, V., Tian, L., & Luo, D. (2022). A theory of financial inclusion and income inequality. The European Journal of Finance, 28(1), 137–157. [Google Scholar] [CrossRef]
- Le, T. H., Chuc, A. T., & Taghizadeh-Hesary, F. (2019). Financial inclusion and its impact on financial efficiency and sustainability: Empirical evidence from Asia. Borsa Istanbul Review, 19(4), 310–322. [Google Scholar] [CrossRef]
- Markarian, G., & Michenaud, S. (2019). Corporate investment and earnings surprises. The European Journal of Finance, 25(16), 1485–1509. [Google Scholar] [CrossRef]
- Mbiti, I. M., & Weil, D. N. (2018). Mobile banking, financial inclusion, and household welfare: Panel data evidence from Kenya. World Development. [Google Scholar]
- Orimaye, S. O., Hale, N., Leinaar, E., Smith, M. G., & Khoury, A. (2021). Adolescent birth rates and rural–urban differences by levels of deprivation and Health Professional Shortage Areas in the United States, 2017–2018. American Journal of Public Health, 111(1), 136–144. [Google Scholar] [CrossRef]
- Park, C. Y., & Mercado, R. V. (2018). Financial inclusion: New measurement and cross-country impact assessment. ADB Economics Working Paper Series 539. Asia Development Bank. [Google Scholar]
- Preziuso, M., Koefer, F., & Ehrenhard, M. (2023). Open banking and inclusive finance in the European Union: Perspectives from the Dutch stakeholder ecosystem. Financial Innovation, 9(1), 111. [Google Scholar] [CrossRef]
- Qamruzzaman, M., & Jianguo, W. (2017). Financial innovation and economic growth in Bangladesh. Financial Innovation, 3(19), 1–34. [Google Scholar] [CrossRef]
- Qamruzzaman, M., & Jianguo, W. (2018). Nexus between financial innovation and economic growth in South Asia: Evidence from ARDL and nonlinear ARDL approaches. Financial Innovation, 4(20), 1–19. [Google Scholar] [CrossRef]
- Saraswati, P. W. (2022). Saving more lives on time: Strategic policy implementation and financial inclusion for safe abortion in Indonesia during COVID-19 and beyond. Frontiers in Global Women’s Health, 3, 901842. [Google Scholar] [CrossRef] [PubMed]
- Sarma, M. (2008). Index of financial inclusion. Working Paper No. 215. Indian Council for Research on International Economic Relations. [Google Scholar]
- Sioson, E. P., & Kim, C. (2019). Closing the gender gap in financial inclusion through fintech. ADBI Policy Brief No. 2019-3. Asia Development Bank. [Google Scholar]
- The World Bank Group. (2014). Global financial development report 2014: Financial inclusion (Vol. 2). World Bank Publications. [Google Scholar]
- The World Bank Group. (2022, May 29). Available online: https://www.worldbank.org/en/topic/financialinclusion/overview (accessed on 30 May 2023).
- Yakean, S. (2020). e-payment system drive thailand to be a cashless society. Review of Economics and Finance, 18, 87–91. [Google Scholar] [CrossRef]
| Study | Method | GDP Controlled | Key Focus |
|---|---|---|---|
| Sarma (2008) | Averaging | No | Overall financial access |
| Le et al. (2019) | PCA | No | Financial efficiency and stability |
| Chinnakum (2023) | EFA | No | Poverty and inequality reduction |
| Camara and Tuesta (2014) | PCA | No | Multi-dimensional access and demographics |
| Park and Mercado (2018) | PCA | No | Growth and poverty reduction |
| This Study (AbFII) | PCA & Regression residuals | Yes | Disproportionate national inclusion effort on inequality reduction |
| Panel A: Factor identification | ||||
| Factor | Eigenvalue | Difference | Proportion | Cumulative |
| 1 | 215.699 | 212.993 | 0.980 | 0.980 |
| 2 | 2.706 | 0.518 | 0.012 | 0.993 |
| 3 | 2.188 | 1.719 | 0.010 | 1.002 |
| 4 | 0.469 | 0.780 | 0.002 | 1.005 |
| 5 | −0.312 | 0.384 | −0.001 | 1.003 |
| 6 | −0.695 | −0.003 | 1.000 | |
| Panel B: Factor loadings | ||||
| Variable | Communality | Weight | Adj. Weight | |
| DP | 0.939 | 16.537 | 0.158 | |
| ACCT | 0.971 | 34.656 | 0.330 | |
| FIN_ACCT | 0.968 | 30.993 | 0.295 | |
| CARD | 0.938 | 16.094 | 0.153 | |
| SAVING | 0.725 | 3.635 | 0.035 | |
| BORROW | 0.671 | 3.036 | 0.029 | |
| Variables | Mean | Std. Dev. | Median | Min. | Max. | ||
|---|---|---|---|---|---|---|---|
| Financial Inclusiont | FII | 0.595 | 0.271 | 0.614 | 0.079 | 0.979 | |
| AbFII | 0.000 | 0.131 | 0.010 | −0.314 | 0.375 | ||
| Inequalityt+3 | G-gap | DP (%p) | 5.64 | 7.06 | 4.25 | −6.83 | 29.37 |
| ACCT (%p) | 5.21 | 7.06 | 3.36 | −6.98 | 29.18 | ||
| FIN_ACCT (%p) | 5.09 | 6.91 | 3.17 | −6.53 | 29.01 | ||
| CARD (%p) | 5.66 | 6.78 | 4.33 | −6.06 | 28.32 | ||
| SAVING (%p) | 4.06 | 4.22 | 4.45 | −7.76 | 15.72 | ||
| BORROW (%p) | 4.20 | 5.10 | 3.68 | −7.52 | 22.06 | ||
| RP-gap | DP (%p) | 12.89 | 8.36 | 13.42 | −0.60 | 31.51 | |
| ACCT (%p) | 11.60 | 8.95 | 11.10 | −2.57 | 31.45 | ||
| FIN_ACCT (%p) | 11.10 | 8.73 | 9.54 | −1.74 | 31.80 | ||
| CARD (%p) | 12.89 | 8.13 | 12.66 | −1.75 | 31.97 | ||
| SAVING (%p) | 13.12 | 7.24 | 12.99 | −5.16 | 33.39 | ||
| BORROW (%p) | 9.71 | 7.16 | 8.80 | −4.88 | 34.62 | ||
| Control variablest | log(GDP) | 9.08 | 1.30 | 9.11 | 6.08 | 11.44 | |
| GROWTH (%) | 3.64 | 2.40 | 3.51 | −6.30 | 10.24 | ||
| log(POP) | 2.78 | 1.48 | 2.72 | −0.34 | 7.23 | ||
| GE (%) | 60.44 | 24.62 | 58.90 | 9.85 | 99.75 | ||
| ROL (%) | 58.08 | 26.11 | 56.50 | 11.30 | 99.75 | ||
| Panel A: Sort by FII | ||||||
| Country | FII | AbFII | GDP ($) | POP (in mil.) | G-gap in DP (%p) | RP-gap in DP (%p) |
| Canada | 0.979 | 0.077 | 45,129 | 30.37 | 1.30 | −0.02 |
| Norway | 0.979 | −0.011 | 75,497 | 4.30 | −1.81 | −0.45 |
| Sweden | 0.970 | 0.038 | 53,792 | 8.20 | −0.66 | 1.89 |
| Denmark | 0.967 | 0.023 | 57,610 | 4.78 | 0.35 | −0.27 |
| Finland | 0.966 | 0.060 | 46,412 | 4.60 | 1.57 | 0.72 |
| ⋮ | ||||||
| Cote d’Ivoire | 0.253 | −0.123 | 2076 | 13.73 | 0.10 | 0.14 |
| Malawi | 0.248 | 0.115 | 500 | 9.52 | 0.06 | 0.18 |
| Mali | 0.240 | 0.027 | 796 | 9.37 | 0.15 | 0.06 |
| Cambodia | 0.173 | −0.137 | 1401 | 10.82 | 0.01 | 0.08 |
| Madagascar | 0.121 | −0.014 | 503 | 14.61 | 0.03 | 0.06 |
| Panel B: Sort by AbFII | ||||||
| Country | AbFII | FII | GDP ($) | POP (in mil.) | G-gap in DP (%p) | RP-gap in DP (%p) |
| Mongolia | 0.372 | 0.848 | 3708 | 2.16 | −4.61 | 7.62 |
| Iran, Islamic Rep. | 0.316 | 0.867 | 5759 | 60.44 | 10.71 | 3.41 |
| Kenya | 0.294 | 0.634 | 1676 | 28.99 | 9.06 | 21.05 |
| India | 0.241 | 0.607 | 1958 | 954.55 | 12.30 | 14.84 |
| Uganda | 0.207 | 0.414 | 766 | 20.75 | 14.58 | 18.34 |
| ⋮ | ||||||
| Azerbaijan | −0.226 | 0.268 | 4147 | 7.50 | 3.41 | 15.56 |
| El Salvador | −0.227 | 0.260 | 3986 | 4.59 | 11.76 | 15.05 |
| Argentina | −0.262 | 0.448 | 14,613 | 32.66 | −4.77 | 14.89 |
| Mexico | −0.311 | 0.324 | 9434 | 89.66 | 7.69 | 18.84 |
| Panama | −0.317 | 0.399 | 15,186 | 2.92 | 10.25 | 22.20 |
| AbFII | FII | G-Gap in DP | RP-Gap in DP | G-Gap in ACCT | RP-Gap in ACCT | log(GDP) | |
|---|---|---|---|---|---|---|---|
| FIIt | 0.488 * | - | |||||
| G-gap in DPt+3 | −0.191 * | −0.427 * | - | ||||
| RP-gap in DPt+3 | −0.320 * | −0.625 * | 0.376 * | - | |||
| G-gap in ACCTt+3 | −0.274 * | −0.485 * | 0.914 * | 0.396 * | - | ||
| RP-gap in ACCTt+3 | −0.432 * | −0.728 * | 0.357 * | 0.921 * | 0.452 * | - | |
| log(GDP)t | 0.002 | 0.866 * | −0.385 * | −0.530 * | −0.403 * | −0.578 * | - |
| log(POP)t | 0.040 | −0.115* | 0.086 | 0.007 | 0.072 | 0.040 | −0.156 * |
| Panel A: Gender inequality (G-gap) in financial inclusion metrics | ||||||
| High GDP (n = 100) | Low GDP (n = 100) | t-stat | Good GII (n = 100) | Poor GII (n = 100) | t-stat | |
| G-gap in DP (%p) | 3.35 | 7.93 | (4.84) | 2.73 | 8.56 | (6.41) |
| G-gap in ACCT (%p) | 2.78 | 7.64 | (5.17) | 2.20 | 8.22 | (6.64) |
| G-gap in FIN_ACCT (%p) | 2.79 | 7.39 | (4.98) | 2.18 | 7.99 | (6.53) |
| G-gap in CARD (%p) | 3.54 | 7.79 | (4.66) | 2.76 | 8.57 | (6.69) |
| G-gap in SAVING (%p) | 3.87 | 4.25 | (0.63) | 3.43 | 4.69 | (2.13) |
| G-gap in BORROW (%p) | 5.32 | 3.09 | (−3.15) | 4.47 | 3.93 | (−0.75) |
| Panel B: Rich-poor inequality (RP-gap) in financial inclusion metrics | ||||||
| High GDP (n = 100) | Low GDP (n = 100) | t-stat | Good Gini (n = 77) | Poor Gini (n = 80) | t-stat | |
| RP-gap in DP (%p) | 8.75 | 17.02 | (8.02) | 8.05 | 17.00 | (7.46) |
| RP-gap in ACCT (%p) | 6.80 | 16.40 | (8.99) | 6.55 | 15.39 | (6.80) |
| RP-gap in FIN_ACCT (%p) | 6.82 | 15.38 | (7.94) | 6.38 | 15.00 | (6.78) |
| RP-gap in CARD (%p) | 10.03 | 15.75 | (5.30) | 8.57 | 17.39 | (7.85) |
| RP-gap in SAVING (%p) | 15.30 | 10.94 | (−4.46) | 14.31 | 13.54 | (−0.67) |
| RP-gap in BORROW (%p) | 12.67 | 6.75 | (−6.40) | 10.05 | 10.56 | (0.44) |
| Panel A: Gender inequality (G-gap) in financial inclusion metrics | ||||||||||||
| (1) | (2) | (3) | (4) | (5) | (6) | (7) | (8) | (9) | (10) | (11) | (12) | |
| G-gap in DP | G-gap in DP | G-gap in ACCT | G-gap in ACCT | G-gap in FIN_ACCT | G-gap in FIN_ACCT | G-gap in CARD | G-gap in CARD | G-gap in SAVING | G-gap in SAVING | G-gap in BORROW | G-gap in BORROW | |
| AbFII | −0.086 ** | −0.065 * | −0.124 *** | −0.088 *** | −0.117 *** | −0.073 ** | −0.061 * | −0.019 | −0.028 | −0.013 | −0.011 | 0.016 |
| (−2.28) | (−1.69) | (−3.80) | (−2.65) | (−3.21) | (−1.98) | (−1.66) | (−0.52) | (−1.10) | (−0.47) | (−0.37) | (0.48) | |
| log(GDP) | −0.009 | −0.009 | −0.010 | −0.016 | −0.009 | −0.015 | −0.006 | 0.003 | 0.003 | 0.000 | 0.010 | 0.006 |
| (−0.95) | (−0.74) | (−1.20) | (−1.60) | (−0.99) | (−1.34) | (−0.61) | (0.25) | (0.48) | (0.01) | (1.27) | (0.63) | |
| GROWTH | 0.002 | 0.005 ** | 0.000 | 0.004 | 0.000 | 0.004 * | −0.001 | 0.001 | 0.000 | 0.002 | 0.000 | 0.002 |
| (0.99) | (1.98) | (0.03) | (1.64) | (−0.03) | (1.67) | (−0.23) | (0.53) | (−0.14) | (1.00) | (0.14) | (1.13) | |
| log(POP) | 0.002 | 0.002 | 0.001 | 0.003 | 0.002 | 0.005 | 0.006 * | 0.005 * | 0.004 * | 0.005 ** | −0.002 | 0.000 |
| (0.47) | (0.44) | (0.47) | (1.04) | (0.58) | (1.45) | (1.84) | (1.65) | (1.79) | (2.11) | (−0.85) | (0.00) | |
| GE | −0.001 | 0.000 | −0.001 * | 0.000 | −0.001 | 0.000 | 0.000 | 0.000 | 0.000 | 0.000 | 0.000 | 0.001 |
| (−0.96) | (0.49) | (−1.91) | (−0.12) | (−1.61) | (0.09) | (−0.67) | (0.16) | (−0.83) | (0.92) | (−0.12) | (0.85) | |
| ROL | 0.000 | −0.001 | 0.000 | 0.000 | 0.000 | 0.000 | 0.000 | 0.000 | 0.000 | 0.000 | 0.000 | 0.000 |
| (0.12) | (−0.95) | (1.16) | (0.06) | (0.91) | (0.05) | (−0.47) | (−0.22) | (0.43) | (−0.88) | (−0.22) | (−0.27) | |
| Year FE | Y | Y | Y | Y | Y | Y | Y | Y | Y | Y | Y | Y |
| Region FE | Y | Y | Y | Y | Y | Y | ||||||
| Adj. R2 | 0.169 | 0.271 | 0.256 | 0.351 | 0.198 | 0.305 | 0.141 | 0.285 | 0.000 | 0.067 | 0.006 | 0.026 |
| N | 200 | 200 | 200 | 200 | 200 | 200 | 200 | 200 | 200 | 200 | 200 | 200 |
| Panel B: Rich-poor inequality (RP-gap) in financial inclusion metrics | ||||||||||||
| (1) | (2) | (3) | (4) | (5) | (6) | (7) | (8) | (9) | (10) | (11) | (12) | |
| RP-gap in DP | RP-gap in DP | RP-gap in ACCT | RP-gap in ACCT | RP-gap in FIN_ACCT | RP-gap in FIN_ACCT | RP-gap in CARD | RP-gap in CARD | RP-gap in SAVING | RP-gap in SAVING | RP-gap in BORROW | RP-gap in BORROW | |
| AbFII | −0.194 *** | −0.165 *** | −0.276 *** | −0.236 *** | −0.260 *** | −0.206 *** | −0.137 *** | −0.085 ** | 0.136 *** | 0.140 *** | 0.016 | 0.064 * |
| (−5.00) | (−4.16) | (−7.98) | (−6.63) | (−7.19) | (−5.52) | (−3.16) | (−1.96) | (4.04) | (3.85) | (0.44) | (1.65) | |
| log(GDP) | −0.037 *** | −0.020 * | −0.041 *** | −0.033 *** | −0.034 *** | −0.028 *** | −0.017 | −0.012 | 0.016 * | 0.026 ** | 0.029 *** | 0.024 ** |
| (−3.94) | (−1.84) | (−4.93) | (−3.37) | (−3.87) | (−2.69) | (−1.60) | (−0.96) | (1.87) | (2.37) | (3.17) | (2.19) | |
| GROWTH | 0.000 | 0.000 | −0.001 | 0.000 | 0.000 | 0.001 | 0.000 | −0.002 | 0.004 | 0.002 | 0.001 | 0.002 |
| (0.03) | (−0.16) | (−0.34) | (0.21) | (−0.03) | (0.50) | (−0.06) | (−0.59) | (1.61) | (0.80) | (0.45) | (0.75) | |
| log(POP) | −0.005 | −0.004 | −0.003 | 0.000 | −0.003 | 0.000 | 0.002 | 0.002 | 0.003 | 0.000 | 0.000 | 0.002 |
| (−1.49) | (−1.16) | (−0.99) | (−0.04) | (−1.05) | (−0.02) | (0.44) | (0.49) | (0.80) | (−0.03) | (0.01) | (0.55) | |
| GE | 0.001 | 0.001 | 0.001 | 0.001 | 0.001 * | 0.001 * | 0.001 | 0.001 | 0.001 | 0.001 | 0.000 | 0.000 |
| (1.28) | (1.16) | (1.06) | (1.34) | (1.91) | (1.87) | (1.61) | (0.97) | (1.52) | (0.81) | (−0.28) | (0.19) | |
| ROL | −0.001 | 0.000 | −0.001 | 0.000 | −0.001 *** | 0.000 | −0.001 *** | 0.000 | 0.000 | 0.000 | 0.000 | 0.001 |
| (−1.63) | (−0.31) | (−1.48) | (−0.47) | (−2.79) | (−0.90) | (−2.63) | (0.02) | (−1.04) | (−0.44) | (0.46) | (1.20) | |
| Year FE | Y | Y | Y | Y | Y | Y | Y | Y | Y | Y | Y | Y |
| Region FE | Y | Y | Y | Y | Y | Y | ||||||
| Adj. R2 | 0.387 | 0.450 | 0.550 | 0.591 | 0.476 | 0.526 | 0.188 | 0.291 | 0.271 | 0.275 | 0.251 | 0.300 |
| N | 200 | 200 | 200 | 200 | 200 | 200 | 200 | 200 | 200 | 200 | 200 | 200 |
| Panel A: Gender inequality (G-gap) in financial inclusion metrics | ||||||
| (1) | (2) | (3) | (4) | (5) | (6) | |
| G-gap in DP | G-gap in ACCT | G-gap in FIN_ACCT | G-gap in CARD | G-gap in SAVING | G-gap in BORROW | |
| AbFII * Poor GII | −0.080 * | −0.107 *** | −0.085 * | −0.027 | 0.004 | 0.039 |
| (−1.74) | (−2.71) | (−1.94) | (−0.63) | (0.10) | (1.01) | |
| AbFII * Good GII | −0.003 | −0.016 | −0.002 | 0.048 | −0.046 | −0.012 |
| (−0.04) | (−0.26) | (−0.03) | (0.69) | (−1.00) | (−0.20) | |
| log(GDP) | −0.007 | −0.014 | −0.013 | 0.005 | 0.000 | 0.007 |
| (−0.61) | (−1.43) | (−1.16) | (0.43) | (−0.05) | (0.68) | |
| GROWTH | 0.005 ** | 0.004 * | 0.004 * | 0.001 | 0.001 | 0.002 |
| (2.00) | (1.68) | (1.68) | (0.53) | (0.96) | (1.02) | |
| log(POP) | 0.002 | 0.003 | 0.005 | 0.005 * | 0.005 ** | 0.000 |
| (0.43) | (1.03) | (1.48) | (1.69) | (2.09) | (−0.01) | |
| GE | 0.000 | 0.000 | 0.000 | 0.000 | 0.000 | 0.001 |
| (0.43) | (−0.20) | (0.03) | (0.11) | (0.96) | (0.91) | |
| ROL | 0.000 | 0.000 | 0.000 | 0.000 | 0.000 | 0.000 |
| (−0.91) | (0.10) | (0.11) | (−0.16) | (−0.92) | (−0.27) | |
| Good GII | −0.010 | −0.009 | −0.018 | −0.022 | 0.001 | −0.018 |
| (−0.59) | (−0.60) | (−1.14) | (−1.38) | (0.08) | (−1.27) | |
| Year FE | Y | Y | Y | Y | Y | Y |
| Region FE | Y | Y | Y | Y | Y | Y |
| Adj. R2 | 0.268 | 0.351 | 0.307 | 0.288 | 0.061 | 0.026 |
| N | 200 | 200 | 200 | 200 | 200 | 200 |
| Panel B: Rich-poor inequality (RP-gap) in financial inclusion metrics | ||||||
| (1) | (2) | (3) | (4) | (5) | (6) | |
| RP-gap in DP | RP-gap in ACCT | RP-gap in FIN_ACCT | RP-gap in CARD | RP-gap in SAVING | RP-gap in BORROW | |
| AbFII * Poor Gini | −0.178 *** | −0.267 *** | −0.252 *** | −0.138 ** | 0.070 | 0.030 |
| (−3.21) | (−5.41) | (−4.90) | (−2.27) | (1.22) | (0.50) | |
| AbFII * Good Gini | −0.200 *** | −0.233 *** | −0.209 *** | −0.072 | 0.157 ** | 0.140 ** |
| (−3.12) | (−4.02) | (−3.48) | (−1.02) | (2.34) | (1.98) | |
| log(GDP) | −0.042 *** | −0.052 *** | −0.044 *** | −0.035 ** | 0.021 | 0.018 |
| (−3.33) | (−4.66) | (−3.81) | (−2.57) | (1.53) | (1.31) | |
| GROWTH | 0.002 | 0.002 | 0.003 | 0.000 | 0.002 | 0.003 |
| (0.75) | (0.96) | (1.28) | (0.03) | (0.76) | (0.88) | |
| log(POP) | −0.005 | −0.001 | −0.001 | 0.000 | −0.001 | 0.004 |
| (−1.46) | (−0.31) | (−0.43) | (0.02) | (−0.17) | (0.91) | |
| GE | 0.001 | 0.001 | 0.001 | 0.001 | 0.000 | 0.000 |
| (0.68) | (1.08) | (1.27) | (0.74) | (0.32) | (−0.37) | |
| ROL | 0.000 | 0.000 | 0.000 | 0.000 | 0.000 | 0.001 * |
| (0.53) | (0.52) | (0.21) | (0.50) | (−0.20) | (1.75) | |
| Good Gini | −0.051 *** | −0.038 *** | −0.039 *** | −0.066 *** | −0.014 | −0.034 ** |
| (−4.19) | (−3.53) | (−3.46) | (−4.94) | (−1.13) | (−2.56) | |
| Year FE | Y | Y | Y | Y | Y | Y |
| Region FE | Y | Y | Y | Y | Y | Y |
| Adj. R2 | 0.574 | 0.678 | 0.633 | 0.433 | 0.189 | 0.246 |
| N | 157 | 157 | 157 | 157 | 157 | 157 |
| (1) | (2) | (3) | (4) | (5) | (6) | |
|---|---|---|---|---|---|---|
| Gender Inequality Index (t + 1) | Maternal Mortality % | Adolescent Birth % | Higher Edu. Inequality | % Seats in Parliament | Labor Participation Inequality | |
| AbFII | −0.140 *** | −77.769 * | −21.079 *** | −1.950 | −3.450 | −7.306 |
| (−3.68) | (−1.92) | (−2.75) | (−0.65) | (−0.55) | (−1.57) | |
| log(GDP) | −0.030 *** | −0.200 | −6.709 *** | −0.514 | −3.764 ** | −1.152 |
| (−3.28) | (−0.02) | (−3.13) | (−0.57) | (−2.14) | (−0.83) | |
| GROWTH | 0.004 ** | 6.686 ** | 0.340 | 0.190 | −0.487 | 0.465 * |
| (2.42) | (2.52) | (0.80) | (1.14) | (−1.19) | (1.81) | |
| log(POP) | 0.008 ** | 13.446 *** | 1.077 | 0.650 ** | 0.244 | 0.199 |
| (2.47) | (3.77) | (1.62) | (2.46) | (0.45) | (0.49) | |
| GE | −0.002 *** | −2.469 *** | −0.651 *** | 0.025 | 0.267 ** | 0.107 |
| (−2.58) | (−3.11) | (−4.52) | (0.44) | (2.28) | (1.23) | |
| ROL | 0.000 | −0.521 | 0.160 | −0.057 | 0.041 | −0.123 * |
| (−0.93) | (−0.90) | (1.45) | (−1.31) | (0.46) | (−1.84) | |
| Year FE | Y | Y | Y | Y | Y | Y |
| Region FE | Y | Y | Y | Y | Y | Y |
| Adj. R2 | 0.917 | 0.807 | 0.877 | 0.227 | 0.248 | 0.560 |
| N | 200 | 200 | 200 | 200 | 200 | 200 |
| Panel A: Gender inequality (G-gap) in financial inclusion metrics | |||||||
| First Stage | Second Stage | ||||||
| (1) | (2) | (3) | (4) | (5) | (6) | (7) | |
| AbFII | G-gap inDP | G-gap in ACCT | G-gap in FIN_ACCT | G-gap in CARD | G-gap in SAVING | G-gap in BORROW | |
| AbFII | −0.632 ** | −0.428 ** | −0.507 ** | −0.558 ** | −0.194 | −0.071 | |
| (−2.35) | (−2.12) | (−2.14) | (−2.13) | (−1.43) | (−0.44) | ||
| log(GDP) | −0.063 *** | −0.030 | −0.027 * | −0.029 * | −0.016 | −0.006 | 0.003 |
| (−3.12) | (−1.55) | (−1.89) | (−1.75) | (−0.85) | (−0.62) | (0.30) | |
| GROWTH | −0.006 | 0.001 | 0.001 | 0.001 | −0.002 | 0.000 | 0.002 |
| (−1.37) | (0.26) | (0.46) | (0.36) | (−0.59) | (0.12) | (0.78) | |
| log(POP) | −0.001 | 0.001 | 0.002 | 0.003 | 0.004 | 0.004 * | 0.000 |
| (−0.21) | (0.17) | (0.55) | (0.81) | (0.81) | (1.77) | (−0.11) | |
| GE | 0.002 * | 0.001 | 0.000 | 0.001 | 0.001 | 0.001 | 0.001 |
| (1.77) | (1.26) | (0.59) | (0.81) | (0.95) | (1.32) | (0.99) | |
| ROL | −0.001 | −0.001 | 0.000 | 0.000 | 0.000 | 0.000 | 0.000 |
| (−0.61) | (−0.83) | (−0.21) | (−0.24) | (−0.45) | (−0.94) | (−0.36) | |
| INTERNET | 0.004 *** | ||||||
| (3.00) | |||||||
| Year FE | Y | Y | Y | Y | Y | Y | Y |
| Region FE | Y | Y | Y | Y | Y | Y | Y |
| Adj. R2 | 0.350 | ||||||
| F statistics | 8.97 | ||||||
| F statistics p-value | 0.00 | ||||||
| N | 199 | 199 | 199 | 199 | 199 | 199 | 199 |
| Panel B: Rich-poor inequality (RP-gap) in financial inclusion metrics | |||||||
| First Stage | Second Stage | ||||||
| (1) | (2) | (3) | (4) | (5) | (6) | (7) | |
| AbFII | RP-gap in DP | RP-gap in ACCT | RP-gap in FIN_ACCT | RP-gap in CARD | RP-gap in SAVING | RP-gap in BORROW | |
| AbFII | −0.407 * | −0.447 ** | −0.498 ** | −0.483 * | 0.161 | −0.197 | |
| (−1.94) | (−2.41) | (−2.46) | (−1.91) | (0.88) | (−0.94) | ||
| log(GDP) | −0.063 *** | −0.027 * | −0.042 *** | −0.040 *** | −0.027 | 0.029 ** | 0.014 |
| (−3.12) | (−1.91) | (−3.23) | (−2.79) | (−1.56) | (2.33) | (0.95) | |
| GROWTH | −0.006 | −0.002 | −0.001 | −0.001 | −0.004 | 0.002 | 0.000 |
| (−1.37) | (−0.73) | (−0.30) | (−0.19) | (−1.14) | (0.69) | (0.10) | |
| log(POP) | −0.001 | −0.005 | −0.001 | −0.001 | 0.001 | −0.001 | 0.001 |
| (−0.21) | (−1.39) | (−0.18) | (−0.17) | (0.19) | (−0.20) | (0.34) | |
| GE | 0.002 * | 0.001 | 0.001 | 0.002 ** | 0.002 | 0.000 | 0.001 |
| (1.77) | (1.38) | (1.63) | (2.16) | (1.41) | (0.66) | (0.67) | |
| ROL | −0.001 | 0.000 | 0.000 | −0.001 | 0.000 | 0.000 | 0.001 |
| (−0.61) | (−0.40) | (−0.54) | (−0.99) | (−0.09) | (−0.56) | (1.03) | |
| INTERNET | 0.004 *** | ||||||
| (3.00) | |||||||
| Year FE | Y | Y | Y | Y | Y | Y | Y |
| Region FE | Y | Y | Y | Y | Y | Y | Y |
| R2 | 0.350 | ||||||
| F statistics | 8.97 | ||||||
| F statistics p-value | 0.00 | ||||||
| N | 199 | 199 | 199 | 199 | 199 | 199 | 199 |
Disclaimer/Publisher’s Note: The statements, opinions and data contained in all publications are solely those of the individual author(s) and contributor(s) and not of MDPI and/or the editor(s). MDPI and/or the editor(s) disclaim responsibility for any injury to people or property resulting from any ideas, methods, instructions or products referred to in the content. |
© 2025 by the authors. Licensee MDPI, Basel, Switzerland. This article is an open access article distributed under the terms and conditions of the Creative Commons Attribution (CC BY) license (https://creativecommons.org/licenses/by/4.0/).
Share and Cite
Yoon, S.S.; Oh, I.; Park, S.S. Does Disproportionate Financial Inclusion Reduce Gender and Income-Group Inequality? Global Evidence. Int. J. Financial Stud. 2025, 13, 103. https://doi.org/10.3390/ijfs13020103
Yoon SS, Oh I, Park SS. Does Disproportionate Financial Inclusion Reduce Gender and Income-Group Inequality? Global Evidence. International Journal of Financial Studies. 2025; 13(2):103. https://doi.org/10.3390/ijfs13020103
Chicago/Turabian StyleYoon, Soon Suk, Ingyu Oh, and Shawn S. Park. 2025. "Does Disproportionate Financial Inclusion Reduce Gender and Income-Group Inequality? Global Evidence" International Journal of Financial Studies 13, no. 2: 103. https://doi.org/10.3390/ijfs13020103
APA StyleYoon, S. S., Oh, I., & Park, S. S. (2025). Does Disproportionate Financial Inclusion Reduce Gender and Income-Group Inequality? Global Evidence. International Journal of Financial Studies, 13(2), 103. https://doi.org/10.3390/ijfs13020103