Article

Towards Common Prosperity: Accelerated Depreciation Policy of Fixed Assets and Labor Income Share

1
The Institution for Sustainable Development, Macau University of Science and Technology, Taipa 999078, Macau
2
School of Economics, Anhui University of Finance and Economics, Bengbu 233030, China
*
Author to whom correspondence should be addressed.
Int. J. Financial Stud. 2025, 13(1), 46; https://doi.org/10.3390/ijfs13010046
Submission received: 31 December 2024 / Revised: 28 February 2025 / Accepted: 5 March 2025 / Published: 17 March 2025

Abstract

:
While achieving common prosperity necessitates a focus on the efficiency and equity of the primary income distribution, income inequality persists in China. As a critical tax incentive mechanism, China’s Accelerated Depreciation Policy (ADP) of fixed assets not only promotes important changes in corporate productivity and production methods but also significantly influences the primary income distribution within enterprises. However, current research offers a limited understanding of the importance of the ADP in the primary income distribution. Given that the core of the primary distribution lies in adjusting the labor income share, we regard 2014’s ADP as an exogenous “quasi-natural experiment”. After theoretically analyzing this policy’s effect on the labor income share of enterprises, our use of difference in differences (DID) validates our theoretical expectations with respect to China’s A-share listed companies during 2010–2022. The results show that the ADP can significantly increase enterprises’ labor income share; all hypotheses proved to be robust. The analysis of mechanisms shows that the ADP mainly affects the labor income share as it upgrades the corporate human capital structure as well as rent-sharing. Analyzing for heterogeneity, we find that positive effects due to the ADP affecting the labor income share are more prominent among private enterprises, medium and small-sized firms, companies with high financing constraints, capital-intensive industries, manufacturing enterprises, and those with a high level of skilled labor. The conclusions of this study contribute to uncovering the impacts of the ADP on income distribution, offering a clearer identification of particular mechanisms explaining the ADP’s effect on the labor income share. It holds significant theoretical value for understanding the micro-mechanisms of economic impacts generated by relevant policies. Furthermore, it provides policy insights in achieving common prosperity.

1. Introduction

Common prosperity is a key characteristic in the modernizing Chinese style, underscoring the central role of common prosperity in advancing this process. The essence of common prosperity lies in fairness and sharing, with its crux being the assurance that all people can partake in the fruits of socialist modernization. Currently, the principal contradiction facing Chinese society has evolved into the disparity between the ever-growing needs of the people for a better life and unbalanced and inadequate development. Against this backdrop, achieving common prosperity emerges as a crucial pathway to alleviating this principal contradiction. Income inequality, a significant manifestation of unbalanced and inadequate development, has adversely affected long-term economic growth and social stability, becoming a key constraint to the realization of common prosperity. As the source of people’s livelihood, income distribution has the most direct and profound impact on improving livelihoods and ensuring that the fruits of development are shared by the people. Therefore, perfecting the income distribution system, with the aim of narrowing income gaps and optimizing the income distribution pattern, has become a pivotal issue in the new stage of development. To this end, it is necessary to construct a coordinated and complementary institutional system encompassing primary, secondary, and tertiary distributions and to establish interest relationships among people that are compatible with the production relations. This is not only a direct method to ensure that the development outcomes are shared by all people but also a significant pathway to achieving common prosperity. Existing studies have shown that the key to effectively adjusting a distribution pattern for national wages lies with the initial distribution, whose core lies in adjusting the labor income share (Bai & Qian, 2009). The labor income share serves not only as the foundation for redistribution but also as a crucial component of common prosperity. Therefore, enhancing the labor income share has become an urgent requirement for the realization of common prosperity.
Recent studies have identified a declining labor income share as a global phenomenon since the 1990s (Harrison, 2005), a trend also observed in China. Extensive research studies, conducted to explore change determinants in the labor income share, have set their primary focus on perspectives such as stages of economic development (Young, 2010), technological progress (Acemoglu, 2003), structural transformation (Guo, 2019), and economic openness (Wang & Huang, 2017). Although these studies have provided explanations for the relatively low labor income share from various angles, few examine tax incentive policies’ impacts on the labor income share. As an important regulatory tool for income distribution, tax incentive policies inevitably participate in the within-enterprise allocation of production factors and, therefore, can influence the labor income share. The ADP, which lowers the amount of corporate income tax payable by advancing depreciation, is a key component of tax preferential policies. In October 2014, China’s finance ministry and taxation administration issued a notice, thereby implementing accelerated depreciation policies affecting recently acquired fixed assets in six pilot industries. Subsequently, in 2015 and 2019, this state policy was extended to key sectors in the light industry, textiles, machinery, and automotive sectors and was eventually extended to all manufacturing sectors. This gradual expansion reflects the continuous refinement and broadening of the policy to support enterprise technological upgrades and innovation. The ADP’s deployment of fixed assets has shown significant positive impacts on promoting corporate investment (Zwick & Mahon, 2017), increasing labor employment (Ohrn, 2019), and stimulating corporate research and development (R&D) innovation (Koowattanatianchai & Charles, 2015). However, whether this policy influences enterprises’ labor income share remains underexplored by the existing literature.
Theoretically speaking, in one sense, by governing fixed assets, this ADP can enhance production efficiency and scale, transform production methods, create new job opportunities, and improve labor productivity. This generates a labor creation effect, manifesting as capital augmenting labor and thus increasing the labor income share. In another sense, the ADP reduces capital’s relative value while increasing labor’s relative value (Li & Zhao, 2021), leading to a substitution effect between labor and capital that can decrease the labor income share. This ADP will lead to growth in enterprises’ labor income share if the “labor creation effect” is greater than the “substitution effect” and otherwise inhibit the enterprise labor income share. Moreover, this ADP may have differentiated impacts on labor forces with varying skill levels while influencing enterprises’ labor income share. In particular, for low-skilled workers, the ADP may exacerbate employment pressures and income inequality. Therefore, investigating the ADP’s effects on enterprises’ labor income share necessitates not only attention to the overall enhancement in the labor income share but also the consideration of its potential implications for labor forces with different skill levels. This aspect holds significant importance. Accordingly, this article leverages the quasi-natural experiment of the ADP implemented in 2014 to construct a DID model. By analyzing relevant indicators from enterprise data spanning from 2010 to 2022, our goal is to assess the causal effect attributable to the ADP in enterprises’ labor income share. The results indicate that the ADP effectively raises enterprises’ labor income share. The underlying mechanisms are twofold: First, enterprises optimize and upgrade their equipment through increased capital investment. The capital–skill complementarity effect enhances the demand for highly skilled employees, and this upgrades human capital by optimizing an enterprise’s employee structure while subsequently raising the labor income share. Second, the ADP also increases the rent-sharing for employees from enterprises, further promoting the rise in the labor income share. Heterogeneous analyses demonstrate this policy’s impact on an increasing labor income share, which is more pronounced among enterprises not owned by the state as well as among small and medium-sized enterprises and firms with strong financial constraints. Additionally, the effect is also significant in capital-intensive enterprises, manufacturing enterprises, and enterprises with high labor skill levels.
This paper makes the following marginal contributions: Firstly, the causal relationship of the ADP with the labor income share was tested on an angle corresponding to the income distribution. This can provide China’s government with effective policy tools to govern the primary income distribution at the market level. Few studies in the existing literature have addressed how the aforesaid policy relates to enterprises’ labor income share. Quantitatively evaluating the effect of the policy implementation is of great value for its subsequent revision and improvement and contributes to improving the level of scientific decision-making. Secondly, the exogenous policy impact was used to create a quasi-natural experimental situation to probe into the connection between the policy and the enterprise labor income share. This can more clearly identify the specific implementation mechanism of the policy when it comes to firms’ labor income share.
This article unfolds across the following parts. Section 2 is a literature review. Section 3 presents the institutional background and research hypotheses. Section 4 presents the research design, which involves the sources of data, the construction of a model, and the selection of variables. Section 5 presents the empirical results and analyses. Section 6 examines the ADP’s effect mechanism concerning enterprises’ labor income share and explores heterogeneity in the impact of the policy on enterprises with multiple characteristics. Section 7 presents the conclusions.

2. Literature Review

2.1. The ADP: Economic Impact

The following main types of studies are relevant to this paper. For a detailed overview, please refer to Table 1.

2.1.1. Research on Labor Force Employment

At the present time, studies have been conducted on the relationship of the ADP with the employment of the labor force, but conclusions are difficult to reach. As has been argued, the ADP has been of importance in increasing employment. For instance, House and Shapiro (2008) discovered that 100,000 to 200,000 job positions were created by the implementation of the policy. According to Ohrn (2019), the policy absorbed employment and slightly improved the wage level of employees. Garrett et al. (2020) found that the policy is conducive to increasing labor employment despite bringing certain employment costs. Nevertheless, some scholars hold the opposite attitude and maintain that the policy has not played a role in absorbing employment (Yagan, 2015; Button, 2019).

2.1.2. Research on the Enterprise Human Capital Structure

Throughout the existing research, only a small amount of the literature has studied the relationship between the ADP and enterprise human capital structure. Liu and Mao (2019) noticed that the policy prompted enterprises to update old equipment after its proposal, and new equipment replaced low-skilled workers. Tuzel and Zhang (2021), who used the policy in the United States (US), noted that to expand investment, enterprises affected by the policy will raise the number of employees engaged in skilled work and decrease the number of employees engaged in routine work. Research conducted by Liu and Zhao (2020) from the perspective of the human capital structure showed that this policy not only inspires enterprises to add new fixed assets but also promotes an improvement in the relative employment ratio of skilled labor and highly educated employees and improves the human capital structure due to the complementary effect of capital and skills.

2.1.3. Research on Enterprise Fixed Asset Investment

Since the ADP is characterized by investment promotion, research has mainly examined the investment effect of the policy at the early stage of research. Hall and Jorgenson (1967) empirically verified that the ADP can improve enterprise investment behavior by setting up a capital user cost model based on the analysis of three tax reforms in the US. Zwick and Mahon (2017) found that the policy can stimulate enterprise investment. Ohrn (2019) took American enterprises as the research object and found that the short-term tax incentives resulting from the ADP lower enterprise investment costs, and this positive effect is particularly significant for firms subject to financing restrictions. Fan and Liu (2020) reached a similar conclusion based on data from listed firms in China.
One study similar to this research problem is that by Xu et al. (2021), who discussed the capital investment brought about by the ADP. The study found that the tax incentives attributed to the policy effectively raise enterprise investment in fixed assets and increase enterprise labor income.

2.2. Influence Factors in the Labor Income Share

The following main types of studies are relevant to this paper. For a detailed overview, please refer to Table 2.

2.2.1. Measuring Labor Income Share

The labor income share means the “share of labor compensation in newly created economic value”. When it comes to the national revenue distribution, the macro-level measurement is indicated by labor income in proportion to gross domestic product. Through integration coordinating the macro-level measurement method of the income share of labor, some academics have used a micro-method for measuring the labor income share. Enterprises’ labor income share is broadly measured in two ways in the current literature: the proportion of wages to business revenues is one way (Wang & Huang, 2017; Xu et al., 2021) and value added is the other (Bai et al., 2008). In the relevant literature, value added can be calculated in two main ways. One is to employ the factor cost method to calculate value added, where value added is defined as “operating surplus + labor remuneration + fixed asset depreciation” (Wei et al., 2017); the other is to calculate value added using the income method, where value added is defined as “net production tax + labor compensation + operating surplus + fixed asset depreciation”. The labor income share is a key factor influencing income distribution patterns, whether it is measured from the macro or micro-level. However, current studies have found that the labor income share began to decline after the 1990s and became a global phenomenon (Harrison, 2005). The causes of its change have also attracted extensive attention from scholars.

2.2.2. Substitution Effect Between Capital and Labor

This kind of study shows that the change in relative prices in factors and the substitution between labor and capital changes the labor income share. Beginning in the 1980s, rapid information technology development has induced a continuous decline in capital goods’ relative values. The effect raises marginal output due to capital factors and results in the transfer of enterprises from labor factor input to capital factor input, which thereby affects the labor income share through deepening capital (Karabarbounis & Neiman, 2014; Bentolila & Saint-Paul, 2003). Benzell et al. (2015) constructed a two-stage overlapping generation (OLG) model and found that artificial intelligence will squeeze out the labor income share by lifting the ratio of intangible assets. Alvarez-Cuadrado et al. (2018) believed that capital bias is conducive to promoting technological progress, improves capital’s marginal output in relation to labor, stimulates capital elements’ input, and weakens the labor income share. The intensification of factor substitution due to increased rates of return on non-labor factors is a major reason for a reduced labor income share, according to Barkai’s (2020) findings. Acemoglu and Restrepo (2022) proposed that the elements of labor and capital are complementary, and capital investment obtains a greater return than labor, which makes technological progress converge to capital and hence reduces the labor income share.

2.2.3. Tax Policy

As one of the vital tools for regulating income distribution, the tax system has gradually become an area of concern for scholars. However, the association between the tax system and labor income share is currently controversial. Deran (1967) analyzed the relationship between national insurance tax and the distribution of factor income and concluded that introducing social security tax would reduce the capital distribution share, namely, increasing the labor income share. Nevertheless, other scholars have found that tax policies reduce the labor income share. Yang and Zhang (2021) studied a link joining “value-added tax (VAT) transformation” with the labor income share and then discovered that the investment incentive effect of the reform declined the labor income share. Li et al. (2021) proved that reducing the nominal income tax rate would reduce the labor income share.
In sum, the current literature has explained the economic effects brought about by the ADP and a shift in factors contributing to the labor income share from different angles. Unfortunately, no linkage between tax incentive policies and the labor income share has been sufficiently assessed. Studying the intrinsic relationship of the ADP with enterprises’ labor income share would be beneficial for objective evaluations concerning whether 2014’s ADP has a micro-effect. In addition, it can provide beneficial enlightenment for better executing tax incentive policies. For one thing, tax incentives are the most significant tool of the government. The ADP, which is a representative tax incentive policy, can encourage enterprises to upgrade equipment, elevate the depreciation amount of fixed asset investment, decrease taxable income, and participate in distributing enterprise production factors. Consequently, this exerts an impact on the labor income share. Further, quantitative research that makes use of micro-enterprise data is relatively lacking. Therefore, the ADP implemented in 2014 was chosen as an exogenous impact in this paper to identify the causality. This can avert the endogeneity problems resulting from missing variables and reverse causality commonly faced by previous studies in this field. At the same time, the micro-data of listed firms were utilized to overcome the errors that may be generated by macro-data, and the connection between the ADP and enterprises’ labor income share was studied.

3. Background and Theoretical Hypotheses

3.1. Background

In accordance with the design principle of the Corporate Income Tax Law, fixed assets will cause losses in the production process of enterprises, and their depreciation should be deducted when taxable income is calculated. In implementing the tax law, the methods for deducting fixed asset depreciation generally include two types. One is straight lines (average years), and the other is accelerated depreciation. The latter type is the method of double balance reduction, the sum-of-the-years method, and the shortened-number-of-years method. Normally, enterprises should depreciate fixed assets in accordance with the straight-line method. Compared with the straight-line method, the double-declining balance and sum-of-the-years methods do not change the depreciation period but increase the amount of depreciation at the beginning of new assets. However, the shortened life method is capable of increasing the annual depreciation amount and shortening the depreciation time.
For the time being, China has entered a phase of economic transition. Although the fundamentals of the macroeconomic situation remain good, the challenges and uncertainties confronted by micro-enterprises are increasing. Factors like insufficient investment capacity and huge external financing costs of enterprises restrict the conversion and upgrading of enterprises, which also has a serious influence on the upgrading of enterprise equipment and equipment investment. Tax incentives are among the government’s strongest policy instruments. Additionally, enterprise assets are mainly composed of fixed assets. Therefore, a notice was issued by the Chinese government in October 2014. It adopts a method of accelerated depreciation for firms’ recently acquired fixed assets across six pilot sectors. These six pilot industries include the special equipment manufacturing industry, biopharmaceutical manufacturing, information technology software and services, information transmission, computer instrument and meter manufacturing, communication and other electronic equipment manufacturing, and railways, shipbuilding, aerospace, and related transport equipment. The issuance of the notice was aimed at encouraging companies to make an investment in equipment renewal and scientific and technological innovation. Compared with the previous depreciation policy, this tax incentive policy has changed the previous provision that only fixed assets may be depreciated by following the straight-line method. Additionally, it allows for a reduction in the depreciation life by 60% of the stipulated life for other recently acquired fixed assets, apparatuses, or equipment beyond the limits for research and development purposes or chooses to use the double-declining balance method or the sum-of-the-years method to accelerate depreciation. Subsequently, Finance and Taxation [2015] No. 106 was issued in 2015. As stipulated by the notice, enterprises in four sectors of the industry, including automobiles, machinery, the light industry, and textiles, may adopt accelerated depreciation. In 2019, Finance and Taxation [2019] No. 66 was released. This once again expanded the industry coverage of the ADP to every manufacturing sector. More than 70% of the A-share listed firms in China will be affected by the ADP.
The ADP enables firms to freely choose the optimal “accelerated depreciation method”. This greatly increases the deductible amount of enterprise investment in fixed assets in the initial phase and reduces taxable income for initial investments; it equates to enterprises obtaining a zero-interest loan, which effectively reduces the enterprise tax burden (Liu & Zhao, 2020). In addition to this, the changes in the levels of output and capital investment brought about by the ADP should show positive and negative influence concerning enterprises’ labor income share, respectively. For this reason, the opportunity to implement the ADP in 2014 can be used to evaluate the association relating this policy to enterprises’ labor income share.

3.2. Theoretical Hypotheses

3.2.1. Relationship of the ADP to Enterprises’ Labor Income Share

Implementing the ADP influences enterprises’ labor income share by affecting decisions on workforce employment and the capital-to-labor ratio. This is primarily reflected in two aspects: the labor creation effect and the substitution effect.
The first is the labor creation effect. The tax incentives provided by the ADP can reduce the marginal cost of production for enterprises. This reduction encourages firms to increase their output scale and production efficiency, as well as to transform their production methods, and leads to new job creation as well as increased demand for labor (House & Shapiro, 2008). The labor creation effect resulting from the growth in the employment scale within firms contributes to an enhancement in the labor income share. Furthermore, Acemoglu and Restrepo (2018) proposed that the productivity improvement and capital accumulation brought by capital investment and technological progress will promote economic expansion and bring new tasks that can offset automation’s substitution effect on labor, thereby further consolidating an increased labor income share. To summarize, the following hypothesis was put forward.
Hypothesis 1a.
Introducing the ADP will increase the labor income share of enterprises.
The second is the substitution effect. Due to the ADP, enterprises can offset the amount of depreciation deductions ahead of time; doing so lowers their taxable income during the initial investment phase. This is equivalent to obtaining a “zero-interest loan”. The policy brings about additional tax incentive rates, changes the opportunity cost of enterprises using fixed assets, encourages enterprises to make more investments in fixed assets (Zwick & Mahon, 2017), and optimizes the infrastructure and production equipment of enterprises. The reduction in fixed asset prices brought about by this policy, in turn, renders the relative price of labor higher. Rational enterprises may use more capital to replace labor, which gives rise to a “substitution effect” between labor and capital, thereby reducing enterprises’ labor income share. To sum up, the following hypothesis was put forward.
Hypothesis 1b.
Introducing the ADP will decrease enterprises’ labor income share.
This analysis showed that introducing the ADP may have negative as well as positive influences when it comes to enterprises’ labor income share. The effect size due to labor creation or the “substitution effect” determines the final economic effect. The ADP contributes to an increase in enterprises’ labor income share when labor creation exceeds the “substitution effect” and otherwise inhibits enterprises’ labor income share. Hence, it needs to be confirmed by empirical tests.

3.2.2. Mechanisms of Human Capital Structure Adjustment

Implementing the ADP has expanded the investment range of fixed assets to a great extent and transformed production modes as well as relationships. This expansion, manifested through structural adaptations in enterprises’ human capital structure, affects labor and labor relations. Specifically, this paper holds that the policy may affect the human capital structure and then enterprises’ labor income share in the following ways.
The policy will raise the demand for laborers with high skills, facilitate updates to the human capital structure, and then raise enterprises’ labor income share. Additionally, this policy strongly encourages enterprises’ increased investment in fixed assets, which prompts companies to raise fixed assets and carry out research and development (R&D) innovation (Koowattanatianchai & Charles, 2015). Considering the enterprise labor force composition, increasing the size of fixed asset investment while upgrading the level of production technology has adjusted the labor preference of enterprises to a large extent (Song & Li, 2019). The reason is that a high-skilled labor force has a high professional level and abundant knowledge and skill reserves, which can meet the needs of firms to make R&D innovations. Hence, enterprises will continue to raise the demand for laborers with high skills. The new investment in fixed assets contains higher technology. Compared with the unskilled, skilled laborers can adapt to advanced technology more strongly. Therefore, new investment offers a better complement for skilled labor, which propels enterprises’ increasing need for skilled laborers. As proposed by Griliches (1969), according to the partial elasticity of substitution concept of Uzawa (1962), “the capital–skill complementarity” hypothesis studies relations between capital input and skilled labor input. Plentiful empirical studies in the previous literature have also validated the existence of complementarity between capital and skills (Duffy et al., 2004; Angelopoulos et al., 2015). When capital and skills are complementary, in order to achieve the optimal production level, an increase in fixed asset investment will bring about an increased relative demand concerning high skills in the labor force, thereby promoting an upgraded enterprise human capital structure. New technologies and methodologies embedded in human capital not only ensure the successful implementation of policies but also enhance employees’ “knowledge premium” and thus increase enterprises’ labor income share. The underlying mechanism is as follows: Since product markets often feature imperfect competition, enterprises can capture a portion of monopoly profits. However, the distribution ratio of these monopoly profits between labor and capital is not always equitable, primarily depending on labor’s bargaining power when it comes to negotiations. Generally, labor is at a relative disadvantage in such negotiations, hence its decreased share in monopoly profits, which is an important factor contributing to firms’ declining labor income share. Nevertheless, considering the “knowledge bargaining” power associated with highly skilled laborers as well as the typical situation in China’s labor market, where basic human capital is over-supplied while high-tech talents, such as technicians and professionals, are in high demand, high-skilled labor is positioned to negotiate from a stronger stance and possesses greater bargaining power. This dominance in negotiations leads to a predominant role in profit distribution, ultimately manifesting as an increased labor income share among firms.
In addition, the ADP can support optimal human capital structures because it crowds out some unskilled labor and then decreases the labor income share. An important theory used for studying the association between capital and unskilled labor is the factor substitution theory. Hicks (1932) believed that technology will develop to replace a factor when that factor’s price is relatively high, which thus forms biased technological progress. From both theoretical and empirical perspectives, Acemoglu and Restrepo (2018) demonstrated that enterprises will adopt capital as a substitute for labor when the price of labor becomes relatively expensive, which thus improves the labor productivity of enterprises. The ADP cuts down the cost of increasing fixed asset input, and the price of unskilled labor experiences a relative rise. As a result, enterprises may directly replace a considerable portion of routine and repetitive jobs and hire less unskilled labor in the production task chain. This is manifested in the increased ratio of highly skilled laborers in companies and promotes their transformations and upgrades in terms of their human capital structure. Meanwhile, considering that the increase in fixed asset investment has a certain bias towards the substitution of the labor sector, the crowding out of unskilled labor will strengthen skilled labor’s relative status and further enhance the wage level and bargaining power of skilled laborers. This is particularly obvious in the structural contradiction of the shortage of highly skilled labor in the Chinese labor market as a whole. Therefore, the ADP is expected to optimize and upgrade the structure of human capital by squeezing out some unskilled labor to thereby raise enterprises’ labor income share.
The above analysis showed that introducing the ADP will be beneficial for optimized adjustment in enterprises’ human capital structure, which further exerts an influence on enterprises’ labor income share. To conclude, the following assumption was put forward:
Hypothesis 2.
The update of the human capital structure brought about by introducing the ADP contributes to increasing enterprises’ labor income share.

3.2.3. Mechanisms of Rent Sharing

The term rent sharing denotes companies’ procedures of paying their laborers excess amounts in light of their own performance. The ADP can offer tax relief to all types of new fixed asset investments of enterprises and reduce the enterprise tax burden. The tax incentives brought by the ADP have created a considerable windfall, raised volumes of rent sharing among firms and workers (Zhang et al., 2021), and boosted enterprises’ labor income share. To be specific, this article believes that the tax incentives attributed to the ADP affect rent sharing and, thus, enterprises’ labor income share, in the following ways.
First, the most direct consequences of the reduced tax burden caused by the introduction of the ADP are to help improve the after-tax profits of companies, enhance the ability of companies to pay employee wages, and increase the rent that employees can share from companies (Arulampalam et al., 2012). As a result, enterprises’ labor income share can be increased. Second, tax incentives achieve rent sharing by promoting the investment of enterprises and raising their productivity and business performance, which thus affects the labor income share of enterprises. Auerbach (2018) pointed out that tax incentives will stimulate firms to expand capital investment, which thereby enables employees to share more of the rent resulting from the rise in productivity and business performance caused by capital deepening. The ADP mainly aims to promote enterprise capital investment, which has been verified in the existing research. Beyond that, Fan and Liu (2020) also found that the ADP brought about tax incentivization that also raised companies’ total factor productivity. Therefore, it is reasonable to believe that the tax incentivization attributable to the ADP can promote enterprise capital investment, raise the productivity and business performance of enterprises, and thus raise the amount of rent sharing among companies and employees. This, in turn, affects enterprises’ labor income share. In short, the following hypothesis was put forward:
Hypothesis 3.
Introducing the ADP will influence enterprises’ labor income share by raising the rent shared by employees from companies.

4. Research Design

4.1. Data

For this article, we sampled A-share listed firms from 2010 to 2022; the initial data was obtained from the China Stock Market & Accounting Research Database. The major reason for choosing this time window was that the ADP was officially implemented in 2014. In addition, the time window of the first four years not only ensured the sufficiency of samples but also avoided the policy confounding effect caused by the long time span. Consistent with the existing literature, the following processes were performed on the data in this paper after obtaining the initial samples: (1) samples listed later than 2014 were excluded; (2) enterprises in an abnormal state during the period of sample elimination were excluded; (3) listed companies in the industries of finance and insurance were excluded; (4) samples whose main variables were missing were excluded; (5) data belonging to the pilot industries of the four major fields added in 2015 were excluded; and (6) data belonging to the pilot industries added in 2019 were excluded, which guaranteed that the enterprises in the control group were completely unaffected by the policy.

4.2. Model

The ADP introduced in 2014 was taken as an exogenous shock, and its effect was identified through a DID model. The purpose was to better estimate the association linking this policy with enterprises’ labor income share. Following Beck et al. (2010), the year when each industry was affected by the ADP and the year after that were set as 1, and the reverse was set as 0. Then, the Treat × Post variable was set according to the double difference in whether it is influenced by the policy and impact time. Moreover, we set up a model, as follows, to assess the connection between the ADP and enterprises’ labor income share:
L S i t = α + β T r e a t i × P o s t t + γ C o n t r o l s i t + λ i + δ t + ε i t
In model (1), i and t respectively indicate enterprise and year. LSit stands for the labor income share of the enterprise. Treati is a dummy variable. At 0, an enterprise does not belong to one of the six pilot industries (the control group); at 1, the enterprise is in one of the six pilot industries (the treatment group). Postt are time dummy variables. A post value of 1 indicates an enterprise sample period from 2014 onward; 0 indicates otherwise. Controlsit indicates a range of control variables. λi and δt respectively represent fixed effects for enterprise and year. εit refers to random perturbation. In this paper, the focus was placed on the coefficient α of the interaction term (Treat × Post), which portrays differences in the labor income share when comparing enterprises in the control and treatment groups, both before and after the ADP’s introduction in 2014. If the expected α is positive, implementing the policy has promoted a rise in the labor income share for the pilot industry.

4.3. Description of Variables

  • Definition of treatment group industries. In this paper, pilot industries were defined with reference to the notice. The remaining industries were considered to be non-pilot industries, among which industry classification standards referred to the Industry Classification Code of National Economy (GB/T4754−2011).
  • Explained variables. In the new era, raising the labor income share has significance for narrowing the income gap. Therefore, we selected the enterprise labor income share as the explained variable. Following Bai et al. (2008), value added (of the factor cost method) was used for estimation. That is to say, the enterprise labor income share amounts to revenues allotted for staff/(business revenue − business cost + cash paid to and for staff + fixed asset depreciation).
  • Explanatory variables. Treat × Post is the core explanatory variable that this research focuses on. This indicates that an enterprise enjoying the ADP has a value of 1 from the start date of the policy and thereafter, and 0 otherwise.
  • Control variables. In this paper, control variables were mainly chosen as follows: Size, Age, Lev, Indept, Roa, Grow, PPE, Capital, Top1, GDP, and IndStr. Table 3 presents detailed definitions for the control variables.

4.4. Descriptive Statistics

Table 4 outlines descriptive statistics. The symbol N is used to represent the number of observations. The labor income share (LS) has a maximum value of 0.7176, a minimum value of 0.0569, and a standard deviation of 0.1201, which implies that different enterprises show large differences in their labor income share. The share of labor income has a median value of 0.2805, below the average value of 0.2923. In other words, the data on the labor income share show a right-skewed distribution, which indicates that Chinese-listed enterprises generally have a low labor income share.

5. Results and Discussion

5.1. Baseline Regression Results

Model (1) was used to regress the sample data, with an aim to test the causal relationship between the ADP and enterprise labor income share for 2014. Our analysis presents the DID results in Table 5. In column (1), control variables are not included, and the interactive term (Treat × Post) has a coefficient of 0.0180. This result has significance at the 1% level, which indicates, to a certain extent, that implementing the ADP is able to remarkably strengthen pilot enterprises’ labor income share. Column (1) lacks a sufficient number of control variables, which may easily cause bias in the DID estimation results. Therefore, column (2) introduces control variables, including year fixed effects (Year FE) and firm fixed effects (Enterprise FE), that affect the distribution of factor incomes. The interaction term (Treat × Post) has a coefficient of 0.0177. This signifies that the ADP has significantly increased pilot firms’ labor income share. Hence, the labor creation effect brought by the execution of the policy is more dominant than the substitution effect and, in general, positively affects pilot firms’ labor income share. Table 5 presents the baseline regression results.

5.2. Robustness Test

5.2.1. Dynamic Effect Analysis
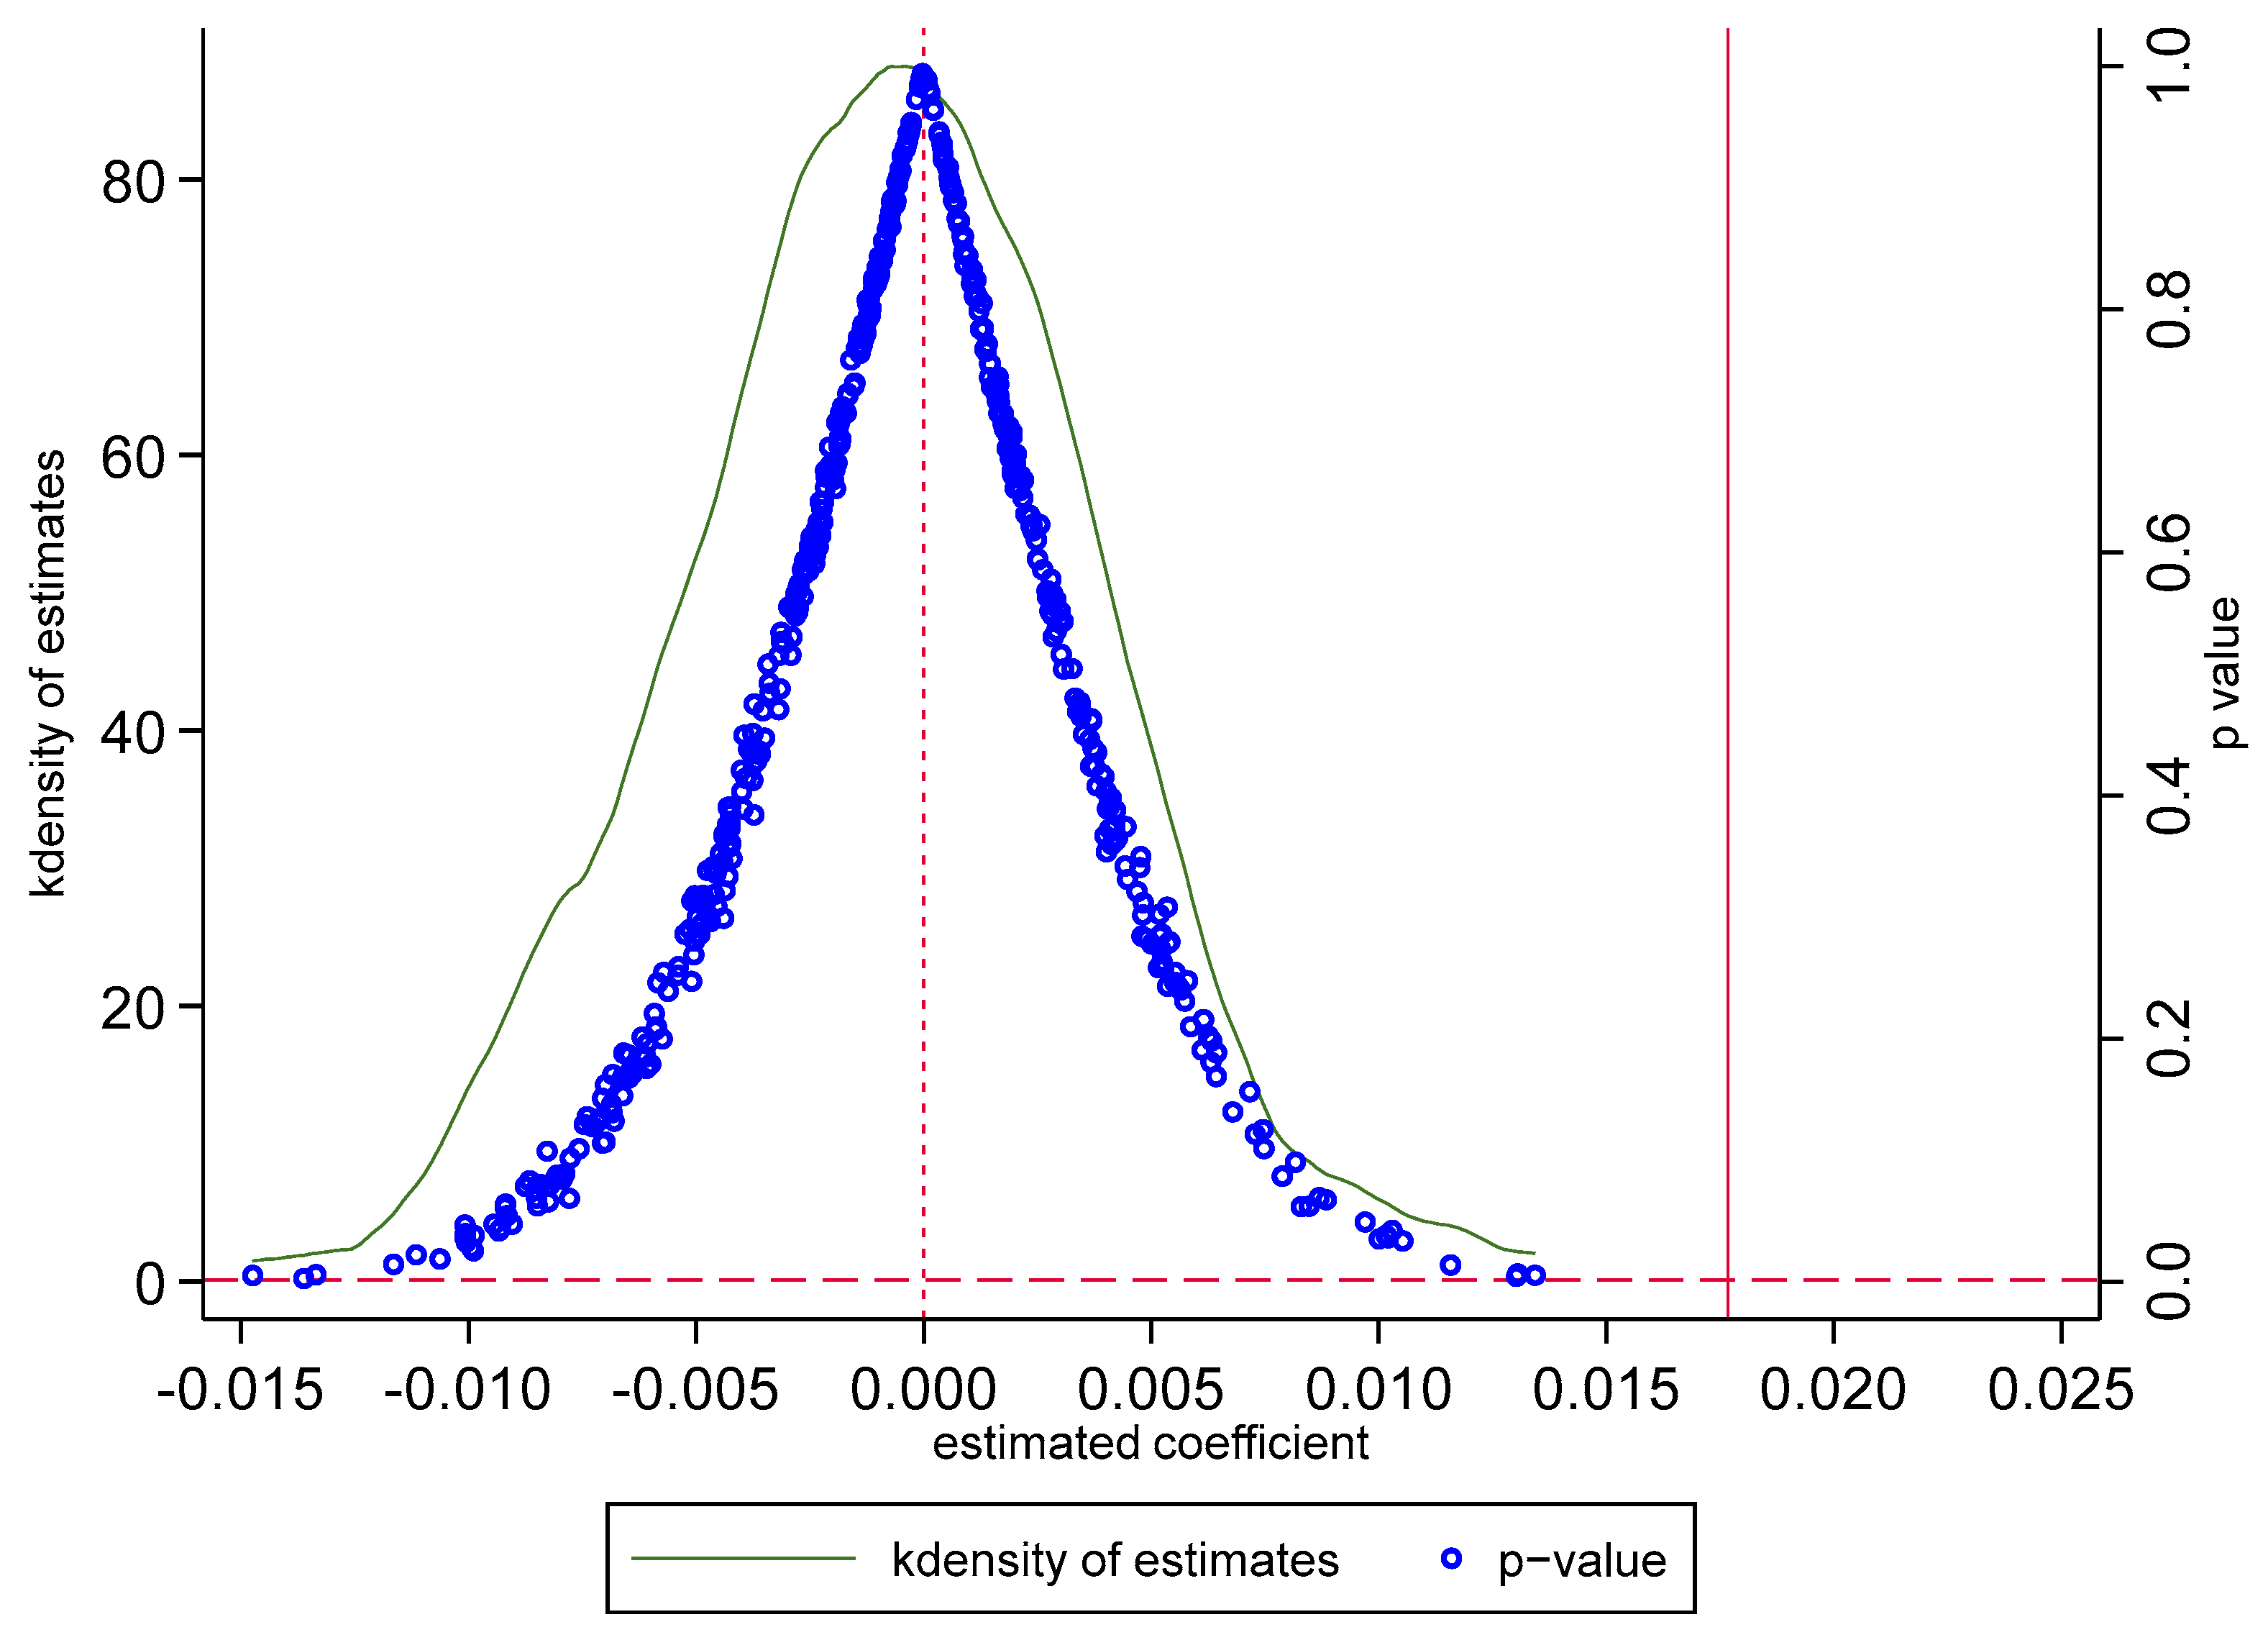
Hypothetically, a DID model’s effectiveness is premised on both the control and treatment groups meeting the parallel trend. In specific terms, the variation trend in the treatment and control groups’ enterprise labor income share should remain parallel until the execution of the ADP in 2014. Meanwhile, the results of a baseline regression cannot reveal the existence of a time difference between the introduction and landing of new policies, namely, the policy lag effect. In view of the above problems, this paper followed Chen et al. (2018) by adopting an event study method and thereby conducted a parallel trends test. We confirmed the time when the ADP really plays a role. To be specific, 2013 (the year before the policy’s publication) was taken as the base year, and the following econometric model was constructed:
L S i t = α + 2010 2022 θ t T r e a t i × Y e a r t + γ C o n t r o l s i t + λ i + δ t + ε i t
In Formula (2), Yeart is the year-by-year dummy variable and θt reflects the policy’s relative influence on the labor income share in the treatment group during year t. The other variable settings are not different from Formula (1). Theoretically, the estimated coefficient of θt for 2010–2013 should not be statistically significant if the hypothesis of a parallel trend was satisfied. Figure 1 illustrates the dynamic effect analysis. The interaction term’s estimated coefficient showed no significant difference from 2010 to 2013, which revealed that the enterprise labor income share presented a parallel trend before the policy’s execution. No significant difference was detected in the prior trend, which suggested that the assumption of a parallel trend between the control and treatment groups was valid, and the key hypothesis of the research analysis by using the DID model was valid. Further, the interaction term showed a significantly positive estimated coefficient in the years after the execution of the policy in 2014, which indicates that implementing the policy positively promoted the labor income share in the treatment group.

5.2.2. Placebo Test

Dynamic effect analysis can basically confirm that an increased enterprise labor income share is a result of the ADP’s execution. To avoid the challenge brought by contingency events, that is, the baseline regression results happen to be caused by some random factors, this article drew on the practice of Moon (2022) by conducting a placebo test. Specifically, a random sampling method was used to randomly generate treatment groups. Then, the coefficient estimate of the impact of “pseudo-treatment” firms on the share of the labor income was obtained by multiplying the year interaction term. To improve the credibility of the placebo test, we repeated Moon’s operation 500 times, thus obtaining a nuclear density distribution and corresponding p-values of the 500 estimated coefficients. The baseline regression coefficient of 0.0177 is markedly greater than the estimated coefficient of the counterfactual simulation. Figure 2 presents the p-values and coefficient kdensity of the estimates in the random sampling process.

5.2.3. Double Machine Learning Model

Studies have increasingly integrated machine learning models with the DID methodology to assess the economic impacts of specific policies. Traditional baseline regression models are prone to the “curse of dimensionality” and multicollinearity issues when a substantial number of control variables are included. In contrast, the primary advantage of double machine learning lies in its ability to incorporate a diverse range of machine learning algorithms, thereby encompassing a wider array of control variables to mitigate bias stemming from insufficient control variables. Accordingly, leveraging the analytical framework proposed by Zhang and Li (2023), this study incorporated all the control variables as quadratic terms into the double machine learning model for analysis. Dividing the sample into a ratio of 1:4, the random forest algorithm was employed to predict the primary regression outcomes. This paper presents the double machine learning (DML) results in Table 6. Column (1) reveals the outcomes derived from a model that controls for two-way fixed effects; it incorporates the control variables’ linear terms. Meanwhile, column (2) extends this analysis by including these variables’ quadratic as well as linear terms. The coefficient of the interaction term (Treat × Post) consistently exhibits a significantly positive value, thereby affirming the prior hypothesis that the ADP’s implementation effectively enhances enterprises’ labor income share.

5.2.4. Alternative Metrics for the Labor Income Share

In this article, different methods were also adopted to measure the labor income share and re-tested as follows: First, to circumvent the measurement deviation resulting from the fluctuation in the labor income share index within [0, 1] on the estimation results, a logistic transformation was used to map it within (−∞, +∞) by using the research of Wei et al. (2017) for reference and the original measurement method of the labor income share. In other words, LS/(1 − LS) was used, and the natural logarithm (LS_1) was taken to assess the labor income share. Second, following Wang and Huang (2017), the listed companies’ annual reported “staff wages” were divided by the “total operating income” (LS_2) to take the place of the original explained variable. In Table 7, columns (1) and (2) successively represent test results following the replacement of the explained variables. The core explanatory variable still has a significant and positive coefficient, thus proving that this article’s results are robust.

5.2.5. Expected Effect Test

Considering that the introduction of the ADP in 2014 may have been somewhat targeted, the enterprises concerned might have anticipated the implementation of this policy and altered their corresponding decision-making behaviors accordingly, which could potentially violate the assumption of parallel trends (Liu & Zhao, 2020). For the purpose of excluding an expected effect impact, data for 2013 (the year before the execution of the policy) were excluded here, and the regression results are demonstrated in Table 7, column (3). The regression results demonstrate that the core explanatory variable has a significantly positive coefficient and has not undergone any fundamental changes, which indicates that no expected effect influences the common trend hypothesis. This proves the robustness of our baseline regression results. That is to say, the ADP contributes to an increased enterprise labor income share.

5.2.6. Exclusion of Other Policy Implications for the Sample Period

During 2010–2022, other policy shocks in the same period are also likely to influence the enterprise labor income share. For instance, China piloted two tax policies, the VAT transformation and an accelerated depreciation tax policy, on a smaller scale for companies in the three northeastern provinces in the year of 2004. This pilot may have produced a policy mixed effect. To exclude other policies’ influence on our results, the test was performed again after the sample of firms in these three northeastern provinces was excluded. Table 7, column (4), displays our regression results. The results indicate a significantly positive coefficient for the core explanatory variable, thereby suggesting that the ADP has indeed increased the labor income share of pilot enterprises.

5.3. Further Analysis

In the theoretical analysis, it was found that the ADP’s association with enterprises’ labor income share is determined by its labor creation and substitution effects. For one thing, the ADP will expand the scale of enterprise production, provide new tasks, lift the demand for the labor force, and increase the enterprise labor income share. For another, increased investment in fixed assets may make enterprises use more capital to replace labor and decrease enterprises’ labor income share. To further clarify the existence of labor creation and substitution effects, an attempt was made in this paper to conduct a regression analysis with employment and the capital–labor ratio (KL) as explained variables. Among them, the employment index of the employees employed by enterprises was obtained from the research of Dai et al. (2013), whereby the logarithm of the number of enterprise employees was used to portray it. The capital-labor ratio was treated by taking the logarithm.
Table 8 shows the specific regression results. Column (1) displays regression results for the employment of workers (lnemp) as the explained variable. The coefficient of the result is significant at the 1% level, which means that the ADP has significantly increased the enterprise labor force. That is, the ADP will produce a labor creation effect. Column (2) gives regression results where the capital–labor ratio (lnkl) is the explained variable. The coefficients of the interaction term (Treat × Post) are significant at the 5% level, meaning the ADP promotes an increase in enterprises’ capital–labor ratio, where capital substitutes the labor force to a certain extent. That is, the ADP will produce a substitution effect. The baseline regression results and parallel trend test above show an increased labor creation effect that, thanks to the policy, is higher than that of the substitution effect. This further indicates that the labor creation effect brought about by the policy has a greater impact, though the ADP triggers a labor–capital substitution. In addition, under the stronger labor creation effect, the ADP will increase enterprise output, promote the expansion of the labor employment scale, and boost an increase in enterprises’ labor income share.

6. Mechanism Test and Heterogeneity Analysis

6.1. Mechanism

The theoretical analysis described above signified that implementing the ADP results in the demand for laborers with high skills through the capital–skill complementary effect and crowds out part of low-skilled labor through the capital–unskilled substitution effect. Resultantly, the human capital structure is optimized. This raises enterprises’ labor income share. However, implementing the ADP raises the rent shared by employees from enterprises, which will bear on enterprises’ labor income share. Specific impact channels and mechanisms are analyzed below.

6.1.1. Impact on Human Capital Structure

In the foregoing theoretical analysis, the ADP will lower the cost of increasing fixed asset investment, and enterprises may directly replace certain repetitive, routine, unskilled labor. The ADP has a huge impetus for firms to raise the investment of fixed assets. In a bid to achieve the optimization of production levels, increasing the investment of fixed assets will raise the input of skilled labor. To verify this speculation, the relationship between the ADP and labor, skilled or unskilled, was examined. To be specific, the method of Xiao et al. (2022) was used for reference. Labor skill levels are measured by educational attainment, with individuals possessing at least master’s degrees categorized as skilled labor (skill), and those with a bachelor’s degree or lower categorized as unskilled labor (unskill). Table 9 shows, in columns (1) and (2), the estimated results by the number of employed skilled and unskilled laborers, respectively. Column (1) presents a regression analysis, suggesting that the incentive policy promotes the hiring of skilled labor in pilot enterprises. Furthermore, column (2) reveals a negative, albeit not statistically significant, coefficient for the interaction term (Treat × Post). This indicates a limited effect attributable to the ADP on the employment of unskilled labor. This may be attributed to the fact that while the ADP replaces some unskilled labor, it also generates new tasks and occupations by expanding the scale of production (Acemoglu & Restrepo, 2018).
Further, this paper drew on the ideas of Xiao et al. (2022) and used the skill rate (skill_rate) for skilled laborers in proportion to the total labor force as a test of upgrading the human capital structure. The purpose was to verify whether the adjustment of the human capital structure by the ADP can raise the labor income share. The results of this regression analysis, illustrated in Table 9, in column (3), include the test results for the association between the policy and the structure of human capital. It can be observed that the interaction term (Treat × Post) has a significant positive coefficient, which indicates that the ADP promotes optimizing and upgrading enterprises’ human capital structure. Column (4) further tests the association relating the adjustment of human capital structure to the labor income share, resulting in a greatly positive regression coefficient at a 1% level. This implies that upgrading the enterprise human capital structure significantly increases the share of labor income. The above results fully show that the ADP can increase enterprises’ labor income share by propelling updates in the human capital structure.

6.1.2. Impact on Enterprise Rent

The theoretical analysis in the above part showed that the reduction in the tax burden resulting from the introduction of the ADP can help improve the after-tax profits of companies, enhance the ability of companies to pay employee wages, and increase the rent that employees can share from companies. The tax incentives attributed to the policy can promote corporate capital investment while improving the productivity and performance of enterprises to achieve rent sharing. An increased share in the rent shared by employees from enterprises will promote that of enterprises’ labor income share. If this mechanism is established, the enterprise rent will tend to increase after the execution of the ADP. We referred to (Kline et al., 2019) to obtain estimates using the logarithm of value added per capital for measuring the enterprise rent. In this paper, the logarithm of corporate rent (lnrent) was used as the explained variable to test the association between the execution of the ADP and corporate rent. Table 9 presents the results of the mechanism analysis. The results of the regression are demonstrated in Table 9, column (5). Our results demonstrated that the interaction term (Treat × Post) has a significantly positive coefficient, which indicates that implementing the ADP promotes a rise in the enterprise rent. Column (6) further tests the association between the enterprise rent and labor income share and finds a greatly positive regression coefficient at the 1% level. This implies that increasing the enterprise rent significantly promotes the share of labor income. Therefore, the ADP will increase rent sharing among employees from enterprises and drive a rise in enterprise labor.

6.2. Heterogeneity Analysis

6.2.1. Ownership Differences

In accordance with the ownership nature of listed companies, the sample was categorized into state-owned and private firms for testing. The state-owned firms include central state-owned, local state-owned, and collective firms. In Table 10, columns (1) and (2) display specific regression results. These results showed that the ADP has a particularly huge impact when it comes to private firms’ labor income share but an insignificant influence on state-owned firms. There may be two reasons for this. First, state-owned firms have a significantly higher labor income share than private ones; continuing to increase the labor income share will bring greater cost pressure to state-owned firms. Second, private firms, which mainly undertake economic rather than social functions, can respond to changes in production factors more quickly compared with state-owned firms. They can also use the capital increment brought by the ADP to update machinery and equipment and adjust the staff structure to increase enterprises’ labor income share.

6.2.2. Scale Difference

Based on enterprises’ median size by industry, we separated our sample into small, medium, and large firms. Table 10 demonstrates, in columns (3) and (4), specific regression results. The results for the core explanatory variable (Treat × Post) of the sample of large-scale enterprises showed a coefficient above 0 but insignificant; for small and mid-sized enterprises, it was markedly greater than 0 at the 1% level. This indicates that small and mid sized enterprises’ labor income share has increased significantly after the execution of the ADP, while that of large enterprises has not changed significantly. This may be because, in the case of tax incentives, the smaller the scale of an enterprise, the less difficult it will be to adjust its own business decisions according to policy incentives and the more likely the input of production factors will change. In the meantime, mid- and small-sized enterprises own fewer fixed assets in comparison with large-scale enterprises, and the update and adjustment of fixed assets are relatively easy. This is similar to the study by Zwick and Mahon (2017). They noticed that small enterprises make a much stronger investment response in the case of changes in the accelerated depreciation tax policy on investment and a much higher share of equipment investment (capital investment) than large enterprises. Hence, the tax incentives ascribed to the execution of the policy will reduce the marginal production cost of mid- and small-sized enterprises with weak strength. The profit margin will be significantly improved, and the willingness of enterprises to replace equipment will be enhanced. To realize the introduction of new fixed assets as soon as possible, the demand of enterprises for the number of skilled laborers will also experience a significant increase, which thus raises enterprises’ labor income share.

6.2.3. Differences in Financing Constraints

In theory, external financing is required to renew equipment and make an investment in fixed assets, and financial constraints will impact the effect attributable to an accelerated depreciation policy (Tirole, 2006). Therefore, an SA index was constructed in this study to measure the financing constraint environment of an enterprise by using the study of Hadlock and Pierce (2010) as a reference. An enterprise is defined as having a high financing constraint if its SA value is above the median SA index of all sample firms in the current year; otherwise, the enterprise is defined as having a low financing constraint. Table 10 presents the results of the heterogeneity analysis. Columns (5) and (6) illustrate specific results. The regression results showed that the core explanatory variable has a greatly positive coefficient at the 1% level; this coefficient is insignificant for firms with low financial constraints. These results showed that the ADP generates a larger output effect in enterprises with high financing constraints, which drives the increase in the enterprise labor income share. The effect can be ascribed to the ADP’s reduction in the total present value of income tax payable by enterprises, and enterprises save the time cost of depreciation, which is equal to obtaining a zero-interest loan. For firms with high financing restrictions, implementing the policy alleviates the cash flow pressure of enterprises to a large extent, which helps to incentivize enterprises to increase their fixed asset investment. Considering that capital and skills are complementary, fixed assets need to be equipped with a corresponding skilled labor force to cooperate with them. As a result, more skilled laborers will be employed to expand the production scale, with the aim of increasing enterprises’ labor income share.

6.2.4. Differences in Factor Intensity

The ADP is anchored in enterprises’ fixed assets, with the goal of accelerating the renewal of fixed assets and promoting the transformation and upgrading of enterprises. There are certain differences in the proportion of fixed assets among industries with different factor intensities. Capital-intensive industries have a larger proportion of fixed assets compared to labor-intensive industries. When facing the tax incentives of the ADP, capital-intensive industries may be more sensitive to the policy. Following Liu et al. (2023), we used the logarithm of the ratio of net fixed assets to the number of laborers to measure the factor intensity of enterprises. The samples showing a factor intensity greater than the median were counted as capital-intensive enterprises, and the rest were categorized as labor-intensive enterprises. A group regression was then performed. In Table 11, columns (1) and (2) illustrate specific results showing significant, positive coefficients for the core explanatory variable (Treat × Post) in capital-intensive enterprises. By contrast, in labor-intensive enterprises, the coefficient of the core explanatory variable (Treat × Post) is not significant. Therefore, the ADP’s effect is stronger when it comes to increasing labor-intensive enterprises’ labor income share. This may be because capital-intensive industries have a greater demand for and dependence on fixed assets. After the implementation of the policy, enterprises with a larger proportion of fixed assets enjoy greater tax incentives under the ADP. Encouraged by the renewal of equipment, enterprises accelerate their depreciation of current fixed assets to maximize the utilization and production efficiency of equipment; they also increase the working hours of equipment. These measures are expected to expand production scales, thereby increasing labor demand while promoting increased labor income shares.

6.2.5. Differences Between Manufacturing and Service Industries

Different industries exhibit varying degrees of factor intensity, elasticity of substitution between capital and labor, and levels of capital deepening, leading to significant differences in the ADP’s impact when it comes to the labor share. To investigate these discrepancies further, this study categorized industries into the service and manufacturing sectors and conducted grouped regression analyses. Table 11 presents the results of the heterogeneity analysis. In Table 11, columns (3) and (4) illustrate specific results revealing one significant and positive interaction term coefficient at the level of 1% in manufacturing enterprises, whereas in service enterprises, the positive coefficient lacks statistical significance. This suggests that the ADP’s effect is stronger in terms of an increased labor share among manufacturing enterprises, likely due to their higher reliance on fixed assets. The policy more effectively reduces investment costs for these firms, thereby stimulating increased investment and production scale expansion, which, in turn, increases the labor demand and labor share.

6.2.6. Differences in Labor Skill Levels

The ADP’s influence on the labor income share may vary by workforce skill structure. By utilizing the mean proportion of technical personnel in enterprises, firms were divided into two groups: low-skill structure and high-skill structure. The regression results are presented in columns (5) and (6) of Table 11. These results suggest that the ADP has a stronger positive impact when it comes to enterprises’ labor income share given high-skill structures. This is attributed to the fact that employees with high skill levels possess greater knowledge and technology, making them less substitutable, thereby resulting in a more significant positive effect attributable to the ADP on the labor income share.

7. Conclusions

Raising the proportion of labor compensation in national income and maintaining the relative stability of the labor income share are essential practical measures for realizing the sharing of development outcomes among the populace and advancing common prosperity. Given data for China’s A-share listed firms between 2010 and 2022, the introduction of Document No. 75 of Finance and Taxation was taken as an exogenous shock to assess associations between the ADP for fixed assets and enterprises’ labor income share. Our research results show that the ADP significantly increases enterprises’ labor income share. The mechanism analysis indicates that the ADP’s impact on the labor income share is mainly realized through upgrades in the human capital structure and increases in rent sharing. The heterogeneity analysis shows that the ADP exerts a significant influence on private enterprises’ labor income share and on that of small and medium-sized enterprises. It also exerts a significant influence on firms with high financing constraints, capital-intensive enterprises, manufacturing enterprises, and those that rely on skilled labor. These findings provide further proof concerning the ADP’s mechanism and basic logic as it affects enterprises’ labor income share.
The following policy recommendations are put forward. First, the ADP should be used to significantly raise enterprises’ labor income share. From the angle of promoting common prosperity, the ADP should keep being implemented to improve the distribution of enterprises’ labor income share. By executing the policy, China’s government is supposed to concentrate on the specific process of its role and encourage and guide its labor creation effect on the level of labor quantity. Beyond that, it should be vigilant and weaken the corresponding level of the substitution effect and its negative impact to maximize the labor income share. Second, the government that implements the ADP policy should relatively enhance the demand of enterprises for high-skilled talents and upgrade the human capital structure of enterprises. Therefore, the government can provide corresponding supporting facilities and policies to enhance the education and skill training of workers. In this way, it can become accustomed to labor market changes and new tasks and occupations, reduce the mismatch of skills owing to enterprise upgrading and capital expansion, and better enable skilled labor to master the use of technological innovations while stabilizing and enhancing laborers’ income. Third, the ADP helps to improve distribution patterns by increasing the labor income share. However, it still makes a huge difference for enterprises of various types, thus affecting the labor income share of private, mid- and small-sized firms, and firms with high financing constraints to a great degree. Therefore, government departments should give prominence to the differentiated features of firms when laying down policies. More precise policies can be implemented according to the characteristics of different enterprises to ensure the accurate landing of policies and thus maximize the policy effect.

Author Contributions

Conceptualization, B.Z.; data curation, Y.Y.; formal analysis, Y.Y.; funding acquisition, B.Z.; investigation, Y.Y.; methodology, Y.Y. and B.Z.; project administration, B.Z.; resources, B.Z.; software, Y.Y.; supervision, B.Z.; validation, Y.Y.; visualization, Y.Y.; writing—original draft, Y.Y.; writing—review and editing, B.Z. All authors have read and agreed to the published version of the manuscript.

Funding

This research received no external funding.

Informed Consent Statement

Not applicable.

Data Availability Statement

The datasets generated during and/or analyzed during the current study are available in the China Stock Market & Accounting Research Database repository, https://data.csmar.com/ (accessed on 4 March 2025).

Conflicts of Interest

The authors declare no conflicts of interest.

References

  1. Acemoglu, D. (2003). Labor-and capital-augmenting technical change. Journal of the European Economic Association, 1(1), 1–37. [Google Scholar] [CrossRef]
  2. Acemoglu, D., & Restrepo, P. (2018). Artificial intelligence, automation and work. In The economics of artificial intelligence: An agenda. IDEAS Working Paper Series from RePEc. University of Chicago Press. [Google Scholar]
  3. Acemoglu, D., & Restrepo, P. (2022). Demographics and automation. Review of Economic Study, 89(1), 1–44. [Google Scholar] [CrossRef]
  4. Alvarez-Cuadrado, F., Long, N. V., & Poschke, M. (2018). Capital-labor substitution, structural change and the labor income share. Journal of Economic Dynamics & Control, 87, 206–231. [Google Scholar]
  5. Angelopoulos, K., Asimakopoulos, S., & Malley, J. (2015). Tax smoothing in a business cycle model with capital skill complementarity. Journal of Economic Dynamics and Control, 51, 420–444. [Google Scholar] [CrossRef]
  6. Arulampalam, W., Devereux, M. P., & Maffini, G. (2012). The direct incidence of corporate income tax on wages. European Economic Review, 56(6), 1038–1054. [Google Scholar] [CrossRef]
  7. Auerbach, A. J. (2018). Measuring the effects of corporate tax cuts. Journal of Economic Perspectives, 32(4), 97–120. [Google Scholar] [CrossRef]
  8. Bai, C. E., & Qian, Z. J. (2009). Who has eroded residents’ income? An analysis of China’s national income distribution patterns. Social Sciences in China, 5, 99–115. [Google Scholar]
  9. Bai, C. E., Qian, Z. J., & Wu, K. P. (2008). Determinants of factor shares in China’s industrial sector. Economic Research Journal, 8, 16–28. [Google Scholar]
  10. Barkai, S. (2020). Declining labor and capital shares. The Journal of Finance, 75(5), 2421–2463. [Google Scholar] [CrossRef]
  11. Beck, T., Levine, R., & Levkov, A. (2010). Big bad banks? The winners and losers from bank deregulation in the United States. The Journal of Finance, 65(5), 1637–1667. [Google Scholar] [CrossRef]
  12. Bentolila, S., & Saint-Paul, G. (2003). Explaining movements in the labor share. Contributions to Macroeconomics, 3(1), 1–31. [Google Scholar] [CrossRef]
  13. Benzell, S. G., Kotlikoff, L. J., Lagarda, G., & Sachs, J. D. (2015). Robots are US: Some economics of human replacement. NBER Working Paper Series No. 20941. National Bureau of Economic Research. [Google Scholar]
  14. Button, P. (2019). Do tax incentives affect business location and economic development? Evidence from state film incentives. Regional Science and Urban Economics, 77, 315–359. [Google Scholar] [CrossRef] [PubMed]
  15. Chen, Y. J., Li, P., & Lu, Y. (2018). Career concerns and multitasking local bureaucrats: Evidence of a target-based performance evaluation system in China. Journal of Development Economics, 133, 84–101. [Google Scholar] [CrossRef]
  16. Dai, M., Xu, J. W., & Shi, B. Z. (2013). The shocks from the exchange rate of RMB, and the employment in manufacturing industry: The experience evidence from the data on firms. Management World, 11, 14–27. [Google Scholar]
  17. Deran, E. (1967). Changes in factor income shares under the social security tax. The Review of Economics and Statistics, 49(4), 627–630. [Google Scholar] [CrossRef]
  18. Duffy, J., Papageorgiou, C., & Perez-Sebastian, F. (2004). Capital-skill complementarity? Evidence from a panel of countries. The Review of Economics and Statistics, 86(1), 327–344. [Google Scholar] [CrossRef]
  19. Fan, Z., & Liu, Y. (2020). Tax compliance and investment incentives: Firm responses to accelerated depreciation in China. Journal of Economic Behavior & Organization, 176, 1–17. [Google Scholar]
  20. Garrett, D. G., Ohrn, E., & Su’arez Serrato, J. C. (2020). Tax policy and local labor market behavior. American Economic Review: Insights, 2(1), 83–100. [Google Scholar]
  21. Griliches, Z. (1969). Capital-skill complementarity. Review of Economics and Statistics, 51(4), 465–468. [Google Scholar] [CrossRef]
  22. Guo, K. M. (2019). Artificial intelligence, structural transformation and labor share. Management World, 35(7), 60–77. [Google Scholar]
  23. Hadlock, C. J., & Pierce, J. R. (2010). New evidence on measuring financial constraints: Moving beyond the KZ index. Review of Financial Studies, 23(5), 1909–1940. [Google Scholar] [CrossRef]
  24. Hall, R. E., & Jorgenson, D. W. (1967). Tax policy and investment behavior. The American Economic Review, 57(3), 391–414. [Google Scholar]
  25. Harrison, A. (2005). Has globalization eroded labor’s share? Some cross-country evidence. IDEAS Working Paper Series from PePEc. World Scientific Publishing. [Google Scholar]
  26. Hicks, J. R. (1932). Theory of wages. Macmilan. [Google Scholar]
  27. House, C., & Shapiro, M. D. (2008). Temporary investment tax incentives: Theory with evidence from bonus depreciation. American Economic Review, 98(3), 737–768. [Google Scholar] [CrossRef]
  28. Karabarbounis, L., & Neiman, B. (2014). The global decline of the labor share. Quarterly Journal of Economics, 129(1), 61–103. [Google Scholar] [CrossRef]
  29. Kline, P., Petkova, N., Williams, H., & Zidar, O. (2019). Who profits from patents? Rent-sharing at innovative firms. Quarterly Journal of Economics, 134(3), 1343–1404. [Google Scholar] [CrossRef]
  30. Koowattanatianchai, N., & Charles, M. B. (2015). A mixed methods approach to studying asset replacement decisions. International Journal of Business Innovation and Research, 9(5), 544–567. [Google Scholar] [CrossRef]
  31. Li, B., Liu, C., & Sun, S. T. (2021). Do corporate income tax cuts decrease labor share? Regression discontinuity evidence from China. Journal of Development Economics, 150, 102624. [Google Scholar] [CrossRef]
  32. Li, J. Q., & Zhao, X. Y. (2021). Accelerated depreciation policy of fixed assets and capital-labor ratio. Finance and Trade Economics, 42(04), 67–82. [Google Scholar]
  33. Liu, G. C., Ye, Y. W., Chen, X. X., & Zhang, J. (2023). Fixed assets depreciation, tax planning and abnormal investment. Economic Research Journal, 58(04), 23–40. [Google Scholar]
  34. Liu, Q. R., & Zhao, C. (2020). Tax incentives and upgrading firms’ human capital. Economic Research Journal, 55(4), 70–85. [Google Scholar]
  35. Liu, Y., & Mao, J. (2019). How do tax incentives affect investment and productivity? Firm-level evidence from China. American Economic Journal: Economics Policy, 11(3), 261–291. [Google Scholar] [CrossRef]
  36. Moon, S. T. (2022). Capital gains taxes and real corporate investment: Evidence from Korea. American Economic Review, 112(8), 2669–2700. [Google Scholar] [CrossRef]
  37. Ohrn, E. (2019). The effect of tax incentives on U.S. manufacturing: Evidence from state accelerated depreciation policies. Journal of Public Economics, 180, 104084. [Google Scholar] [CrossRef]
  38. Song, J., & Li, X. C. (2019). Industry investment, labour skill preference and industrial transformation and upgrading. The Journal of World Economy, 5, 145–167. [Google Scholar]
  39. Tirole, J. (2006). Theory of corporate finance. Princeton University Press. [Google Scholar]
  40. Tuzel, S., & Zhang, M. B. (2021). Economic stimulus at the expense of routine-task jobs. The Journal of Finance, 76(6), 3347–3399. [Google Scholar] [CrossRef]
  41. Uzawa, H. (1962). Production functions with constant elasticities of substitution. Review of Economic Studies, 29(4), 291–299. [Google Scholar] [CrossRef]
  42. Wang, X. Y., & Huang, Y. J. (2017). Foreign direct investment and labor share in the listed companies: Looting a burning house or icing on the cake. China Industrial Economics, 4, 135–154. [Google Scholar]
  43. Wei, X. H., Dong, Z. Q., & Lan, J. J. (2017). Does regional gender imbalance affect labor share of income? Theoretical analysis and evidence from China. The Journal of World Economy, 4, 129–146. [Google Scholar]
  44. Xiao, S. T., Sun, R., Yuan, C., & Sun, J. (2022). Enterprise digital transformation, human capital structure adjustment, and labor income share. Management World, 38(12), 220–237. [Google Scholar]
  45. Xu, D. D., Zhao, T. H., & Xu, J. X. (2021). Tax incentives, fixed asset investment and labor income share: Evidence from the fixed assets accelerated depreciation reform in 2014. Management Review, 33(3), 244–254. [Google Scholar]
  46. Yagan, D. (2015). Capital tax reform and real economy: The effects of the 2003 dividend tax cut. American Economic Review, 105(12), 3531–3563. [Google Scholar] [CrossRef]
  47. Yang, Y., & Zhang, H. (2021). The value-added tax reform and labor market outcomes: Firm-level evidence from China. China Economic Review, 69, 101678. [Google Scholar] [CrossRef]
  48. Young, A. T. (2010). One of the things we know that ain’t so: Is US labor’s share relatively stable. Journal of Macroeconomics, 32(1), 90–102. [Google Scholar] [CrossRef]
  49. Zhang, K. Z., He, F., Huang, Y. Y., & Cui, X. Y. (2021). Tax incentives, rent sharing and within-firm wage inequality. Economic Research Journal, 56(06), 110–126. [Google Scholar]
  50. Zhang, T., & Li, J. C. (2023). Network infrastructure, inclusive green growth, and regional inequality: From causal inference based on double machine learning. The Journal of Quantitative & Technical Economics, 40, 113–135. [Google Scholar]
  51. Zwick, E., & Mahon, J. (2017). Tax policy and heterogeneous investment behavior. American Economic Review, 107(1), 217–248. [Google Scholar] [CrossRef]
Figure 1. Dynamic effect analysis. Note: The graph shows 95% confidence intervals. The values −4, −3, and −2 represent the 4, 3, and 2 years before the implementation of the ADP, respectively. The values 1, 2, 3, 4, 5, 6, 7, and 8 represent the 1, 2, 3, 4, 5, 6, 7, and 8 years after the implementation of the ADP, respectively. The value −1 is the year before the enterprise enjoys the ADP and is designed as the benchmark.
Ijfs 13 00046 g001
Figure 2. Placebo test. Note: The vertical red solid line represents the true estimated coefficient value in the baseline regression, which is 0.0177. The horizontal red dashed line indicates the p-value, set at 0; the vertical red dashed line denotes the estimated coefficient, also set at 0.
Ijfs 13 00046 g002
Table 1. Economic effect of the ADP.
Research AreaPolicy ImpactReferenceResearch Findings
Labor force employmentInvestment growthHouse and Shapiro (2008)The policy resulted in 100,000 to 200,000 new job positions.
Ohrn (2019)The policy absorbed employment and slightly improved wage levels.
Garrett et al. (2020)The policy absorbed employment and slightly improved wage levels.
No significant impactYagan (2015); Button (2019)The policy did not play a significant role in absorbing employment.
Enterprise human capital structureSkill upgradingLiu and Mao (2019)The policy prompted equipment updates, replacing low-skilled workers with high-skilled ones.
Workforce restructuringLiu and Mao (2019)The affected enterprises increased skilled workers and decreased routine workers.
Labor ratio improvementLiu and Zhao (2020)The policy encouraged fixed asset additions and improved the ratio of skilled to unskilled labor.
Enterprise fixed asset investmentInvestment growthHall and Jorgenson (1967)The ADP improved investment behavior through a reduction in capital user cost.
Zwick and Mahon (2017)The policy stimulated significant growth in enterprise investment.
Ohrn (2019)Short-term tax incentives from ADP lowered investment costs, particularly for financially constrained firms.
Fan and Liu (2020)The policy enhanced investment efficiency based on data from Chinese listed firms.
Table 2. Influence factors of the labor income share.
Research AreaInfluence on LSReferenceResearch Findings
Capital–labor substitutionDecreaseKarabarbounis and Neiman (2014);
Bentolila and Saint-Paul (2003)
Capital deepening affects the labor income share due to falling capital goods prices.
Benzell et al. (2015)AI squeezes out the labor income share by increasing the ratio of intangible assets.
Alvarez-Cuadrado et al. (2018)Capital bias stimulates capital input, weakening the labor income share.
Barkai (2020)Higher returns on non-labor factors lead to a drop in the labor income share.
Acemoglu and Restrepo (2022)Technological progress favors capital, reducing the labor income share.
Tax policyIncreaseDeran (1967)Social security tax reduces the capital share, increasing the labor income share.
DecreaseYang and Zhang (2021)Investment incentive effect of the reform declines the labor income share.
Li et al. (2021)Lowering income tax rates reduces the labor income share.
Table 3. Definitions.
Variable NameVariable SymbolDefinition
Enterprise sizeSizeThe natural logarithm of total corporate assets
Enterprise ageAgeThe natural logarithm of the establishment years of the enterprise
Asset–liability ratioLevTotal liabilities/Total assets
Ratio of independent directorsIndeptIndependent directors/Total directors
ProfitabilityRoaNet profit/Total assets
Enterprise growthGrowMarket value of corporate equity + Book value of liabilities/Total assets
Capital–output ratioPPENet fixed assets/Total operating income
Capital intensityCapitalTotal assets/Total revenue
Large shareholder ownership ratioTop1Number of shares held by the largest shareholder
/Total shares outstanding
Regional economic development levelGDPThe natural logarithm of GDP in the city where the enterprise is registered
Industrial structureIndStrThe proportion of the secondary industry in GDP of the province where the company is registered
Table 4. Descriptive statistics.
NMeanStdMinMedianMax
LS14,2130.29230.12010.05690.28050.7176
Size14,21322.45921.348919.476922.279926.3760
Age14,2132.82550.38202.07942.83323.4012
Lev14,2130.43910.19970.05110.43520.9519
Indept14,2130.37460.05380.33330.33330.5714
Roa14,2130.04070.0606−0.23900.03780.2264
Grow14,2132.03141.31240.83431.60318.4958
PPE14,2130.42460.37500.03700.30992.0339
Capital14,2132.34111.84000.46001.821612.2596
Top114,2130.34080.14870.08380.31850.7457
GDP14,2138.99241.10246.22389.117010.6739
IndStr14,2130.40250.11760.15800.41600.6390
Table 5. Baseline regression results.
(1)(2)
LSLS
Treat × Post0.0180 ***
(0.0044)
0.0177 ***
(0.0035)
ControlsNoYes
Year FEYesYes
Enterprise FEYesYes
N14,21314,213
R20.73410.8266
Note: *** indicates significance at the 1% level. Standard errors are in parentheses.
Table 6. Results based on DML.
(1)(2)
LSLS
Treat × Post0.0589 ***0.0594 ***
(0.0035)(0.0035)
Linear termYesYes
Quadratic termNoYes
Year FEYesYes
Enterprise FEYesYes
N14,21314,213
Note: *** indicates significance at the 1% level. Standard errors are in parentheses.
Table 7. Robustness tests.
(1)(2)(3)(4)
Alternative Metrics for Labor Income ShareRejection Sample
LS_1LS_2LSLS
Treat × Post0.0604 ***0.0205 ***0.0221 ***0.0178 ***
(0.0166)(0.0055)(0.0039)(0.0036)
ControlsYesYesYesYes
Year FEYesYesYesYes
Enterprise FEYesYesYesYes
N14,21314,21312,93513,551
R20.74770.61530.82790.8272
Note: *** indicates significance at the 1% level. Standard errors are in parentheses.
Table 8. Further analysis.
(1)(2)
lnemplnkl
Treat × Post0.0788 ***0.0730 **
(0.0238)(0.0233)
ControlsYesYes
Year FEYesYes
Enterprise FEYesYes
N1413713625
R20.94640.8870
Note: *** and ** indicate significance at the 1% and 5% levels, respectively. Standard errors are in parentheses.
Table 9. Mechanism analysis.
(1)(2)(3)(4)(5)(6)
SkillUnskillSkill_RateLSlnrentLS
Treat × Post0.0525 ***−0.02330.0486 ***0.0611 ***0.2040 ***0.0159 ***
(0.0148)(0.0397)(0.0147)(0.0156)(0.0294)(0.0039)
skill_rate 0.1072 ***
(0.0319)
lnrent 0.0575 ***
(0.0034)
ControlsYesYesYesYesYesYes
Year FEYesYesYesYesYesYes
Enterprise FEYesYesYesYesYesYes
N671175277107710713,41013,410
R20.93550.95030.91570.80800.81460.7794
Note: *** indicates significance at the 1% level. Standard errors are in parentheses.
Table 10. Heterogeneity analysis 1.
(1)(2)(3)(4)(5)(6)
OwnershipScaleFinancing Constraints
State-OwnedPrivateLargeMiddle and SmallHighLow
Treat × Post0.00780.0207 ***0.00300.0175 ***0.0139 ***0.0082
(0.0059)(0.0043)(0.0046)(0.0048)(0.0040)(0.0055)
ControlsYesYesYesYesYesYes
Year FEYesYesYesYesYesYes
Enterprise FEYesYesYesYesYesYes
N582683878480573370667147
R20.83730.83290.86380.83790.86540.8634
Note: *** indicates significance at the 1% level. Standard errors are in parentheses.
Table 11. Heterogeneity analysis 2.
(1)(2)(3)(4)(5)(6)
Factor IntensityIndustryLabor Skill Level
Capital
Intensive
Labor
Intensive
ManufacturingServicesHighLow
Treat × Post0.0297 ***0.00620.0193 ***0.01010.0155 ***0.0505
(0.0075)(0.0054)(0.0047)(0.0096)(0.0037)(0.0277)
ControlsYesYesYesYesYesYes
Year FEYesYesYesYesYesYes
Enterprise FEYesYesYesYesYesYes
N777064437720382570667147
R20.80940.85000.81810.82840.84550.8902
Note: *** indicates significance at the 1% level. Standard errors are in parentheses.
Disclaimer/Publisher’s Note: The statements, opinions and data contained in all publications are solely those of the individual author(s) and contributor(s) and not of MDPI and/or the editor(s). MDPI and/or the editor(s) disclaim responsibility for any injury to people or property resulting from any ideas, methods, instructions or products referred to in the content.

