Article

Pricing the Audit Risk of Innovation: Intangibles and Patents

Department of Accounting, Finance, & Business Law, College of Business, Texas A&M University-Corpus Christi, 6300 Ocean Drive, Unit 5808, Corpus Christi, TX 78412, USA
*
Author to whom correspondence should be addressed.
Int. J. Financial Stud. 2025, 13(1), 42; https://doi.org/10.3390/ijfs13010042
Submission received: 16 January 2025 / Revised: 21 February 2025 / Accepted: 25 February 2025 / Published: 4 March 2025

Abstract

:
The economic literature documents that the investment rate in intangible assets, including intellectual property (IP), has far outpaced that of tangible assets for several decades. In this context, our research delves into the impact of self-created intangible assets on the auditor’s risk assessment. We present compelling evidence that, on average, research and development (R&D) knowledge capital is associated with higher audit fees. Using patent-based metrics as the proxies for innovation outcomes, we reveal that the number of patents (quantity), patent citations (quality-adjusted quantity), and patent technology classes (scope) all positively correlate with audit fees. Additional analyses show that innovation efficiency is negatively associated with audit fees. Furthermore, firms with a higher intensity of knowledge capital are more likely to receive going concern opinions than those with significant innovation outcomes. These findings provide valuable insights into the complex relationship between intangible assets and audit risk assessment.
JEL Classification:
O32; M41; M42

1. Introduction

In the era of a knowledge-based economy, companies keep increasing investments in research and development (R&D) activities to gain and maintain a competitive advantage over their rivals and earn abnormal returns (Hand & Lev, 2003). The rate of investment in intangibles has exceeded that of tangible assets in the United States (US) private sector since the mid-1990s (Corrado & Hulten, 2010; Lev & Gu, 2016; Lev, 2019).1 However, because uncertainty is intrinsic to innovation and R&D activities, current Generally Accepted Accounting Principles (GAAP) require the immediate expense of most R&D expenditures when incurred (ASC 730).2 This leads to a disparity between book value and market value of intangible assets. This disparity increases the difficulties for investors and auditors to understand and verify the related accounts or numbers (Appleton et al., 2023) and reduces the usefulness and relevance of accounting information (Iqbal et al., 2024). Consequently, market reaction to accounting events is less significant with growing investments in intangibles (Fraser et al., 2009). In this study, we investigate the roles of intangible assets in planning and conducting the audit. In particular, we examine whether a client’s investment in R&D activities and innovation outcomes would affect the auditors’ risk perceptions reflected in their pricing decisions.
The ever-growing gap between book value and market value has sparked an ongoing debate over accounting and reporting on intangible assets (Appleton et al., 2023; Lev, 2019; Lev & Gu, 2016). One side of the debate calls for ending the 50-year-old “deficient” accounting for intangible assets (Lev, 2019), while the other side points to the challenges in the valuation of intangibles and their limited verifiability by auditors (Appleton et al., 2023). In a recent meeting, the Financial Accounting Standards Board (FASB) highlighted three issues of intangibles reporting affecting the investors, including (1) the fragmented nature of accounting for intangible assets, (2) differences between internally generated and acquired intangibles due to the “missing” reporting of the former, and (3) more information on the proportion of expenditures on internally generated and acquired intangible assets (FASB, 2024b).3 The Public Company Accounting Oversight Board (PCAOB) also raised similar concerns and routinely detects audit deficiencies regarding intangibles (PCAOB, 2015). On the one hand, as the fair value of internally generated R&D assets is not capitalized and recognized on the balance sheet under US GAAP, auditors may not regard them as important as other types of assets, leading to their oversight in the audit planning process. On the other hand, should these off-balance sheet intangibles fail to produce returns, the firm’s auditor, with “deep pockets”, can become a target for litigation, even though audit failure is not a factor (Stice, 1991). Thus, we expect that a client’s R&D activities and outcomes, while missing or not reported appropriately, should still affect the auditors’ risk perceptions and audit process.
We empirically examine how corporate innovation affects audit pricing with a sample of 9028 companies from 2000 to 2019. We find that R&D knowledge capital intensity, the number of patents (quantity), patent citations (quality-adjusted quantity), and patent technology classes (scope) are positively associated with audit fees. These results suggest that firms with more knowledge capital and significant innovation outcomes exhibit higher complexity and require significantly more audit effort. The main results persist in several robustness checks. The cross-sectional analyses indicate that this association is more pronounced for high-tech firms and small firms with higher audit litigation risk. However, this relationship is less pronounced for firms with lower reporting quality, suggesting that auditors prioritize the auditing of tangible assets in this case. We further examine and document a negative association between innovation efficiency and audit fees. When innovation efficiency is high, firms can utilize fewer investments to achieve R&D goals, and the audit litigation risk becomes lower. In addition, we employ the issuance of a going concern modification as an alternative measure of auditors’ risk assessment. We find that auditors are more likely to behave conservatively and issue going concern opinions to companies with higher intensity of R&D knowledge capital and those with more intangibles on the balance sheet. Considering the information asymmetry and risks in evaluating R&D assets and intangibles, the finding echoes prior studies (Passov, 2003), suggesting that it is costly for knowledge-based companies to raise capital and invest in ongoing R&D projects continuously and promptly when financially constrained.
This paper contributes to the literature on the fundamental determinants of audit fees and going concern opinions. While prior research has documented various determinants, such as client size, complexity, or inherent risk (Simunic, 1980), they are primarily the attributes of tangible assets captured and reported in the balance sheet. Whether or how auditors assess the risks associated with internally generated IP assets remains underexplored. Prior studies (Datta et al., 2020; Visvanathan, 2017) document that firms with more patents or a higher proportion of intangibles on the balance sheet are associated with higher audit fees. However, they do not distinguish intangibles acquired through external sources from those generated through internal R&D activities, and do not simultaneously include both in the audit fee model. Furthermore, two distinct forms of internally developed IP assets are not identified: (1) knowledge capital created by R&D investments and (2) patents granted, a codified form of technical knowledge. Our study fills this gap and expands innovation literature on R&D investments and intangibles by documenting that corporate innovation’s vital components (e.g., knowledge capital intensity, patent quantity, innovation efficiency, etc.) significantly impact auditors’ risk assessment and pricing strategies after controlling for the acquired intangibles.
The remainder of the paper is organized as follows: Section 2 reviews prior studies and develops the theoretical hypotheses. Section 3 presents the research design and sample. Section 4 details the empirical results and additional analyses, respectively. Section 5 summarizes the main findings and conclusions.

2. Literature Review and Theoretical Development

The rapid advancement of technology through innovation impacts all walks of daily life. However, the valuation of innovation and R&D activities is challenging for management, auditors, and financial reporting users due to their intrinsic uncertainty. Prior studies address corporate innovation by focusing on R&D expenditure, specific types of intangibles (Glaeser & Lang, 2023), or the sources of innovation in terms of knowledge flows (Gordon et al., 2020; Biscione et al., 2024). Some research finds that capitalized R&D is a credible signal of innovation success using simulation (Healy et al., 2002) or non-U.S. data (Oswald & Zarowin, 2007; Oswald, 2008). In a recent report (Deloitte, 2023), IP practitioners believe that for all intangible assets, patents drive the most value of a business (39%), while know-how or inventions play the most crucial role in maintaining competitive advantage (85%). We, therefore, follow this stream to use R&D and patent-based measures as proxies for innovation inputs and outputs, respectively, in this study.

2.1. Innovation Input: Knowledge Capital

Knowledge capital is information produced, acquired, systematized, and used in the value-creation process (Laperche, 2013). It reflects the techniques and know-how a firm draws on with its innovation attempts (Klette & Kortum, 2004). Griliches (1979, 1986) first identified the importance of capitalizing on knowledge and using knowledge capital as an input in the production function. Recent studies have found that the direction of technological change has become more knowledge-intensive than capital-intensive (Antonelli, 2019) and that the output elasticity of knowledge capital increases dramatically in high-tech and manufacturing firms (Antonelli et al., 2023). As knowledge capital rises with innovation input, it is often valued based on (past) R&D spending using the perpetual inventory concept (Peters & Taylor, 2017). Prior studies document that the firm will choose an optimal quantity of external audit services so that the marginal reduction in expected liability loss is equal to the marginal cost of the audit service (Simunic, 1980). Consequently, audit fees are determined by the cost of the optimal quantity of external audit services and the fraction of the expected liability losses the auditor bears. When a firm engages in more R&D activities to generate knowledge capital, the intangibility of its financial reporting system increases with greater loss exposure. Considering the increasing expected liability loss, the firm will demand a greater quantity of auditor services. As a result, audit fees should increase with firms’ knowledge capital (See Appendix A for a detailed comparative static analysis).4
On the supply side, knowledge-intensive firms are associated with higher business risk and information asymmetry since the expenditure and progress of R&D projects are not always observable (PwC, 2021). For instance, compared to tangible assets, it is more difficult to predict innovation outcomes or find comparable assets and market value for tacit R&D knowledge (Glaeser & Lang, 2023). The uncertain and opaque nature of R&D investments also increases the litigation risk of auditors, as such litigation may occur with or without an audit failure. In response, auditors can take the following actions to offset the risk: (1) increase audit effort and (2) increase audit fee premium to cover anticipated litigation losses (Krishnan & Krishnan, 1997). Simunic and Stein (1996) document that when the audit litigation risk is high, there is an increased emphasis on quality control, enhanced audit planning, and increased audit hours, and therefore conclude that, in general, higher audit fees are due to more audit effort rather than a fee premium. Based on the predictions, we expect a positive association between the intensity of knowledge capital (KCINT) and audit fees to develop the first hypothesis:
H1. 
A positive relationship exists between the intensity of knowledge capital innovation inputs (KCINT) and audit fees.

2.2. Innovation Outcome: Patent Quantity, Quality-Adjusted Quantity, and Scope

Auditors face higher task complexity when auditing IP assets, such as patents, than tangible assets. For instance, when auditing intangibles, auditors need to identify the ownership of registered and potential IP, examine related threats in the industry, and evaluate the long-term returns over their lifespan (Deloitte, 2023). The threats may arise from technological breakthroughs or actions in the court, and different parties or independent arbitrators often challenge the valuation of intangibles.
For nearly 60 years, patents have been a direct proxy for innovation outcomes (Demis et al., 2015). Prior studies have developed different constructs based on patents to measure innovation. Some firms may focus on a specific field and invest heavily in related R&D activities, which, if successful, could result in many patents and create long-term economic benefits through licensing. Patents also receive citations in the licensing process. Conversely, other firms may put R&D resources into multiple technologies to expand their scope of innovation and patent lines instead of pursuing a specific area. Such diversification is effective when there are varying risks and uncertainty profiles in each R&D project. When a technological breakthrough in a particular area diminishes the economic value of related patents, the patents in other areas help sustain the firms’ operating cash inflows. Accordingly, we count the number of patents granted (Patent) and the frequency of forward patent citations (CPatent) as proxies for the quantity and quality-adjusted quantity of corporate innovation. We also use the number of technology classes of patents (TECHCL) to measure the scope of corporate innovation. As a greater quantity and a broader range of innovation outcomes signal more challenging and risky audit areas that require more audit efforts, we expect that both innovation quantity and scope are positively associated with audit fees, leading to the second hypothesis:
H2. 
There is a positive relationship between corporate innovation quantity (Patent), quality-adjusted quantity (CPatent), and scope (TECHCL) on audit fees.

3. Research Design and Data

3.1. Audit Fee Model

We specify that the natural logarithm of audit fees (Log(AF)) is a function of corporate innovation and other controls documented in prior research (Simunic, 1980; Hay et al., 2006; Taylor, 2011; Zhang et al., 2021). We consider two forms of intangible R&D assets that are internally developed but not reported on the balance sheet: (1) knowledge capital, such as tacit knowledge, skills, or experience that researchers gained from past and ongoing R&D projects; (2) patents granted, the direct output of R&D investments. Following prior studies (Peters & Taylor, 2017; Iqbal et al., 2024), we employ the perpetual inventory method to accumulate a firm’s past R&D expenditure as its quantified knowledge capital,
K C i t = 1 θ R D K C i t 1 + R D i t
where KC i t is firm i’s stock of R&D knowledge capital in year t, θ R D is the R&D depreciation rate, and R D i t is its R&D expense in year t. In the principal analyses, we use the US Bureau of Economic Analysis (BEA)’s industry-specific R&D depreciation rates for major high-tech industries and set the depreciation rate for other industries equal to the traditionally assumed rate, 15%, to estimate knowledge capital (Li & Hall, 2020; Peters & Taylor, 2017).5 For a robustness check, we set the R&D depreciation rate equal to 15%, 20%, and 25% for all industries.6 Knowledge capital intensity (KCINT), our first interested variable, is defined as the R&D knowledge capital scaled by total assets, and its coefficient is expected to be positive based on H1.
We utilize the patent data from Kogan et al. (2017), which were later updated by Noah Stoffman, to measure R&D outputs. Generally, more granted patents mean a greater quantity and/or a broader scope of innovation for auditors to assess. We use the natural logarithm of the number of patents granted (Log(Patent)) and the natural logarithm of the number of technology classes of patents granted (Log(TECHCL)) to measure the quantity and scope of innovation, respectively. Following H2, we expect the coefficients on both variables to be significantly positive. We also use Log(CPatent), the natural logarithm of citation-weighted patents, as an alternative to measuring the quality-adjusted quantity of corporate innovation. Overall, the primary research model is as follows:
L o g A F i t = β 0 + β 1 K C I N T i t + β 2 L o g P a t e n t i t + β 3 I N T A N i t + β 4 B i g N i t + β 5 S p e c i a l i s t i t + β 6 S i z e i t + β 7 L o g S e g m e n t i t + β 8 F o r e i g n i t + β 9 A C Q i t + β 10 P e n s i o n i t + β 11 X I S P I i t + β 12 R O A i t + β 13 L o s s i t + β 14 I N V R E C i t + β 15 Q u i c k i t + β 16 L e v e r a g e i t + β 17 N D I i t + β 18 N E I i t + β 19 C o n c e r n i t + β 20 R e s t a t e m e n t i t + β 21 F Y A u d i t i t + β 22 L o g R E P L A G i t + β 23 L o g N A F i t + β 24 D e c e m b e r i t + β 25 B t M i t + β 26 S G r o w t h i t + β 27 L i t i g a t i o n i t + β 28 L o g A g e i t +   Fixed   Effects + ϵ i t
The definitions of the variables are detailed in Table 1. All continuous variables are winsorized at the 1% and 99% levels. We control for determinants of audit fees following prior studies (see Hay et al., 2006). Particularly, we include the ratio of intangibles on the balance sheet to total assets (INTAN) to capture the impact of acquired intangibles, considering their potential correlation with internally developed IP. We control for audit firm’s characteristics, including whether it is a big name (BigN) or an industry specialist (Specialist), as these auditors may have more resources, reputation, specialization, or knowledge of the client’s industry to improve audit planning or risk assessment and charge premium fees for high-quality audits (DeFond et al., 2000; Low, 2004). We also include a series of variables to control for firm characteristics, including size (Size), complexity, such as the number of business segments (Segment), foreign operation (Foreign), acquisition activities (ACQ), pension plans (Pension), and special items (XISPI), firm performance (i.e., return on assets (ROAs), loss indicator (Loss), inventories and receivables to total assets (INVREC)), and capital structure (i.e., quick ratio (Quick), leverage (Leverage)), and net issuance of debt (NDI) and equity (NEI). We further control for clients’ financial distress and reporting quality by including the indicators of going concern opinions (Concern) and accounting restatements (Restatement). In addition, we consider factors that may affect audit work and reports following prior studies, including first-year auditor change, FYAudit (Deis & Giroux, 1996; Zhang et al., 2021), the audit opinion filing date, REPLAG, non-audit fees, Log(NAF) (Whisenant et al., 2003; Basioudis & Francis, 2007), and calendar year-end indicator (December). Finally, we include book-to-market value ratio (BtM), sales growth (SGrowth), high litigation risk indicator, Litigation (Bentley et al., 2013), and firm age, Log(Age) (Krishnan & Wang, 2015), to control for the growth opportunities and pressures of the client firms. Table 1 presents the detailed definitions of dependent and independent variables in Equations (1) and (2).

3.2. Data and Sample

We collect audit and financial data from Audit Analytics and Compustat Fundamentals Annual databases, respectively. We retrieve corporate innovation and patent data from the patent database provided by Noah Stoffman, which extends the data from Kogan et al. (2017). It consists of all utility patents issued by the United States Patent and Trademark Office (USPTO) from 1926 to 2020.7 Considering the data availability across the databases, we set the sample period between fiscal years 2000 and 2019. The initial sample drawn from Compustat and Audit Analytics databases consists of 231,963 firm-year observations. After excluding observations from financial institutions (SIC codes 6000–6999) and utility firms (SIC codes 4900–4999) following prior studies and missing data, the final sample includes 70,202 firm-year observations from 9028 firms. The sample selection procedure is presented in Table 2.
Table 3 shows the descriptive statistics. The raw means of audit fees (AF) and non-audit fees (NAF) are 1.33 and 0.43 million, respectively. The sample mean (median) of knowledge capital intensity (KCINT) is 0.36 (0.036) while that of patent counts (Patent) is 12.10 (0.00), indicating that the distribution of the variables are highly positively skewed; that is, a relatively small number of firms invest heavily in R&D and are granted more patents than others, and many firms do not have significant R&D investments or patents granted. Similarly, the distributions of CPatent, TECHCL, PEFF, and CEFF are also positively skewed, suggesting an uneven distribution of inputs and gains from innovation activities among firms. On average, 66.2% of firm-years are audited by big-name auditors, 69.4% have December fiscal year-ends, and 10.9% receive a going concern opinion.

4. Empirical Results

4.1. Main Results

We regress audit fees on the intensity of knowledge capital (KCINT), the proxy of innovation inputs, and patent-based measures of innovation outputs and present the main results in Table 4. The industry- and year-fixed effects are included in the models, and the standard errors are clustered by firm and year. In Table 4, columns (1) and (2) show the effect of innovation quantity on audit fees, while column (3) reports the results using the number of technology classes (Log(TECHCL)) as a proxy for innovation scope. The coefficients of KCINT are consistently positive at the 1% level across all models, supporting the first hypothesis that auditors charge their clients more fees for a higher intensity of R&D knowledge capital. The coefficients of Log(Patent), Log(CPatent), and Log(TECHCL) are significantly and consistently positive at the 1% level to support our second hypothesis that greater quantity and broader scope of innovation are associated with higher audit fees. For control variables, the coefficients on intangible intensity (INTAN) are significantly positive across all models, implying that auditors would view intangible assets acquired through external sources and reported on the balance sheet as high-risk items and make more effort to assess and verify their fair value. The coefficient estimates of BigN and Specialist are significantly positive, consistent with prior research suggesting that Big N auditors or industry specialists charge their clients premium prices for higher audit quality. The size and measures of client complexity, including Log(Segment), Foreign, ACQ, Pension, and XISPI, are associated with higher audit fees. Firms with higher profitability (ROA) are associated with lower business risk and pay lower audit fees. In contrast, auditors charge loss-making firms (Loss) more fees for higher business risk. The coefficients of the other control variables are mainly consistent with those reported in prior studies. We further examine the variance inflation factor (VIF) and find that, in column (1), the mean VIF of all independent variables is 1.43, with Size having the highest VIF (3.52). The result is far less than the rule of thumb cutoff, 10 (Hair et al., 2006). In columns (2) and (3), the mean and highest VIFs of the independent variables are very close to the ones reported above. Consequently, multicollinearity should not be a concern. However, if Log(Patent) and Log(TECHCL) are both included in the model (not presented), their VIFs are 20.49 and 20.43, respectively, suggesting the existence of multicollinearity due to the high correlation between the two variables.8 In the robustness check, we also run a regression model with firm and year-fixed effects, and the untabulated results are largely consistent with those reported in Table 4.
To address potential endogeneity issues, we use entropy balancing to account for covariate differences that might explain our results. Based on Hainmueller (2012), entropy balancing applies the reweighting scheme so that the reweighted covariates other than the interested variables, the proxies of innovations in our study, are exactly matched on specified moments. We use the mean, variance, and skewness, namely the first three moments, to balance the firm-years with innovation outputs (i.e., patents) and those without such outputs in the dataset. The untabulated results show that KCINT, Log(Patent), and Log(CPatent) are significantly positive, which further confirms the main findings in Table 4.
To check the robustness of the main findings, we use three alternative R&D depreciation rates, 15%, 20%, and 25%, to separately estimate the effects of the intensity of R&D knowledge capital (i.e., KCINT15, KCINT20, and KCINT25) on audit fees, and present the results in columns (1), (2), and (3) of Table 5, respectively. The coefficients of KCINT15, KCINT20, and KCINT25 of 0.065, 0.082, and 0.101, respectively, are consistently and significantly positive at the 1% level. The sample means are 0.432, 0.356, and 0.300, respectively. The mean of KCINT15 is greater than that of KCINT20 and KCINT25 because of its lower annual depreciation rate. The coefficient of Log(Patent) is consistently positive across all models, and we also replace it with Log(CPatent) and Log(TECHCL) for robustness checks. The results are consistent with those in Table 5. In summary, our results are consistent across alternative measures of knowledge capital intensity.

4.2. Cross-Sectional Analyses

We conduct a series of cross-sectional analyses in terms of types, reporting quality, and characteristics of client firms to examine if our main findings are subject to specific conditions. First, as high-tech firms engage in more R&D activities, we investigate whether auditors consider such differences between high-tech and other sectors when assessing innovation risk. We partition the sample based on high-tech industries, including IT computer (SIC codes 3570–3577), software (7370–7379), electronic (3600–3674), and drug (2833–2836) industries (Francis & Schipper, 1999; Banker et al., 2011) and other industries. The descriptive statistics show that the means of KCINT (Log(Patent)) are 0.733 (0.919) for the high-tech firms and 0.171 (0.452) for those in other sectors; that is, on average, auditors charge high-tech firms 4.7% more in fees than other firms due to greater R&D investments, knowledge capital, and patents.9 The regression results are in columns (1) and (2) of Table 6. Consistent with H1 and H2, the KCINT and Log(Patent) coefficients are significantly positive for both subsamples. Chi-squared tests show that the coefficients on both variables are statistically different at the 1% level between high-tech and other industries. This implies that auditors tend to charge high-tech firms more fees for higher intensity of knowledge capital, and the marginal effect of Log(Patent) on audit pricing is smaller compared to that of KCINT. On average, while there are significantly fewer R&D activities in firms out of the high-tech sector, auditors still charge these firms more fees for higher R&D knowledge intensity and more patents granted. We also use Log(CPatent) for robustness checks to confirm the results (untabulated).
Second, we examine whether the quality of the financial reporting matters. We apply the modified Jones model to estimate the magnitude of discretionary accruals as the proxy of reporting quality (Dechow et al., 1995; Bills et al., 2016) and partition the full sample based on the median of this measure. The results for low and high discretionary accruals (high and low reporting quality) are presented in columns (3) and (4) of Table 6, respectively. The KCINT and Log(Patent) coefficients are significantly positive at the 1% level. When comparing the coefficients, we find that the coefficient of Log(Patent) for the low discretionary accruals subsample is significantly greater than that for the high discretionary accrual subsample at the 1% level. In contrast, the KCINT coefficients across the two groups are not statistically significant, implying that auditors allocate more effort and time to tangible assets when deemed risky.
Third, we split the sample by size based on the median of total assets and present the results for small and large companies in columns (5) and (6) of Table 6, respectively. The Chi-squared test illustrates that the coefficient of Log(Patent) for small firms is significantly greater than that for large firms, suggesting that auditors of small companies are associated with higher litigation risk and thus make more effort to audit their innovation outputs. The untabulated results are consistent with those reported in Table 6 when alternative R&D depreciation rates or Log(CPatent) are used in the regression model.

4.3. GoingConcern Opinion as Alternative Measure

While audit fee is a standard proxy for auditors’ effort and workload, it does not directly reflect an auditor’s decisions, such as accepting a new client or issuing a specific type of audit opinion. We therefore employ an alternative indicator, the issuance of the going concern opinion as the dependent variable (Concern) and revise the main research model following prior studies to examine auditors’ reaction to corporate innovation, a specific risk factor. Specifically, we use the probit regression model, exclude variables for complexity, and add more controls for client financial characteristics, including Altman’s (1968) Z-Score (ZScore) and operating cash flows (OCF). Auditors would consider issuing going concern opinions when the client firms have been identified as substantial risks or being not financially viable in the foreseeable future. We therefore restrict the sample to those receiving first-time going concern opinions and being financially distressed based on negative operating cash flows and net losses (Blay & Geiger, 2013; Berglund et al., 2018).
Table 7 presents the probit regression results regressing going concern opinion indicator on corporate innovation measures. In both columns (1) and (2), the coefficients of KCINT are significantly positive at the 1% level, and the coefficients of Log(Patent) and Log(CPatent) are significantly negative at the 5% level or better. For control variables, the coefficients of INTAN are consistently and significantly positive, suggesting that firms with more intangibles recorded on the balance sheet are also more likely to receive going concern opinions. Overall, the results indicate that financially constrained firms are more likely to receive going concern opinions when engaging in internal R&D activities to create knowledge capital or having more acquired intangible assets due to their nature of uncertainty and higher information asymmetry. Conversely, auditors’ concerns are alleviated when firms are generating more innovation outputs. Following the main research design, we use alternative R&D depreciation rates to construct the measures of knowledge capital intensity, and the results (untabulated) are consistent with those reported in Table 7.

4.4. Innovation Efficiency, Patent Age, and Audit Fees

In addition to innovation inputs and output (quantity), auditors may incorporate the relationship between the two factors and the average age of patent portfolios into their risk assessment and audit planning. We, therefore, include related measures in the main model as an additional test. We view innovation as an internal process converting R&D investments into innovation outputs and developing measures of innovation efficiency. As a higher innovation efficiency signals better utilization of limited R&D resources and lower uncertainty for a given level of innovation outputs, we expect auditors to charge lower fees for the lower risk. Following Hirshleifer et al. (2013), we define innovation efficiency (PEFF) as the ratio of a firm i’s patents granted in year t to its prior 5-year cumulative R&D expenditures (R&D) with a 20% annual depreciation rate: Patenti,t/(R&Di,t−2 + 0.8 × R&Di,t−3 + 0.6 × R&Di,t−4 + 0.4 × R&Di,t−5 + 0.2 × R&Di,t−6). The 5-year cumulative R&D period starts from year t−2 because it takes about two years for a patent application to be granted (Hall et al., 2001). Similarly, to adjust for the innovation quality, we define citation-weighted innovation efficiency (CEFF) as CPatenti,t/(R&Di,t−2 + 0.8 × R&Di,t−3 + 0.6 × R&Di,t−4 + 0.4 × R&Di,t−5 + 0.2 × R&Di,t−6). We construct the average age of patent portfolio (PAge) as k = 0 18 k + 2 × P a t e n t i t k / k = 0 18 P a t e n t i t k to control for the potential technological obsolescence of a firm’s patent portfolio.10
The results are reported in Table 8. Columns (1) and (2) demonstrate that the coefficients of KCINT, Log(Patent), and Log(CPatent) are significantly positive at the 1% level, consistent with H1 and H2. The coefficients of PEFF and CEFF are significantly negative at the 1% level, suggesting auditors charge lower fees for clients with higher innovation efficiency. The coefficients of PAge are significantly positive at the 1% level. Thus, auditors view the age of the patent portfolio as a risk factor and exert more effort to ensure financial reporting quality. The coefficients on other control variables (untabulated) are consistent with those reported in prior studies.

5. Conclusions

In the past decades, firms have increasingly relied on R&D and intangible assets to gain a competitive advantage over their rivals and achieve superior financial performance. However, whether auditors can change auditing practices to adapt to such a rapidly evolving environment remains unknown. This study investigates whether and how the client’s R&D activities affect auditors’ risk perceptions in formulating their pricing and going concern decisions.
Our empirical results provide evidence that R&D investments and corporate innovation significantly affect auditors’ pricing. Specifically, we find that higher intensity of R&D knowledge capital, more quantity, and broader scope of innovation are associated with higher audit fees. However, these R&D assets are not reported on the balance sheet. These results are consistent with more audit efforts necessary to evaluate numerous management assertions required for intangible assets. This association is more pronounced for high-tech firms and small firms with higher audit litigation risk, but less pronounced for firms with lower reporting quality. In the latter case, it implies that auditors prioritize riskier areas to reduce costs. In the additional analyses, we document that innovation efficiency is significantly associated with lower audit fees after controlling for concurrent financial performance, suggesting that innovation efficiency affects auditors’ assessment of litigation risk caused by R&D activities. These findings are consistent with prior audit studies documenting that auditors make informed pricing decisions and rationally adjust them based on various client characteristics. Furthermore, auditors are more likely to issue going concern opinions when financially constrained firms are engaging in internal R&D activities to create knowledge capital or have more acquired intangibles from external sources due to higher uncertainty or information asymmetry of these assets.
PCAOB inspections have identified deficiencies in auditing management’s accounting estimates for intangible and other long-lived assets since 2008 (PCAOB, 2008). FASB also seeks comments on accounting and disclosure of intangibles, including those not recognized in the financial statements, in a very recent announcement (FASB, 2024a). Our study echoes it and demonstrates auditors’ need for guidance on reporting innovation activities, especially internally developed intangibles (e.g., patents). As auditors do consider uncertainty and risks tied to innovation in formulating their pricing and going concern decisions, FASB should consider how to include and measure intangibles that are not reported in current accounting systems in the updated intangible accounting standards.
Our study examines the effects of firm innovation on audit work by observable proxies from the client side, including innovation inputs (i.e., R&D expenditure) and outputs (i.e., patent-based measures), and auditor side, including audit fees and going concern decisions. Future researchers may further explore this topic by investigating specific audit plans and risk assessment, the allocation of working hours or different levels of personnels in the audit firms, and/or quantity and complexity of auditors’ working papers with regard to clients’ intangible assets, R&D investments, or innovation strategies.

Author Contributions

Conceptualization, D.R.D. and D.Z.; methodology, H.-T.H. and D.Z.; software, H.-T.H. and D.Z.; validation, H.-T.H. and D.Z.; formal analysis, D.Z.; investigation: H.-T.H. and D.Z.; writing—Original Draft: D.Z.; writing—review & editing, D.R.D. and H.-T.H.; supervision, D.R.D.; project administration, D.R.D. All authors have read and agreed to the published version of the manuscript.

Funding

This research received no external funding.

Informed Consent Statement

Not applicable.

Data Availability Statement

Data are available from sources indicated in the paper.

Acknowledgments

We would like to express our heartfelt gratitude to the participants at the 2020 American Accounting Association (AAA) Annual Meeting, the 2020 AAA Auditing Section Midyear Meeting, and the College of Business Research Seminar Series, Texas A&M University-Corpus Christi for their invaluable feedback. We also appreciate the thoughtful comments of three anonymous reviewers that enriched our research. This research received no specific grant from funding agencies in the public, commercial, or not-for-profit sectors.

Conflicts of Interest

The authors declare no conflict of interest.

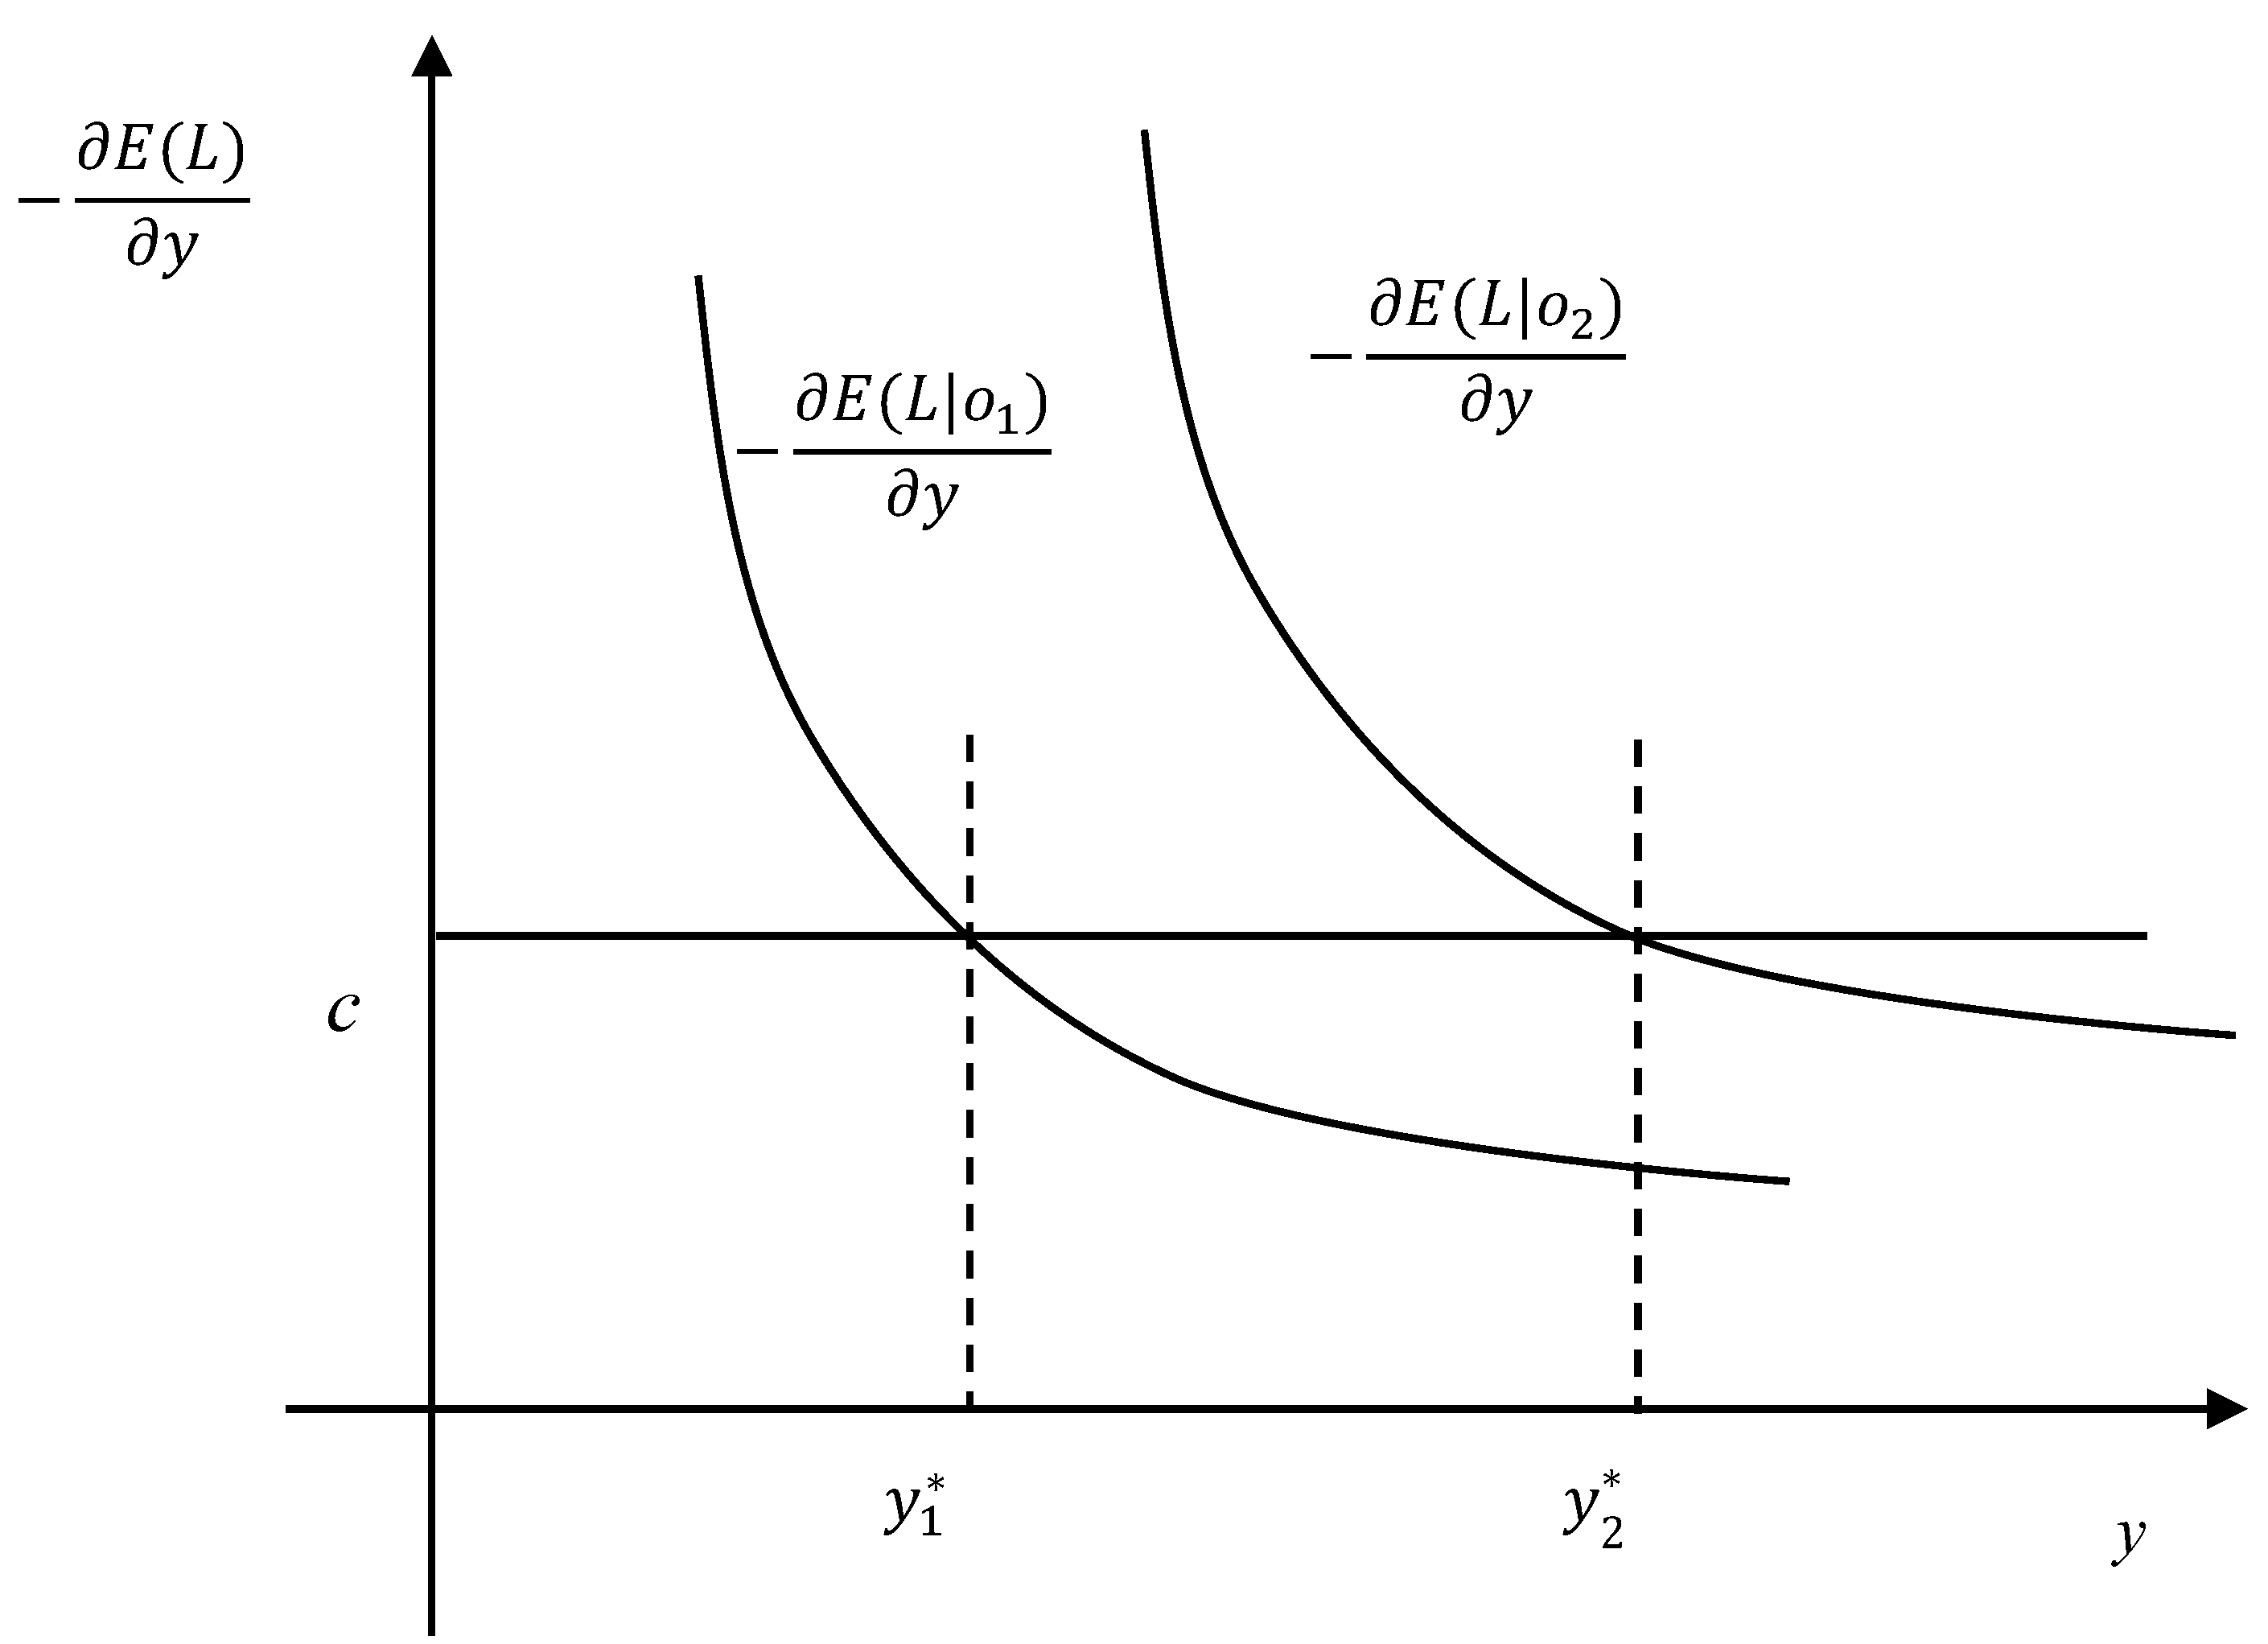
Appendix A. Comparative Static Analysis Based on Simunic’s (1980) Theoretical Model of Audit Fees

In the seminal work, Simunic (1980) proposes a theoretical model of audit fee determinants to explain the role of market competition in audit pricing. Although the model provides highly valuable insights into three industry scenarios, such as competition, monopoly, and auditor economies, Simunic (1980) does not explicitly explain whether and how intangible assets affect audit pricing decisions. Here, we extend Simunic’s (1980) theoretical model to draw insights into how intangible assets would affect the quantity of resources utilized by auditors in an audit examination in an equilibrium. As in Simunic (1980), we assume that a financial reporting system can be characterized by two strategic variables, (x, y), where x represents the number of resources used by an auditee in its internal accounting system, and y represents the number of resources used by its auditor in performing audit examinations. In addition, we add a contextual variable, intangibility (o), to reflect the heterogeneity of financial reporting systems across auditees in the presence of intangible assets. Without loss of generality, assume the random variable, L, represents the present value of possible losses attributable to defects in the audited financial statements. Thus, the expected liability loss function for given levels of (x, y, o) is as follows, E L = f x , y ,   o . Analogous to Simunic (1980), we assume the first-order and second-order conditions regarding x and y include
E L / x < 0 ,   2 E L / x 2 > 0 , E L / y < 0 , 2 E L / y 2 > 0 , and 2 E L / x y > 0 .
At any given level of expected loss, E L , the rate of substitution between x and y satisfies
d x / d y < 0 , and   d 2 x / d y 2 > 0 .
Additionally, we assume that the expected liability loss of financial reporting deficiencies increases with respect to intangibility, o, due to the uncertain nature of intangible assets. The additional quantity of resources used by the auditee (x) or the auditor (y) will reduce the rate of increase in expected loss caused by the increase in intangibility. That is,
E L / o > 0 ,   E L / o x < 0 ,   and   E L / o y < 0 .
As shown in Simunic (1980), an auditee will select the optimal pair of x, y to minimize the expected total costs of financial reporting system for any given level of intangibility, o, as follows:
M i n   E T C = v x + c y + E ( L | x , y , o )
Then, the audit fee for different levels of audit services equals
E A F | y , o = c y + E ( L | x , y , o ) E P
where v is the unit cost of the resources used by the auditee’s internal accounting system, and c is the unit cost of the resources used by the auditor. E(P) is the expected fraction of the liability losses borne by the auditor. As in Simunic (1980), assume the ex-post faction, P, and potential losses, L, are independent. For any given level of o, the necessary first-order conditions for the cost minimization problem is
E T C x = E L x + v = 0 ,   and   E T C y = E L y + c = 0 .
Which is equivalent to E L x = v , and E L y = c .
That is, the optimal quantity of audit service, y, is determined by the auditee’s marginal reductions in expected loss with respect to y and the unit cost of y.
Figure A1. Comparative static analysis of optimal quantities of audit service y.
Ijfs 13 00042 g0a1
As shown in Figure A1, at a given level of intangibility, o 1 , the optimal quantity of audit service, y 1 * , is determined by the intersection of the line for the partial derivative function of marginal reduction in expected loss with respect to y ( E ( L | o 1 ) y ) and the line for unit cost of y. When the level of intangibility increases to o 2 , the line for partial derivative function E ( L | o 2 ) y shifts upward because E L y o = E L o y > 0 . As a result, the optimal quantity of audit services will increase from y 1 * to y 2 * .
The auditor will charge higher fees for a greater quantity of audit services as the intangibility of the auditee’s financial reporting system increases. Meanwhile, E L | o 2 > E ( L | o 1 ), as E L / o > 0 .
Therefore, the auditor will charge more fees for a greater quantity of audit services, y 2 * , and a higher expected liability loss, E L | o 2 , as the intangibility of the firm’s financial reporting system increases from o 1 to o 2 .

Notes

1
Since 2009, the market value of intangible assets for S&P 500 companies has increased by 255%, while the growth of tangible assets is only 97% over the same period, creating an “unbalanced balance sheet” (PwC, 2021).
2
There are some exceptions (e.g., specific software-delated R&D spending may be capitalized under ASC 985.
3
On 19 December 2024, FASB issued an Invitation to Comment, “Recognition of Intangibles”, to solicit stakeholder feedback on accounting and reporting on intangibles, including “whether different accounting for intangibles should exist depending on how the asset is obtained (internally developed, acquired in a business combination, or acquired in an asset acquisition” (FASB, 2024a, p. 1) or should the recognition of intangibles be consistently aligned regardless of how they are acquired or generated (FASB, 2024a, p. 14).
4
The details based on Simunic’s theoretical audit fee model are presented in Appendix A.
5
6
R&D expense data is from the Compustat database, assuming the knowledge capital before 1970 is negligible. For a firm listed after 1970, the initial knowledge capital is set to the firm’s first recorded R&D expense in Compustat.
7
The data is available at https://kelley.iu.edu/nstoffma/ (accessed on 25 February 2025).
8
The Pearson correlation coefficient between Log(Patent) and Log(TECHCL) is 0.9745.
9
Exp(0.096 × 0.733 + 0.018 × 0.919 − 0.060 × 0.171 − 0.067 × 0.452) − 1 = 4.7%.
10
Here, we assume that the patent granted in year t has an age of two and will have a term of eighteen years.

References

  1. Ali, A., & Kallapur, S. (2001). Securities price consequences of the private securities litigation reform act of 1995 and related events. The Accounting Review, 76(3), 431–460. [Google Scholar] [CrossRef]
  2. Altman, E. (1968). Financial ratios, discriminant analysis and the prediction of corporate bankruptcy. The Journal of Finance, 23(4), 589–609. [Google Scholar] [CrossRef]
  3. Antonelli, C. (2019). Knowledge as an economic good: Exhaustibility versus appropriability? The Journal of Technology Transfer, 44(3), 647–658. [Google Scholar] [CrossRef]
  4. Antonelli, C., Orsatti, G., & Pialli, G. (2023). The knowledge-intensive direction of technological change. Eurasian Business Review, 13, 1–27. [Google Scholar] [CrossRef]
  5. Appleton, A., Barckow, A., Botosan, C. A., Kawanishi, Y., Kogasaka, A., Lennard, A., Mezon-Hutter, L., Sy, J., & Villmann, R. (2023). Perspectives on the financial reporting of intangibles. Accounting Horizons, 37(1), 1–13. [Google Scholar] [CrossRef]
  6. Banker, R. D., Wattal, S., & Plehn-Dujowich, J. M. (2011). R&D versus acquisitions: Role of diversification in the choice of innovation strategy by information technology firms. Journal of Management Information Systems, 28(2), 109–144. [Google Scholar]
  7. Basioudis, I. G., & Francis, J. R. (2007). Big 4 audit fee premiums for national and office-level industry leadership in the United Kingdom. Auditing: A Journal of Practice and Theory, 26(2), 143–166. [Google Scholar] [CrossRef]
  8. Bentley, K. A., Omer, T. C., & Sharp, N. Y. (2013). Business strategy, financial reporting irregularities, and audit effort. Contemporary Accounting Research, 30(2), 780–817. [Google Scholar] [CrossRef]
  9. Berglund, N. R., Eshleman, J. D., & Guo, P. (2018). Auditor size and going-concern reporting. Auditing: A Journal of Practice and Theory, 37(2), 1–25. [Google Scholar] [CrossRef]
  10. Bills, K., Jeter, D. C., & Stein, S. E. (2015). Auditor industry specialization and evidence of cost efficiencies in homogenous industries. The Accounting Review, 90(5), 1721–1754. [Google Scholar] [CrossRef]
  11. Bills, K. L., Swanquist, Q. T., & Whited, R. L. (2016). Growing pains: Audit quality and office growth. Contemporary Accounting Research, 33(1), 288–313. [Google Scholar] [CrossRef]
  12. Biscione, A., Burlina, C., & Felice, A. (2024). Knowledge flows and innovation: A pseudo-panel approach. Applied Economics, 56(30), 3636–3651. [Google Scholar] [CrossRef]
  13. Blay, A. D., & Geiger, M. A. (2013). Auditor fees and auditor independence: Evidence from going-concern reporting decisions. Contemporary Accounting Research, 30(2), 579–606. [Google Scholar] [CrossRef]
  14. Corrado, C. A., & Hulten, C. R. (2010). How do you measure a ‘Technological Revolution’? The American Economic Review, 100(2), 99–104. [Google Scholar] [CrossRef]
  15. Datta, S., Jha, A., & Kulchania, M. (2020). On accounting’s twenty-first century challenge: Evidence on the relation between intangible assets and audit fees. Review of Quantitative Finance and Accounting, 55(1), 123–162. [Google Scholar] [CrossRef]
  16. Dechow, P. M., Sloan, R. G., & Sweeney, A. P. (1995). Detecting earnings management. The Accounting Review, 70(2), 193–225. [Google Scholar]
  17. DeFond, M. L., Francis, J. R., & Wong, T. J. (2000). Auditor industry specialization and market segmentation: Evidence from Hong Kong. Auditing: A Journal of Practice and Theory, 19(1), 49–66. [Google Scholar] [CrossRef]
  18. Deis, D. R., Jr., & Giroux, G. (1996). The effect of auditor changes on audit fees, audit hours, and audit quality. Journal of Accounting and Public Policy, 15(1), 55–76. [Google Scholar] [CrossRef]
  19. Deloitte. (2023). Deloitte IP 360 survey 2023. Available online: https://www.deloitte.com/au/en/services/financial-advisory/perspectives/deloitte-ip-360-survey.html (accessed on 9 July 2024).
  20. Demis, H., Dosso, M., Hervás Soriano, F., Millot, V., Squicciarini, M., & Vezzani, A. (2015). World corporate top R&D investors: Innovation and IP bundles. EUR 27129. Publications Office of the European Union. JRC94932. Available online: https://publications.jrc.ec.europa.eu/repository/handle/JRC94932 (accessed on 9 July 2024).
  21. Financial Accounting Standards Board (FASB). (2024a). Invitation to comment: Recognition of intangibles. File Reference No. 2024-ITC200. Available online: https://www.fasb.org/page/ShowPdf?path=ITC%E2%80%94Recognition%20of%20Intangibles.pdf&title=Invitation%20to%20Comment%E2%80%94Recognition%20of%20Intangibles (accessed on 9 December 2024).
  22. Financial Accounting Standards Board (FASB). (2024b). Meeting with the Investor Advisory Committee (IAC)—Thursday, May 16, 2024. YouTube. [Video segment 31:00 to 37:40]. Available online: https://www.youtube.com/watch?v=sAoxrQmelPo&t=4s (accessed on 20 August 2024).
  23. Francis, J., & Schipper, K. (1999). Have financial statements lost their relevance? Journal of Accounting Research, 37(2), 319–352. [Google Scholar] [CrossRef]
  24. Fraser, I., Tarbert, H., & Tee, K. H. (2009). Do the financial statements of intangible-intensive companies hold less information content for investors? Applied Economics, 19(17), 1433–1438. [Google Scholar] [CrossRef]
  25. Glaeser, S., & Lang, M. H. (2023). Measuring innovation and navigating its unique information issues: A review of the accounting literature on innovation. working paper. Kenan Institute of Private Enterprise Research Paper No. 4500800. Available online: https://papers.ssrn.com/sol3/papers.cfm?abstract_id=4500800 (accessed on 3 February 2023).
  26. Gordon, E., Hsu, H.-T., & Huang, H. (2020). Peer R&D disclosure and corporate innovation: Evidence from american depositary receipt firms. Advances in Accounting 49, 100471. [Google Scholar]
  27. Griliches, Z. (1979). Issues in assessing the contribution of research and development to productivity growth. The Bell Journal of Economics, 10(1), 92–116. [Google Scholar] [CrossRef]
  28. Griliches, Z. (1986). Productivity, R&D, and basic research at the firm level in the 1970s. The American Economic Review, 76(1), 141–154. [Google Scholar]
  29. Gunny, K. A. (2010). The relation between earnings management using real activities manipulation and future performance: Evidence from meeting earnings benchmarks. Contemporary Accounting Research, 27(3), 855–888. [Google Scholar]
  30. Hainmueller, J. (2012). Entropy balancing for causal effects: A multivariate reweighting method to produce balanced samples in observational studies. Political Analysis, 20(1), 25–46. [Google Scholar] [CrossRef]
  31. Hair, J. F., Anderson, R., Tatham, R. L., & Black, W. C. (2006). Multivariate data analysis. Prentice Hall. [Google Scholar]
  32. Hall, B. H., Jaffe, A., & Trajtenberg, M. (2001). The NBER patent citation data file: Lessons, insights, and methodological tools. NBER working paper 8498. Available online: http://www.nber.org/papers/w8498 (accessed on 7 October 2019).
  33. Hand, J., & Lev, B. (2003). Intangible assets: Values, measures, and risks. Oxford University Press Inc. [Google Scholar]
  34. Hay, D., Knechel, R., & Wong, N. (2006). Audit fees: A meta-analysis of the effect of supply and demand attributes. Contemporary Accounting Research, 23(1), 141–191. [Google Scholar] [CrossRef]
  35. Healy, P. M., Myers, S. C., & Howe, C. D. (2002). R&D accounting and the tradeoff between relevance and objectivity. Journal of Accounting Research, 40(3), 677–710. [Google Scholar]
  36. Hirshleifer, D., Hsu, P.-H., & Li, D. (2013). Innovative efficiency and stock returns. Journal of Financial Economics, 107(3), 632–654. [Google Scholar] [CrossRef]
  37. Iqbal, A., Rajgopal, S., Srivastava, A., & Zhao, R. (2024). A better estimate of internally generated intangible capital. Management Science, 71, iv–vi, 1–953, vii–vii. [Google Scholar] [CrossRef]
  38. Klette, T. J., & Kortum, S. (2004). Innovating firms and aggregate innovation. Journal of Political Economy, 112(5), 986–1018. [Google Scholar] [CrossRef]
  39. Kogan, L., Papanikolaou, D., Seru, A., & Stoffman, N. (2017). Technological innovation, resource allocation and growth. Quarterly Journal of Economics, 132(2), 665–712. [Google Scholar] [CrossRef]
  40. Krishnan, G., & Wang, C. (2015). The relation between managerial ability and audit fees and going concern opinions. Auditing: A Journal of Practice and Theory, 34(3), 139–160. [Google Scholar] [CrossRef]
  41. Krishnan, J., & Krishnan, J. (1997). Litigation risk and auditor resignations. The Accounting Review, 72(4), 539–560. [Google Scholar]
  42. Laperche, B. (2013). Entrepreneurial behavior and eco-innovation. In E. G. Carayannis (Ed.), Encyclopedia of creativity, invention, innovation and entrepreneurship (pp. 598–603). Springer. [Google Scholar]
  43. Lev, B. (2019). Ending the accounting-for-intangibles status quo. European Accounting Review, 28(4), 713–736. [Google Scholar] [CrossRef]
  44. Lev, B., & Gu, F. (2016). The end of accounting and the path forward for investors and managers. John Wiley & Sons Inc. [Google Scholar]
  45. Li, W. C. Y., & Hall, B. H. (2020). Depreciation of business R&D capital. The Review of Income and Wealth, 66(1), 161–180. [Google Scholar]
  46. Low, K.-Y. (2004). The effects of industry specialization on audit risk assessments and audit-planning decisions. The Accounting Review, 79(1), 201–219. [Google Scholar] [CrossRef]
  47. Mackie-Mason, J. (1990). Do taxes affect corporate financing decisions? The Journal of Finance, 45(5), 1471–1493. [Google Scholar] [CrossRef]
  48. Oswald, D. R. (2008). The determinants and value relevance of the choice of accounting for research and development expenditures in the United Kingdom. Journal of Business Finance and Accounting, 35(1–2), 1–24. [Google Scholar] [CrossRef]
  49. Oswald, D. R., & Zarowin, P. (2007). Capitalization of R&D and the informativeness of stock prices. European Accounting Review, 16(4), 703–726. [Google Scholar]
  50. Passov, R. (2003). How much cash does your company need? Harvard Business Review, 81(11), 119–122. [Google Scholar]
  51. Peters, R. H., & Taylor, L. A. (2017). Intangible capital and the investment-q relation. Journal of Financial Economics, 123(2), 251–272. [Google Scholar] [CrossRef]
  52. PricewaterhouseCoopers LLP (PwC). (2021). Viewpoint: The unbalanced balance sheet: Making intangibles count. Available online: https://nsacoop.org/articles/unbalanced-balance-sheet-make-intangibles-count (accessed on 27 April 2021).
  53. Public Company Accounting Oversight Board (PCAOB). (2008). Report on the PCAOB’s 2004, 2005, 2006, and 2007 inspections of domestic annually inspected firms. PCAOB Release No. 2008-008. PCAOB. [Google Scholar]
  54. Public Company Accounting Oversight Board (PCAOB). (2015). Information about 2015 inspections (Vol. 2015/2). PCAOB Staff Inspection Brief. PCAOB. [Google Scholar]
  55. Simunic, D. (1980). The pricing of audit services: Theory and evidence. Journal of Accounting Research, 18(1), 161–190. [Google Scholar] [CrossRef]
  56. Simunic, D. A., & Stein, M. T. (1996). The impact of litigation risk on audit pricing: A review of the economics and the evidence. Auditing: A Journal of Practice & Theory 15, 119–134. [Google Scholar]
  57. Stice, J. D. (1991). Using financial market information to identify pre-engagement factors associated with lawsuits against auditors. The Accounting Review, 66(3), 516–533. [Google Scholar]
  58. Taylor, S. (2011). Does audit fee homogeneity exist? premiums and discounts attributable to individual partners. Auditing: A Journal of Theory and Practice, 30(4), 249–272. [Google Scholar] [CrossRef]
  59. Visvanathan, G. (2017). Intangible assets on the balance sheet and audit fees. International Journal of Disclosure and Governance, 14(3), 241–250. [Google Scholar] [CrossRef]
  60. Whisenant, S., Sankaraguruswamy, S., & Raghunandan, K. (2003). Evidence on the joint determination of audit and non-audit fees. Journal of Accounting Research, 41(4), 721–744. [Google Scholar] [CrossRef]
  61. Zhang, D., Amin, K. A., & Deis, D. R. (2021). Audit risk associated with long-lived tangible asset intensity, age, and impairment. Journal of Forensic and Investigative Accounting, 13(2), 333–348. [Google Scholar] [CrossRef]
Table 1. Definitions of dependent and independent variables.
VariablesDescriptions
Log(AF)= the natural logarithm of (1 + AF), where AF is audit fees;
KCINT= Knowledge capital scaled by total assets, where knowledge capital is estimated by accumulating past R&D investments using a perpetual inventory method, as in Peters and Taylor (2017).
Log(Patent)= the natural logarithm of (1 + Patent), where patent is the number of patents granted during the fiscal year;
Log(CPatent)= the natural logarithm of (1 + CPatent), where CPatent is citation-weighted patents as defined in Kogan et al. (2017);
Log(TECHCL)= the natural logarithm of (1 + TECHCL), where TECHCL is the number of technology classes of patents granted based on the US Patent Classification System;
INTAN= the ratio of intangible assets to total assets;
BigN= 1 if a firm is audited by one of the Big 4 auditors, and 0 otherwise;
Specialist= 1 if an auditor has a market share of two-digit SIC code industry equal to or greater than 30%, as in Bills et al. (2015), and 0 otherwise;
Size= the natural logarithm of a firm’s total assets;
Log(Segment)= the natural logarithm of Segment, which is the number of business segments;
Foreign= foreign operation indicator equal to 1 if foreign exchange gain or loss exceeds USD 10,000 (Krishnan & Wang, 2015) or pretax foreign income or loss exceeds USD 10,000, and 0 otherwise;
ACQ= 1 if a firm has acquisitions in the current fiscal year, and 0 otherwise;
Pension= 1 if a firm’s pension and retirement expense is greater than zero, and 0 otherwise;
XISPI= 1 if a firm’s extraordinary or special items are greater than zero, and 0 otherwise;
ROA= return on assets, defined as income before extraordinary items scaled by total assets;
Loss= 1 if a firm’s ROA is negative, and 0 otherwise;
INVREC= the ratio of inventories and receivables to total assets;
Quick= quick ratio, defined as the ratio of current assets less inventories to total current liabilities;
Leverage= financial leverage, defined as the ratio of total liabilities to total assets;
NDI= 1 if there are new equity issues, and 0 otherwise;
NEI= 1 if there are new debt issues, and 0 otherwise;
Concern= going concern opinions, defined as an indicator variable equal to 1 if a firm received a qualified going concern opinion and 0 otherwise;
Restatement= 1 if there is a financial restatement, and 0 otherwise.
FYAudit= 1 if a firm hires a new auditor, and 0 otherwise
Log(REPLAG)= the natural logarithm of audit report lag, defined as the number of days between fiscal year-end and audit opinion filing date
Log(NAF)= the natural logarithm of (1 + NAF), where NAF is non-audit fees;
December= 1 if a firm’s fiscal year ends in December and 0 otherwise;
BtM= the ratio of a firm’s book value to its market value;
SGrowth= the percentage change in net sales from year t − 1 to t;
Litigation= 1 if a firm is in high litigation risk industries (SIC codes 2833–2836, 3570–3577, 3600–3674, 5200–5961, 7370–7374, 8731–8734) defined by Ali and Kallapur (2001);
Log(Age)= the natural logarithm of Age, where Age is the number of years that a firm has been publicly listed;
ZScore= A modified version of Altman’s (>1968) Z-Score, equal to 3.3 × Net Incomet/Assetst−1) + Salest/Assetst−1 + 1.4 × (Retained Earningst/Assetst−1) + 1.2 × (Working Capitalt/Assetst−1) (see Mackie-Mason, 1990; Gunny, 2010).
OCF= net operating cash flows scaled by total assets;
PEFF= patent innovation efficiency, defined as Patenti,t/(R&Di,t−2 + 0.8 × R&Di,t−3 +
0.6 × R&Di,t−4 + 0.4 × R&Di,t−5 + 0.2 × R&Di,t−6) following Hirshleifer et al. (2013), where Patent is the number of patents granted, and R&D is the R&D expenditure;
CEFF= citation-weighted innovation efficiency, defined as CPatenti,t/(R&Di,t−2+ 0.8 × R&Di,t−3 + 0.6 × R&Di,t−4 + 0.4 × R&Di,t−5 + 0.2 × R&Di,t−6), where CPatent is the citation-weighted patents and R&D is the R&D expenditure;
PAge = average   age   of   patent   portfolio ,   defined   as   k = 0 18 k + 2 × P a t e n t i t k / k = 0 18 P a t e n t i t k , where patent represents the number of patents granted.
Table 2. Sample selection process.
Selection Step Observations
The initial sample was drawn from Compustat and Audit Analytics (2000–2019)231,963
Remove firm-year observations of utilities (SIC 4900–4999) and financial institutions (SIC 6000–6999)−81,628
Remove observations with missing audit fee data−48,778
Remove observations with missing data on independent variables−31,355
Final sample size for audit fee models70,202
Table 3. Descriptive statistics of dependent and independent variables.
VariablesMeanStd. Dev.25th50th75th
AF1,326,5732,296,216159,260517,3471,417,910
KCINT0.3600.94100.0360.287
Patent12.1095.02001
CPatent192.232,396.14003
TECHCL2.0347.939001
INTAN0.1640.20400.0740.265
BigN0.6620.473011
Specialist0.2280.420001
Size5.3592.4963.7245.4717.101
Segment2.2571.798113
Foreign0.2910.454001
ACQ0.3350.472001
Pension0.6650.472011
XISPI0.6490.477011
ROA−0.2561.051−0.1430.0160.067
Loss0.4400.496001
INVREC0.2520.1960.0920.2160.367
Quick2.3412.7820.8711.4542.645
Leverage0.5450.3520.2920.4870.691
NDI0.2740.446001
NEI0.4790.499001
Concern0.1090.312000
Restatement0.1060.308000
FYAudit0.1960.397000
REPLAG120.782.8288104119
NAF425,308.91,545,8779,00067,085.5293,600
December0.6940.461011
BtM0.6500.3730.3720.6150.874
SGrowth0.2270.921−0.0440.0610.222
Litigation0.4070.491001
Age17.1711.7381424
PEFF0.0740.129000.090
CEFF1.0532.345000.609
PAge6.4223.2413.6675.9178.845
Table 4. Pooled OLS regression results of knowledge capital, patents, and auditor fees.
Dep. Var. Log (AF)
Variables(1)(2)(3)
KCINT0.077 ***0.078 ***0.077 ***
(12.710)(12.853)(12.661)
Log(Patent)0.044 ***
(7.065)
Log(CPatent) 0.022 ***
(7.322)
Log(TECHCL) 0.072 ***
(8.530)
INTAN0.088 ***0.087 ***0.089 ***
(2.649)(2.621)(2.658)
BigN0.298 ***0.295 ***0.297 ***
(11.188)(10.916)(11.194)
Specialist0.053 ***0.054 ***0.053 ***
(4.395)(4.432)(4.397)
Size0.463 ***0.466 ***0.463 ***
(57.508)(63.231)(58.249)
Log(Segment)0.083 ***0.084 ***0.081 ***
(8.694)(8.750)(8.568)
Foreign0.103 ***0.104 ***0.103 ***
(6.170)(6.170)(6.124)
ACQ0.049 ***0.048 ***0.048 ***
(5.863)(5.790)(5.818)
Pension0.079 ***0.078 ***0.078 ***
(4.857)(4.845)(4.815)
XISPI0.140 ***0.140 ***0.139 ***
(17.933)(18.218)(17.772)
ROA−0.054 ***−0.055 ***−0.054 ***
(−9.071)(−9.173)(−9.015)
Loss0.135 ***0.134 ***0.134 ***
(12.685)(12.768)(12.646)
INVREC0.346 ***0.348 ***0.347 ***
(9.697)(9.773)(9.734)
Quick−0.015 ***−0.015 ***−0.015 ***
(−5.671)(−5.719)(−5.729)
Leverage0.176 ***0.179 ***0.177 ***
(6.883)(7.054)(6.890)
NDI−0.044 ***−0.044 ***−0.044 ***
(−4.986)(−5.045)(−4.970)
NEI0.020 ***0.019 **0.020 ***
(2.655)(2.401)(2.659)
Concern0.036 *0.039 **0.036 *
(1.916)(2.102)(1.904)
Restatement0.038 **0.037 **0.039 **
(2.118)(2.022)(2.114)
FYAudit−0.267 ***−0.266 ***−0.266 ***
(−10.275)(−10.211)(−10.280)
Log(REPLAG)0.090 ***0.090 ***0.091 ***
(4.351)(4.363)(4.399)
Log(NAF)0.018 ***0.018 ***0.018 ***
(9.331)(9.371)(9.325)
December0.038 *0.038 *0.037 *
(1.927)(1.916)(1.898)
BtM−0.130 ***−0.130 ***−0.128 ***
(−4.695)(−4.814)(−4.669)
SGrowth−0.016 ***−0.016 ***−0.016 ***
(−4.604)(−4.669)(−4.625)
Litigation0.0020.0040.005
(0.110)(0.187)(0.246)
Log(Age)−0.013−0.011−0.014
(−1.261)(−1.068)(−1.378)
FE: Industry and YearYesYesYes
Observations70,20270,20270,202
Adjusted R-squared0.8250.8250.825
t-statistics in parentheses. *** p < 0.01, ** p < 0.05, * p < 0.1.
Table 5. OLS regression results of knowledge capital, patents, and auditor fees using alternative R&D depreciation rates.
Dep. Var. Log (AF)
Variables(1)(2)(3)
KCINT150.065 ***
(12.703)
KCINT20 0.082 ***
(12.852)
KCINT25 0.101 ***
(12.996)
Log(Patent)0.044 ***0.044 ***0.043 ***
(7.051)(7.036)(7.016)
INTAN0.088 ***0.090 ***0.091 ***
(2.613)(2.654)(2.692)
Other ControlsIncludedIncluded Included
FE: Industry and YearYesYesYes
Observations70,20270,20270,202
Adjusted R-squared0.8250.8250.825
t-statistics in parentheses. *** p < 0.01.
Table 6. Cross-sectional analyses of knowledge capital, patents, and auditor fees by industry, reporting quality, and firm size.
Variables(1) High Tech(2) Other(3) Low(4) High(5) Small(6) Large
KCINT0.096 ***0.060 ***0.090 ***0.074 ***0.073 ***0.113 **
(11.824)(6.424)(11.444)(10.578)(11.470)(2.543)
Log(Patent)0.018 **0.067 ***0.048 ***0.026 ***0.062 ***0.034 ***
(2.227)(7.877)(5.519)(3.677)(4.842)(5.141)
Other ControlsIncludedIncluded IncludedIncludedIncludedIncluded
FE: Industry and YearYesYesYesYesYesYes
Observations23,66046,54229,41929,41835,10135,101
Adjusted R-squared0.8060.8350.8250.8270.6280.705
Test of difference
KCINT8.35 *** (<0.01)2.33 (0.12)0.96 (0.32)
Log(Patent)20.34 *** (<0.01)9.68 *** (<0.01)5.68 ** (0.02)
t-statistics in parentheses *** p < 0.01, ** p < 0.05.
Table 7. Probit regression results of going concern opinions for financially distressed firms.
Dep. Var. Concern
Variables(1)(2)
KCINT0.062 ***0.064 ***
(3.282)(3.366)
Log(Patent)−0.058 **
(−2.365)
Log(Cpatent) −0.036 ***
(−3.514)
INTAN0.824 ***0.821 ***
(9.475)(9.428)
Other ControlsIncludedIncluded
FE: Industry and YearYesYes
Observations14,69214,692
Pseudo R-Squared0.1900.191
t-statistics in parentheses *** p < 0.01, ** p < 0.05.
Table 8. OLS regression results of R&D knowledge capital, patents, patent portfolio age, innovation efficiency, and auditor fees.
Variables(1)(2)
KCINT0.059 ***0.069 ***
(4.653)(5.368)
Log(Patent)0.057 ***
(4.897)
Log(CPatent) 0.034 ***
(3.914)
PEFF−0.389 ***
(−3.807)
CEFF −0.021 ***
(−3.580)
PAge0.014 ***0.015 ***
(3.545)(3.659)
Other ControlsIncludedIncluded
FE: Industry and YearYesYes
Observations15,50415,504
Adjusted R-squared0.8110.811
t-statistics in parentheses. *** p < 0.01.
Disclaimer/Publisher’s Note: The statements, opinions and data contained in all publications are solely those of the individual author(s) and contributor(s) and not of MDPI and/or the editor(s). MDPI and/or the editor(s) disclaim responsibility for any injury to people or property resulting from any ideas, methods, instructions or products referred to in the content.

