Article

Investigating ESG Funds in China: Management Fees and Investment Performance

Department of Economics and Finance, City University of Hong Kong, Hong Kong
*
Author to whom correspondence should be addressed.
Int. J. Financial Stud. 2024, 12(2), 38; https://doi.org/10.3390/ijfs12020038
Submission received: 26 January 2024 / Revised: 2 April 2024 / Accepted: 12 April 2024 / Published: 25 April 2024
(This article belongs to the Special Issue Sustainable Investing and Financial Services)

Abstract

:
This study investigates the association among management fees, ESG scores, and investment performance of ESG funds in China. It explores the significance of comprehending the cost–benefit analysis and long-term yields associated with sustainable investing. The investigation specifically concentrates on China’s open-end equity funds and uncovers some noteworthy discoveries. Initially, funds with higher management fees tend to yield greater returns, suggesting a potential validation for these fees. Nevertheless, when taking risk-adjusted metrics into account, these funds do not exhibit superior performance, indicating that the elevated fees may not necessarily result in enhanced performance after factoring in risk. Furthermore, the analysis discloses an adverse influence of ESG factors on fund performance. In general, the findings indicate that ESG funds in China do not impose higher management fees and do not ensure better returns but often produce superior risk-adjusted investment performance if their ESG scores are moderately higher. Exceptionally high ESG scores can end up with the worst risk-adjusted investment performance.

1. Introduction

In recent years, ESG investing has undeniably gained remarkable traction, successfully capturing the attention of both institutional and individual investors on a global scale. ESG funds, which incorporate environmental, social, and governance factors into their investment strategies, have emerged as a prominent avenue for aligning financial goals with sustainability objectives. The phenomenon under discussion is important in the country of China, as there has been a considerable surge in sustainable and responsible investment, attracting considerable attention.
The Chinese market has witnessed a remarkable presence of ESG funds, indicating their popularity among investors. As of October 2021, the number of ESG mutual funds in China reached an impressive 344, with assets owned or under management amounting to RMB 549.24 billion (Liu et al. 2023). This significant market presence underscores the relevance and potential impact of ESG funds in China’s investment landscape. Furthermore, the concept of ESG gained even more prominence in China’s securities market after the country set forth its ambitious goal of achieving “double carbon” (W. Zhu 2023). This entails a strong focus on environmental and social responsibility, thereby driving the popularity of ESG investing in China.
Against this backdrop, this paper aims to delve into the realm of ESG funds in China, with specific emphasis on three critical aspects: management fees, ESG scores, and investment performance. While management fees have always been a crucial consideration for investors, the unique characteristics of ESG funds warrant closer examination. These funds often require specialized research, data analysis, and ongoing monitoring to ensure adherence to ESG criteria, potentially leading to higher management fees compared to traditional funds. By exploring the relationship between management fees and ESG funds in China, we can shed light on the cost–benefit analysis for investors and evaluate the potential impact on long-term returns.
Furthermore, assessing the investment performance of ESG funds is paramount in understanding their efficacy as investment vehicles. Questions emerge as to whether investing in ESG funds in China can generate competitive returns while simultaneously promoting sustainable practices. Through the analysis of historical performance data, risk-adjusted returns, and benchmark comparisons, this study aims to provide insights into the investment performance of ESG funds in China. Such analysis can aid investors in making informed decisions about incorporating ESG funds into their portfolios, potentially driving positive change in the financial markets and encouraging sustainable practices among Chinese companies. In brief, this paper considers the following two hypotheses: (a) ESG funds charge higher management fees; and (b) ESG funds outperform other funds.
The significance of this research lies in its ability to inform investors, asset managers, and policymakers about the nuances of ESG funds in China, particularly in relation to their management fees and investment performance. By bridging the gap in our understanding, we can contribute to the ongoing discourse surrounding responsible investing and provide valuable insights for individuals and organizations seeking to align their financial goals with their environmental and social values.
The structure of this paper is as follows: Section 2 provides a literature review on management fees and investment performance of investment funds in general, with a specific focus on ESG funds. Section 3 discusses the data and sample used in this study. Section 4 presents the performance metrics and regression results of the sampled funds. Section 5 summarizes the key findings and concludes the paper.

2. Literature Review

The following sections summarize previous research conducted on fund management fees and performance. These studies have explored the association between these fees and performance in various contexts. Additionally, some of these studies have examined the relationship within ESG funds.
Previous research has explored the association between fund fees and performance but yielded mixed conclusions. Some studies suggest a negative relationship between management fees and performance. For example, Ben-David et al. (2023) found a strong negative correlation between long-run performance and incentive fees in hedge funds. Both Wermers (2000) and Gruber (1996) concluded that there is a significant negative correlation between fees and risk-adjusted returns in mutual funds. Cooper et al. (2021) studied equity funds and observed a statistically significant negative association between net-of-fee performance and fees. Phalippou (2020) argued that private equity managers should not be paid their profit sharing due to the underperformance of private equity funds compared to typical equity funds.
On the other hand, some studies suggest a positive association between management fees and performance. Brown (2012) demonstrated that hedge fund managers delivered high excess returns justifying their high-performance fees. Ippolito (1992) found that the risk-adjusted return of high-fee open-end funds exceeds the investment cost caused by the fees.
In addition, some studies suggest there is no significant relationship between fees and performance. Cao et al. (2008) found an insignificant relationship between fees and performance in funds. Berk and Green (2004) argued that fund fees should be irrelevant if investors allocate capital among funds in a way that overall investment has zero expected performance over a passive benchmark. Berk and van Binsbergen (2015) found that while the average gross value contributed by fund managers is positive, the funds’ alphas after fees are zero, supporting the view that fund costs should not matter to investors. Pastor et al. (2020) argued that increased transaction costs associated with reduced liquidity and more turnover offset the predicted gross profits, resulting in no excess return due to higher fund costs.
Stambaugh (2020) and M. Zhu (2018) suggested fund-manager skill plays a role in the relationship between fees and performance. They argued that greater skill allows managers to identify profit opportunities more accurately, but active management corrects prices more, diminishing the profits offered by those opportunities.
Factors such as the types of funds, the size of funds, and other characteristics further exert an influence on the fees for management. Latzko (1999) found that larger funds tend to have lower cost ratios and management fees. Dellva and Olson (2005) explored a range of factors affecting fees, including operational expenses, fund types, performance, duration time, subscription fees, 12b-1 fees, and redemption fees. Tufano and Sevick (1997) found that funds with smaller boards of directors tend to have lower fees.
Integrating environmental, social, and governance (ESG) factors into investment decisions has gained importance among global institutional investors. There are many studies on how ESG affects the performance of listed companies (Carnini Pulino et al. 2022; Aldieri et al. 2023; Friede et al. 2015). However, research on the relationship between ESG incorporation and portfolio performance is limited and has produced mixed results. Some studies suggest that ESG incorporation improves fund performance by capturing material information about firm fundamentals. Others argue that responsible investing constraints may lead to excluding stocks with higher return potential.
Steen et al. (2020) examined the connection between Morningstar’s ESG ratings and the performance of mutual funds in Norway. They found no discernible impact of ESG ratings on fund performance and no abnormal risk-adjusted returns. However, they observed a geographical bias, with European funds in the top ESG quintiles exhibiting significantly higher returns and positive alphas. Lee et al. (2022) found that the return on sustainable funds is more significant than on non-sustainable ones. Similarly, Dreyer et al. (2023) provided evidence that investors could have increased their portfolio ESG performance while also increasing their risk-adjusted returns in the US stock market from 2002 to 2015. Furthermore, Lee et al. (2020) found compelling evidence that integrating ESG analyses into ongoing investment practices in Australia does not harm risk-adjusted returns.
On the other hand, Rahman and Lau (2023) suggested that an ESG-inclined method does not produce greater risk-adjusted returns, as ESG has returns comparable to any equity factor after adjusting for market cap and volatility bias. Rompotis (2022) also found that after factor-adjusting returns and risks, ESG and non-ESG stocks with positive alphas present comparable return-to-risk statistics. Ferriani and Natoli (2020) highlighted that during the COVID-19 crisis, low-ESG risk funds performed significantly better than high-risk ones, contrary to past evidence gathered with the old ESG scores. This suggests that the performance of ESG funds can be influenced by external factors such as global crises. Additionally, Vannoni et al. (2020) conducted a comparison between the collective performance of several SRI funds and the MSCI World Index. Their findings revealed that, on average, the SRI funds outdid the index. Nevertheless, they underscored the significance of incorporating financial and ESG analysis into the investment process, cautioning that relying solely on sustainability scores does not guarantee a positive financial return.
Overall, the correlation between ESG funds and their financial performance is intricate and diverse. Certain studies suggest that ESG funds can generate superior and risk-adjusted returns, while others indicate similar performance to non-ESG funds. The performance of ESG funds can also be impacted by external elements like market conditions and global crises.
There is limited research on the relationship between management fees and performance, specifically in ESG funds. Dutta and Paul (2023) found that ESG funds do not charge higher fees or sacrifice returns compared to traditional funds. Kreander et al. (2005) indicated that management fees are a significant explanatory variable for ESG fund performance. However, Abate et al. (2021) did not find a positive correlation between management fees and the number of screening criteria applied in ESG funds.
Overall, the relationship between fees and performance, as well as the impact of ESG factors on fund performance, remains complex and requires further investigation to fully understand its implications. The expertise of fund managers and factors such as fund size and type also influence this relationship.

3. Data and Sample

This paper aims to analyze the performance of open-end funds in China by collecting raw data from Wind Information, a reliable source of financial information. The dataset includes information on 16,530 open-end funds that were launched between 21 September 2001 and 30 June 2022.
To ensure accurate performance estimation, this paper focuses on funds with a minimum track record of 5 years, specifically between 30 June 2017 and 30 June 2022. From this 5-year period, this paper extracts data for a more recent 3-year period, specifically from 30 June 2019 to 30 June 2022. The purpose of comparing the 3-year and 5-year performance is to gain insights into the fund’s performance over different time horizons.
To maintain consistency and comparability, this paper excludes a small number of USD-denominated funds and money market funds from the analysis. Furthermore, this study focuses solely on actively managed equity funds, excluding other types of funds such as bond funds, balanced funds, fund of funds, and passive equity funds. This approach ensures that the analysis compares similar types of funds.
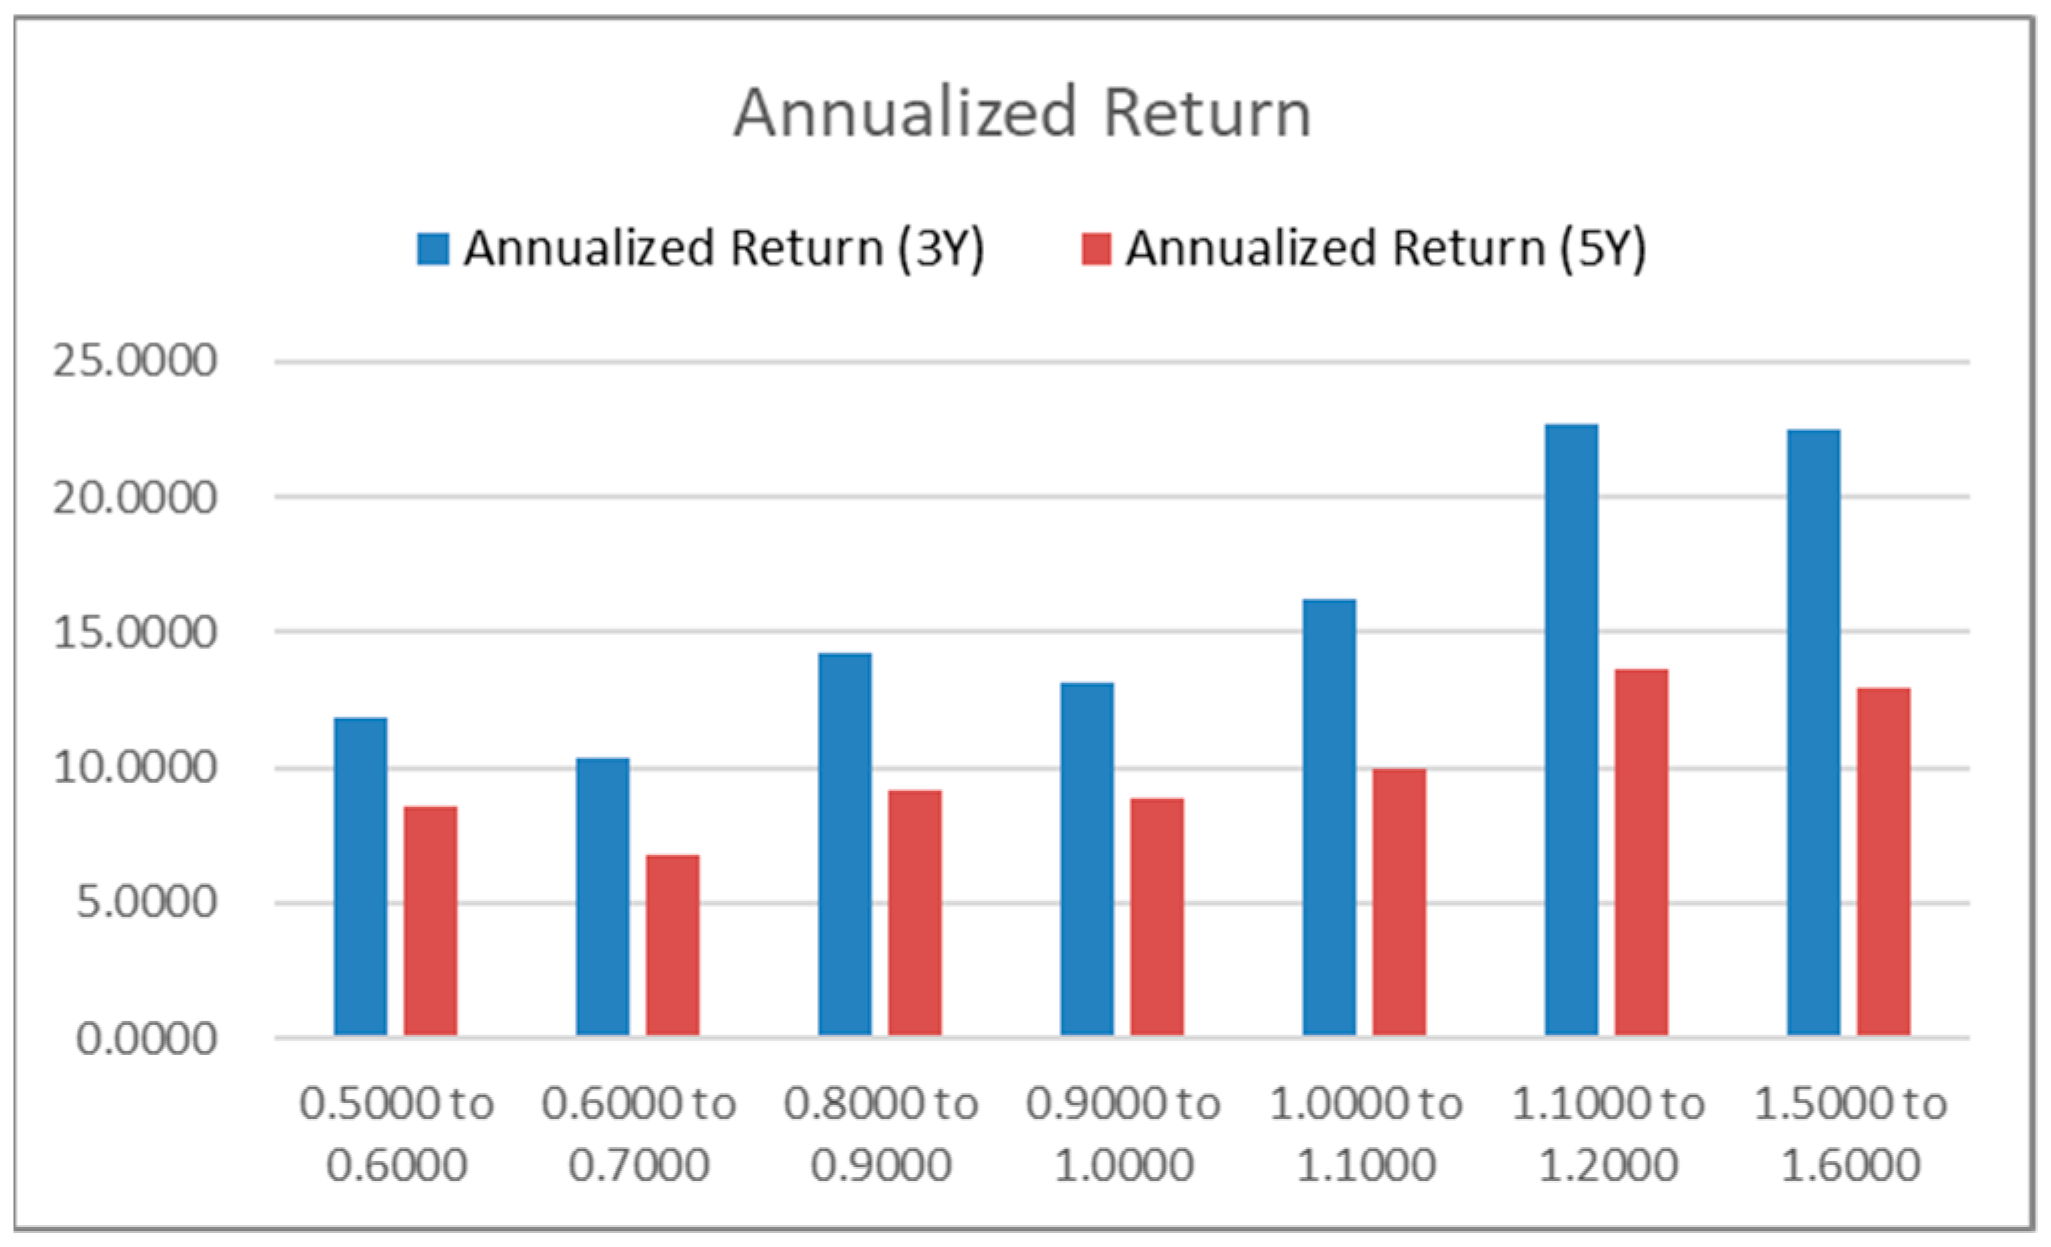
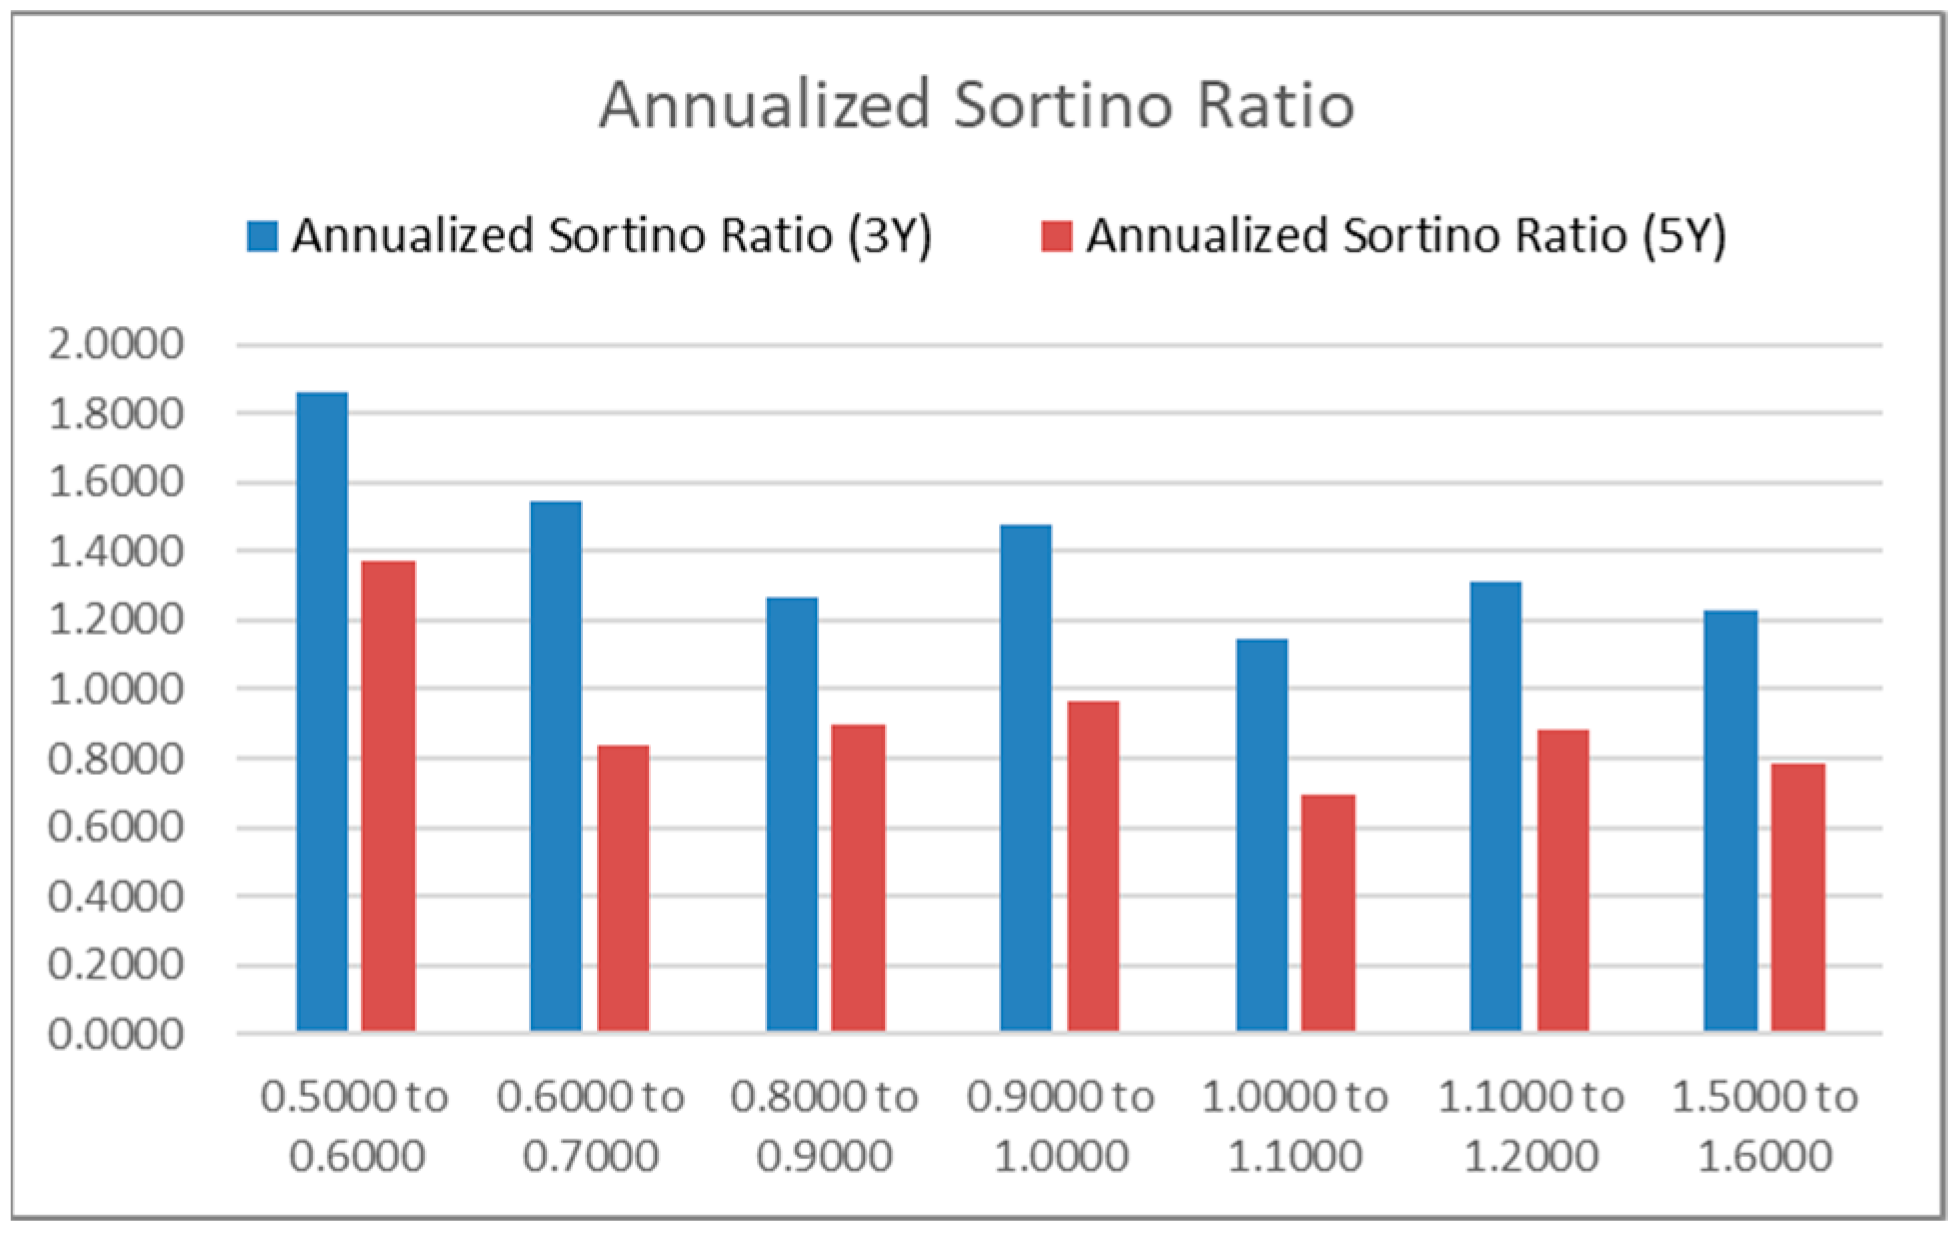
After applying these selection criteria, 1742 funds denominated in RMB are shortlisted for performance analysis. These funds are then divided into 30 groups based on their management fee levels. Each group represents a range of 0.1% management fee. Table 1 presents the number of funds in each of the 30 management fee groups. Notably, the group charging a fee between 1.1% and 1.2% consists of 623 funds, accounting for 35.76% of the total funds. Similarly, there are 362 funds charging a fee between 1.5% and 1.6%, representing 20.78% of the total funds. It is worth mentioning that the management fees of open-end funds in China tend to be higher compared to those in the European and North American markets.
To ensure statistically robust comparisons, this paper further selects 7 management fee groups that each contain at least 30 funds. These groups are labeled as the “7 Groups” and are considered less susceptible to biases arising from small sample sizes. The sample size of the “7 Groups” is not significantly different from that of the “30 Groups”. The fund count for each management fee group is presented in Table 1.
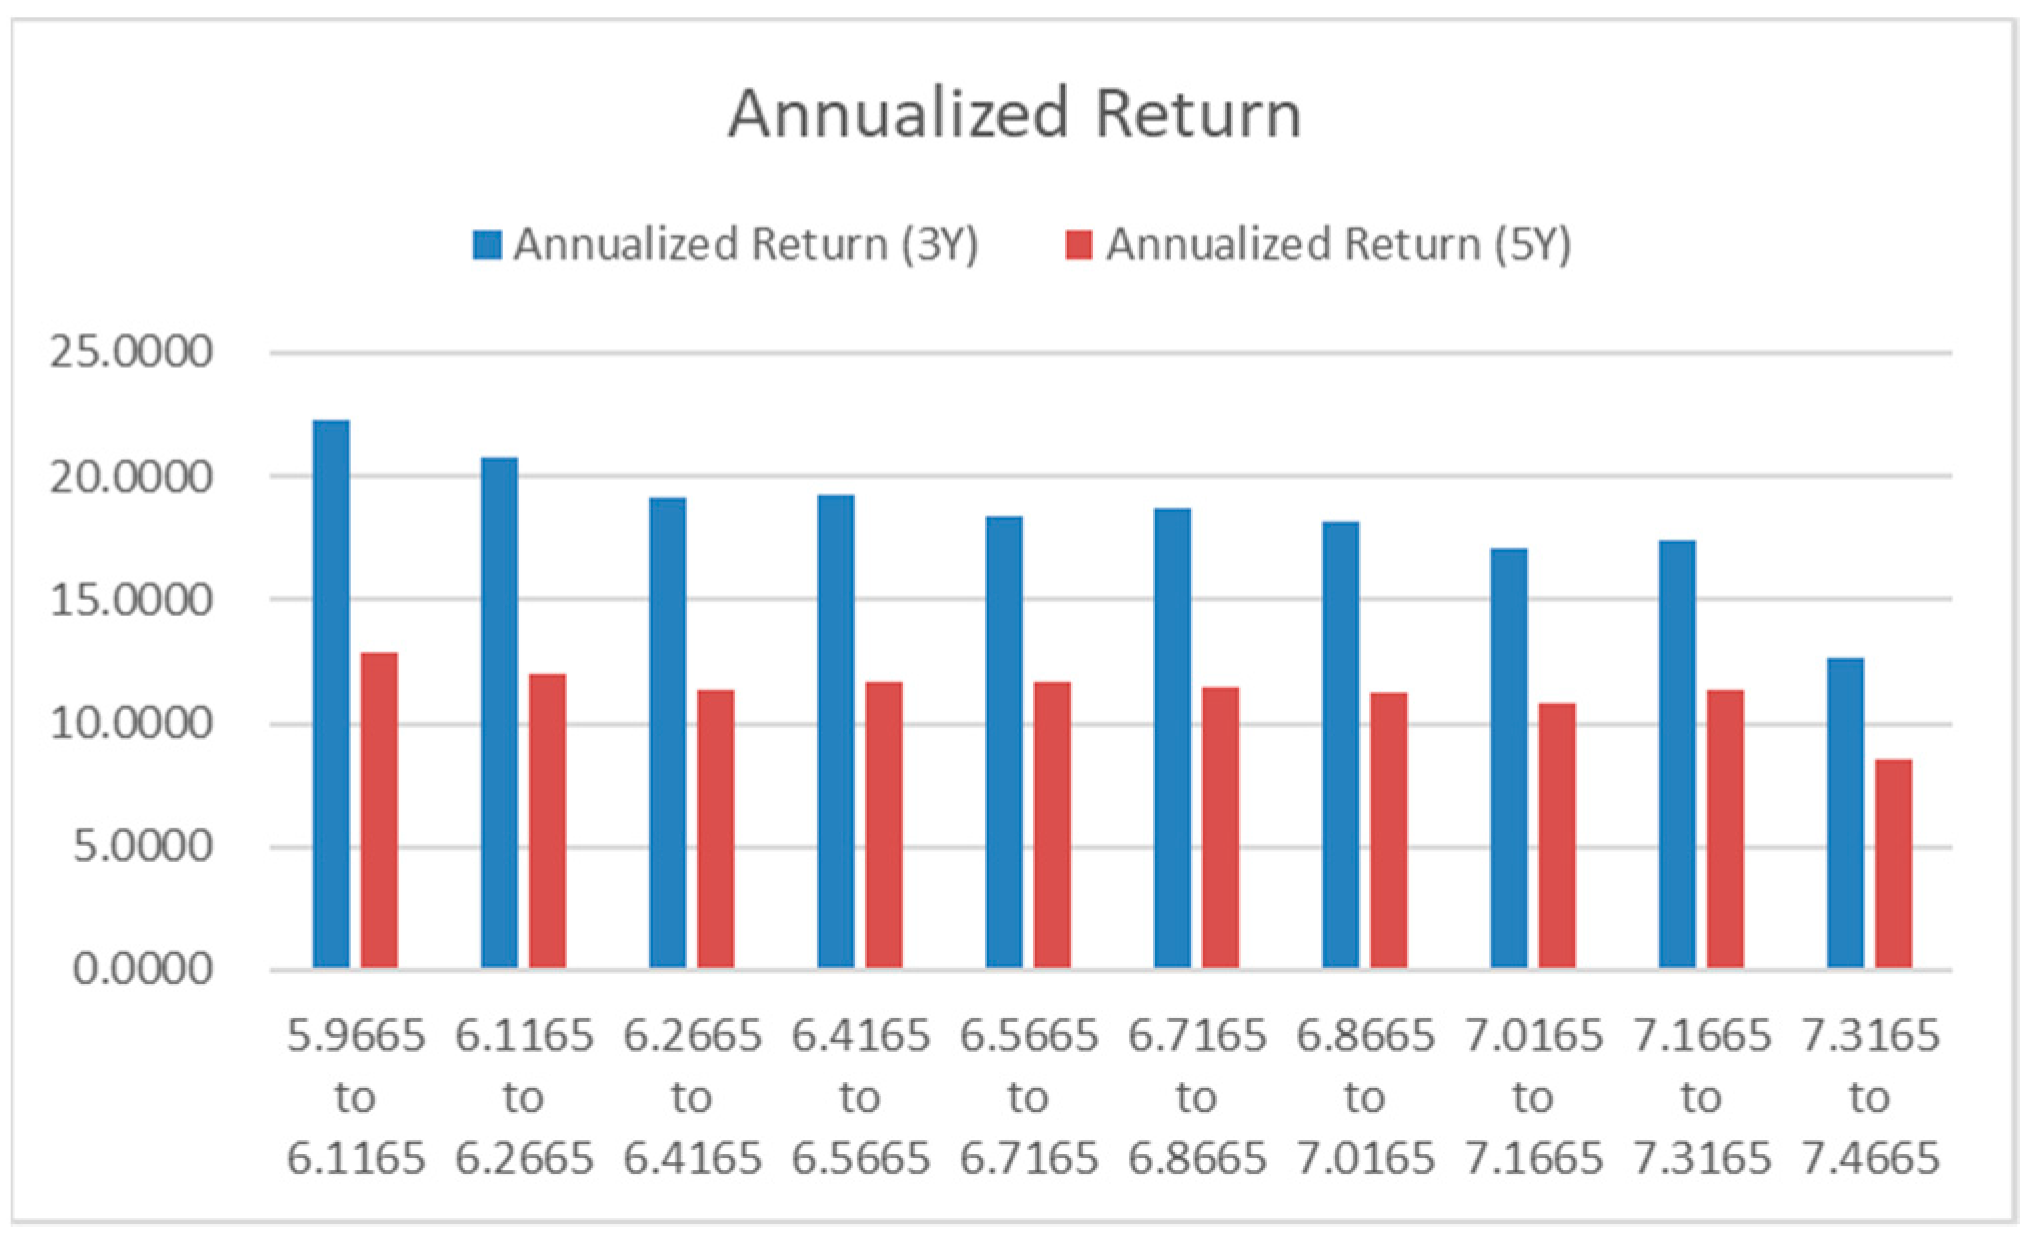
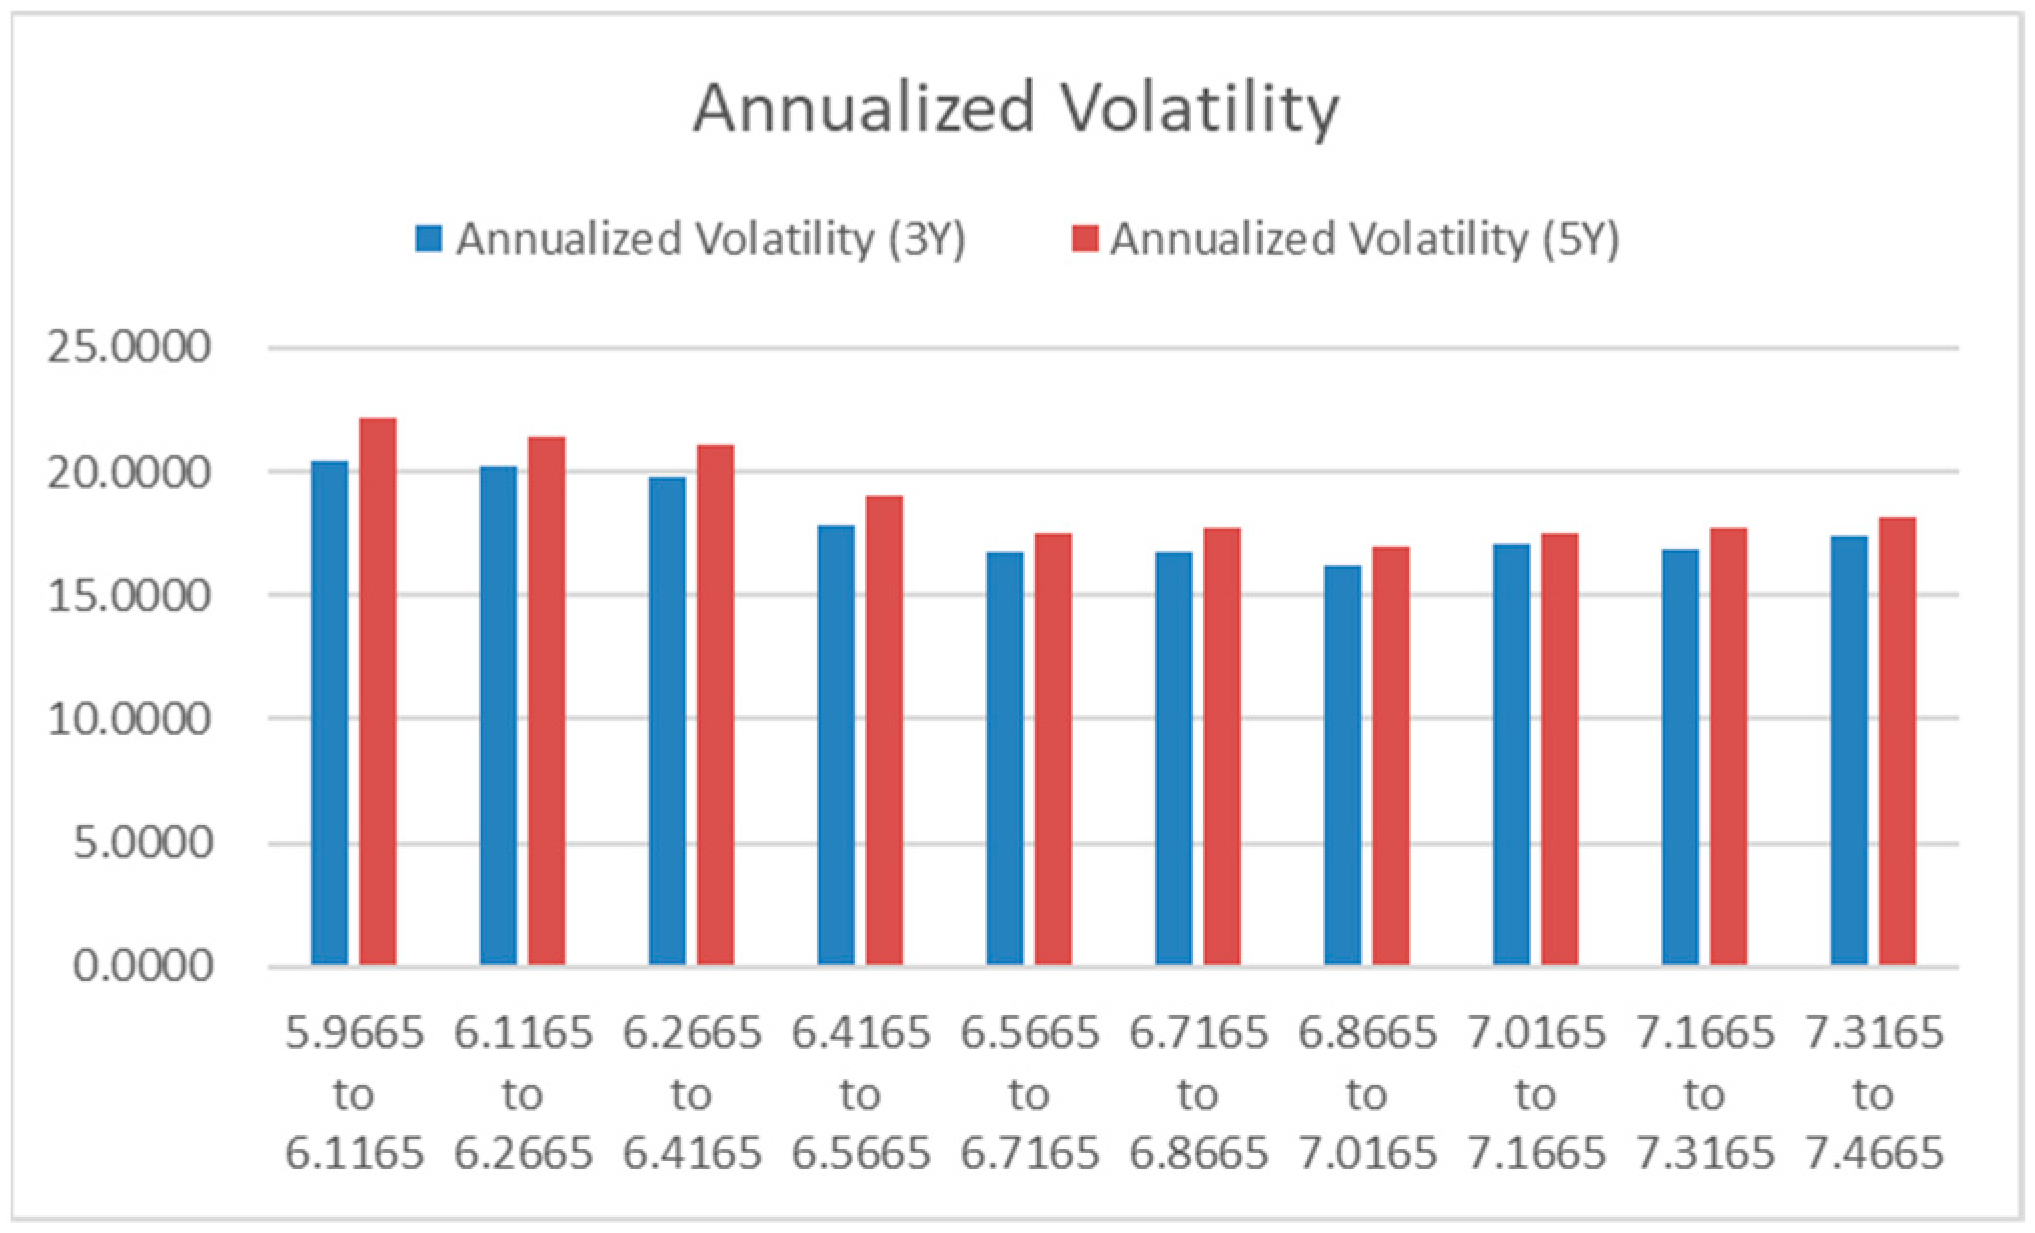
Similarly, this paper categorizes the 1742 funds into 22 groups based on their Wind ESG Comprehensive Score, as shown in 
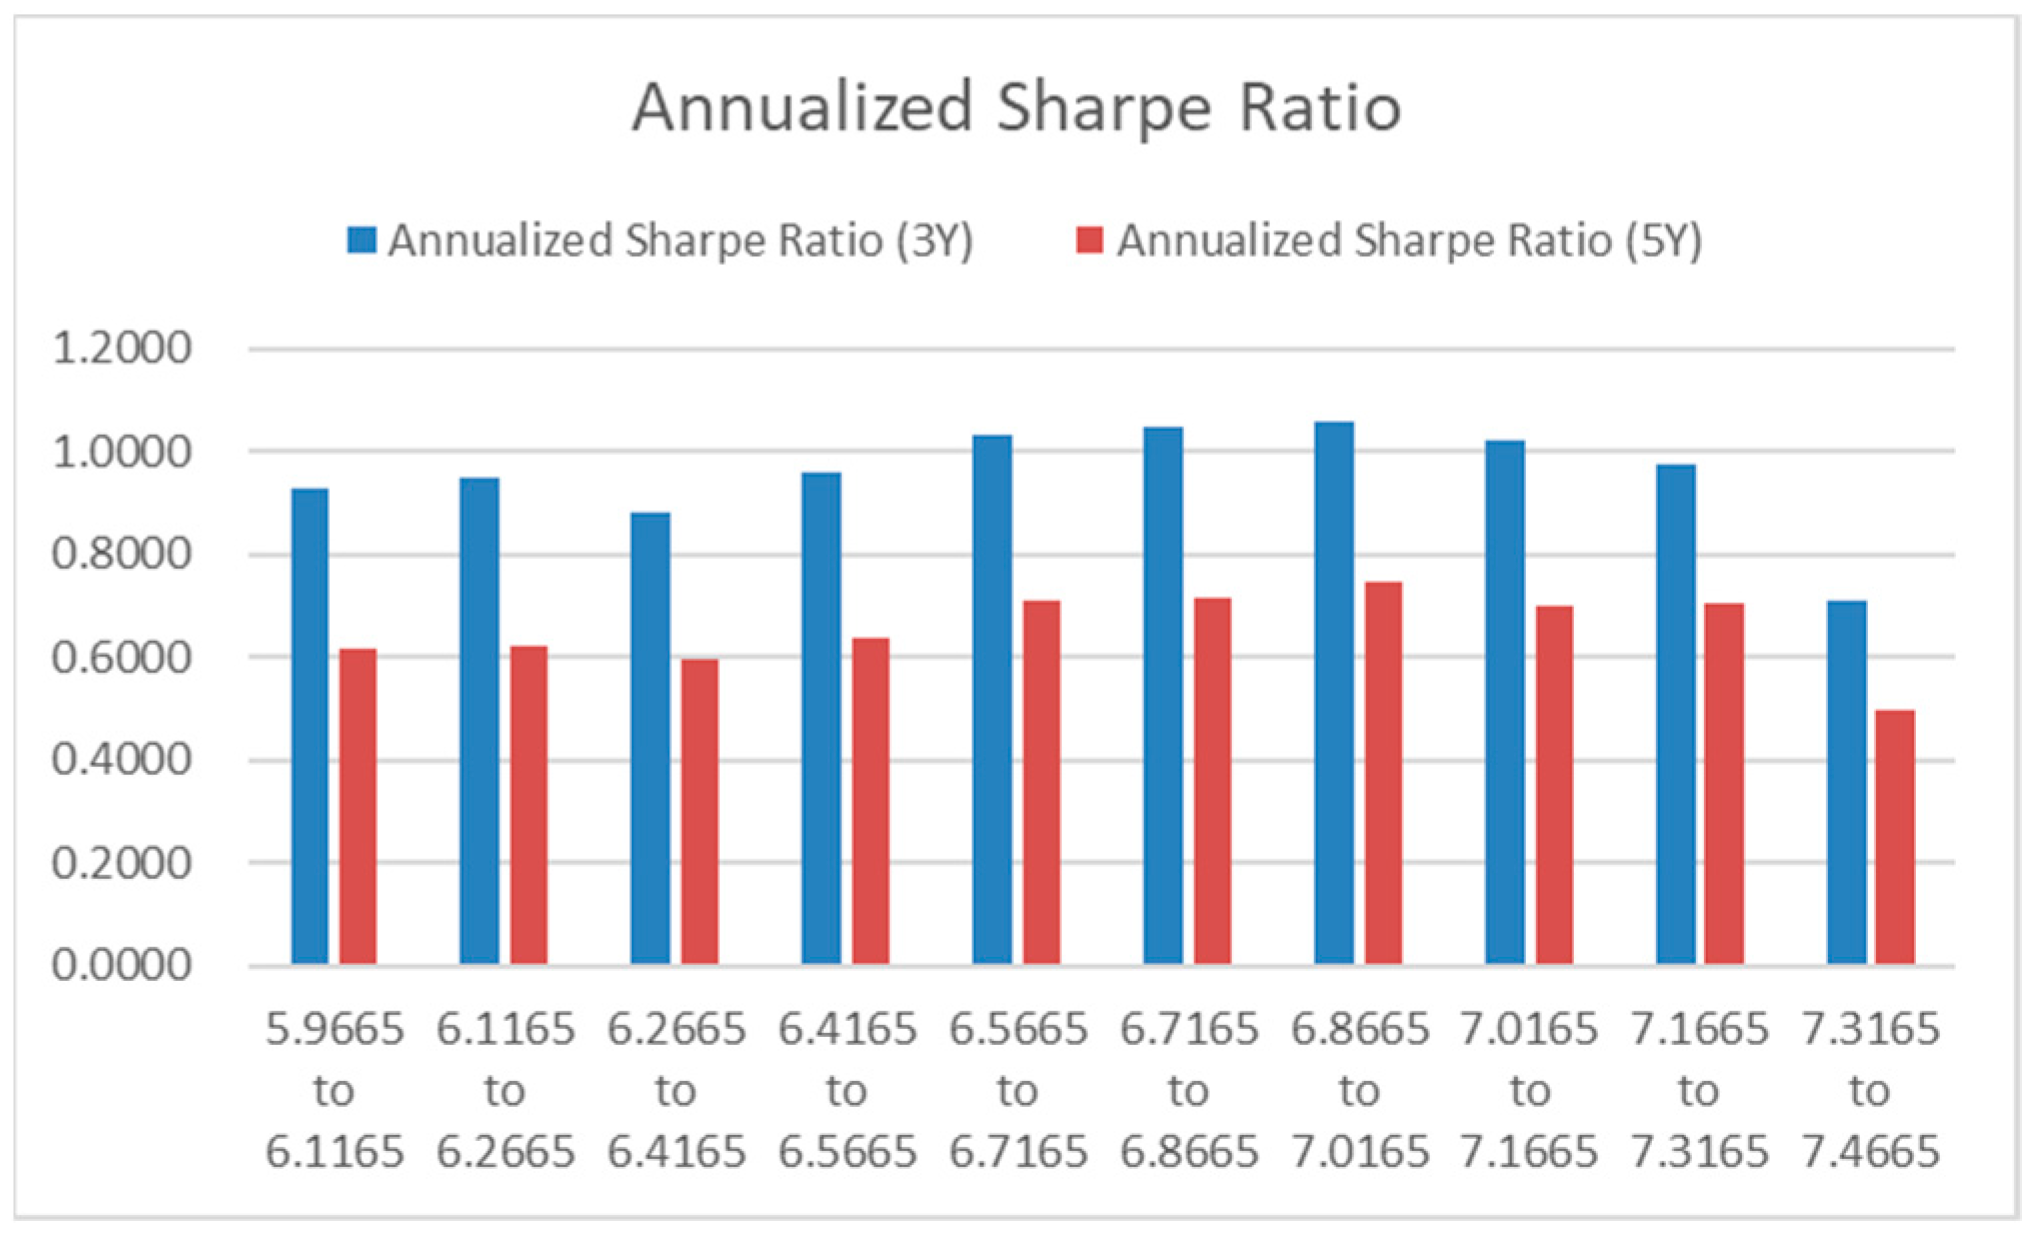
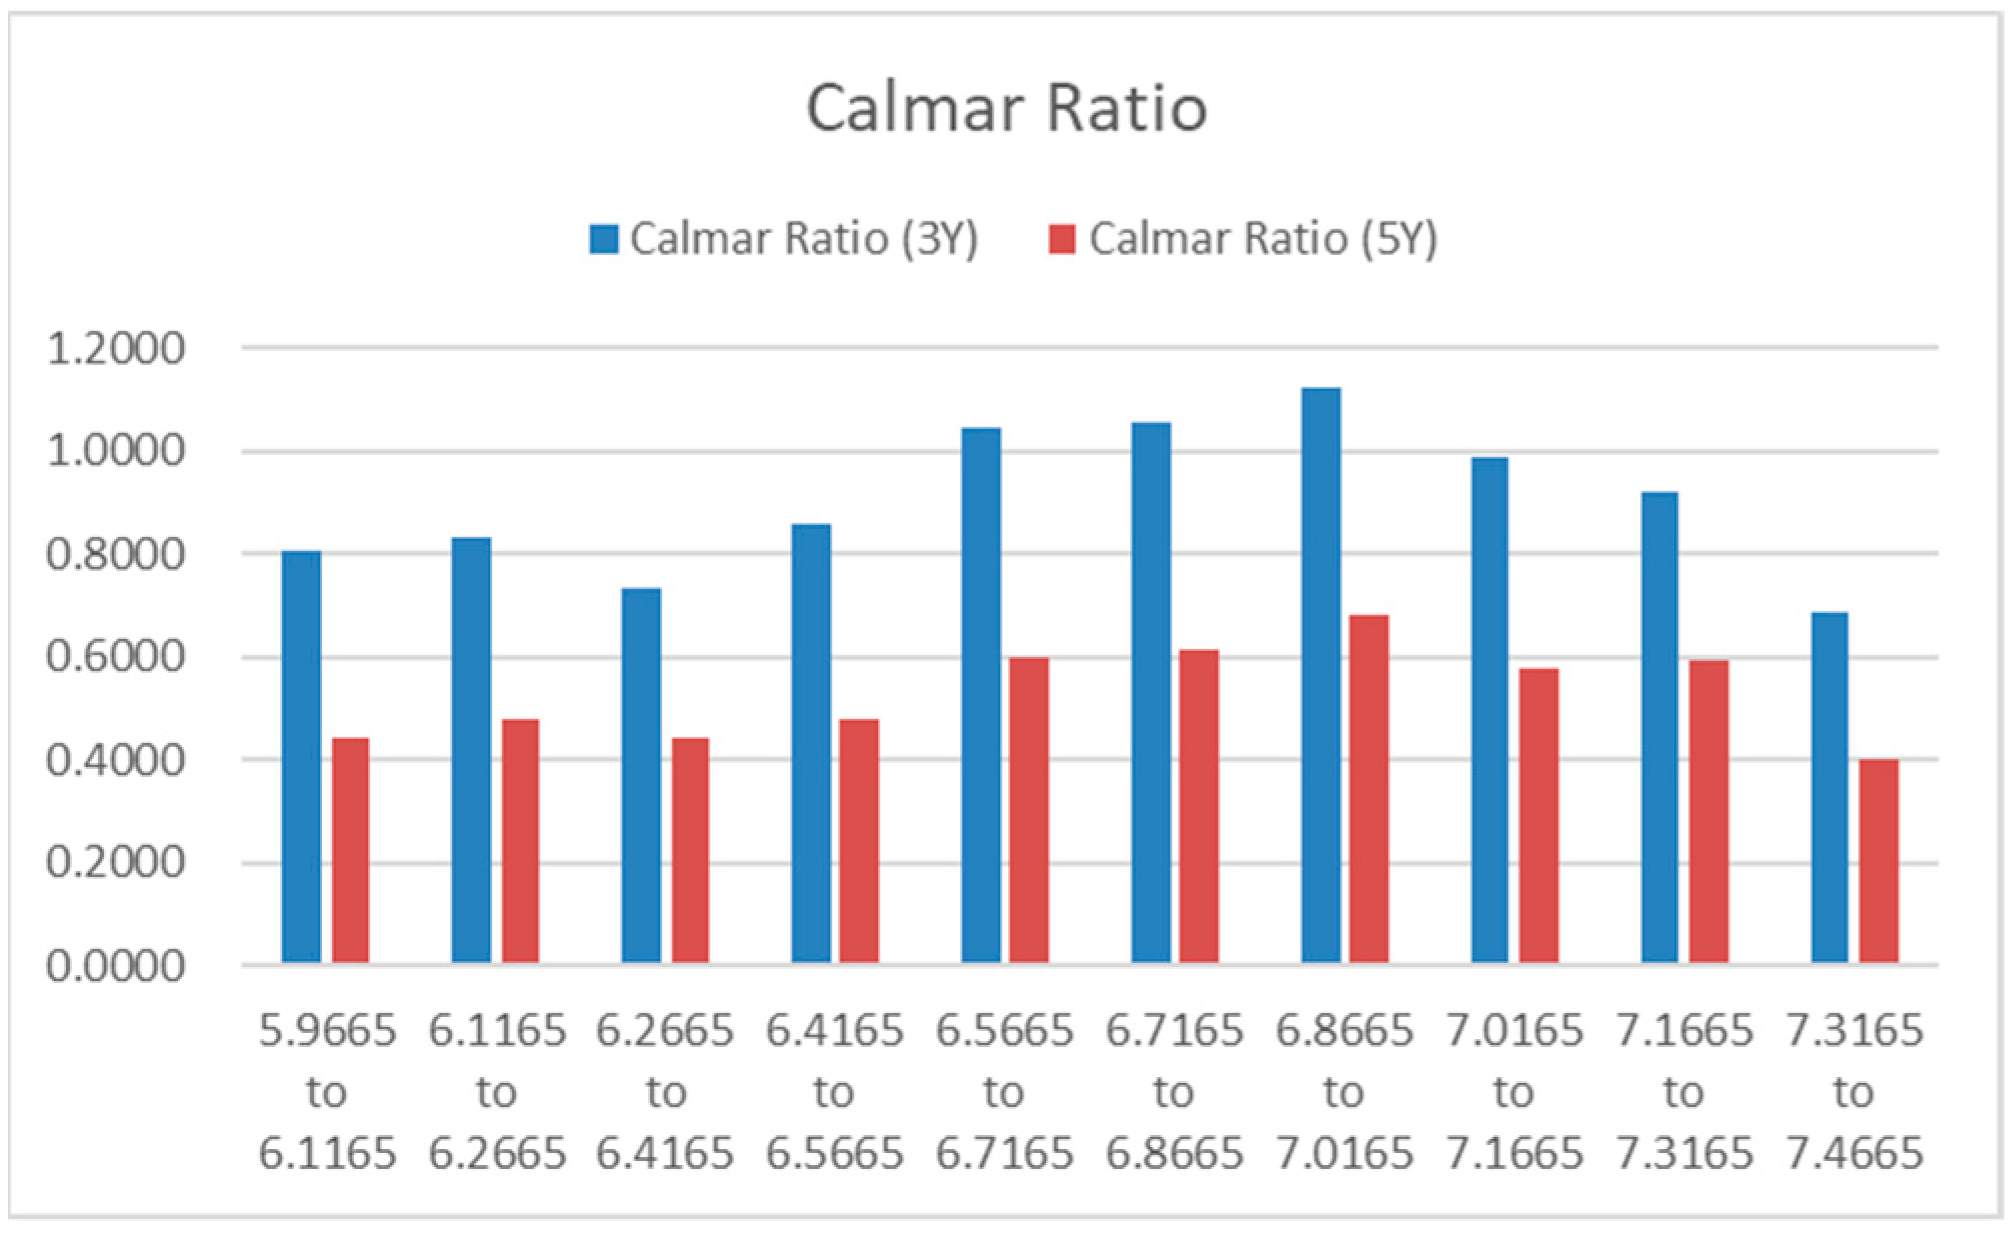
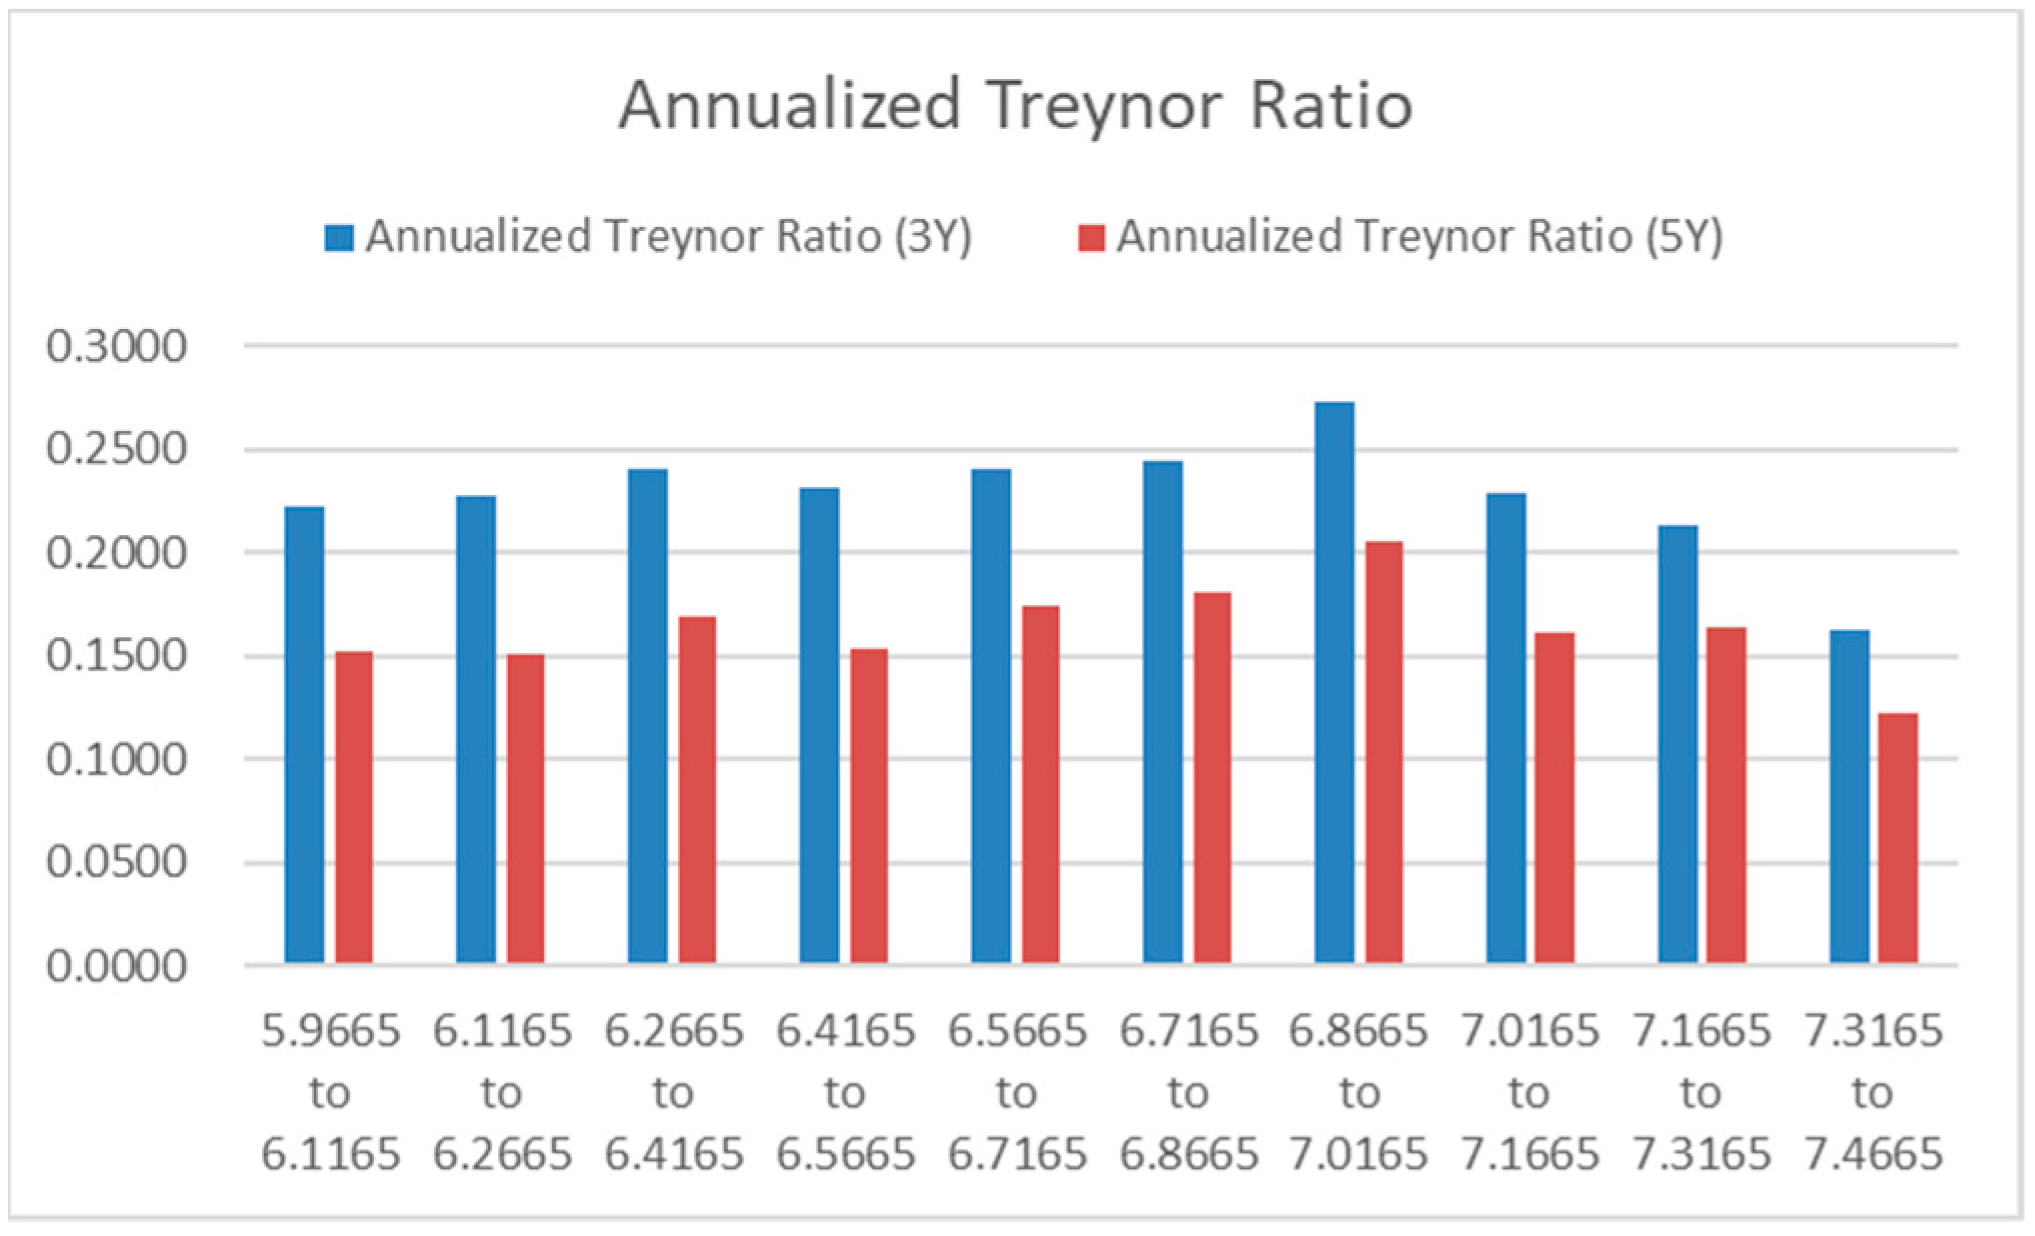
Table 2. This score evaluates companies across three pillars: Environmental, Social, and Governance. It encompasses 25 topics and over 300 underlying indicators, drawing from a vast range of reliable sources. The score, which ranges from 0 to 10, reflects the fund’s sustainable investment ability, the level of ESG management practice in its underlying investments, and the risk of short-term ESG controversies. The ESG score groups have an interval of 0.15. Notably, nearly half of the funds fall within the interval of 6.5665 to 7.0165. The minimum ESG score observed is 5.36, while the maximum is 8.02.

4. Performance Metrics and Empirical Findings

4.1. Distribution Analysis on Performance Metrics

The following figures, Figure 1, Figure 2, Figure 3, Figure 4, Figure 5, Figure 6 and Figure 7, show graphical distribution of different performance metrics of the 7 selected Management fee groups. Each management fee group has at least 30 funds. These metrics include annualized return, volatility (i.e., annualized SD), Sharpe Ratio, Sortino Ratio, Max Drawdown (DD), Calmer Ratio, and Treynor Ratio. Equations of these commonly used performance metrics are shown in the Appendix A. Both the 3-year (3Y) sample period and 5-year (5Y) sample period are considered in the distributional analysis. The annualized return of the benchmark index CSI 300 index in the same 3-year period is 4.45% and in the same 5-year period is 4.11%.
The figures presented above reveal several notable observations regarding funds with higher management fees. Firstly, groups of funds with higher management fees tend to yield higher annualized returns, but they also exhibit higher volatility and maximum drawdown. This is evident from Figure 1, Figure 2 and Figure 5. However, it is important to note that these higher fee groups do not demonstrate any superior performance in terms of Sharpe Ratio, Calmer Ratio, and Treynor Ratio, as shown in Figure 3, Figure 4, Figure 6 and Figure 7.
One noteworthy finding is that the group with management fees ranging from 1.1% to 1.2% stands out with exceptionally high returns, surpassing 22% per year over a 3-year period. This group, consisting of a substantial sample size of 623 funds, demonstrates remarkable performance. Furthermore, these distribution results remain consistent for both the 3-year and 5-year data periods, suggesting robustness in the findings.
These observations shed light on the relationship between management fees and fund performance, emphasizing the need for investors to carefully consider the trade-off between higher fees, potentially higher returns, and the associated risks.
The following figures, Figure 8, Figure 9, Figure 10, Figure 11, Figure 12, Figure 13, Figure 14 and Figure 15, show graphical distribution of different performance metrics of the 10 selected ESG Comprehensive Score groups. Each ESG score group has at least 30 funds. These commonly used performance metrics as in Appendix A are applied again. Both the 3-year (3Y) sample period and 5-year (5Y) sample period are considered in the distributional analysis.
The figures presented above provide several key observations regarding the relationship between fund performance and ESG scores. Firstly, groups with higher ESG scores do not generate higher, and in some cases even exhibit lower, annualized returns (Figure 8). Secondly, groups with ESG scores in the middle section, which refers to the groups with ESG scores between 6.4165 and 7.0165, demonstrate lower volatility and lower maximum drawdown compared to other groups, indicating potentially lower risk levels (Figure 9 and Figure 12). Thirdly, overall, groups with ESG scores in the middle section display higher risk-adjusted returns, as indicated by metrics such as Sharpe Ratio, Sortino Ratio, Calmer Ratio, and Treynor Ratio (Figure 10, Figure 11, Figure 13 and Figure 14). The ESG score group “6.8665–7.0165” stands out as the best in terms of risk-adjusted returns, boasting the lowest volatility and maximum drawdown, despite its return being ranked in the middle. This group represents approximately 14% of the funds analyzed. Importantly, these distribution results remain consistent for both the 3-year and 5-year data periods, adding robustness to the findings.
The non-linear correlation between ESG scores and the performance of China equity funds presents an intriguing contrast to the relationships observed in developed markets such as Europe. While Europe has been leading in ESG development, with well-established integration and regulations, China is still in the preliminary stages of adopting ESG practices (Chinese Association for Public Companies 2022). This non-linear relationship suggests that the current level of ESG integration in China may be inadequate for fund managers to capture significant fundamental information about stocks, potentially excluding stocks with high return potential. Therefore, to achieve optimal risk-adjusted returns, fund managers may need to identify the optimal point at which to incorporate ESG factors into their investments, which is indicated as the mid-section in the charts.
Figure 15 provides insights into the relationship between management fee and ESG score groups, revealing that the group with the lowest ESG score tends to charge the highest management fee. Similarly, Figure 8 illustrates that the group with the lowest ESG score generates the highest annualized return. These findings align with the observations in Figure 1, Figure 2, Figure 3, Figure 4, Figure 5, Figure 6 and Figure 7, where the group with the highest management fee generates the highest return, highest annualized volatility, and highest max drawdown. Conversely, the groups in the middle charge lower management fees and produce higher risk-adjusted returns, consistent with the findings in Figure 1, Figure 2, Figure 3, Figure 4, Figure 5, Figure 6 and Figure 7.
These results emphasize that incorporating a higher ESG standard does not necessarily result in higher management fees for funds. Instead, investors in China demonstrate a willingness to pay higher fees for funds that can generate higher returns.

4.1.1. Regression Analysis between Management Fee on Return

To verify further whether management fee and ESG incorporation affect returns, this study runs the following regression model with many variables are control variables:
A n n u a l i z e d   R e t u r n i         = C o n s t a n t + β 1 M g m t i + β 2 C u s t i + β 3 S u b s i + β 4 R e d m i + β 5 T r x i + β 6 S i z e i          + β 7 A g e i + β 8 E S G i + ε
  • M g m t i = Management fee (NB: China open-end funds normally charges a fixed rate)
  • C u s t i = Custodian fee (NB: It is a fee for accounting, clearing, settlement, custody services, etc. Many funds charge 0.2% per year)
  • S u b s i = Subscription fee (NB: This is the fee fund houses charge their customers when they buy the funds)
  • R e d m i = Redemption fee (NB: This is the fee fund houses charge customers whey they sell their funds)
  • T r x i = Transaction fee (NB: This includes brokerage commissions, stamp duties, income taxes, interests, and so on.)
  • S i z e i = Log the average Net Asset Value
  • A g e i = fund age (years since inception)
  • E S G i = Wind ESG Comprehensive Score
The sample for this regression analysis includes all 1742 funds in the 30 management fee groups. Table 3 shows the regression results.
The results show that management fee, transaction fee, and fund size have a significantly positive effect on both the 3-year and the 5-year annualized return. Fund age has a significantly negative effect on the two annualized returns. Obviously, the positive relationship between the return and the management fee is robust even with many other variables being controlled. China fund managers can justify their higher management fees with higher returns delivered. The positive effect of the transaction fee may be related to fund managers’ active and superior portfolio management. Wermers (2000) and Dahlquist et al. (2000) also find positive effects of transaction costs on fund performance. The positive effect of fund size on the returns may be due to lower amortized costs. It is interesting to note that fund age has a negative effect on the returns. This suggests that the funds established in earlier years do not yield better returns. This may be due to increase in the number of capable fund managers or fund houses joining the China fund industry in the last 10 years.
The ESG score shows a negative but insignificant impact on returns. In China, seven main ESG investment strategies exist: ESG integration, negative screening, norms-based screening, positive screening, shareholder engagement, sustainability investment, and impact investment (Shen et al. 2023). Among these, negative screening strategies are primarily utilized by institutional investors, including fund managers, in China (Shen et al. 2023; Asset Management Association of China 2020a, 2020b). Screening strategies help institutional investors, such as fund managers, in reducing investment risk (Alessandrini and Jondeau 2021). However, as risk is minimized, returns are reduced as well, given that returns are earned as a premium for undertaking investment risk, known as the higher risk, higher return principle. This explains the negative effect of the ESG score on fund returns.
The ESG concept and its implementation in China are still at an early stage. In 2021, approximately 26% of listed companies issued ESG-related reports, with 77% being social responsibility reports, 13% ESG reports, and 5% sustainability reports (Chinese Association for Public Companies 2022). Among the 25 sample countries examined by Krueger et al. (2024), this level of ESG disclosure ranks 21st. Additionally, data from China Stock Market & Accounting Research (CSMAR) reveal that only about 5% of listed companies obtained ESG assurance services in 2021. Although the disclosure rate of indicators across various dimensions has improved, issues regarding unbalanced and inadequate disclosures persist (Yang et al. 2023). Many companies currently face challenges such as limited capabilities and excessive costs in implementing ESG practices, which significantly diminishes their intrinsic motivation to fulfill ESG obligations (Cong et al. 2022). Regulators and investors continue to encounter difficulties in obtaining ESG data for informed decision-making (Zhang and Liu 2022). Consequently, the ESG score exhibits an insignificant correlation with fund returns in China. Therefore, it is crucial to promote ESG development, enhance companies’ capacity to engage in ESG practices, and stimulate companies’ intrinsic motivation within China.

4.1.2. Jensen’s Alpha, Securities Selection, and Market Timing

This section further analyzes the performance of the funds by focusing on their alpha, securities selection skill, and market timing ability. Alpha (α) is based on the model of Jensen (1968):
R j , t R f , t = α + β ( R m , t R f , t ) + ε t
Positive α in this model means superior performance. Treynor and Mazuy (1966) decomposes superior performance into securities (stock) selection and market timing with the following model:
R j , t R f , t = S S + β ( R m , t R f , t ) + M T ( R m , t R f , t ) 2 + ε t
Positive MT means a fund able to produce a better return than the market return when it is positive and less loss when the market return is negative. This implies superior market timing ability. Positive SS in this model means superior performance resulting from securities selection skill.
This paper applies the above regression models, respectively, to each of the 1742 funds of the 30 management fee groups. In the two models, Rj,t is the daily returns of a fund. Rm,t is based on the daily return of the Shanghai Composite Index, while Rf,t is based on the 7-day repo rate of the China interbank market.
Table 4 reports the results of average α (annualized), average MT, and average SS (annualized) in each of the 10 selected management fee groups. The average α and average SS, originally daily results, are transformed to be annualized results by multiplying (250).
From both the 3-year and 5-year results in Table 4, average α and average SS for groups of high management fee tend to be positive and higher. The groups with higher management fee do not have a positive average MT. In fact, their average MT is mostly negative. These results suggest that the funds charging higher fees have superior securities selection ability but are weak in market timing. It is possible that these funds select stocks with strong growth prospects, thus yielding better return but higher volatility.
A comparison of 3-year and 5-year performance reveals consistent results, with the 3-year performance exhibiting higher alpha generation and stronger securities selection capabilities, albeit weaker market timing. The Chinese equity market is widely regarded as an alpha generation, rather than a beta market. From January 2017 to May 2023, among major global equity markets, only China generated negative annualized returns (−0.6%). Over the same period, annualized returns were 10.4% for the US, 7.8% for Japan, 4.4% for Europe, and 14.2% for India. As evidenced in Table 4, high-fee China-focused fund managers recognized the challenges of timing a negative beta market. Instead, they focused on security selection, generating significant alpha. This trend has intensified over the past 3 years.
Table 5 provides insights into the relationship between ESG scores and performance indicators over both a 3-year and 5-year period. The data reveal that higher ESG scores are associated with lower average alpha and securities selection skill but better market timing ability. This relationship holds true for both the short-term 3-year performance and the long-term 5-year performance.
The findings suggest that incorporating fewer ESG considerations may offer fund managers more flexibility in generating alpha and selecting securities, although this could come at the cost of lower ESG scores. These fund managers primarily focus on alpha generation through securities selection in the alpha-driven China equity market, which results in limited market timing ability. They tend to charge higher management fees, as shown in Figure 15. While they generate higher returns accompanied by greater volatility and larger maximum drawdowns, their risk-adjusted return is lower compared to fund managers with moderate ESG scores. The latter group strikes a balance between ESG integration and risk-seeking in securities selection, as indicated in Figure 8, Figure 9, Figure 10, Figure 11, Figure 12, Figure 13 and Figure 14. This trend has further intensified over the past 3 years.

4.2. Results of Clustering Data by Quartiles

In Section 4.1, the empirical analysis excludes certain groups with a smaller number of observations. This methodological approach facilitates a focused and detailed examination of the specific groups of management fee and ESG score that may exhibit special investment performance outcomes, showing clearly modal and/or nonlinear distribution of the data. It is worth noting that in the fund industry, management fees are determined in accordance with established industry norms, with only a minority of funds deviating from prevailing practices. Furthermore, there is an emerging trend among funds to incorporate ESG considerations into their investment strategies. Nonetheless, most funds continue to prioritize traditional investment practices. Therefore, funds with exceptionally high ESG scores may be underrepresented in the dataset, as their prevalence remains limited.
To enhance the robustness of the findings presented in the above sections, this section employs an alternative approach for clustering the data, deviating from the quartile-based approach. This aims to incorporate the excluded observations into the sample for empirical analysis. This approach first arranges all ESG score groups in ascending order, enabling the identification of the lower quartile, median, and upper quartile. This information is subsequently utilized to classify the ESG score groups into four ESG Quartile Clusters, namely ESG1 (representing the lowest ESG score groups), ESG2, ESG3, and ESG4 (representing the highest ESG score groups).
This method of clustering data based on ESG score groups offers an advantage over grouping with quartiles of all ESG score observations, because there should be a small number of observations in higher ESG score groups. While there is a growing number of ESG-focused funds in China, they are not yet the majority. Most substantial funds associated with traditional businesses, like fossil fuels, score lower in ESG measures. Therefore, it is reasonable to expect that most funds would mostly fall below the upper quartile of the range of ESG score groups. Re-clustering based on ESG score group quartiles ensures a better reflection of observed distribution patterns within the ESG score group range. Table 6 shows the definitions of the ESG Quartile Clusters.
Table 7 presents the fund management performance and management fee of the four ESG Quartile Clusters. ANOVA tests are applied to determine if the means of the clusters are equal. If this hypothesis is rejected at a 1% significance level, the table highlights the cluster with the lowest value in dark grey and the cluster with the highest value in light grey. The focus of this analysis is both ESG3 and ESG4, the two clusters with higher ESG score bands. The table reveals that ESG4 exhibits the lowest “Annualized Return”, the worst “Max Drawdown”, and the lowest performance in 5 out of the 8 risk-adjusted return metrics. ESG3 exhibits the best “Max Drawdown”, the lowest “Annualized Volatility”, the best in 5 out of the 8 risk-adjusted return metrics. The last row of the table shows that management fee across the four ESG Quartile Clusters is not significantly different. These findings align with the findings of Section 4.1. Exceptionally high ESG scores do not help better investment outcome. However, funds with ESG scores slightly higher than the median do show superior investment outcome. These funds do not have a higher management fee.
This section reanalyzes the regression analysis from Table 2 by dividing the entire sample into four subsamples based on the ESG Quartile Clusters: ESG1, ESG2, ESG3, and ESG4. Each subsample produces regression results on how management fee and other factors impact the annualized return. If ESG has no influence on these effects, the regression results of the four subsamples should be similar. Table 8 and Table 9 present the regression results with “3y Annualized Return” and “5y Annualized Return” as the respective Y-variables. According to the results in these two tables, the impact of management fees on investment returns is significantly positive in most of the four ESQ Quartile Clusters. This suggests that higher management fees are associated with higher investment returns across these clusters. Among the four clusters, the ESG3 Cluster exhibits the highest magnitude of the impact of management fees on annualized returns. This means that within the ESG3 Cluster, the effect of management fees on investment returns is particularly pronounced. However, the ESG4 Cluster shows the lowest magnitude of the impact of management fees on “3y Annualized Return” and indicates an insignificant impact on the “5y Annualized Return.” This implies that within the ESG4 Cluster, the influence of management fees on investment returns is weaker and may not significantly impact long-term returns. It is worthwhile to note that ESG4 has a small sample size of 83 as sustainable investing remains to be a new trend in China.
Overall, the regression results show no convincing evidence that a high ESG score results in a different relationship between the management fee and investment returns. Both management fee and fund size are important and positive factors affecting investment returns in all the ESQ Quartile Clusters. These findings are consistent with the findings of Section 4.1.

5. Summary and Conclusions

The investigation into the open-end equity funds of China, as presented within this document, highlights numerous pivotal discoveries. Primarily, it is observed that funds which impose higher management fees exhibit elevated returns, thereby implying that these fees may be substantiated by the superior returns bestowed by said funds. Nevertheless, these funds do not manifest superior performance in metrics adjusted to consider risk, indicating that the augmented fees do not result in enhanced performance once the risk level is considered. The analysis reveals that incorporating ESG factors adversely affects fund performance. The findings demonstrate that ESG funds do not impose higher management fees, do not assure superior returns, and yet frequently produce superior risk-adjusted investment performance if their ESG scores are moderately higher. Exceptionally high ESG scores can end up with the worst risk-adjusted investment performance.
These findings contribute to the comprehension of the correlation between management fees, fund performance, and the integration of environmental, social, and governance (ESG) considerations within the framework of China’s open-end equity funds. The outcomes imply that investors should meticulously assess the compromise between management fees and performance while selecting funds. This study emphasizes the significance of conducting additional research to explore the factors that influence fund performance and the role of ESG factors in the Chinese market.
In general, this research offers valuable perceptions for investors, fund managers, and policymakers in China’s fund management industry. The discoveries contribute to the ongoing discourse on the ideal fee structure and the integration of ESG factors in investment decisions, facilitating well-informed decision-making and potentially leading to enhanced performance and sustainable investment practices in the future.

5.1. Limitations of This Research

This study on management fees, ESG scores, and the investment performance of China funds has certain limitations that should be considered. Firstly, the reliance on data from a specific source, Wind Information, introduces the possibility of data inaccuracies and incompleteness, which may affect the generalizability of the findings. Secondly, this study’s period is limited, focusing on a specific period, and may not fully capture long-term trends and performance patterns.

5.2. Implications and Recommendation

The discoveries of this investigation have significant ramifications for various interested parties. To begin with, shareholders have the potential to reap the rewards of the knowledge provided, enabling them to make well-informed choices when putting their money into ESG funds in China. It is irrelevant to remark that ESG funds do not come with higher management fees or higher returns. Many investors who prioritize ESG factors place importance on achieving both social and financial gains. Therefore, they will be pleased to discover that ESG funds demonstrate superior risk-adjusted performance. This can be attributed to the possibility that the companies being invested in by the ESG funds have strong financial resources and a long-term vision for their business.
Furthermore, companies specializing in fund management can utilize the findings to establish appropriate management fees for their ESG funds. Additionally, they can utilize these observations to communicate with investors who are focused on ESG factors that investing in ESG funds could potentially lead to enhanced risk-adjusted performance while also contributing to societal well-being. Lastly, regulators can leverage this research to evaluate existing regulations pertaining to ESG funds in China, with the goal of promoting sustainable finance and responsible investing practices. Collaborative efforts between fund management companies and regulators are crucial in educating investors about ESG investing, fostering standardization and transparency in ESG metrics and reporting, and further advancing sustainable finance practices.
In conclusion, ongoing research in ESG investing is vital to its evolving nature and the dynamic relationship between management fees and investment performance. By promoting collaboration, education, and standardization, stakeholders can collectively contribute to the advancement of sustainable finance practices in China and beyond.

Author Contributions

The two authors have equal contribution on conceptualization, methodology, validation, formal analysis, investigation, data curation, writing—original draft preparation, writing—review and editing, visualization, supervision, project administration, and funding acquisition. All authors have read and agreed to the published version of the manuscript.

Funding

The work described in this paper was partially supported by InnoHK initiative, The Government of the HKSAR, and Laboratory for AI-Powered Financial Technologies.

Data Availability Statement

Data was retrieved from WIND terminals, for which the authors were granted a license to use for research.

Conflicts of Interest

The authors declare no conflict of interest.

Appendix A. Equations of the Fund Management Performance Metrics

Fund Return:
Daily fund return is calculated by the following:
R p , t = ( N A V p , t N A V p , t T ) / N A V p , t T
where R p , t is the fund T years total return at time t, NAV is the Net Asset Value of funds.
Fund Volatility:
Annualized volatility of funds is the annualized value of standard deviation of daily fund returns. It is calculated as follows:
V p , t = N t = 1 T ( N A V p , t N A V ¯ p ) 2 T 1
where
  • N A V p , t is the fund Net Asset Value on day t
  • N A V ¯ p is the average daily fund Net Asset Value over the calculation period
  • t is the number of trading days in the period over which the metrics is calculated
  • N is the number of trading days in a year
Sharpe Ratio
Sharpe Ratio (Sharpe 1966) is a metric to help investors understand the fund excess return in terms of risk. It is a type of risk-adjusted return. It is calculated as follows:
S h a r p e   R a t i o = R p , t R f V p , t
Sortino Ratio
(Sortino and Price 1994) develops this ratio to evaluate a portfolio’s risk-adjusted returns in relation to an investment target by considering downside risk. This is comparable to the Sharpe ratio, which evaluates risk-adjusted returns in relation to the risk-free rate using standard deviation. These two measures will yield comparable results when return distributions are nearly symmetrical and the goal return is around the distribution median. Results should change significantly when skewness grows and objectives move away from the median. It is calculated as follows:
S o r t i n o   R a t i o = R p , t R f D R p , t
where DR is the downside deviation or called downside risk in finance.
Treynor Ratio
Treynor and Black (1973) develops this ratio by considering market risk instead of total risk used in Sharpe ratio. It is calculated as follows:
T r e y n o r   R a t i o = R p , t R f β
Calmar Ratio
Young (1991) follows the same framework as Sharpe Ratio and Treynor Ratio but modifies its denominator to be the absolute value of max drawdown for the calculation period. It is calculated as follows:
C a l m a r   R a t i o = R p , t R f a b s ( M a x   D r a w d o w n )

References

  1. Abate, Guido, Ignazio Basile, and Pierpaolo Ferrari. 2021. The level of sustainability and mutual fund performance in Europe: An empirical analysis using ESG ratings. Corporate Social Responsibility and Environmental Management 28: 1446–55. [Google Scholar] [CrossRef]
  2. Aldieri, Luigi, Alessandra Amendola, and Vincenzo Candila. 2023. The Impact of ESG Scores on Risk Market Performance. Sustainability 15: 7183. [Google Scholar] [CrossRef]
  3. Alessandrini, Fabio, and Eric Jondeau. 2021. Optimal strategies for ESG portfolios. Journal of Portfolio Management 47: 114–38. [Google Scholar] [CrossRef]
  4. Asset Management Association of China. 2020a. A Survey on ESG Investments in Chinese Fund Industry 2019–Securities. Beijing: Asset Management Association of China. [Google Scholar]
  5. Asset Management Association of China. 2020b. A Survey on ESG Investments in Chinese Fund Industry 2019–Equities. Beijing: Asset Management Association of China. [Google Scholar]
  6. Ben-David, Itzhak, Justin Birru, and Andrea Rossi. 2023. The Performance of Hedge Fund Performance Fees (May 17, 2023). Fisher College of Business Working Paper No. 2020-03-014, Charles A. Dice Working Paper No. 2020-14. Available online: https://ssrn.com/abstract=3630723 (accessed on 26 January 2024).
  7. Berk, Jonathan B., and Jules H. van Binsbergen. 2015. Measuring skill in the mutual fund industry. Journal of Financial Economics 118: 1–20. [Google Scholar] [CrossRef]
  8. Berk, Jonathan B., and Richard C. Green. 2004. Mutual fund flows and performance in rational markets. Journal of Political Economy 112: 1269–95. [Google Scholar] [CrossRef]
  9. Brown, Rob. 2012. The problem with hedge fund fees. Journal of Derivatives and Hedge Funds 18: 42–52. [Google Scholar] [CrossRef]
  10. Cao, Charles, Eric C. Chang, and Ying Wang. 2008. An empirical analysis of the dynamic relationship between mutual fund and market return volatility. Journal of Banking & Finance 32: 2111–23. [Google Scholar]
  11. Carnini Pulino, Silvia, Mirella Ciaburri, Barbara Sveva Magnanelli, and Luigi Nasta. 2022. Does ESG Disclosure Influence Firm Performance? Sustainability 14: 7595. [Google Scholar] [CrossRef]
  12. Chinese Association for Public Companies. 2022. ESG Practice of Chinese Listed Companies: Annual Review 2022. Beijing: Chinese Association for Public Companies. [Google Scholar]
  13. Cong, Yingnan, Chen Zhu, Yufei Hou, Shuairu Tian, and Xiaojing Cai. 2022. Does ESG investment reduce carbon emissions in China? Frontiers in Environmental Science 10: 977049. [Google Scholar] [CrossRef]
  14. Cooper, Michael J., Michael Halling, and Wenhao Yang. 2021. The persistence of fee dispersion among mutual funds. Review of Finance 25: 365–402. [Google Scholar] [CrossRef]
  15. Dahlquist, Magnus, Stefan Engström, and Paul Söderlind. 2000. Performance and characteristics of Swedish mutual funds. Journal of Financial and Quantitative Analysis 35: 409–23. [Google Scholar] [CrossRef]
  16. Dellva, Wilfred L., and Gerard T. Olson. 2005. The relationship between mutual fund fees and expenses and their effects on performance. Financial Review 33: 85–104. [Google Scholar] [CrossRef]
  17. Dreyer, Johannes Kabderian, Mateus Moreira, William T. Smith, and Vivek Sharma. 2023. Do environmental, social and governance practices affect portfolio returns? evidence from the us stock market from 2002 to 2020. Review of Accounting and Finance 22: 37–61. [Google Scholar] [CrossRef]
  18. Dutta, Abhishek, and Baitali Paul. 2023. Performance analysis of select ESG funds in India. Management Journal for Advanced Research 3: 1–7. [Google Scholar] [CrossRef]
  19. Ferriani, Fabrizio, and Filippo Natoli. 2020. ESG risks in times of COVID-19. Applied Economics Letters 28: 1537–41. [Google Scholar] [CrossRef]
  20. Friede, Gunnar, Timo Busch, and Alexander Bassen. 2015. ESG and financial performance: Aggregated evidence from more than 2000 empirical studies. Journal of Sustainable Finance & Investment 5: 210–33. [Google Scholar]
  21. Gruber, Martin J. 1996. Another puzzle: The growth in actively managed mutual funds. The Journal of Finance 51: 783–810. [Google Scholar] [CrossRef]
  22. Ippolito, Richard A. 1992. Consumer reaction to measures of poor quality: Evidence from the mutual fund industry. Journal of Law and Economics 35: 45–70. [Google Scholar] [CrossRef]
  23. Jensen, Michael C. 1968. The performance of mutual funds in the period 1945–1964. Journal of Finance 23: 389–416. [Google Scholar]
  24. Kreander, Niklas, Rob H. Gray, David M. Power, and Christopher D. Sinclair. 2005. Evaluating the performance of ethical and non-ethical funds: A matched pair analysis. Journal of Business Finance & Accounting 32: 1465–93. [Google Scholar] [CrossRef]
  25. Krueger, Philipp, Zacharias Sautner, Dragon Yongjun Tang, and Rui Zhong. 2024. The effects of mandatory esg disclosure around the world. Journal of Accounting Research. Swiss Finance Institute Research Paper No. 21–44, European Corporate Governance Institute–Finance Working Paper No. 754/2021. Available online: https://ssrn.com/abstract=3832745 (accessed on 25 January 2024).
  26. Latzko, David A. 1999. Economies of scale in mutual fund administration. Journal of Financial Research 22: 331–39. [Google Scholar] [CrossRef]
  27. Lee, Darren D., John Hua Fan, and Victor S. H. Wong. 2020. No more excuses! performance of ESG-integrated portfolios in Australia. Accounting and Finance 61: S2407–50. [Google Scholar] [CrossRef]
  28. Lee, Ook, Hanseon Joo, Hayoung Choi, and Minjong Cheon. 2022. Proposing an integrated approach to analyzing ESG data via machine learning and deep learning algorithms. Sustainability 14: 8745. [Google Scholar] [CrossRef]
  29. Liu, Yupei, Weian Li, and Qiankun Meng. 2023. Influence of distracted mutual fund investors on corporate ESG decoupling: Evidence from China. Sustainability Accounting Management and Policy Journal 14: 184–215. [Google Scholar] [CrossRef]
  30. Pastor, Ľuboš, Robert F. Stambaugh, and Lucian A. Taylor. 2020. Fund tradeoffs. Journal of Financial Economics 138: 614–34. [Google Scholar] [CrossRef]
  31. Phalippou, Ludovic. 2020. An inconvenient fact: Private equity returns and the billionaire factory. The Journal of Investing 30: 11–39. [Google Scholar] [CrossRef]
  32. Rahman, Muhammad Irfan Abdul, and Wee-Yeap Lau. 2023. How has ESG investing impacted investment portfolios? A case study of the Malaysian civil service pension fund. Asian Journal of Economic Modelling 11: 15–28. [Google Scholar] [CrossRef]
  33. Rompotis, Gerasimos G. 2022. The ESG ETFs in the UK. Journal of Asset Management 23: 114–29. [Google Scholar] [CrossRef]
  34. Sharpe, William F. 1966. Mutual Fund Performance. Journal of Business 39: 119–38. [Google Scholar] [CrossRef]
  35. Shen, Hongtao, Honghui Lin, Wenqi Han, and Huiying Wu. 2023. ESG in China: A review of practice and research, and future research avenues. China Journal of Accounting Research 16: 100325. [Google Scholar] [CrossRef]
  36. Sortino, Frank A., and Lee N. Price. 1994. Performance measurement in a downside risk framework. Journal of Investing 3: 59–64. [Google Scholar] [CrossRef]
  37. Stambaugh, Robert F. 2020. Skill and Profit in Active Management. Jacobs Levy Equity Management Center for Quantitative Financial Research Paper. Available online: https://ssrn.com/abstract=3354074 (accessed on 25 January 2024).
  38. Steen, Marie, Julian Taghawi Moussawi, and Ole Gjolberg. 2020. Is there a relationship between Morningstar’s ESG ratings and mutual fund performance? Journal of Sustainable Finance & Investment 10: 349–70. [Google Scholar]
  39. Treynor, Jack L., and Fischer Black. 1973. How to use security analysis to improve portfolio selection. Journal of Business 46: 66–86. [Google Scholar] [CrossRef]
  40. Treynor, J. L., and K. Mazuy. 1966. Can mutual funds outguess the market? Harvard Business Review 44: 131–36. [Google Scholar]
  41. Tufano, Peter, and Matthew Sevick. 1997. Board structure and fee-setting in the U.S. mutual fund industry. Journal of Financial Economics 46: 321–55. [Google Scholar] [CrossRef]
  42. Vannoni, Valeria, Emanuele Ciotti, and Fideuram Bank. 2020. ESG or not ESG? a benchmarking analysis. International Journal of Business and Management 15: 152. [Google Scholar] [CrossRef]
  43. Wermers, Russ. 2000. Mutual fund performance: An empirical decomposition into stock- picking talent, style, transactions costs, and expenses. The Journal of Finance 55: 1655–703. [Google Scholar] [CrossRef]
  44. Yang, Youde, Guanghua Xu, and Ruiqian Li. 2023. Official Turnover and Corporate ESG Practices: Evidence from China. Environmental Science and Pollution Research 30: 51422–39. [Google Scholar] [CrossRef] [PubMed]
  45. Young, Terry W. 1991. Calmar ratio: A smoother tool. Futures 20: 40. [Google Scholar]
  46. Zhang, Dingzu, and Luqi Liu. 2022. Does ESG performance enhance financial flexibility? Evidence from China. Sustainability 14: 11324. [Google Scholar] [CrossRef]
  47. Zhu, Min. 2018. Informative fund size, managerial skill, and investor rationality. Journal of Financial Economics 130: 114–34. [Google Scholar] [CrossRef]
  48. Zhu, Wanting. 2023. Study on relationship between the financial index of corporations and ESG performance: Based on the perspective of investors of a-shares. BCP Business & Management 38: 2588–95. [Google Scholar] [CrossRef]
Figure 1. Return by management fee groups.
Ijfs 12 00038 g001
Figure 2. Volatility by management fee groups.
Ijfs 12 00038 g002
Figure 3. Sharpe Ratio by management fee groups.
Ijfs 12 00038 g003
Figure 4. Sortino Ratio by management fee groups.
Ijfs 12 00038 g004
Figure 5. Max Drawdown by management fee groups.
Ijfs 12 00038 g005
Figure 6. Calmar Ratio by management fee groups.
Ijfs 12 00038 g006
Figure 7. Treynor Ratio by management fee groups.
Ijfs 12 00038 g007
Figure 8. Return by ESG score groups.
Ijfs 12 00038 g008
Figure 9. Volatility by ESG score groups.
Ijfs 12 00038 g009
Figure 10. Sharpe Ratio by ESG score groups.
Ijfs 12 00038 g010
Figure 11. Sortino Ratio by ESG score groups.
Ijfs 12 00038 g011
Figure 12. Max Drawdown by ESG score groups.
Ijfs 12 00038 g012
Figure 13. Calmar Ratio by ESG score groups.
Ijfs 12 00038 g013
Figure 14. Treynor Ratio by ESG score groups.
Ijfs 12 00038 g014
Figure 15. Management fee by ESG score groups.
Ijfs 12 00038 g015
Table 1. China open-end funds by management fee groups. Remarks: The 1742 funds are categorized into 30 management fee groups and listed in the “30 Groups” column. If a management fee group contains fewer than 30 funds, it will be indicated as “n/a” in the “7 Groups” column and excluded from our distributional analysis. There are 1728 funds listed under the “7 Groups” column.
30 Groups 7 Groups
Management Fee GroupCount of Funds%Count of Funds
0.0000 to 0.10000 0.00%n/a
0.1000 to 0.20000 0.00%n/a
0.2000 to 0.30000 0.00%n/a
0.3000 to 0.40000 0.00%n/a
0.4000 to 0.50000 0.00%n/a
0.5000 to 0.6000477 27.38%477
0.6000 to 0.700050 2.87%50
0.7000 to 0.80005 0.29%n/a
0.8000 to 0.900085 4.88%85
0.9000 to 1.000031 1.78%31
1.0000 to 1.1000100 5.74%100
1.1000 to 1.2000623 35.76%623
1.2000 to 1.30000 0.00%n/a
1.3000 to 1.40003 0.17%n/a
1.4000 to 1.50000 0.00%n/a
1.5000 to 1.6000362 20.78%362
1.6000 to 1.70002 0.11%n/a
1.7000 to 1.80000 0.00%n/a
1.8000 to 1.90000 0.00%n/a
1.9000 to 2.00000 0.00%n/a
2.0000 to 2.10003 0.17%n/a
2.1000 to 2.20000 0.00%n/a
2.2000 to 2.30000 0.00%n/a
2.3000 to 2.40000 0.00%n/a
2.4000 to 2.50000 0.00%n/a
2.5000 to 2.60000 0.00%n/a
2.6000 to 2.70000 0.00%n/a
2.7000 to 2.80000 0.00%n/a
2.8000 to 2.90000 0.00%n/a
2.9000 to 3.00001 0.06%n/a
Total1742 1728
Table 2. China open-end funds by ESG Comprehensive Score groups. Remarks: All 1742 funds are categorized into 22 ESG score groups and listed in the “22 Groups” column. Higher ESG scores mean better ESG quality. If an ESG Comprehensive Score group contains fewer than 30 funds, it will be marked as “n/a” in the “10 Groups” column and excluded from our distributional analysis. There are 1705 funds listed under the “10 Groups” column.
22 Groups 10 Groups
ESG Comprehensive Score GroupCount of Funds%Count of Funds
4.7665 to 4.91650 0.00%n/a
4.9165 to 5.06650 0.00%n/a
5.0665 to 5.21650 0.00%n/a
5.2165 to 5.36651 0.06%n/a
5.3665 to 5.51650 0.00%n/a
5.5165 to 5.66650 0.00%n/a
5.6665 to 5.81651 0.06%n/a
5.8165 to 5.966514 0.80%n/a
5.9665 to 6.116532 1.84%32
6.1165 to 6.266570 4.02%70
6.2665 to 6.4165169 9.70%169
6.4165 to 6.5665226 12.97%226
6.5665 to 6.7165298 17.11%298
6.7165 to 6.8665326 18.71%326
6.8665 to 7.0165244 14.01%244
7.0165 to 7.1665185 10.62%185
7.1665 to 7.3165117 6.72%117
7.3165 to 7.466538 2.18%38
7.4665 to 7.616511 0.63%n/a
7.6165 to 7.76659 0.52%n/a
7.7665 to 7.91650 0.00%n/a
7.9165 to 8.02131 0.06%n/a
Total1742 1705
Table 3. Effect of management fee on annualized return: a regression analysis.
3-Year Sample 5-Year Sample
Sample size1742 1742
Period 30 June 2019 to 30 June 2022 30 June 2017 to 30 June 2022
Y-variable 3y annualized return 5y annualized return
Coeff Coeff
Constant−10.626***−9.590***
Management Fee10.110***4.006***
Custody Fee−4.335 −1.333
Subscription Fee0.133 −0.249
Redemption Fee1.117 0.524
Transaction Fee1.415***0.469***
Fund Size3.877***2.678***
Fund Age−0.432***−0.276***
ESG−1.710 −0.491
Adj. R-Square0.287 0.243
***: Significant at 1% level.
Table 4. Management fees, Jenen’s α, securities selection skill, and market timing ability.
3-Year Performance5-Year Performance
Mgmt Fee GroupAvg αAvg MTAvg SSAvg αAvg MTAvg SS
(Annualized)(Annualized)(Annualized)(Annualized)
0.5000 to 0.60009.60%−0.05097.50%7.87%−0.02917.50%
0.6000 to 0.70008.04%0.27627.50%6.15%0.35765.00%
0.8000 to 0.900010.62%−0.152910.00%8.43%−0.17897.50%
0.9000 to 1.000010.14%−0.253310.00%8.13%−0.21967.50%
1.0000 to 1.100012.06%−0.262415.00%9.23%−0.499312.50%
1.1000 to 1.200017.43%−0.962720.00%12.78%−0.35715.00%
1.5000 to 1.600017.29%−0.871520.00%12.27%−0.404212.50%
Table 5. ESG scores, Jenen’s α, securities selection skill, and market timing ability.
3-Year Performance5-Year Performance
ESG Score GroupsAvg αAvg MTAvg SSAvg αAvg MTAvg SS
(Annualized)(Annualized)(Annualized)(Annualized)
5.9665 to 6.116517.46%−1.249920.00%12.22%−1.004615.00%
6.1165 to 6.266516.12%−1.448920.00%11.36%−0.748612.50%
6.2665 to 6.416514.83%−0.827817.50%10.69%−0.438712.50%
6.4165 to 6.566514.76%−0.779717.50%10.85%−0.503712.50%
6.5665 to 6.716514.33%−0.513315.00%10.90%−0.211510.00%
6.7165 to 6.866514.62%−0.591115.00%10.78%−0.215010.00%
6.8665 to 7.016514.11%−0.413315.00%10.52%−0.167010.00%
7.0165 to 7.166513.16%−0.311015.00%10.09%0.046910.00%
7.1665 to 7.316513.21%0.005912.50%10.54%0.154610.00%
7.3165 to 7.46659.18%−0.394210.00%7.89%−0.10157.50%
Table 6. Definitions of ESG Quartile Clusters.
ESG Quartile Cluster Clustering Definition
ESG1 (lowest ESG Score groups)Below the lower quartile
ESG2Between the lower quartile and the median
ESG3Between the median and the upper quartile
ESG4 (highest ESG Score groups)Higher than the upper quartile
Table 7. Fund management performance and fee of the ESG Quartile Clusters.
ESG Quartile Cluster ESG1ESG2ESG3ESG4ANOVA Test
Count16881667583
Annualized Return (5Y)11.402411.635011.28369.0974***
Annualized Return (3Y)19.272018.952617.848613.9590***
Max Drawdown % (3Y)−29.3965−26.7495−24.7059−26.9813***
Max Drawdown % (5Y)−31.4162−29.0852−27.0107−28.6230***
Annualized Volatility (3Y) 20.824618.636417.229617.9437***
Annualized Volatility (5Y) 19.475617.662516.508816.8392***
Annualized Sharpe Ratio (3Y)0.89410.99121.04040.8101***
Annualized Sharpe Ratio (5Y)0.60310.66380.73430.5782***
Annualized Sortino Ratio (3Y)1.28691.44981.52431.2108***
Annualized Sortino Ratio (5Y)0.87020.96261.08010.8480***
Calmar Ratio (5Y)0.46500.53150.64560.4779***
Calmar Ratio (3Y)0.78270.94961.04770.7624***
Treynor Ratio (5Y)0.00060.00070.00070.0006
Treynor Ratio (3Y)0.00090.00100.00100.0008
Management Fee1.0821.0681.0171.033
Notes: Dark-grey cells mean the lowest value among the four ESG Quartile Clusters, while light-grey cells mean the highest value among the four clusters. The ANOVA test aims to test whether the means of the four clusters are equal, with “***” indicating rejection of this hypothesis at 1% significance level.
Table 8. Factors on 3-year Annualized Return: results of the four ESG Quartile Clusters.
Sample Period30 June 2019 to 30 June 2022
Y-Variable3y Annualized Return
ESG Quartile ClusterESG1 ESG2 ESG3 ESG4
Sample size168 816 675 83
Coeff Coeff Coeff Coeff
Constant−43.007 −9.358 −99.489 31.076
Management Fee8.711***8.622***16.787***5.696***
Custody Fee−19.925 −3.787 −15.509 20.919
Subscription Fee−0.952 0.057 −0.498 1.278
Redemption Fee−0.749 2.332 1.732 2.487
Transaction Fee1.931***1.571 0.515 1.795
Fund Size5.547***3.817***4.943***1.885***
Fund Age−0.183 −0.347 −0.687***−0.460***
ESG2.123 −1.992 9.806 −5.808
Adj. R-Square0.259 0.275 0.382 0.254
***: Significant at 1% level.
Table 9. Factors on 5-year Annualized Return: results of the fou ESG Quartile Clusters.
Sample Period30 June 2017 to 30 June 2022
ESG Quartile GroupESG1 ESG2 ESG3 ESG4
Sample size168 816 675 83
Coeff Coeff Coeff Coeff
Constant−25.455 −4.966 −50.534 8.030
Management Fee2.479 4.659***7.625***0.905
Custody Fee−2.997 −4.695 −11.053 14.374
Subscription Fee−0.336 −0.736 −0.645 0.328
Redemption Fee−1.200 1.156 1.322 1.510
Transaction Fee0.386 0.877 0.088 0.715
Fund Size3.250***2.768***3.158***1.845***
Fund Age−0.132 −0.335***−0.364***−0.257
ESG1.782 −1.307 4.734 −2.334
Adj. R-Square0.185 0.265 0.341 0.202
***: Significant at 1% level.
Disclaimer/Publisher’s Note: The statements, opinions and data contained in all publications are solely those of the individual author(s) and contributor(s) and not of MDPI and/or the editor(s). MDPI and/or the editor(s) disclaim responsibility for any injury to people or property resulting from any ideas, methods, instructions or products referred to in the content.

