Abstract
In this study, we provide a comprehensive examination of the performance of financial (specialty sector financial) mutual funds over a 23-year period, a much longer time frame than what has been analyzed in previous literature. To fully understand the performance of these mutual funds, we consider multiple factors, including risk-adjusted performance, both unconditional and conditional multifactor analysis, and market timing and selectivity. Financial mutual funds have higher risk-adjusted performance than the overall market and financial sector benchmarks. However, fund alphas are not different from zero, and managers do not exhibit market timing or security selection abilities. Our analysis not only includes the overall performance of these mutual funds, but we also delve into sub-samples before and after the 2008 financial crisis and during the recent Coronavirus pandemic.
1. Introduction
In this study, we analyze the performance of mutual funds that focus their investment strategy in the financial sector. Sector mutual funds have grown significantly in tandem with the overall equity mutual fund market in the U.S., with sector fund total net assets increasing from USD 207 billion in 2011 to USD 519 billion in 2021 (ICI 2022). Only a few studies have examined the general sector fund space, and we are not aware of any studies focusing on financial sector mutual funds (FMFs). FMFs invest in the equities of banks, insurance companies, and other companies that provide financial services. FMF growth has outpaced the broader sector fund industry as well as equity funds, with FMF total net assets tripling from USD 4.5 billion in 2011 to USD 13.5 billion in 2021. Despite this rapid growth, little has been documented in the literature on FMFs.
Sector mutual funds allow investors to gain exposure to a specific segment of the economy—in this case, the financial sector. This focused investment strategy allows investors to gain targeted exposure to the financial sector of the economy. FMFs also often pay dividends to shareholders from the revenues of the financial institutions they invest in, providing a steady income stream, which may not be a characteristic of all mutual funds. Analyzing the performance of financial mutual funds complements existing literature on the broader equity mutual fund space by providing a wider view of the overall investment landscape. It offers insights into diversification, risk management, asset allocation, and managerial skills, all of which are critical aspects of successful long-term investing.
Furthermore, given that FMFs invest in companies more sensitive to the interest rate and credit environment, we also analyze the impact of slope of the yield curve and credit quality spread differential on the risk-adjusted performance of financial mutual funds. By analyzing how financial mutual funds adjust their portfolios based on quality spread differentials, we can understand their sensitivity to credit risk. Funds that take on excessive credit risk for higher yields might be exposed to greater volatility and potential losses during economic downturns, making their risk-adjusted performance an essential consideration for investors. Given the nature of financial mutual funds, it is therefore important to study the performance of financial mutual funds even though several studies have examined the risk-adjusted performance of mutual funds generally.
This study provides a detailed examination of the performance of financial mutual funds. Several dimensions of performance are considered. First, risk-adjusted performance is evaluated using a variety of measures, including the Sharpe ratio, Sortino ratio, and Omega measure. We find that FMFs exhibit better risk-adjusted performance than both broad-market and financial sector benchmarks. Next, we evaluate FMFs using various multifactor pricing models. FMF alphas are not significantly different from zero across these models, suggesting that fund managers do not exhibit skill in earning returns above what would be expected given the risk exposure of their portfolios. These results hold for both unconditional factor models as well as conditional models where factor loadings are allowed to be time varying. Next, we evaluate market timing and selectivity evidence among FMFs using the approaches of Treynor and Mazuy (1966) and Henriksson and Merton (1981). We find no robust evidence that FMF managers can time the market, nor do we find security selection ability, consistent with factor model results. Again, these results hold for both unconditional and conditional models with time-varying factor sensitivities.
This study makes several significant contributions to the existing literature. First, it focuses on financial sector mutual funds (FMFs), a segment that has seen above-average growth over the past decade. This specific examination of FMFs addresses a notable gap in the literature, providing insights into the unique characteristics and dynamics of this sector. Furthermore, the study covers a more extended time frame, spanning over 23 years, in contrast to previous sector mutual fund research. This extended period allows for a comprehensive and in-depth analysis of FMF performance, including the opportunity for detailed subsample assessments.
In addition, our study is the first to our knowledge to analyze FMFs in the context of the 2008 financial crisis and 2020 Coronavirus pandemic, evaluating the financial sector’s sensitivity to such systemic shocks. Years of ultra-low interest rates and lax lending rules fostered a home price bubble in the United States and worldwide, sowing the seeds of the financial catastrophe. Interest rates gradually began to rise, and house ownership hit a plateau. The Federal Reserve began raising interest rates in June 2004, and two years later, the Federal funds rate had reached 5.25 percent, where it remained until August 2007. The yield curve inverted by July 2007, indicating an impending economic collapse. We compared the risk-adjusted performance of FMFs from January 2000 to July 2007 and August 2007 to June 2022, before and after the global financial crisis. We also examine the period surrounding the Coronavirus pandemic, another period of tremendous upheaval in the macroeconomic, monetary, and fiscal landscape. Comparing FMF performance before and after these crises can offer valuable insights into how FMFs adapted to economic turbulence.
This study also delves into the presence of market timing and selectivity skills among FMF managers, employing both unconditional and conditional models. This approach provides a nuanced understanding of the abilities of fund managers within the financial sector. Finally, our work complements research on the (lack of) fund manager skill. In line with Berk and van Binsbergen (2015, 2016), the lack of significant alphas suggests the FMF market is efficient, with no capital under-allocated to funds with persistently skilled managers. This efficiency offers an intriguing counterpoint to the higher risk-adjusted performance measures of FMFs versus other mutual funds. The absence of significant alpha values suggests an efficient market, despite the generally superior risk-adjusted performance of FMFs compared to other mutual funds. This finding deepens the understanding of FMFs’ dynamics within the broader mutual fund industry.
The rest of this study is organized as follows. Section 2 reviews existing literature. Section 3 provides an overview of the performance evaluation measures and models employed. Section 4 presents data and summary statistics. Section 5 discusses multivariate empirical results, and Section 6 concludes.
2. Previous Studies
Although we are not aware of any existing literature specific to financial sector mutual funds, there are a few studies on sector funds generally. Khorana and Nelling (1997) examine seven broad sectors, including finance. Most of their multivariate tests cover the period around 1987–1992, and they find mixed evidence. Sector mutual funds exhibit positive risk-adjusted performance relative to their benchmarks, but they do not show positive risk-adjusted performance compared to the overall market, with financial sector mutual funds following this general pattern. Dellva et al. (2001) look at 35 Fidelity sector funds from 1989 to 1998, focusing on the stock selection and market timing ability of sector fund managers. They measure stock selectivity as a fund’s alpha in a simple market model, and market timing using the quadratic market beta of Henriksson and Merton (1981). In contrast to Khorana and Nelling, Dellva, Demaskey, and Smith find that sector funds exhibit stock selection ability when compared to sector-specific benchmarks, but not when compared to the broader S&P 500 index. The authors also report no significant market timing ability among sector funds.
Kaushik et al. (2010) examined market timing ability for funds in seven sectors during 1990–2005. They also found results sensitive to the use of a broad market versus sector-specific benchmark. When measured against the S&P 500, sector funds show positive market timing ability during recessions, and negative timing ability during expansions and overall. However, compared to sector-specific benchmarks, funds show no positive market timing ability.
The more general literature on fund performance evaluation and market timing is also relevant. The heavily cited work of Carhart (1997) popularized cross-sectional return analysis to evaluate fund manager quality by looking at fund alpha. His main model includes factors for the overall market return, size, value (book-to-market), and one-year momentum. Carhart concludes that mutual fund managers do not exhibit skill or informational advantage. His four-factor model shows that size and momentum explain a large proportion of cross-sectional variation in mutual fund returns. Carhart also reports that fund characteristics argued by fund managers to proxy for skill—turnover, expense ratios, and sales loads—are all associated with worse performance. Another relevant cross-sectional return model includes the Fama and French (2015) five-factor model, which includes the market, size, and value factors, along with factors to proxy for profitability and investment. Treynor and Mazuy (1966) measure fund manager skill by adding a quadratic term to the market model, arguing that managers able to time the market will earn even higher performance in periods of strong market performance and earn less negative returns in weaker years, leading to a convex characteristic line. Henriksson and Merton (1981) present and test a model where fund managers may have some limited ability to time the market, with forecasting ability for the sign of the market excess return but not the magnitude. Berk and van Binsbergen (2015, 2016) argue that some fund managers do indeed possess skill, but in an efficient market, capital flows to skilled managers, and in the presence of diseconomies of scale, any skill is eventually subsumed by fees, resulting in net zero alpha. The authors thus posit that dollars of value created is a better measure of manager skill in efficient capital markets.
Another class of performance evaluation study points out that risk premia are time-varying, and empirical results may be misleading if they do not condition on information with some predictive power for expected returns. Ferson and Schadt (1996) argue that observable indicators such as the market dividend yield and treasury yields and spreads have predictive power for market returns, and the performance of a portfolio formed on such public information should not be considered superior or skill driven. Ferson and Schadt estimate conditional fund alphas, where the conditioning variables include the market dividend yield and bond market information such as the treasury yield and various yield spreads. They find conditional alphas are not reliably different from zero. In addition, the authors also present evidence of significant negative market timing ability—that is, funds tend to have more market risk when market returns are worse.
Other studies of risk-adjusted performance figure prominently in our analysis, going back to Sharpe (1966). We use the Sharpe ratio and other measures. The Sortino ratio of Sortino and Van Der Meer (1991) is simply an asset’s excess return over the risk-free rate divided by the asset’s downside deviation. Given investor tendencies toward risk aversion and also loss aversion, the Sortino ratio provides a pertinent measure of performance relative to downside risk. Keating and Shadwick (2002) argue there are limits to traditional risk-adjusted performance measures based only on average returns and standard deviations, since returns do not follow a normal distribution. They address this with the Omega ratio, which essentially measures the probability-weighted gains and losses of an investment. Because the Omega ratio is not based on only two moments of a return series, Keating and Shadwick argue that it provides a more complete assessment of the risk and return characteristics of an investment.
3. Performance Evaluation Measures and Models
We evaluate FMF performance using three categories of models: risk-adjusted performance measures, multifactor models, and conditional multifactor models.
- Risk-adjusted performance measures
The most fundamental risk-adjusted performance measure is the Sharpe ratio, which considers an investment’s excess return over the risk-free rate in relation to its standard deviation:
where rp is the portfolio return, rf is the risk-free rate, and σp is the portfolio standard deviation. A higher Sharpe ratio indicates more excess return per unit of risk borne.
As discussed in the section above, variation in returns below the mean are likely of greater concern to a risk-averse investor than upside deviation. The Sortino ratio measures excess return in relation to downside risk:
where σpd is the standard deviation of a portfolio’s returns below a certain target level. Following existing literature, we use a target of zero, in which case σpd is the standard deviation of negative returns.
Keating and Shadwick (2002) argue that their Omega ratio provides a “full characterization of the risk reward characteristics” of an investment’s return distribution. They propose a measure of probability-weighted gains and losses:
where a and b are some intervals of possible returns (typically −100% and infinity), and r is some threshold return, which we again define as zero. In looking at the equation, one rough interpretation would be that the numerator represents the area under an investment’s return distribution curve for positive returns, and the denominator is the area under the curve for negative returns. A higher ratio means an investment has more probability-weighted positive returns.
- b.
- Multifactor models
Factor models are another widely employed tool to evaluate performance. When investment returns are modeled based on their sensitivity to risk factors, any variation in excess performance that cannot be explained by variation in risk factors would be the investment’s alpha. We employ a seven-factor model to evaluate FMF alphas. The Fama-French five-factor model is an extension of the classic Capital Asset Pricing Model (CAPM) and the three-factor model proposed by Eugene Fama and Kenneth French in 1992. The five-factor model adds two additional factors, profitability, and investment, to the market risk factor, size factor, and value factor in the three-factor model.
The five factors are:
- Market risk (beta): This is the sensitivity of a stock’s returns to changes in the overall market.
- Size: This is the market capitalization of a stock, measured as its price multiplied by the number of shares outstanding.
- Value: This is the book-to-market ratio of a stock, which is its book value divided by its market value.
- Profitability: This is the operating profitability of a company, measured as its earnings before interest, taxes, depreciation, and amortization (EBITDA) divided by its total assets.
- Investment: This is the investment rate of a company, measured as its capital expenditures divided by its total assets.
Financial mutual funds, particularly those with fixed-income securities in their portfolios, exhibit sensitivity to fluctuations in interest rates. Furthermore, through a detailed investigation of how financial mutual funds adjust their holdings concerning quality spread differentials, we gain insights into their sensitivity to credit risk. It is essential to comprehend how funds manage credit risk, as some may be inclined to take on excessive risk in pursuit of higher yields. However, this approach could expose them to greater volatility and potential losses during economic downturns, making their risk-adjusted performance a crucial consideration for investors.
Therefore, in addition to the five factors included in the Fama–French five-factor model, we incorporate two additional variables to evaluate the performance of FMFs—credit quality spread differential (QSD) and slope of the U.S. Treasury yield curve. Credit quality spread impacts stock markets because when credit quality spread widens, it means that investors are demanding a higher risk premium. This can lead to a decline in stock prices, as investors become more risk averse.
U.S. Treasury yield is a measure of the risk-free rate of return. When U.S. Treasury yield rises, it means that investors are demanding a higher return for lending money. This can make it more expensive for companies to borrow money, which can lead to a slowdown in economic growth. Equation (4) provides the seven-factor model that is an extension of the Fama–French five-factor model and is estimated using monthly returns:
where Ri,t = the percentage return for firm i in month t.
Rf,t = the yield on U.S. Treasury bill month t.
Rm,t = the return on CRSP value-weighted index for month t.
= The variable is the market risk factor and represents the excess return of the overall market and accounts for the general risk associated with investing in the stock market.
SMBt (Small minus Big) = small-cap return minus large-cap return for month t, and it is the capitalization factor realization. The SMB factor measures the historical performance difference between small-cap stocks and large-cap stocks. It is calculated as the return of a portfolio of small-cap stocks minus the return of a portfolio of large-cap stocks. A positive SMB suggests that small-cap stocks have outperformed large-cap stocks.
HMLt (High minus Low) = the value return minus the growth return for month t, and it is the value factor realization. The HML factor represents the historical performance difference between value stocks and growth stocks. It is calculated as the return of a portfolio of value stocks (those with a low price-to-book ratio) minus the return of a portfolio of growth stocks (those with a high price-to-book ratio). A positive HML indicates that value stocks have outperformed growth stocks.
RMWt (RMW (Robust minus Weak)) = 1/2 (Small Robust + Big Robust) − 1/2 (Small Weak + Big Weak). This factor measures the historical performance difference between profitable and unprofitable companies. It is calculated as the return of a portfolio of profitable companies minus the return of a portfolio of unprofitable companies. A positive RMW suggests that profitable companies have outperformed unprofitable companies
CMA (Conservative minus Aggressive) = 1/2 (Small Conservative + Big Conservative) − 1/2 (Small Aggressive + Big Aggressive). The CMA factor represents the historical performance difference between conservative (low investment) and aggressive (high investment) companies. It is calculated as the return of a portfolio of conservative companies minus the return of a portfolio of aggressive companies. A positive CMA indicates that conservative companies have outperformed aggressive companies.
QSDt = yield on AAA-rated corporate bonds minus yield on Baa-rated corporate bonds. When credit quality spread widens, it means that investors are demanding a higher risk premium for lending money. This can lead to a decline in stock prices, as investors become more risk-averse.
Slopet = yield on 30-year Treasury bonds minus the yield on 30-day Treasury bills in month t. This variable measures the slope of the yield curve as the difference between short-term and long-term interest rates.
εi,t = an error term.
- c.
- Conditional multifactor models
Even the most complete multifactor model can give misleading results in the presence of time-varying sensitivities to underlying risk factors, as Ferson and Schadt (1996) and many others point out. As a result, we also evaluate FMFs using conditional multifactor models. Following existing literature (e.g., Kaushik et al. 2010; Ferson and Schadt 1996), we augment the unconditional seven-factor model above with a vector Zj,t−1 of instruments, which include lagged and demeaned market indicator variables: the three-month Treasury bill rate; the term structure slope, measured by the 30-year Treasury yield minus the three-month yield; the corporate bond quality spread, measured by the Moody’s Baa corporate bond yield minus the Aaa corporate yield; and the dividend yield on the S&P 500.
If managers possess skills beyond what is publicly known, then their funds would exhibit positive alphas even after controlling for these instruments.
4. Data and Summary Statistics
Most of the data for this study come from Morningstar Direct. We obtained data for mutual funds with the Morningstar Category “Financial” for the sample period January 2000 through May 2023, as well as monthly benchmark returns for the S&P 500 Financial Index (U.S. financial stocks), Russell 3000 Index (U.S. equity market), and FTSE All World ex US index (international equity market). Survivorship bias significantly impacts performance persistence by truncating the dataset when poorly performing funds disappear. Overstating performance occurs when only surviving funds are studied, as demonstrated by Brown et al. (1992). Carhart (1997) discovered that persistence disappears in a survivorship bias-free sample of U.S. equity funds once momentum in stock returns is considered. However, recent studies argue that considering fund styles reveals persistence in U.S. equity funds. Elton et al. (1996) identified survivorship bias as a problem in previous mutual fund studies. Failure to account for survivorship bias inflates risk-adjusted returns for mutual funds because merging or failing funds tend to perform worse. Brown et al. (1992) also demonstrated that survivorship bias can provide a false impression of persistence in mutual fund performance. Our dataset includes all financial mutual funds, both surviving and defunct, from their inception until May 2023. Factor returns for the Fama–French three-factor and five-factor models, as well as the Carhart four-factor model, come from Kenneth French’s website. We use the three-month Treasury bill return for the risk-free rate.
Table 1 shows the characteristics of financial mutual funds used in this study based on May 2023 data.

Table 1.
Characteristics of financial mutual funds used in this study based on May 2023 data.
In May 2023, there were 49 financial mutual funds. The average size of a financial mutual fund was USD 563.45 million, with a median size of USD 236.70 million. The average expense ratio for financial mutual funds in 2022 was 1.47%. When compared to equity mutual funds in general, financial mutual funds had a relatively high net expense ratio. In 2022, the average expense ratio for equity mutual funds was lower at 0.44%.1 Financial mutual funds had an average turnover ratio of 74.74% in 2022, with a median turnover ratio of 39%.
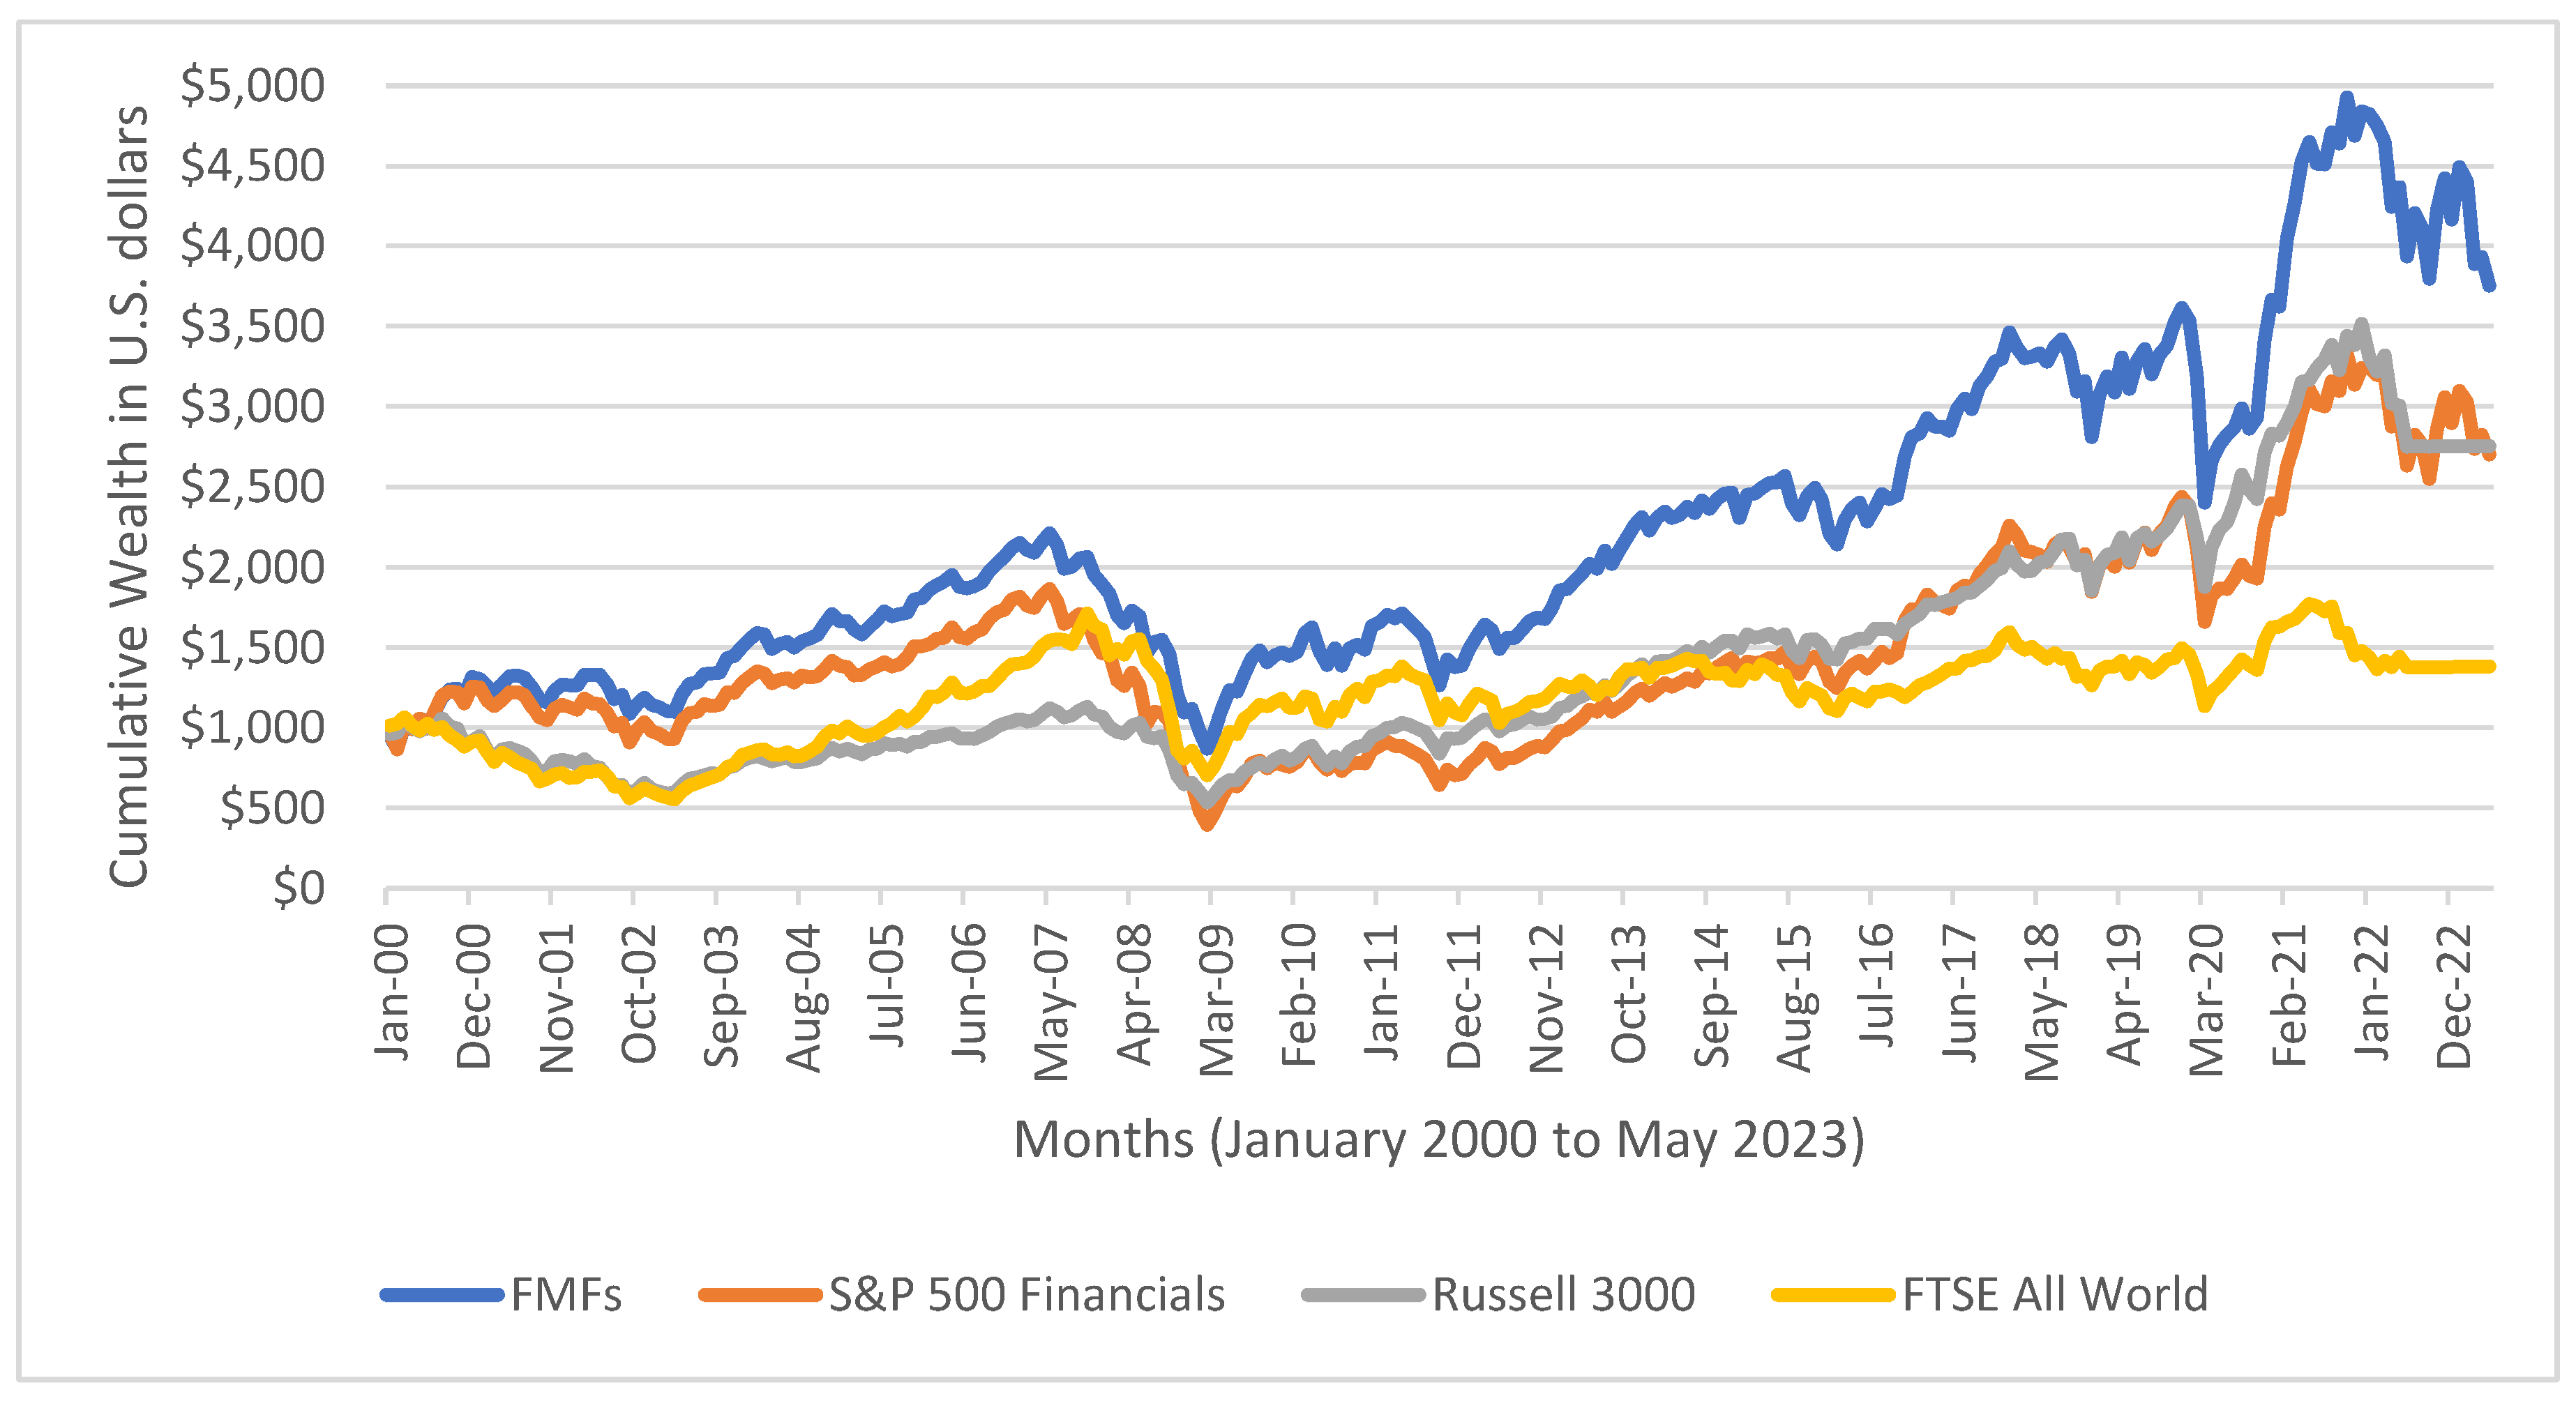
Figure 1 plots the cumulative wealth index for FMFs versus the S&P 500 Financial, Russell 3000 and FTSE All World ex US indices, showing the growth of USD 1000 invested in each index in January 2000. Over the past 23 years, FMFs, on average, have increased significantly more in value than the benchmarks, with a cumulative return over three times that of the global equities, and over 1.5 times that of the U.S. equities. Cumulative returns and cumulative wealth, based on monthly returns, generated by FMFs is also almost 3 times more than that by the S&P 500 Financial Index.
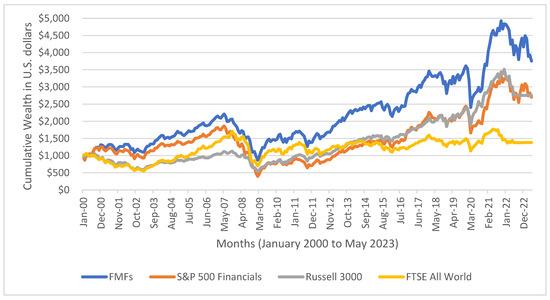
Figure 1.
Cumulative wealth effect based on monthly returns of financial mutual funds, S&P 500 Financials index, Russell 3000 index, and FTSE All World Ex. U.S. index. Analysis is based on monthly returns from January 2000 to May 2023.
Table 2 displays a summary of statistics for the sample, which includes mean monthly returns and standard deviation of monthly returns for FMFs, S&P 500 Financial, Russell 3000, and FTSE All World ex US indexes.
Table 2.
Summary statistics of monthly rates of returns for financial mutual funds, S&P 500 financial index, Russell 3000 index, and FTSE All World Ex. U.S. index for the period 2000 to 2023.
During the sample period from January 2000 to May 2023, FMFs exhibited higher volatility compared to the U.S. and international equity benchmarks. The standard deviations of the FMF returns were also higher than those of the benchmarks. Among the four-return series, the Russell 3000 had the least volatility, with the minimum monthly standard deviation observed over the same sample period.
When examining average monthly returns across different market conditions, we found that FMFs had a lower volatility of monthly returns during the periods of January 2000 to July 2007, compared only to S&P 500 Financial Index (U.S. Stocks); higher volatility of monthly returns than all other indexes during the period February 2020 to January 2021 (COVID-19-induced lockdowns and pre-vaccination period); and higher volatility of monthly returns than U.S. equities and global equities as proxied by Russell 3000 Index and FTSE All World Index, respectively, during the period February 2021 to May 2023 (Post COVID-19 vaccinations).
Furthermore, Table 2 indicates that, on average, FMFs generated better monthly returns than U.S. and global equities from January 2000 to May 2023, as well as under various market scenarios. However, post-COVID-19, global equities have generated a better monthly return relative to FMFs.
Table 3 shows correlations among the returns of FMFs, U.S. and international stocks for the whole sample, and three sub-periods. As expected, FMFs are highly correlated with the S&P 500 Financials Index. Also, U.S. and international equities show a high degree of correlation, at 0.86 for the whole sample. By comparison, average monthly returns of FMFs show a correlation of 0.84 and 0.74 with U.S. and international stocks, respectively. FMFs showed even less correlation with the global equities during the pre-crisis period, 2000–2007. In contrast, the pandemic period shows how asset correlations converge dramatically towards 1 during times of high uncertainty and volatility, with correlations all above 0.90.
Table 3.
Correlation using correlation test for financial mutual funds, S&P 500 financial index, U.S. equity markets, and global equity markets from January 2000–May 2023.
5. Empirical Results
Thus far, univariate results suggest that financial mutual funds exhibit raw performance that is higher and more variable than broad equity indices, with some degree of positive correlation to those indices. A deeper look at FMF performance is warranted. Next, we look at risk-adjusted performance. Table 4 presents Sharpe, Sortino, and Omega ratios for the full sample and also subsample periods. For the full sample, FMFs exhibit a strong risk-adjusted performance compared to benchmarks, with higher Sharpe, Sortino, and Omega ratios than the S&P 500 Financial sector, U.S. equities, and global equities. Looking closer at these individual measures, FMF’s Sharpe ratio of 0.09 indicates nine basis points of excess return for every one hundred basis points of standard deviation of excess returns. The Sortino ratio of 0.13 shows a higher ratio of risk relative to downside returns than benchmarks. Along similar lines, the FMF’s Omega ratio of 1.28 for the full sample shows that the probability-weighted difference between positive and negative moves is greatest for FMFs compared to the benchmarks. In terms of risk-adjusted performance, the FMFs outperformed all benchmark indices based on monthly returns from January 2000 to May 2023. When we study the performance of FMFs over different market conditions, we find that the FMFs outperformed all benchmark indices in terms of Sharpe ratio, Sortino ratio, and Omega ratio based on average monthly returns from January 2000 to July 2007. However, when evaluating the risk-adjusted performance of FMFs based on average monthly returns from August 2007 to May 2023, we find that the FMFs delivered a superior Sharpe ratio, Sortino ratio, and Omega ratio relative to that of the S&P 500 Financial Index and the FTSE All World Ex. U.S. Index. The Sharpe ratio, Sortino ratio, and Omega ratio for U.S. equities, as proxied by the Russell 3000 index, was higher relative to that of FMFs during the same period.
Table 4.
Risk-adjusted performance (Sharpe, Sortino, and Omega ratios) for financial mutual funds, S&P 500 financial index, Russell 3000, and FTSE All World Ex. U.S. indexes during the period January 2000 to May 2023.
The financial crisis period of 2007 to 2009 witnessed a meltdown of stock markets around the globe, with negative risk-adjusted returns across all markets. FMFs produced a Sharpe ratio, Sortino ratio, and Omega ratio of −0.13, −0.18, and 0.71, respectively. Although the FMFs delivered a poor risk-adjusted performance during the financial crisis period, it was still better than the performance of the S&P 500 Financial Index and Russell 3000 Index over the same time period.
During the COVID-19-induced lockdowns and before the rollout of a vaccine, the risk-adjusted performance of the FMFs in terms of Sharpe ratio, Sortino ratio, and Omega ratio was significantly below the performance of the benchmark indices of S&P 500 Financial Index, U.S. equities, and global equities as proxied by the Russell 3000 Index and FTSE All World Ex. U.S. Index, respectively. U.S. equities generated a Sharpe ratio, Sortino ratio, and Omega ratio of 0.21, 0.34, and 1.69, respectively. The FTSE All World Ex. U.S. delivered 0.16, 0.23, and 1.50 in terms of Sharpe, Sortino, and Omega ratios. In contrast, the FMFs produced a Sharpe, Sortino, and Omega ratios of 0.07, 0.09, and 1.21. The S&P 500 Financial Index outperformed the FMFs as well as U.S. equities and global equities, with an Omega ratio of 1.85 during this period.
Post COVID-19 vaccinations, FMFs are outperforming U.S. and global equities in terms superior risk-adjusted returns, while U.S. equities and global equities are generating a negative risk-adjusted performance. The S&P 500 Financial Index outperformed the FMFs as well as the Russell 3000 Index and FTSE All World Ex. U.S. Index.
5.1. Multifactor Pricing Models
We further analyzed FMFs through the lens of multifactor asset pricing models to see whether their performance can be explained by empirical risk factors. Results are presented in Table 5 for the full sample and subsamples. Table 5 shows the seven-factor model results. Based on monthly returns from January 2000 to May 2023, the alpha is negative and significantly different from zero. A negative and statistically significant alpha indicates that the mutual fund’s performance has been worse than what would be expected given its level of risk and the performance of the benchmark index. When an alpha is statistically significant, it means that the difference between the fund’s performance and the benchmark’s performance is not likely due to random chance. There is a higher degree of confidence that the observed underperformance is a result of factors related to the fund’s strategy, management, or other relevant variables, rather than just random market fluctuations. Factor coefficients show that FMF returns are impacted by the market factor, the value factor, low versus high investment factor (CMA), and quality spread differential (QSD). The results in Table 5 show that a significant portion of the variation in fund returns can be explained by the seven-factor model. For financial mutual funds, the average adjusted R2 for the regressions is greater than 0.80 through various market conditions. As argued by Klement (2015), the observed high factor exposures to equity market-related factors may reflect other systematic factor exposures of these funds that reflect equity market developments.
Table 5.
Monthly net alphas from empirical asset pricing models for financial mutual funds based on seven-factor model. Analysis is based on monthly returns from January 2000 to May 2023.
Monthly returns of FMFs demonstrate statistically and economically significant exposure to the overall stock market, as evidenced by positive coefficients on the excess market returns. Despite attempts to reduce systematic variation with the stock market, these funds typically have stock market betas in the range of 0.94 to 1.10, indicating a significant correlation with the stock market. These funds are not immune to the ups and downs of the stock market. As highlighted by the high degree of correlation between the monthly returns of the FMFs with various benchmark indices, they still have significant exposure to the market. This is because these funds typically invest in a mix of assets, including stocks, bonds, and other securities. While this diversification can help to reduce risk, it also means that these funds cannot completely avoid the volatility of the stock market.
Table 6 provides a comparison of net monthly alphas generated by FMFs to that of the S&P 500 Financial Index, Russell 3000 Index, and FTSE All World Ex. U.S. Index.
Table 6.
Monthly net alphas for financial mutual funds, S&P 500 Financial Index, Russell 3000 index, and FTSE All World Ex. U.S. index for seven-factor model from January 2000 to May 2023.
Based on average monthly returns from January 2000 to May 2023, financial mutual funds significantly underperformed all benchmark indices, with a statistically significant alpha of −0.72, while the S&P 500 Financial Index, Russell 3000 Index, and FTSE All World Ex. U.S. Index generated alphas of 1.16, −0.06, and −0.42, respectively. Alphas produced by benchmark indices were not statistically significant. Table 6 shows that the alpha generated by FMFs is lower than the alphas generated by the Russell 3000 Index during the periods of January 2000 to July 2007, August 2007 to May 2023, August 2007 to August 2009, February 2020 to January 2021, and February 2021 to May 2023. In terms of alpha generation, FMFs have outperformed the FTSE All World Ex. U.S. Index based on monthly returns from August 2007 to May 2023 and February 2021 to May 2023.
5.2. Conditional Factor Models
The factor models above rely on the assumption that sensitivities to factors are constant across time. However, numerous studies have shown that factor loadings are time-varying (e.g., Adrian and Franzoni 2009; Ang and Kristensen 2012), so we also evaluate FMFs using conditional factor models. We follow Ferson and Schadt (1996) by adding conditioning information to the empirical pricing models in order to account for time-varying risk factors. As discussed above, conditioning instruments are the three-month Treasury bill rate, the spread between the thirty-year and three-month Treasury yields, the spread between Baa and Aaa-rated bond yields, and the dividend yield on the S&P 500.
Table 7 presents results for the conditional Fama–French three-factor model and the conditional Carhart four-factor model.
Table 7.
Monthly net alphas for financial mutual funds for conditional seven-factor model based on the monthly returns from January 2000 to May 2023.
The conditional seven-factor model seems to do a good job of explaining the cross-section of FMF returns. Those specifications have higher R-squared values and explain between 82% and 95% of the variation in FMF monthly returns. Model alphas vary in magnitude between −0.71 and −11.88 depending on the specification and sample/subsample period. All the alphas are statistically significant, although weakly. Overall, there is some evidence that financial mutual fund alphas differ significantly from zero. In other words, it appears that FMFs earn returns that are less than commensurate with their exposure to underlying risk factors.
5.3. Market Timing and Selectivity
We continue our evaluation of financial mutual funds by examining fund manager skill, an area which has received extensive study in existing literature. We employ two models that evaluate manager skill along the dimensions of market timing and selectivity. Treynor and Mazuy (1966) augment the traditional CAPM with a quadratic term, adding the squared market excess return. The authors contend that if managers have market forecasting ability, they will overweigh their market exposure when there are positive excess market returns and underweigh in down markets, leading to a convex relationship between their portfolio returns and the market return. Treynor and Mazuy’s model has been employed widely to evaluate fund manager security selection and market timing, including more recent work by Laipply et al. (2019), Chin and Gupta (2020), and Malhotra (2023), among others. Equation (6) presents the model:
A positive and significant coefficient on β2 would indicate market timing ability. As with other models, the intercept term would capture security selection ability not related to market risk.
We estimate these two models for our sample and present results in Table 8.
Table 8.
A summary of results from Treynor and Mazuy (1966) model, αs measures selectivity, whereas β2 measures market-timing. T-stats are in parentheses.
For the Treynor and Mazuy model, the coefficients on the quadratic market term are insignificant in the full sample and also the pre- and post-crisis subsamples. Similarly, the market timing indicator coefficient γ is not significantly different from zero in the full sample or subsamples. Taken together, these results do not show robust evidence that FMF managers exhibit positive or negative market timing ability. Furthermore, intercept terms are not significantly different from zero across all specifications, consistent with the hypothesis that managers do not possess exceptionally good (or bad) security selection abilities.
Like the analysis above, we also estimate conditional results for the Treynor and Mazuy model to control for any time variation in risk premia. We use the same conditioning instruments as before. Results are presented in Table 9 and are consistent with the unconditional models. Market timing coefficients for quadratic market return and the down-market indicator are all insignificant, as are model alphas, suggesting no significant market timing or selectivity among FMFs.
Table 9.
A summary of results from conditional Treynor and Mazuy (1966) model. For the Treynor and Mazuy (1966) models, αs measures selectivity whereas β2 measures market timing. T-stats are in parentheses.
5.4. Performance Persistence in Financial Mutual Funds
Grinblatt and Titman (1992), Brown et al. (1992), Hendricks et al. (1993), Brown and Goetzmann (1995), Goetzmann and Ibbotson (1994), Kahn and Rudd (1995), Malkiel (1995), Elton et al. (1996), and Carhart (1997) conducted studies on the persistence of conventional mutual fund total returns over time.
Grinblatt and Titman (1992) found that differences in performance between funds persist over time, and that this persistence is consistent with fund managers’ ability to earn abnormal returns. Hendricks et al. (1993) discovered that the relative performance of no-load growth funds persists in the near term, with the most significant evidence observed for a one-year horizon.
Goetzmann and Ibbotson (1994) found strong evidence that past mutual fund performance correlates with future mutual fund performance. Their data indicated that both winners and losers tend to repeat their performance, even when accounting for relative risk adjustments.
Kahn and Rudd (1995) examined performance persistence for fixed-income and equity mutual funds and concluded that performance persistence is evident only for fixed income funds. However, this persistence advantage fails to offset the average underperformance of fixed-income funds due to fees and expenses.
Elton et al. (1996) confirmed that the risk-adjusted performances of mutual funds continue to persist, where funds that performed well in the past tend to perform well in the future.
Brown et al. (1992) demonstrated that early studies exaggerated the extent of persistence by relying on survivorship-biased datasets. Our study controls for survivorship bias, so we do not expect to find the same level of persistence as earlier studies.
Carhart (1997) found that in his survivorship bias-free sample of U.S. equity funds, persistence diminishes after accounting for momentum in stock returns. However, recent studies argue that considering fund styles appropriately reveals persistence in U.S. equity funds (Ibbotson and Patel 2002; Wermers 2003).
We follow the approach of Kahn and Rudd (1995) to assess performance persistence in financial mutual funds. We regress Period t performance against Period t − 1 performance:
Performance (t) = α + β × Performance (t − 1) + ε
We measure performance in terms of annual returns of funds. Positive estimates of the coefficient β, along with significant t-statistics, indicate evidence of persistence, implying that Period t − 1 performance contains valuable information about Period t performance.
The results from Table 10 reveal that financial mutual funds did not exhibit any performance persistence in terms of gross yearly returns as well as returns to investors. In fact, the coefficient in Period 2’s performance is negative, but it is not statistically significant. This suggests that investors should not expect to earn higher returns by investing in mutual funds that have performed well in the past.
Table 10.
Results of Kahn and Rudd (1995) Performance Persistence Model. Results are based on annual returns from the year 2000 to 2022.
6. Summary and Conclusions
Financial Mutual Funds (FMFs) are gaining popularity in the world of mutual funds and investment management. This study delves into the intricacies of these funds and examines their risk-adjusted performance, market timing, and selectivity features. The research covers a considerable sample period, which is much longer compared to other existing studies in this field. The findings indicate that FMFs tend to be more volatile than the broad market equity indices, but they earn higher average returns. However, even though they generate positive risk-adjusted returns, multifactor models by Carhart (1997) and Fama and French (1993, 2015) do not suggest that FMFs have alphas that are statistically different from zero.
Moreover, the study also suggests that FMFs do not possess positive or negative market timing or security selection abilities, as measured by the models of Treynor and Mazuy (1966) and Henriksson and Merton (1981). In conclusion, the evidence supports the hypothesis that FMFs earn returns proportional to the risks associated with financial equities.
Future research in this area could provide a better understanding of not only FMFs, but also funds in other sectors. For instance, a detailed performance analysis of other sector funds, when compared to the results of this study, could shed light on important insights. The discovery of either market timing or security selection abilities within a particular sector would warrant further investigation to see if some sectors are more suited for portfolio manager differentiation through stock picking or market timing ability.
Author Contributions
All authors contributed equally to this paper. All authors have read and agreed to the published version of the manuscript.
Funding
This research received no external funding.
Informed Consent Statement
Not applicable.
Data Availability Statement
The data used is this study was obtained from Morningstar Direct and may be made available upon request from the authors, with the permission of Morningstar Direct.
Conflicts of Interest
The authors declare no conflict of interest.
Note
| 1 | https://www.ici.org/news-release/23-news-expense-trends (accessed on 1 September 2023). |
References
- Adrian, Tobias, and Francesco Franzoni. 2009. Learning about beta: Time-varying factor loadings, expected returns, and the conditional CAPM. Journal of Empirical Finance 16: 537–56. [Google Scholar] [CrossRef]
- Ang, Andrew, and Dennis Kristensen. 2012. Testing conditional factor models. Journal of Financial Economics 106: 132–56. [Google Scholar] [CrossRef]
- Berk, Jonathan B., and Jules H. van Binsbergen. 2015. Measuring skill in the mutual fund industry. Journal of Financial Economics 118: 1–20. [Google Scholar] [CrossRef]
- Berk, Jonathan B., and Jules H. van Binsbergen. 2016. Active managers are skilled: On average, they add more than $3 million per year. The Journal of Portfolio Management 42: 131–39. [Google Scholar] [CrossRef]
- Brown, Stephen J., and William N. Goetzmann. 1995. Performance Persistence. Journal of Finance 50: 679–98. [Google Scholar] [CrossRef]
- Brown, Stephen J., William Goetzmann, Roger G. Ibbotson, and Stephen A. Ross. 1992. Survivorship bias in performance studies. Review of Financial Studies 5: 553–80. [Google Scholar] [CrossRef]
- Carhart, Mark M. 1997. On persistence in mutual fund performance. Journal of finance 52: 57–82. [Google Scholar] [CrossRef]
- Chin, Andrew, and Piyush Gupta. 2020. Timing Is Not Everything—Assessing Manager Skill in Factor Timing. The Journal of Investment Management 18: 34–51. [Google Scholar]
- Dellva, Wilfred L., Andrea L. DeMaskey, and Colleen A. Smith. 2001. Selectivity and market timing performance of fidelity sector mutual funds. Financial Review 36: 39–54. [Google Scholar] [CrossRef]
- Elton, Edwin J., Martin J. Gruber, and Christopher R. Blake. 1996. The Persistence of risk-adjusted mutual fund performance. Journal of Business 69: 133–57. [Google Scholar] [CrossRef]
- Fama, Eugene F., and Kenneth R. French. 1993. Common Risk Factors in the Returns on Stocks and Bonds. Journal of Financial Economics 33: 3–56. [Google Scholar] [CrossRef]
- Fama, Eugene F., and Kenneth R. French. 2015. A five-factor asset pricing model. Journal of Financial Economics 116: 1–22. [Google Scholar] [CrossRef]
- Ferson, Wayne E., and Rudi W. Schadt. 1996. Measuring fund strategy and performance in changing economic conditions. The Journal of Finance 51: 425–61. [Google Scholar] [CrossRef]
- Goetzmann, William N., and Roger G. Ibbotson. 1994. Do Winners Repeat? The Journal of Portfolio Management 20: 9–18. [Google Scholar] [CrossRef]
- Grinblatt, Mark, and Sheridan Titman. 1992. The Persistence of Mutual Fund Performance. Journal of Finance 47: 1977–84. [Google Scholar] [CrossRef]
- Hendricks, Darryll, Jayendu Patel, and Richard Zeckhauser. 1993. Hot Hands in Mutual Funds: Short-run Persistence of Relative Performance, 1974–1988. Journal of Finance 48: 93–130. [Google Scholar]
- Henriksson, Roy D., and Robert C. Merton. 1981. On market timing and investment performance. II. Statistical procedures for evaluating forecasting skills. Journal of Business 54: 513–33. [Google Scholar] [CrossRef]
- Ibbotson, Roger G., and Amita K. Patel. 2002. Do Winners Repeat with Style? SSRN Electronic Journal. Available online: https://papers.ssrn.com/sol3/papers.cfm?abstract_id=292866 (accessed on 4 September 2023). [CrossRef]
- ICI. 2022. Investment Company Institute Factbook 2022. Washington, DC: Investment Company Institute. [Google Scholar]
- Kahn, Ronald N., and Andrew Rudd. 1995. Does Historical Performance Predict Future Performance? Financial Analysts Journal 61: 43–52. [Google Scholar] [CrossRef]
- Kaushik, Abhay, Anita Pennathur, and Scott Barnhart. 2010. Market timing and the determinants of performance of sector funds over the business cycle. Managerial Finance 36: 583–602. [Google Scholar] [CrossRef]
- Keating, Con, and William F. Shadwick. 2002. A universal performance measure. Journal of Performance Measurement 6: 59–84. [Google Scholar]
- Khorana, Ajay, and Edward Nelling. 1997. The performance, risk, and diversification of sector funds. Financial Analysts Journal 53: 62–74. [Google Scholar] [CrossRef]
- Klement, Joachim. 2015. The Cross-Section of Liquid Absolute Return Funds. The Journal of Index Investing 6: 21. [Google Scholar] [CrossRef]
- Laipply, Stephen, Ananth Madhavan, Aleksander Sobczyk, and Matthew Tucker. 2019. Sources of excess return and implications for active fixed-income portfolio construction. The Journal of Portfolio Management 46: 106–20. [Google Scholar] [CrossRef]
- Malhotra, Davinder K. 2023. Market Timing, Selectivity, and Performance of Technology Exchange-Traded Funds and Mutual Funds. The Journal of Beta Investment Strategies 14: 42–58. [Google Scholar] [CrossRef]
- Malkiel, Burton G. 1995. Returns from investing in equity mutual funds 1971 to 1991. Journal of Finance 50: 549–72. [Google Scholar] [CrossRef]
- Sharpe, William F. 1966. Mutual fund performance. Journal of Business 39: 119–38. [Google Scholar] [CrossRef]
- Sortino, Frank A., and Robert Van Der Meer. 1991. Downside risk. Journal of portfolio Management 17: 27. [Google Scholar] [CrossRef]
- Treynor, Jack, and Kay Mazuy. 1966. Can mutual funds outguess the market? Harvard Business Review 44: 131–36. [Google Scholar]
- Wermers, Russ. 2003. Is Money Really ‘Smart’? New Evidence on the Relation between Mutual Fund Flows, Manager Behavior, and Performance Persistence. SSRN Electronic Journal. [Google Scholar] [CrossRef]
Disclaimer/Publisher’s Note: The statements, opinions and data contained in all publications are solely those of the individual author(s) and contributor(s) and not of MDPI and/or the editor(s). MDPI and/or the editor(s) disclaim responsibility for any injury to people or property resulting from any ideas, methods, instructions or products referred to in the content. |
© 2023 by the authors. Licensee MDPI, Basel, Switzerland. This article is an open access article distributed under the terms and conditions of the Creative Commons Attribution (CC BY) license (https://creativecommons.org/licenses/by/4.0/).