Pre- and Post-COVID-19: The Impact of US, UK, and European Stock Markets on ASEAN-5 Stock Markets


Abstract
1. Introduction
2. Literature Review
3. Methodology
- From 2 January 2019, to 10 January 2020 (before COVID-19 was reported outside China);
- From 13 January 2020, to 31 July 2020 (during and after COVID-19 spread outside China).
- (no cointegration)
- (cointegrated)
- (no long-run impact)
- (long-run impact exists)
- (no short-run causality)
- (short-run causality exists)
4. Empirical Results
5. Conclusions
Author Contributions
Funding
Informed Consent Statement
Data Availability Statement
Conflicts of Interest
References
- Akhtaruzzaman, Md., Sabri Boubaker, and Ahmet Sensoy. 2021. Financial contagion during COVID-19 crisis. Finance Research Letters 38: 101604. [Google Scholar] [CrossRef] [PubMed]
- Akhtaruzzaman, Md., Sabri Boubaker, Duc Khuong Nguyen, and Molla Ramizur Rahman. 2022. Sytemic risk-sharing framework of cryptocurrencies in the COVID-19 crisis. Finance Research Letters 47: 102787. [Google Scholar] [CrossRef]
- Alubo, Ogoh, Sharon Ene Alubo, and Adah Sylvester Alubo. 2020. Corona virus containment and emerging challenges in Nigeria. Microbiology & Infectious Diseases 4: 1–8. [Google Scholar] [CrossRef]
- Arshanapalli, Bala, and John Doukas. 1993. International stock market linkages: Evidence from the pre- and post-October 1987 period. Journal of Banking and Finance 17: 193–208. [Google Scholar] [CrossRef]
- ASEAN. 2021. ASEAN Investment Report 2020–2021—Investing in Industry 4.0. Jakarta: ASEAN Secretariat. [Google Scholar]
- Ashton, John. 2020. COVID-19 and the ‘Spanish’ flu. Journal of the Royal Society of Medicine 113: 197–98. [Google Scholar] [CrossRef]
- Becker, Kent G., Joseph E. Finnerty, and Manoj Gupta. 1990. The intertemporal relation between the U.S. and Japanese stock markets. The Journal of Finance 45: 1297–306. [Google Scholar] [CrossRef]
- Bessler, David A., and Jian Yang. 2003. The structure of interdependence in international stock markets. Journal of International Money and Finance 22: 261–87. [Google Scholar] [CrossRef]
- Blahun, Ivan S., and Ivan I. Blahun. 2020. The relationship between world and local stock indices. Montenegrin Journal of Economics 16: 55–67. [Google Scholar] [CrossRef]
- Chan, Kam C., Benton E. Gup, and Ming-Shiun Pan. 1992. An empirical analysis of stock prices in major Asian markets and the United States. Financial Review 27: 289–307. [Google Scholar] [CrossRef]
- Chaudhary, Rashmi, Priti Bakhshi, and Hemendra Gupta. 2020. Volatility in international stock markets: An empirical study during COVID-19. Journal of Risk and Financial Management 13: 208. [Google Scholar] [CrossRef]
- Chen, Chun-Da, Chin-Chun Chen, Wan-Wei Tang, and Bor-Yi Huang. 2009. The positive and negative impacts of the SARS outbreak: A case of the Taiwan industries. The Journal of Developing Areas 43: 281–93. [Google Scholar] [CrossRef]
- Cho, Sungjun. 2014. What drives stochastic risk aversion? International Review of Financial Analysis 34: 44–63. [Google Scholar] [CrossRef]
- de Bruin, Yuri Bruinen, Anne-Sophie Lequarre, Josephine McCourt, Peter Clevestig, Filippo Pigazzani, Maryam Zare Jeddi, Claudio Colosio, and Margarida Goulart. 2020. Initial impacts of global risk mitigation measures taken during the combatting of the COVID-19 pandemic. Safety Science 128: 104773. [Google Scholar] [CrossRef]
- Dickey, David A., and Wayne A. Fuller. 1979. Distribution of the estimators for autoregressive time series with a unit root. Journal of the American Statistical Association 74: 427–31. [Google Scholar] [CrossRef]
- El Zowalaty, Mohamed E., and Josef D. Järhult. 2020. From SARS to COVID-19: A previously unknown SARS- related coronavirus (SARS-CoV-2) of pandemic potential infecting humans—Call for a One Health approach. One Health 9: 100124. [Google Scholar] [CrossRef]
- Engle, Robert F., and Clive W. J. Granger. 1987. Co-integration and error correction representation, estimation and testing. Econometrica 55: 251–76. [Google Scholar] [CrossRef]
- Eun, Cheol S., and Sangdal Shim. 1989. International Transmission of Stock Market Movements. The Journal of Financial and Quantitative Analysis 24: 241. [Google Scholar] [CrossRef]
- Goldstein, Morris, and Michael Mussa. 1993. The Integration of World Capital Markets. IMF Working Paper. Washington, DC: International Monetary Fund. [Google Scholar]
- Granger, Clive W. J., and Oskar Morgenstern. 1963. Spectral Analysis of New York Stock Market Prices. Kyklos 16: 1–27. [Google Scholar] [CrossRef]
- Grubel, Herbert G. 1968. International diversified portfolio: Welfare gains and capital flows. American Economic Review 58: 1299–314. [Google Scholar]
- Hamao, Yasushi, Ronald W. Masulis, and Victor Ng. 1990. Correlations in Price Changes and Volatility across International Stock Markets. Review of Financial Studies 3: 281–307. [Google Scholar] [CrossRef]
- Hassan, M. Kabir, and Atsuyuki Naka. 1996. Short-run and long-run dynamic linkages among international stock markets. International Review of Economics & Finance 5: 387–405. [Google Scholar] [CrossRef]
- Huyghebaert, Nancy, and Lihong Wang. 2010. The co-movement of stock markets in East Asia. Did the 1997–98 Asian financial crisis really strengthen stock market integration? China Economic Review 21: 98–112. [Google Scholar] [CrossRef]
- Jang, Hoyoon, and Wonsik Sul. 2002. The Asian financial crisis and the co-movement of Asian stock markets. Journal of Asian Economics 13: 94–104. [Google Scholar] [CrossRef]
- Johansen, Søren. 1988. Statistical analysis of cointegration vectors. Journal of Economic Dynamics and Control 12: 231–54. [Google Scholar] [CrossRef]
- Johansen, Søren. 1991. Estimation and hypothesis testing of cointegration vectors in Gaussian vector autoregressive models. Econometrica 59: 1551–80. [Google Scholar] [CrossRef]
- Johansen, Søren, and Katarina Juselius. 1990. Maximum likelihood estimation and inference on cointegration—With applications to the demand for money. Oxford Bulletin of Economics and Statistics 52: 169–210. [Google Scholar] [CrossRef]
- Junior, Leonidas Sandoval, and Italo De Paula Franca. 2012. Correlation of financial markets in times of crisis. Physica A: Statistical Mechanics and Its Applications 391: 187–208. [Google Scholar] [CrossRef]
- Kamaludin, Kamilah, Sheela Sundarasen, and Izani Ibrahim. 2021. Covid-19, Dow Jones and equity market movement in ASEAN-5 countries: Evidence from wavelet analyses. Heliyon 7: e05851. [Google Scholar] [CrossRef]
- King, Mervyn A., and Sushil Wadhwani. 1990. Transmission of Volatility between Stock Markets. Review of Financial Studies 3: 5–33. [Google Scholar] [CrossRef]
- King, Michael R. 2001. Who triggered the Asian financial crisis? Review of International Political Economy 8: 438–66. [Google Scholar] [CrossRef]
- Lin, Wen-Ling, Robert F. Engle, and Takatoshi Ito. 1994. Do bulls and bears move across borders? International transmission of stock returns and volatility. The Review of Financial Studies 7: 507–38. [Google Scholar] [CrossRef]
- Liu, Haiyue, Aqsa Manzoor, Cangyu Wang, Lei Zhang, and Zaira Manzoor. 2020. The COVID-19 outbreak and affected countries stock markets response. International Journal of Environmental Research and Public Health 17: 2800. [Google Scholar] [CrossRef] [PubMed]
- Lo, Andrew W., and A. Craig MacKinlay. 1990. When are contrarian profits due to the stock market overreaction? The Review of Financial Studies 3: 175–205. [Google Scholar] [CrossRef]
- Luis, Gil-Alana, and Claudio-Quiroga Gloria. 2020. The COVID-19 Impact on the Asian Stock Markets. Asian Economics Letters 1: 1–4. [Google Scholar] [CrossRef]
- Malliaris, Anastasios G., and Jorge L. Urrutia. 1992. The International Crash of October 1987: Causality Tests. The Journal of Financial and Quantitative Analysis 27: 353–4. [Google Scholar] [CrossRef]
- McQueen, Grant, Michael Pinegar, and Steven Thorley. 1996. Delayed reaction to good news and the cross-autocorelation of portfolio returns. The Journal of Finance 51: 889–919. [Google Scholar] [CrossRef]
- Mech, Timothy S. 1993. Portfolio return autocorrelation. Journal of Financial Economics 34: 307–44. [Google Scholar] [CrossRef]
- Menon, N. Rajiv, M. V. Subha, and S. Sagaran. 2009. Cointegration of Indian stock markets with other leading stock markets. Studies in Economics and Finance 26: 87–94. [Google Scholar] [CrossRef]
- Nkoro, Emeka, and Aham Kelvin Uko. 2016. Autoregressive Distributed Lag ( ARDL ) cointegration technique: Application and interpretation. Journal of Statistical and Econometric Methods 5: 63–91. [Google Scholar]
- Nobi, Ashadun, Sungmin Lee, Doo Hwan Kim, and Jae Woo Lee. 2014. Correlation and network topologies in global and local stock indices. Physics Letters A 378: 2482–89. [Google Scholar] [CrossRef]
- Ozturk, Ilhan, and Ali Acaravci. 2010. The causal relationship between energy consumption and GDP in Albania, Bulgaria, Hungary, and Romania: Evidence from ARDL bound testing approach. Applied Energy 87: 1938–43. [Google Scholar] [CrossRef]
- Pesaran, M. Hashem, Yongcheol Shin, and Richard J. Smith. 2001. Bounds testing approaches to the analysis of level relationships. Journal of Applied Econometrics 16: 289–326. [Google Scholar] [CrossRef]
- Phillips, Peter C. B., and Pierre Perron. 1988. Testing for a unit root in time series regression. Biometrika 75: 335–46. [Google Scholar] [CrossRef]
- Rahman, Aisyah Abdul, and Noor Zahirah Mohd Sidek. 2011. Spill-over Effect of US Sub-Prime Crisis on ASEAN-5 Stock Markets. Business and Social Science Research Conference 7: 207–17. [Google Scholar]
- Rijanto, Arief. 2017. Lead-lag relationship: Did the financial crisis affect the interdependence of ASEAN-5 and the global stock market? International Journal of Economics and Management 11: 393–407. [Google Scholar]
- Ripley, Duncan M. 1973. Systematic Elements in the Linkage of National Stock Market Indices. The Review of Economics and Statistics 55: 356–61. [Google Scholar] [CrossRef]
- Rouatbi, Wael, Ender Demir, Renatas Kizys, and Adam Zaremba. 2021. Immunizing markets against the pandemic: COVID-19 vaccinations and stock volatility around the world. International Review of Financial Analysis 77: 101819. [Google Scholar] [CrossRef]
- Samarakoon, Lalith P. 2011. Stock market interdependence, contagion, and the U.S. financial crisis: The case of emerging and frontier markets. Journal of International Financial Markets, Institutions and Money 21: 724–42. [Google Scholar] [CrossRef]
- Sari, Ramazan, Bradley T. Ewing, and Ugur Soytas. 2008. The relationship between disaggregate energy consumption and industrial production in the United States. An ARDL approach. Energy Economics 30: 2302–13. [Google Scholar] [CrossRef]
- Schöllhammer, Hans, and Ole Sand. 1985. The interdependence among the stock markets of major European countries and the United States: An empirical investigation of interrelationships among national stock price movements. Management International Review 25: 17–26. [Google Scholar]
- Sheng, Hsiao-Ching, and Anthony H. Tu. 2000. A study of cointegration and variance decomposition among national equity indices before and during the period of the Asian financial crisis. Journal of Multinational Financial Management 10: 345–65. [Google Scholar] [CrossRef]
- Siu, Alan, and Y. C. Richard Wong. 2004. Economic impact of SARS: The case of Hong Kong. Asian Economic Papers 3: 62–83. [Google Scholar] [CrossRef]
- Solnik, B. H. 1974. Testing international pricing of risk: An empirical investigation of the world capital market structure. The Journal of Finance 29: 365–78. [Google Scholar] [CrossRef]
- Solnik, Bruno. 1983. International arbitrage pricing theory. The Journal of Finance 38: 449–57. [Google Scholar] [CrossRef]
- Stulz, René M. 1981. A model of international asset pricing. Journal of Financial Economics 9: 383–406. [Google Scholar] [CrossRef]
- Wang, Yudong, Chongfeng Wu, and Li Yang. 2013. Oil price shocks and stock market activities: Evidence from oil-importing and oil-exporting countries. Journal of Comparative Economics 41: 1220–39. [Google Scholar] [CrossRef]
- Wong, Wing-Keung, Jack Penm, Richard Deane Terrell, and Karen Yann Ching. 2004. The relationship between stock markets of major developed countries and Asian emerging markets. Journal of Applied Mathematics and Decision Sciences 8: 201–18. [Google Scholar] [CrossRef]
- World Health Organization. 2003. Summary of Probable SARS Cases with Onset of Illness from 1 November 2002 to 31 July 2003. Available online: https://www.who.int/publications/m/item/summary-of-probable-sars-cases-with-onset-of-illness-from-1-november-2002-to-31-july-2003 (accessed on 23 January 2021).
- World Health Organization. 2020. WHO Timeline—COVID-19. Available online: https://www.who.int/news/item/27-04-2020-who-timeline---covid-19 (accessed on 23 January 2021).
- Worldmeter. 2022. COVID Life: Coronavirus Statistics. Available online: https://www.worldometers.info/coronavirus/ (accessed on 13 June 2022).
- Yang, Jian, James W. Kolari, and Insik Min. 2003. Stock market integration and financial crises: The case of Asia. Applied Financial Economics 13: 477–86. [Google Scholar] [CrossRef]
- Yildirim, Ecenur Uğurlu. 2020. The impact of COVID-19 pandemic on the financial contagion among Turkey, US, and China stock markets. Journal of Business Research-Turk 12: 2764–73. [Google Scholar] [CrossRef]
- Zhang, Dayong, Min Hu, and Qiang Ji. 2020. Financial markets under the global pandemic of COVID-19. Finance Research Letters 36: 101528. [Google Scholar] [CrossRef]
- Zhao, Wenwu, Junze Zhang, Michael E. Meadows, Yanxu Liu, Ting Hua, and Bojie Fu. 2020. A systematic approach is needed to contain COVID-19 globally. Science Bulletin 65: 876–78. [Google Scholar] [CrossRef]


| Country | Stock Market | 2020 Highest | 2020 Lowest | +/− | +/− in % |
|---|---|---|---|---|---|
| US | DJIA | 29,568.57 | 18,213.65 | (11,354.92) | (38.4%) |
| UK | FTSE100 | 7689.67 | 4898.79 | (2790.88) | (36.29%) |
| Germany | DAX | 13789 | 8255.65 | (5533.35) | (40.13%) |
| France | CAC | 6111.41 | 3632.06 | (2479.35) | (40.57%) |
| Italy | MIB | 2493.7 | 1359 | (1134.7) | (45.5%) |
| Spain | IBEX | 10,100.20 | 5814.50 | (4285.7) | (42.43%) |
| Malaysia | KLCI | 1612.62 | 1207.80 | (404.82) | (25.1%) |
| Singapore | SGX | 378.72 | 250.26 | (128.46) | (33.92%) |
| Thailand | SETI | 1604.28 | 1022.83 | (581.45) | (36.24%) |
| Indonesia | JKSE | 6325.41 | 3911.72 | (2413.69) | (38.16%) |
| Philippines | PESi | 7890.94 | 4039.15 | (3851.79) | (48.81%) |
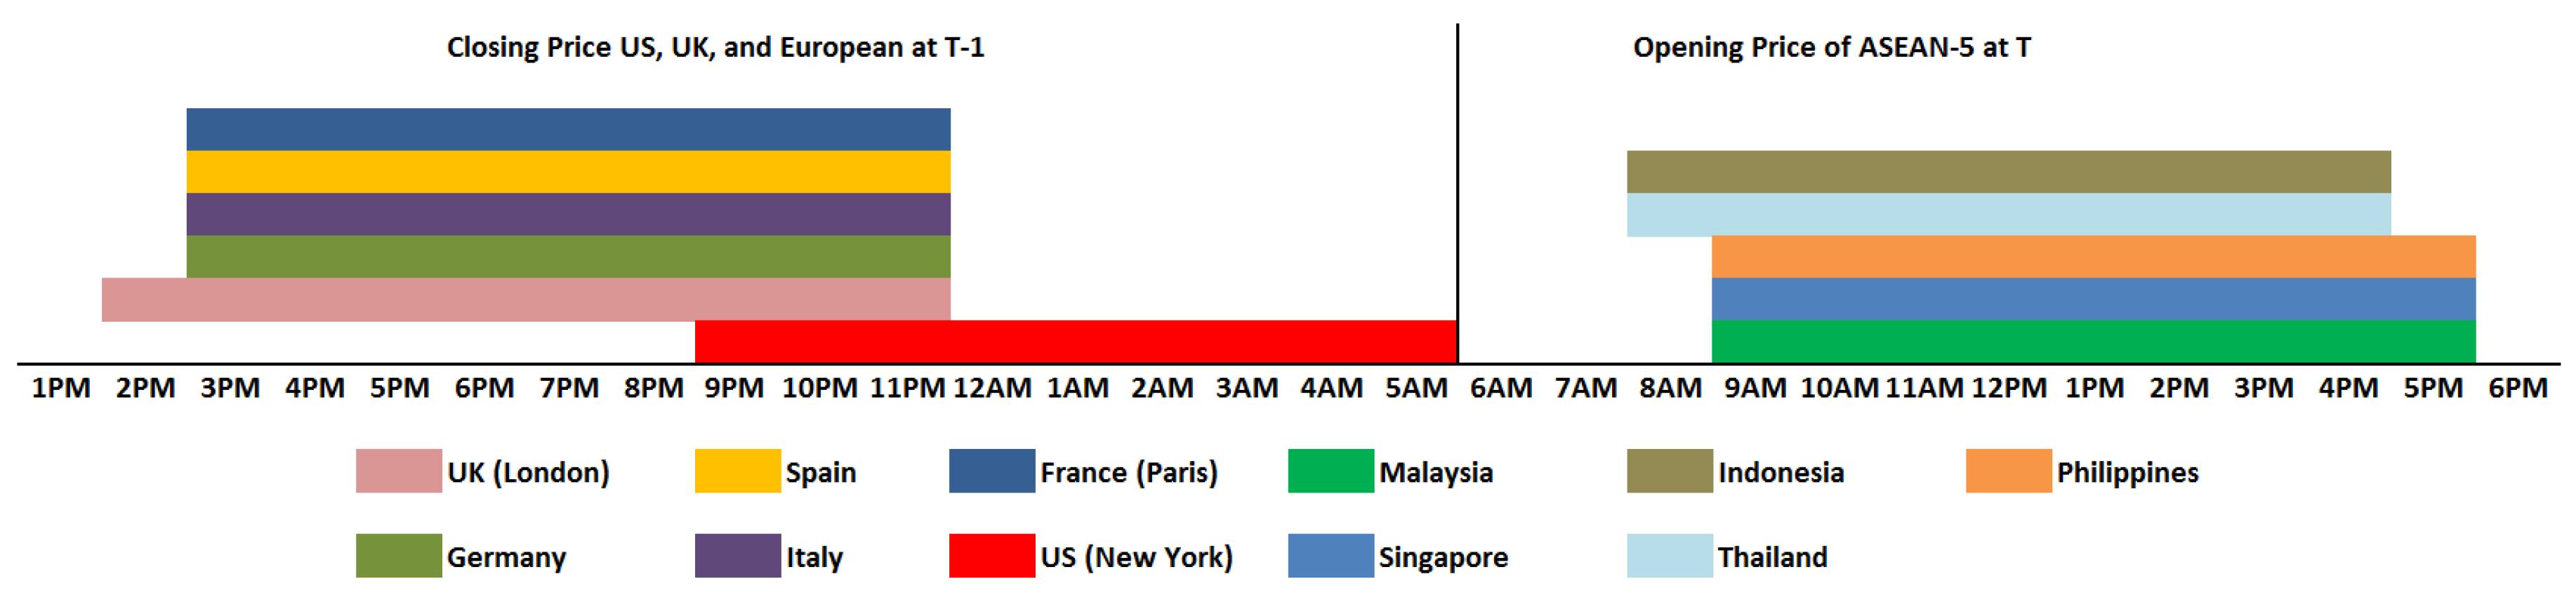
| Stock Market | Universal Time Coordinated | Local Time | Malaysia Time |
|---|---|---|---|
| KLCI | UTC+8 | 0900–1700 | 0900–1700 |
| SGX | UTC+8 | 0900–1716 | 0900–1716 |
| SETI | UTC+7 | 1000–1630 | 0900–1630 |
| JKSE | UTC+7 | 0900–1530 | 0800–1530 |
| PSEi | UTC+8 | 0930–1530 | 0930–1530 |
| DJIA | UTC-4 | 0930–1630 | 2130–0430 |
| FTSE100 | UTC+1 | 0800–1700 | 1500–0000 |
| DAX | UTC+2 | 0900–1730 | 1500–2330 |
| CAC | UTC+2 | 0900–1730 | 1500–2330 |
| MIB | UTC+2 | 0800–1742 | 1500–2342 |
| IBEX | UTC+2 | 0900–1735 | 1500–2335 |
| Variable | COVID-19 | Mean | SD | Skewness | Kurtosis | JB | Obs |
|---|---|---|---|---|---|---|---|
| LKLCI.O | Before | 7.396 | 0.027 | 0.153 | 1.891 | 14.517 *** | 263 |
| During | 7.361 | 0.067 | −1.430 | 4.904 | 198.602 *** | 404 | |
| LSGX.O | Before | 5.902 | 0.026 | −0.015 | 2.696 | 1.025 | 263 |
| During | 5.850 | 0.095 | −1.127 | 2.832 | 85.955 *** | 404 | |
| LSETI.O | Before | 7.402 | 0.027 | 0.354 | 2.846 | 5.763 * | 263 |
| During | 7.331 | 0.118 | −1.411 | 4.331 | 163.960 *** | 404 | |
| LJKSE.O | Before | 8.748 | 0.024 | −0.436 | 2.670 | 9.514 *** | 263 |
| During | 8.672 | 0.126 | −1.213 | 3.047 | 99.100 *** | 404 | |
| LPSEi.O | Before | 8.975 | 0.019 | 0.020 | 3.258 | 0.746 | 263 |
| During | 8.891 | 0.137 | −1.309 | 3.380 | 117.780 *** | 404 | |
| LDJIA | Before | 10.182 | 0.043 | −0.350 | 3.458 | 7.660 ** | 263 |
| During | 10.170 | 0.072 | −1.257 | 6.080 | 266.103 *** | 404 | |
| LFTSE100 | Before | 8.893 | 0.027 | −0.570 | 3.447 | 16.428 *** | 263 |
| During | 8.842 | 0.097 | −1.259 | 3.503 | 111.043 *** | 404 | |
| LDAX | Before | 9.404 | 0.058 | −0.088 | 2.370 | 4.693 * | 263 |
| During | 9.392 | 0.088 | −1.083 | 4.669 | 125.853 *** | 404 | |
| LCAC | Before | 8.606 | 0.058 | −0.504 | 3.118 | 11.291 *** | 263 |
| During | 8.572 | 0.100 | −0.828 | 3.289 | 47.601 *** | 404 | |
| LMIB | Before | 7.643 | 0.061 | 0.086 | 2.400 | 4.266 | 263 |
| During | 7.612 | 0.108 | −0.684 | 3.321 | 33.282 *** | 404 | |
| LIBEX | Before | 9.126 | 0.027 | −0.484 | 3.091 | 10.338 *** | 263 |
| During | 9.062 | 0.124 | −1.1620 | 2.865 | 91.210 *** | 404 |
| Variable | COVID-19 | ADF | PP | ||
|---|---|---|---|---|---|
| Level | First Difference | Level | First Difference | ||
| LKLCI.O | Before | 1.724 (0.418) | −17.147 (0.000) | −1.730 (0.415) | −17.119 (0.000) |
| During | −1.821 (0.370) | −11.411 (0.000) | −1.794 (0.383) | −19.567 (0.000) | |
| LSGX.O | Before | −2.736 (0.069) | −2.951 (0.041) | ||
| During | −1.084 (0.723) | −11.994 (0.000) | −1.056 (0.734) | −19.758 (0.000) | |
| LSETI.O | Before | −1.974 (0.298) | −15.646 (0.000) | −2.014 (0.281) | −15.638 (0.000) |
| During | −0.854 (0.802) | −10.198 (0.000) | −1.128 (0.706) | −21.110 (0.000) | |
| LJKSE.O | Before | −2.465 (0.125) | −15.992 (0.000) | −2.423 (0.136) | −15.997 (0.000) |
| During | −0.882 (0.793) | −18.546 (0.000) | −1.061 (0.732) | −18.861 (0.000) | |
| LPSEi.O | Before | −3.463 (0.010) | −4.178 (0.001) | ||
| During | −0.850 (0.803) | −20.667 (0.000) | 0.991 (0.758) | −20.709 (0.000) | |
| LDJIA | Before | −2.185 (0.212) | −18.476 (0.000) | −2.132 (0.232) | −18.406 (0.000) |
| During | −2.629 (0.088) | −2.769 (0.064) | |||
| LFTSE100 | Before | −3.441 (0.011) | −3.069 (0.030) | ||
| During | −1.077 (0.726) | −20.463 (0.000) | −1.184 (0.683) | −20.476 (0.000) | |
| LDAX | Before | −1.712 (0.424) | −12.409 (0.000) | −1.685 (0.438) | −16.152 (0.000) |
| During | −2.316 (0.168) | −12.588 (0.000) | −2.495 (0.118) | −20.012 (0.000) | |
| LCAC | Before | −2.052 (0.265) | −12.194 (0.000) | −2.046 (0.267) | −15.782 (0.000) |
| During | −1.885 (0.339) | −12.396 (0.000) | −1.985 (0.293) | −20.243 (0.000) | |
| LMIB | Before | −1.855 (0.353) | −12.555 (0.000) | −1.845 (0.358) | −15.905 (0.000) |
| During | −1.942 (0.313) | −9.104 (0.000) | −2.206 (0.205) | −22.008 (0.000) | |
| LIBEX | Before | −2.432 (0.134) | −12.559 (0.000) | −2.951 (0.041) | |
| During | −0.956 (0.770) | −11.813 (0.000) | −1.046 (0.738) | −21.678 (0.000) | |
| Dependent Variable | JB | RESET | |||
|---|---|---|---|---|---|
| LKLCI.O | Before | 3.049 | 3.825 | 15.26 | 1.475973 |
| During | 253.972 *** | 0.461 | 103.843 *** | 0.202401 | |
| LSGX.O | Before | 0.065 | 4.96 * | 11.434 | 0.002576 |
| During | 134.657 *** | 37.25 *** | 106.312 *** | 2.625971 | |
| LSETI.O | Before | 4.942 * | 0.272 | 10.41 | 0.874972 |
| During | 2536.082 *** | 16.976 *** | 149.669 *** | 0.073793 | |
| LJKSE.O | Before | 47.840 *** | 0.918 | 29.733 *** | 3.33086 |
| During | 518.351 *** | 14.323 *** | 177.874 *** | 1.152137 | |
| LPSEi.O | Before | 36.112 *** | 9.026 ** | 6.825 | 0.32121 |
| During | 6297.049 *** | 14.489 *** | 104.472 *** | 0.072624 |
| Dependent Variable | COVID-19 | F-Stat | Critical Value (5%) | |
|---|---|---|---|---|
| I(0) | I(1) | |||
| LKLCI.O | Before | 1.729 | 2.27 | 3.28 |
| During | 4.205 ** | |||
| LSGX.O | Before | 2.511 | 2.27 | 3.28 |
| During | 5.597 ** | |||
| LSETI.O | Before | 0.960 | 2.27 | 3.28 |
| During | 2.640 | |||
| LJKSE.O | Before | 2.903 | 2.27 | 3.28 |
| During | 3.651 ** | |||
| LPSEi.O | Before | 3.845 ** | 2.27 | 3.28 |
| During | 4.879 ** | |||
| Dependent Variable | |||||
|---|---|---|---|---|---|
| LKLCI.O | LSGX.O | LJKSE.O | LPSEi.O* | LPSEi.O | |
| LDJIA | −1.931 | 0.106 | 0.399 | −0.419 | −1.256 |
| [−2.363] | [0.526] | [0.803] | [1.025] | [−2.507] | |
| (0.019) | (0.599) | (0.423) | (0.306) | (0.013) | |
| LFTSE100 | 1.488 | 0.685 | 1.095 | 0.838 | 1.768 |
| [2.981] | [4.024] | [2.576] | [3.287] | [4.429] | |
| (0.003) | (0.000) | (0.010) | (0.012) | (0.000) | |
| LDAX | 2.211 | −0.115 | 0.228 | 0.320 | 1.018 |
| [3.829] | [0.793) | [0.621] | [1.385] | [2.795] | |
| (0.000) | (0.428) | (0.535) | (0.167) | (0.005) | |
| LCAC | −1.953 | −0.182 | −0.576 | −1.068 | −0.659 |
| [−2.915] | [−0.763] | [−0.955] | [−3.135] | [0.290] | |
| (0.004) | (0.446) | (0.340) | (0.002) | (0.226) | |
| LMIB | 0.407 | 0.055 | −0.639 | 0.704 | −0.143 |
| [0.667] | [0.260] | [−1.100] | [−0.822] | [0.290] | |
| (0.505) | (0.795) | (0.272) | (0.025) | (0.772) | |
| LIBEX | 0.101 | 0.376 | 0.790 | −0.139 | 0.380 |
| [0.270] | [2.824] | [2.383] | [3.997] | [1.253] | |
| (0.787) | (0.005) | (0.018) | (0.000) | (0.211) | |
| Dependent Variable | COVID-19 | LDJIA | LFTSE100 | LDAX | LCAC | LMIB | LIBEX | ECT |
|---|---|---|---|---|---|---|---|---|
| LKLCI.O | Before | 1.614 (0.187) | 2.960 (0.0329) | 1.888 (0.154) | 1.238 (0.267) | 1.051 (0.306) | 3.276 (0.072) | - |
| During | 15.417 (0.000) | 9.369 (0.000) | 19.248 (0.000) | 6.748 (0.010) | 3.652 (0.027) | 4.344 (0.014) | −0.050 *** | |
| LSGX.O | Before | 15.223 (0.000) | 10.022 (0.002) | 3.024 (0.050) | 7.734 (0.006) | 8.647 (0.004) | 3.010 (0.084) | - |
| During | 18.554 (0.000) | 6.082 (0.001) | 6.212 (0.000) | 0.068 (0.795) | 3.116 (0.078) | 7.723 (0.000) | −0.133 *** | |
| LSETI.O | Before | 13.020 (0.000) | 0.884 (0.348) | 0.002 (0.964) | 3.024 (0.303) | 2.504 (0.060) | 0.250 (0.618) | - |
| During | 15.074 (0.000) | 13.613 (0.000) | 11.621 (0.000) | 1.547 (0.214) | 6.336 (0.000) | 2.044 (0.107) | - | |
| LJKSE.O | Before | 6.712 (0.000) | 0.287 (0.593) | 3.824 (0.011) | 2.751 (0.043) | 0.887 (0.347) | 6.482 (0.012) | - |
| During | 7.426 (0.000) | 8.686 (0.000) | 1.780 (0.170) | 3.173 (0.024) | 1.687 (0.186) | 3.287 (0.021) | −0.078 *** | |
| LPESi.O | Before | 1.211 (0.272) | 9.374 (0.002) | 2.757 (0.065) | 7.295 (0.007) | 3.817 (0.011) | 0.650 (0.421) | −0.153 *** |
| During | 10.793 (0.000) | 8.187 (0.000) | 9.230 (0.000) | 1.407 (0.236) | 3.712 (0.025) | 1.453 (0.229) | −0.104 *** |
| Dependent Variable | COVID-19 | LDJIA | LFTSE100 | LDAX | LCAC | LMIB | LIBEX |
|---|---|---|---|---|---|---|---|
| LDJIA | Before | - | 1.754 | 0.687 | 6.434 ** | 0.056 | 0.058 |
| During | 16.682 | 11.044 | 20.936 ** | 32.509 *** | 13.180 | ||
| LFTSE100 | Before | 0.025 | - | 0.658 | 2.103 | 2.103 | 0.682 |
| During | 39.272 *** | 6.380 | 17.723 * | 19.398 * | 18.430 * | ||
| LDAX | Before | 0.146 | 1.320 | - | 0.784 | 0.155 | 0.093 |
| During | 38.799 *** | 27.672 *** | 23.775 ** | 14.568 | 20.598 ** | ||
| LCAC | Before | 0.028 | 0.861 | 0.283 | - | 0.044 | 0.001 |
| During | 53.819 *** | 20.536 ** | 7.183 | 18.229* | 19.612 * | ||
| LMIB | Before | 0.182 | 0.062 | 0.013 | 0.175 | - | 0.286 |
| During | 53.974 *** | 18.988 * | 10.716 | 20.088 ** | 17.280 * | ||
| LIBEX | Before | 0.000 | 1.141 | 0.013 | 0.197 | 0.026 | - |
| During | 44.345 *** | 19.477 * | 13.866 | 19.077 * | 16.106 |
Disclaimer/Publisher’s Note: The statements, opinions and data contained in all publications are solely those of the individual author(s) and contributor(s) and not of MDPI and/or the editor(s). MDPI and/or the editor(s) disclaim responsibility for any injury to people or property resulting from any ideas, methods, instructions or products referred to in the content. |
© 2023 by the authors. Licensee MDPI, Basel, Switzerland. This article is an open access article distributed under the terms and conditions of the Creative Commons Attribution (CC BY) license (https://creativecommons.org/licenses/by/4.0/).
Share and Cite
Jamil, I.; Kogid, M.; Lim, T.S.; Lily, J. Pre- and Post-COVID-19: The Impact of US, UK, and European Stock Markets on ASEAN-5 Stock Markets. Int. J. Financial Stud. 2023, 11, 54. https://doi.org/10.3390/ijfs11020054
Jamil I, Kogid M, Lim TS, Lily J. Pre- and Post-COVID-19: The Impact of US, UK, and European Stock Markets on ASEAN-5 Stock Markets. International Journal of Financial Studies. 2023; 11(2):54. https://doi.org/10.3390/ijfs11020054
Chicago/Turabian StyleJamil, Izaan, Mori Kogid, Thien Sang Lim, and Jaratin Lily. 2023. "Pre- and Post-COVID-19: The Impact of US, UK, and European Stock Markets on ASEAN-5 Stock Markets" International Journal of Financial Studies 11, no. 2: 54. https://doi.org/10.3390/ijfs11020054
APA StyleJamil, I., Kogid, M., Lim, T. S., & Lily, J. (2023). Pre- and Post-COVID-19: The Impact of US, UK, and European Stock Markets on ASEAN-5 Stock Markets. International Journal of Financial Studies, 11(2), 54. https://doi.org/10.3390/ijfs11020054