Article

Risk-Oriented Efficiency Assessment within the Level of Capitalization for Financial Institutions: Evidence from Turkish Securities Firms

Management Engineering Department, Istanbul Technical University, Besiktas, Istanbul 34367, Turkey
*
Author to whom correspondence should be addressed.
Int. J. Financial Stud. 2022, 10(4), 110; https://doi.org/10.3390/ijfs10040110
Submission received: 4 October 2022 / Revised: 20 November 2022 / Accepted: 22 November 2022 / Published: 29 November 2022

Abstract

:
Securities firms are the leading institutions that facilitate the flow of funds by performing key services both in primary and secondary markets. The assessment of the efficiency of these firms has become a contemporary major issue due to the increasingly intense competition, globalization, and innovation in capital markets. As part of the nature of the business environment for such firms, risk-taking behaviors play a key role in their efficiency. In addition, the level of capitalization has become a more critical tool to counterbalance risk and efficiency. Therefore, we aimed to assess the relationship between efficiency, risk, and the level of capitalization in a sample of Turkish securities by covering the detailed data of securities firms between 2004 Q1 and 2021 Q4. After employing a three-stage least-squares method in a panel-data framework, the empirical findings showed that there was a positive and significant relationship between the risk incentive and efficiency in the brokerage industry, which implied that firms can improve their efficiency through a more diversified portfolio. We further report that there was also a positive and significant relationship between securities firms’ risk incentives and capital that could be explained by the higher risky-asset ratio needed for larger amounts of capital to compensate for losses. These results have potentially important implications for the brokerage industry’s prudent supervision and underlined the importance of attaining long-term efficiency gains to support the development of capital markets.

1. Introduction

The basic elements of a functional capital market such as a low cost of transactions for its participants and the easy liquidation of investments are possible thanks to a well-functioning stock market. An exchange’s ability to perform this function is only possible through well-organized securities firms. For this reason, although their role is indirect, securities firms play an essential part in the effective functioning of the market. When considering that one of the conditions for efficiency of the market is to keep the transaction costs as low as possible, in the absence of transaction costs or when they cannot be completely reset, their importance in increasing the efficiency of the market during the redemption of the activities of securities firms is better understood. Because disruptions in the activities of brokerage firms not only cause such firms to encounter problems as a commercial enterprise, they also impose a cost on the market due to a loss in efficiency. For this reason, both the establishment and the operating principles of securities firms are subject to strict regulations in all countries.
In that regard, the performance and efficiency of securities firms are very important for capital markets in order to serve the desired objectives. Like all economic units, the purpose of securities firms is to perform well and to continue their activities effectively and efficiently. Efficiency is basically an indicator of success in achieving these goals. In general terms, efficiency can be defined as a performance dimension that shows the level of utilization of resources of an enterprise or the way it uses these resources (Dyson and Thanassoulis 1988). In portfolio management (in the brokerage industry), a priori approaches utilize pre-specified information on the preferences of the portfolio manager (broker) to find the most efficient portfolio (profitable trading) (Zopounidis et al. 2015). The efficiency is found by comparing the results obtained when using the resources in a certain time and in a certain way with the results targeted by the decision unit. In terms of securities firms, efficiency can be defined as operating closer to the best practices or the most effective production function. In other words, efficiency can be described as the maximum possible output that is achieved with a minimum combination of inputs. Performance and efficiency at the unit level have become major contemporary issues due to the increasingly intense competition, globalization, technological innovation, and increased deregulation in the financial sector. Therefore, it is important for regulators and market analysts to have sufficient relevant information that aids in the identification of actual or potential problems in the financial sector and individual institutions. If there is significant inefficiency in the sector, there may be room for structural changes, increased competition, and mergers and acquisitions to enhance the efficiency and productivity of the financial system and to accelerate a country’s financial development and economic growth.
As part of the nature of their business environment and competition, the risk-taking behaviors of securities firms play an important role in their efficiency (Hellmann et al. 2000). From a credit-risk-management standpoint, credit-granting decisions need to minimize the expected losses; however, these decisions involve the consideration of financial and non-financial attributes that describe the likelihood of default and the losses for each obligor (Zopounidis et al. 2015). Similarly, financial and non-financial parameters are also considered in the proposed methodology. In general, the balance sheets of securities firms are shorter-term, liquid, and equity-weighted compared to those of bank and insurance companies due to differences in their ways of doing business. The tendency of these firms to take risks is illustrated by using high leverage, exposing margin-trading concentration risks, increasing market and currency risks in market-making activities or proprietary trading (that is, in their positions), and of course engaging in large numbers of derivative transactions.
In the credit sector, to implement the Basel capital adequacy framework, credit institutions had to adapt their skills to the required measures, which were aimed at determining the amount of regulatory capital; for such a purpose, a significant role is played by the assessment of credit risk (Locurcio et al. 2021). Consistently, it is essential to detect the impact of the capitalization level; namely, the share capital, on securities firms’ risk and efficiency. The level of capitalization and new capital-adequacy requirements are becoming an increasingly critical tool to counterbalance risk and efficiency (Tan and Floros 2013). As for other financial institutions, securities firms are required to have a minimum level of capital (the share capital that must be deposited by shareholders before starting business operations) in order to provide assurance against market risks and uncertainties. However, as firms enhance their risk-taking behaviors, they may require additional capital. As in all sectors, these firms raise their capital levels to enhance and diversify their activities.
Moreover, during the last decade, structural reforms in the banking industry; e.g., the USA’s Volcker Rule, the UK’s ring-fencing of deposits, and the EU’s new banking reforms, were enacted to shield depositors’ assets from risky bank activities. These regulations limit the larger international banks’ capital market functions such as underwriting, hedging, and proprietary trading. This makes room for non-bank subsidiary securities firms in the markets, leading those firms to become more remarkable. Therefore, it would not be wrong to expect that interest in this sector will grow internationally in the near future.
There have been a number of studies that evaluated the efficiency of banks, but only a few studies have examined the performance and efficiency of securities firms. One of the main reasons for the lack of research in this industry is that unlike in other financial industries such as banking, regulators do not collect and make publicly available the type of information that is necessary to analyze the industry (Zhang et al. 2006).
Another reason is that in developed areas such as the USA, the UK, and Europe, commercial banking and brokerage transactions under the umbrella of large international banks has been allowed. For example, due to the abolition of the Glass–Steagall regulation in the USA, commercial banks, which have a more conservative and stable structure, have begun to carry out intermediation, investment banking, and other financial activities, so it has become difficult to access a dataset for the efficiency analysis of non-bank activities, and the studies are more focused on the general performance of such banks.
Unlike their counterparts in the West, banks in eastern countries such as Japan, Korea, China, Vietnam, and Thailand were prohibited from conducting brokerage transactions, so these transactions were carried out only by securities firms. For this reason, it was seen that the studies conducted, albeit in a small number, mostly examined the institutions in those countries.
As in many developing economies, in Turkey commercial banks dominate the financial system, and the securities industry is still an emerging industry. Nevertheless, the Turkish capital market has been developing over the last decades thanks to several institutional reforms, infrastructure and regulatory enablers, as well as economic development (Kartal 2013). The establishment of a modern securities market in Turkey dates back to the 1980s when a macroeconomic approach that aimed to liberalize the country’s economy was adopted (TCMA 2009). The capital market regulations were created by a new understanding, and the relevant institutions and instruments were formed accordingly. During this period, the number of securities firms increased dramatically until the 2000s. However, meeting the high demands for public sector borrowing by the financial markets until the beginning of the 2000s, frequent economic instabilities, high interest rates, and a low propensity to save have created pressure on the markets; this situation has prevented or postponed the development of capital markets.
The Turkish securities industry benefited from improved economic conditions and a decreased need for public borrowing in last 10 to 15 years. Other debt instruments had a chance to find a place in the capital market besides the public debt instruments, and a relative diversification has been achieved in terms of both issuers and investors in the capital market during this period. Nevertheless, the number of brokerage firms was reduced during this period. As the capital markets developed, the corporate structure of the securities firms improved, which resulted in consolidation in the sector and a reduction in the number of these firms. The liberalization of brokerage commissions in 2006 and falling fees also had effects in terms of the decreasing number of firms.
In the meantime, the sector has faced many structural changes at a time when the global economy was faced with numerous challenges. The new Capital Markets Law, which came into force in 2012, aimed to align the regulations in Turkey with those of the European Union and strengthen investor protection. Through a strategic alignment with Nasdaq, Borsa İstanbul enhanced its infrastructure with high standards.
Furthermore, policymakers have encouraged the consolidation by strengthening the regulations, particularly for the capital base. Transforming the securities firms to investment banks was one of the main drivers behind those regulations. As a matter of fact, following the previous 30-year-old law, the new Capital Markets Law and the secondary regulations increased the capital requirements and allowed new fields of activity for securities firms. Therefore, policymakers need to be more concerned with securities firms’ sector fragility by focusing on their risk, efficiency, and capital base.
The number of securities firms in Turkey has decreased to 70 in recent years from 150 in the beginning of 2000s. In addition to the market conditions, the regulation of capital requirements was the main driver behind the shrinking of the industry. It is essential to detect the impact of the capitalization level on securities firms’ risk and efficiency. Moreover, to the best of our knowledge, there has been no other study that addressed the relationship between securities firms’ capital base, efficiency, and risk.
In the light of the information above, this study contributes to the relevant literature by examining the securities industry in a dynamic setting in Turkey. Only securities firms can engage in main brokerage activities; i.e., equity or futures transactions, which makes those firms more remarkable in Turkey. The choice of Turkey, positioned as it is between the developed West and developing East, provided a unique institutional environment for exploring an industry (the securities industry) operating in an emerging economy at the periphery of Europe (Demirbag et al. 2016).
The aim of this paper was therefore to explore the performance and efficiency of securities firms under the given risk and capital levels because well-performing securities firms ensure a fundamental guarantee of the healthy growth of capital markets.
This paper introduces a number of important issues in the Turkish capital markets and current research. First of all, this paper is one of the few studies in the literature related to the performance and efficiency of securities firms. In addition, it employed a non-parametric efficiency model—data envelopment analysis (DEA)—by using both financial and non-financial indicators.
In addition, we contribute to the existing literature by introducing new risk and efficiency indicators for this sector. The risk-weighted assets ratio; namely, position risk, which was defined for the first time for securities firms, was calculated using a public dataset. Z-scores, which are widely used in financial distressed research, were also used as alternative risk indicators for the first time in the sector. All technical, pure technical, and scale efficiencies were estimated. In addition, all scores were calculated twice by introducing different inputs and outputs from financial tables and the operation dataset.
When considering the recent policy framework, our study was very timely. This paper presents the first application of an evaluation framework of Turkish securities firms’ efficiency as related to capital and risk levels. We employed three least-squares estimations to investigate the relationship between brokerage firms’ risk taking, capital, and efficiency.
This is the only study on the Turkish brokerage industry that covered a period of 18 years (2004 Q1–2021 Q4) by using quarterly data. The study dealt with more than 200 securities firms, that represented almost the entire population of such firms in the industry. To obtain more reliable results, the efficiency analyses were conducted while using both financial and non-financial approaches. Risk measurements also were made by adopting a new indicator to evaluate their positions in the market. A widely used bankruptcy risk measurement was also chosen as an alternative risk assessment to check the new risk indicator. As the capital base is one of the main drivers of maintaining such businesses (as well as a policy tool of capital adequacy for regulators), the aim of this paper was therefore to explore the performance and efficiency of securities firms under the given risk and capital levels because well-performing securities firms ensure a fundamental guarantee of the healthy growth of capital markets. While examining the triple relationship, observations were made regarding its correlation with the variables specific to both the institutional level (firm size, labor, etc.) and the sector (market concentration, market size, etc.).
The research framework was as follows. Following a brief review of the main literature in Section 2, we describe the methodology in Section 3. Section 4 reports the empirical findings and the analysis thereof. The paper concludes with Section 5 and offers some recommendations.

2. Literature Review

The proposed methodology first assessed the efficiencies of securities firms, then it analyzed the relationship between efficiency, risk, and the capitalization level. Parallel to the methodological content, the review of related research introduced in this section is bipartite. In the first of part of the review, we present the previous studies on performance and the efficiency analyses of the securities firms. As investment banks engage in similar activities, the early discussion on their performance was also checked. As stated in the Introduction, an analysis of the risks of such firms has not been developed in the literature because these firms operate as a division under the large banks of advanced financial markets and because the regulatory authorities do not sufficiently disclose the related data to the public.
In the second part, since the amount of the literature related to the relationship between securities firms’ capital base, efficiency, and risk-taking behaviors was very modest, we attempted to review the financial literature dedicated to investigating the impact of the level of capitalization and risk taking on banks’ efficiency.

2.1. Relevant Literature on Securities Firms’ Efficiency

Most of the past studies on the performance of securities firms attributed the superior performance of the securities firms to their sizes. Fukuyama and Weber (1999) examined the efficiency and productivity of Japanese securities firms during the period of 1988–1993 and found that the larger securities firms were more cost-efficient than the smaller securities firms. Similarly, Wang et al. (2003) assessed the pure technical, scale, and allocative efficiencies of securities firms in Taiwan and demonstrated that the firm size had a positive impact on the efficiency measures. Aktas and Kargin (2007) analyzed the efficiency and productivity of securities firms operating in Turkey during the period of 2000–2005. They determined no considerable changes in the efficiency and productivity of securities firms during the study period. Furthermore, they found that large and medium-sized firms were more productive. Lee et al. (2014) examined whether the firm size determined the economies of scale and scope of securities firms in Korea. The results showed that the firms broadly achieved economies of scale and substantially benefitted from the economies of scope in the Korean brokerage sector.
There were also few studies that investigated the influence of bank affiliation on the efficiency of securities firms. Chen et al. (2005) studied the impacts of government regulation and ownership on the performance of Chinese securities firms. They found that bank-affiliated firms had higher efficiency scores. Hu and Fang (2010) measured the efficiency scores of securities firms in Taiwan between 2001 and 2008. They showed that foreign-affiliated ownership of those firms positively affected the efficiency scores. Table 1 gives a brief review of related literature on the efficiency of securities firms that describes the methodology, the variables, and the empirical evidence.
While there were several attempts to determine commercial banks’ performance and efficiency, the empirical research found on investment banks was very restricted. Previous studies dealt with universal banks and also analyzed their investment banking and corporate finance activities. Allen and Rai (1996) compared the efficiency and performance of universal banks compared with traditional banks by using both parametric and non-parametric methods. The findings showed that universal banks that had an investment banking function operated more efficiently than commercial banks. Vander (2002) also confirmed their results by using only investment banking activities. In a comparison study between UK and Italian investment firms provided by Beccalli (2004) over the period of 1995–1998, the author concluded that the investment firms in the UK operated more efficiently.
Radic et al. (2012) drew our attention to estimating the profit and cost functions of investment banks in the G7 and Switzerland during the period of 2001–2007. The authors employed investment banking fees as the output in their model and found that insolvency risk had a positive effect on cost inefficiency. Mamatzakis and Bermpei (2014) provided an in-depth analysis of the determinants of investment banks’ performance in the G7 and Switzerland over the period of 1997–2010. They focused on the roles of risk, liquidity, and investment banking fees. The authors showed a strong positive link between risk and performance, while liquidity exerted a negative impact. In addition, the findings also indicated changeable results during the crises periods.
Since the data in this study covered the Turkish securities industry, it is meaningful to mention the studies related to the performance of Turkish securities firms. As in other countries, although many studies analyzed the performance of banks in Turkey, the literature on the performance of securities firms was relatively sparse. While the Turkish banking sector has attracted interest from scholars (Demir et al. 2005; Aysan and Ceyhan 2008; Ihsan 2007; Isik 2008; Fukuyama and Matousek 2011) there has been comparatively little investigation of the country’s securities industry (Aktas and Kargin 2007; Bayyurt and Akın 2014, etc.). This paper is one of the few studies in the literature related to the performance of securities firms.
Moreover, the literature on the risk-taking tendencies of securities firms has not yet been developed, but it is worth mentioning a few studies. Research on banks is very common, and the risk indicators are naturally directed toward the loans extended as part of their main activities (as shown in Table 2).
Unlike regulatory agencies, which often have access to non-public information, researchers have only benefited from the information that is disclosed to the public. So, the related literature mainly deals with financial statements as well as the Merton Distance to Default model (Merton DD), which is widely used in measuring the risk of public companies and banks. Bono spreads and credit default swap (CDS) approaches are generally not available to securities firms that are not publicly traded or do not issue bonds (Chiaramonte et al. 2015).
One of the very few studies that dealt with the risk-weighted assets of securities firms was that of Dahiyat (2012), which developed a CAMELS-like rating model for securities firm in Jordan. In the study, the author used the risk weights that were obtained directly from the related regulatory authority, which is not public. The author attempted to develop the most important parameters that could be used to assess the performance of Jordanian brokerage firms according to each component of CAMELS.

2.2. Relevant Literature of Banks’ Risk, Efficiency, and Capital

The scholarly research on efficiency in the banking sector is concentrated on measuring the behaviors associated with risk factors (Chen and Chen 2000). As the bankruptcies in this sector are costly, not only for the equity and debt holders of banks’ but often also for taxpayers (Fiordelisi et al. 2011), there is a huge number of empirical studies on this issue.
The first serious discussions and analyses of banking efficiency and risk taking emerged during the 1970s, particularly in the USA with the development of a strong banking sector. These early studies mainly concerned the issue of whether the existence of flat-rate deposit insurance induced banks to take on excessive risks (Tan and Floros 2013).
With the adaption of the Basel recommendations at the international level, empirical research arose concerning the capital requirements of banking risk behaviors. A new wave of studies (mostly for the United States’ banking sector) tended to find that regulatory capital constraints were buttressing banks’ capital. Most of the following studies (Wall and Peterson 1988; Shrieves and Dahl 1990; Rime 2001; Berger and De Young 1997) argued that there was a significant relationship between financial decisions, risk-taking incentives of the sample banks, and the minimum capital requirements. However, theoretical attempts showed contradictory results at the level of capitalization and risk-taking behavior depending on the focus and the modelling strategy.
Kwan and Eisenbeis (1997) were the first to make a connection between the empirical literature on bank capital regulation and risk-taking studies related to bank efficiency. Following Hughes and Moon (1995), they emphasized the importance of efficiency when analyzing the relationship between bank capital and risk using a simultaneous equation framework. Their theoretical arguments were followed by studies that found that bank risk taking and moral hazard incentives were determined by both efficiency and bank capital. Hughes and Mester (1998), another major contributor to the level of capital and risk debate, considered bank efficiency in their model. The authors argued that capital and the risk were presumably determined by the efficiency, and that a supervisor can allow an efficient bank to take more risks with the same level of capital as other banks.
Granger causality methods were employed (see1 Berger and De Young 1997; Williams 2004; Altunbas et al. 2007; etc.) to assess the intertemporal relationship between risk, efficiency, and capital. A simultaneous equations framework was used to determine the inter-relationship between bank risk, capitalization, and efficiency (see Fiordelisi et al. 2011; Tan and Floros 2013; Saeed et al. 2020; Hu and Yu 2015; etc.) Both methods provided evidence that efficiency and capital were relevant determinants of bank risk (Fiordelisi et al. 2011).
Table 2 lists a number of papers that examined the bank efficiency using frontier analyses (namely stochastic frontier analysis (SFA) or data envelopment analysis (DEA)) by considering their risk behaviors and levels of capitalization. Personnel expenses, equity fixed assets, and deposits were the main inputs, while loans, other earnings, and non-interest income were the most preferred variables as outputs (Tan and Floros 2013; Delis et al. 2014; Wild 2016; Mamatzakis and Bermpei 2014; Van Anh 2022). The control variables of the models that examined the relationship between risk and efficiency were mainly return on assets, asset size (in natural logarithm form), revenue per labor and inflation, GDP growth, and market capitalization over GDP.
Considering the business model of banks, the proxies of asset/credit quality (particularly the non-performing credit ratio, loans to assets, etc.) were the main risk indicator in the related literature. As brokerage firms could not give credits, we focused on the literature using a risk indicator other than the credit ratio. The Z-score is widely used in empirical banking literature and is an account-based measure that does not require strong assumptions about the distribution of returns (Chiaramonte et al. 2015). Contrary to the market-based model (equity price, bond spread, etc.), which is only applicable for the listed banks, and due to its simplicity, it has attracted a great deal of empirical work. The Z-score can be computed for an extensive number of listed and non-listed banks. The last columns of Table 2 provide sample studies that used the Z-score for the assessment of banks’ risk; this risk indicator was also used in this analysis.

3. Data and Methodological Framework

Following the data description, the methodology introduced in this section comprises two building blocks. The methodology and specifications that are applied for measuring efficiency and risk specifications are presented. Then, the model that addresses the relationship between efficiency, risk, and capital is described.

3.1. Data Description

The dataset of securities firms was obtained from the Turkish Capital Markets Association (TCMA). TCMA publishes very comprehensive data about securities firms’ activities and financial tables based on the data compiled from securities firms. Some variables were gathered from each firms’ financial statements published on the Public Disclosure Platform. The market related data (i.e., trading volume and the market capitalization) were accessed from the exchange, namely Borsa İstanbul.
Given the slump in the numbers of securities firms due to the banking crisis in 2001–2002, we employed our model from the beginning of 2004. The sample covered the firms that engaged in brokerage activities in at least one market in Borsa İstanbul between 2004 Q1 to 2021 Q4. The number of securities firms in the research period varied from 60 to 115, which resulted in 5575 observations for each variable. As a whole, 212 firms were included in the sample data. The market value for the sector and HHI were observed 72 times.
Since not all firms had available information for all years, we opted for an unbalanced panel to not lose degrees of freedom. The data involved the entire population (all active firms in the sector in the related years were chosen); the model considered individual-specific error components as the fixed effects.

3.2. Measuring Efficiency of Securities Firms

Measuring efficiency is difficult issue when considering the complex input and output structure. The non-parametric data envelopment analysis method, which facilitates the use of multiple inputs and outputs was employed to measure relative efficiency. Organizational efficiency is a multifaceted concept, and the strategic management literature recognizes that it is difficult to select a single measure to determine a firm’s performance. DEA overcomes this difficulty by deriving an index of a firm’s efficiency by transforming inputs into outputs relative to its counterparts (Demirbag et al. 2016).
There are numerous empirical works that applied DEA in the financial sector; most papers estimated that an efficient frontier can yield robust results (Seiford and Thrall 1990). DEA has been proven to be a powerful benchmarking methodology to measure the relative efficiency of business entities in a wide range of industries, sectors, and portfolios.
Data envelopment analysis (DEA) was an appropriate technique to measure relative efficiency, following Tan and Floros (2013). As a non-parametric model, it requires minimal assumptions with respect to the structure of production as compared to parametric (econometric) methods such as stochastic frontier analysis, thick frontier analysis, distribution-free analysis, etc.
The DEA approach introduced by Charnes et al. (1978), known as the CCR model, uses a linear programming technique to determine a pricewise linear envelopment surface from the observed levels of inputs and outputs of decision-making units (Wang et al. 2003). The CCR assumes all decision-making units are operating at optimal scale and are characterized by a constant return to scale.
Banker et al. (1984) extended the CCR model by assuming a variable return to scale, which was named the BCC model. While the CCR model was used to examine technical efficiency, the BCC model was used to examine pure technical efficiency. The objective function and the constraints are given in Table 3 for both models.
The CCR model was modified to account for VRS by adding the convexity constraint N1′λ = 1, where N1 is an N × 1 vector of ones. This approach formed a convex hull of intersecting planes that enveloped the data points more tightly than a CRS conical hull; this provided pure technical efficiency scores that were smaller than or equal to those obtained using the CRS model. The pure technical efficacy score was also between 0 and 1.
In brief, the CCR model was used to examine technical efficiency (TE), while the BCC model was used to examine the pure technical efficiency (PTE). If the efficiency scores obtained from the CRS model and VRS model were different, this indicated that the firm had scale inefficiency; that scale inefficiency could be calculated from the difference between the VRS technical efficiency score and the CRS technical efficiency score.
Once we obtained the TE and PTE, the scale efficiency score (SE) could be calculated as θSE = θTE/θPTE, where θTE and θPTE are the CCR and BCC efficiency scores, respectively. This allowed us compose the technical efficiency such that θTE = θSE*θPTE. The decomposition of TE illustrated the sources of inefficiency, pure technical efficiency (BCC efficiency; that is, due to inefficient operation locally), or disadvantaged conditions displayed by the scale efficiency or both (Azad et al. 2017).
The selection of these inputs and outputs were guided by the prior literature on the efficiencies of securities firms and banks listed in Table 1 and Table 2. We developed alternative inputs and outputs and estimated the technical, pure technical, and scale efficiency scores for the brokerage firms.
Alternative 1: DEA Efficiency Scores Derived from Financial Tables: There is no simple clarification of input and output specification. Nevertheless, although there is no consensus that the inputs and outputs are best suited to calculate the efficiency of their firms, Greenley (1994) stated that various quantitative targets can be set to guide performance (output) over a period of time. Shrader et al. (1984) stated that output variables can be measured in a variety of ways (sales, profit, return on assets, return on equity, etc.) that should be used to reflect the nature of a firm or industry. In this way, it was seen that more financial statements were used in the studies.
As can be seen in Table 3, the inputs and outputs used in the measurement of effectiveness when examining securities firms were generally obtained from the financial statements. In general, the inputs of equity, personnel expenses, and/or operating expenses (See Wang et al. 2003; Zhang et al. 2006; Aktas and Kargin 2007) were used. The outputs, which were concentrated on revenues, brokerage revenues and other revenues such as corporate finance, public offerings, and corporate portfolio transactions (see Fukuyama and Weber 1999; Wang et al. 2003; Zhang et al. 2006), were used under the same class or separately.
From a financial table perspective, we defined financial efficiency in which the input and output were determined using the financial tables of the firms.
Inputs:
Fukuyama and Weber (1999), Wang et al. (2003), and Zhang et al. (2006) determined outputs by considering the types of services of securities firms. Thus, their outputs were commission revenue, trading gains resulting from market making, investment banking revenue, revenue from asset management, and total revenue. Therefore,
Outputs were divided into:
  • Brokerage Revenue: Given the nature of brokerage firms, we defined brokerage revenues as the first output item. As mentioned previously, the most important source of income for brokerage firms is brokerage revenues, which provide for the purchase and sale of capital market instruments on behalf of their customers.
  • Other Operating Revenue: Other operating revenue included corporate finance, asset management, and income from credit transactions as another output item These revenues were not classified individually, as done by Zhang et al. (2006), because they differed significantly between institutions, and each was not an important source of income.
  • Revenue from Proprietary Trading (market-making activities): The final output item included the net revenues that institutions obtained from their own portfolios; namely, proprietary trading. In addition to capital market instruments such as equities, fixed income, and derivative transactions, the income from deposits, repos, reverse repos, Takasbank Money Market, etc. was combined and classified as the final output item. Firms in non-financial sectors generally generated financial income by evaluating excess cash in deposits or other products, while brokerage firms could generate income from arbitrage transactions by borrowing and investing in accordance with market conditions in addition to using cash surplus.
Alternative 2: DEA Efficiency Derived from Operational Variables: In addition to the financial table, we used the operational data as an alternative.
Fukuyama and Weber (1999), who adopted the production approach of bank efficiency to securities firms, assumed that brokerage firms used two main input groups: capital (physical capital) and labor (human capital). We followed this argument and used capital and labor.
Hence, our inputs were:
  • Capital: As in the first alternative model.
  • Labor: As the personnel expenses were used as input, in the previous alternative, the number of employees represented was determined as the input item in this approach. Indeed, the number of employees has been widely used in both banking (see Fiordelisi et al. 2011; Sealey and Lindley 1977; Hughes and Mester 1998 and brokerage activity Hu and Fang 2010).
  • Branch Network: In addition to capital, the branch network was added as physical capital. The reason behind a preference for the branch network was that bank-affiliated brokerage firms can use the parent bank branches, which are effective in a much wider area as agents. In this way, these institutions create significant transaction volume at these branches as well as their own branches opened with their own capital.
Output items, on the other hand, were chosen for the volume and sizes produced by the institutions.
  • Trading Volume: Similar to Aktas and Kargin (2007), the total transaction volume was selected.
  • Activities Other Than Brokerage Activities: The activities of brokerage firms other than brokerage were also taken into consideration; the size of the managed assets, the loan volume given to customers for stock transactions, and the size of the public offering brokerage were used.
Alternative 3: Managerial Efficiency: We also measured managerial efficiency by referring to the research of Chiaramonte et al. (2015), Delis et al. (2014), Sahut and Mili (2011), and Mateev et al. (2022), which used the ratio of operating revenue to operating expenses. A higher ratio indicated inefficient company management and increased the probability of firm risk and failure.

3.3. Measuring Risk of Securities Firms

Since the literature on securities firms is very limited, it was very difficult to determine the risk measures for these firms. Indeed, we attempted to measure alternative risk indicators based on the measures used in banking research. The determination of risk indicators was determined using the prior literature on banks’ efficiency and risk as listed in Table 2.
Alternative 1: Risk-Weighted Assets Ratio—Position Risk: There is no unique indicator of securities firms’ asset quality and ratio of risk-weighted assets in written research. Studies on banks are very common, and risk indicators are naturally directed toward the loans extended as part of their main activities, as mentioned in Section 2.1.
Dahiyat (2012) developed a CAMELS-like rating model for brokerage houses in Jordan. In the study, the author used the risk weights that were obtained directly from the related regulatory authority, which are not public.
A significant part of the balance sheets of securities firms are liquid assets. Losses in liquid assets due to market risks may cause a risk by reducing a securities firm’s ability to finance short-term liabilities. Therefore, the main risk related these firms should focus on their position.
As in other jurisdictions, the Capital Markets Board (CMB) gathers detailed data from firms and measures the ratio of risk-weighted assets. The CMB refers to this measure as the “position risk” (term used hereafter) of securities firms, which is the key part of the regulatory framework. The calculation method of the position risk is public, but the values for each firm are confidential. Moreover, many of the data used in the calculation were not publicly available. Indeed, we derived a common measure of firms’ position risks using public-account-based data as a proxy for the calculated items in the regulator’s methodology. It was designed by weighting the balance sheet items according to their riskiness.
When considering the securities firms’ business models, the position risk mainly dealt with the financial assets. The nature of the assets (debt vs. equity, etc.), the maturity, the liquidity (trading in an organized market or over the counter), and the issuer (public or private) were considered when assigning the weights.
Another major component of the total assets of securities firms is the trade receivables, which mainly reflect the settlement receivables and margin trading. Turkish capital markets have a resilient post-trade infrastructure (e.g., central settlement and custody intuitions, as well as a central counterparty mechanism), so the risk weight of the trade receivables (which are mainly settlement receivables from clients and central settlement bank) may be relatively small. However, when considering the margin trading risk (receivables from clients related to credits for equity trading), the weight may be similar to the regulator’s calculation. Similarly, the risk weight of other receivables (mainly consisting of deposits and guarantees), which represented a small proportion of the total assets, was also moderate. While the position risk dealt with the assets, the liabilities accounts were also given a modest risk weight, which was similar to the regulator’s model. Then, the position risk was calculated as the ratio of the total risk scores of an individual firm to the firm’s capital for each firm. The risk scores (5 to 50) for the selected assets and liabilities are given in Table 4.
Alternative 2: Z-Score2: In order the check robustness of the results, we complemented the position risk with an alternative risk indicator: the Z-score (Boyd and Runkle 1993; Hannan and Hanweck 1988; Laeven and Levine 2007), which is monotonically associated with a measure of a bank’s probability of failure. It is widely used in empirical banking literature (Boyd et al. 2006).
This variable can be summarized as:
Z t = CAR t + ROA t σ roa t
where “CAR” is the capital-to-asset ratio, “ROA” is the return-on-average-assets ratio, and “σ (roa)” is an estimate of the standard deviation of the rate of return on assets. The Z-score reflects the number of standard deviations by which returns would have to fall from the mean in order to wipe out a bank’s equity. The Z-score measures the number of standard deviations by which a return realization has to fall in order to deplete equity (Chiaramonte et al. 2015). The Z-score combines profitability, capital risk, and return volatility in a single measure. A higher Z-score corresponds to an upper bound of the bankruptcy risk; in other words, a higher Z-score indicates lower risk.

3.4. Measuring the Relationship of Risk, Capital, and Efficiency

When considering the variables used in the calculation of the efficiency, risk, and the capitalization level, each indicator may be endogenous to one another. To check the existence of exogeneity, we used the Hausman specification test (Hausman 1978). Our Χ2 findings suggested that the null hypothesis that the 3SLS and OLS coefficients for each of the two equations were the same was rejected, which indicated the presence of an attenuation bias.
We determined a three-stage least-squares estimation to explore the linkage between a securities firm’s risk, capital, and efficiency that took into account both the endogeneity problems and the cross-correlation between the error terms (Tan and Floros 2013).
To disentangle direct channels from indirect channels and eliminate the endogenous problem, we followed Tan and Floros (2013) in our approach to the simultaneous equations:
RISKit = β0 + β1EFFit + β3CAPit + β4FIRMit + β4SECTORit + β4ECOit + εit
EFFit = β0 + β1 RISKit + β3CAPit + β4FIRMit + β4SECTORit + β4ECOit + εit
CAPit = β0 + β1 RISKit + β3EFFit + β4FIRMit + β4SECTORit+ β4ECOit + εit
where the “i” subscript denotes the cross-sectional dimension across securities firms; t denotes the time dimension; RISK is the measure of the firm risk (namely, position risk or Z-score); EFF is the efficiency indicators calculated via the DEA; CAP is calculated as the ratio of capital to total assets; FIRM, SECTOR, and ECO are a number of firm-and sector-specific and macroeconomic control variables that influence the inter-relationships between efficiency, risk, and capital; and εit is a random error term.
Equation (7) assesses whether the level of capital and a firm’s efficiency reflect the level of a firm’s risk; Equation (8) examines whether the level of capital and a firm’s risk temporarily precede variation in the firm’s efficiency; and Equation (9) tests whether a firm’s risk and efficiency temporarily precede variation in a firm’s level of capitalization.

3.5. Control Variables

The choice of control variables was motivated by the early research (most of which is mentioned in Table 1 and Table 2). The size of a firm, its growth, its business model, its profitability, and its labor structure were the selected factors that influenced the efficiency, risk, and capital relationship. Market design and its size were also considered to be critical in this relation. Those specifications have been employed extensively in the literature.
Firm-specific control variables:
Sector-specific variables: In terms of sector specifics, we opted for a number of additional variables:
Variables specific to macroeconomics:

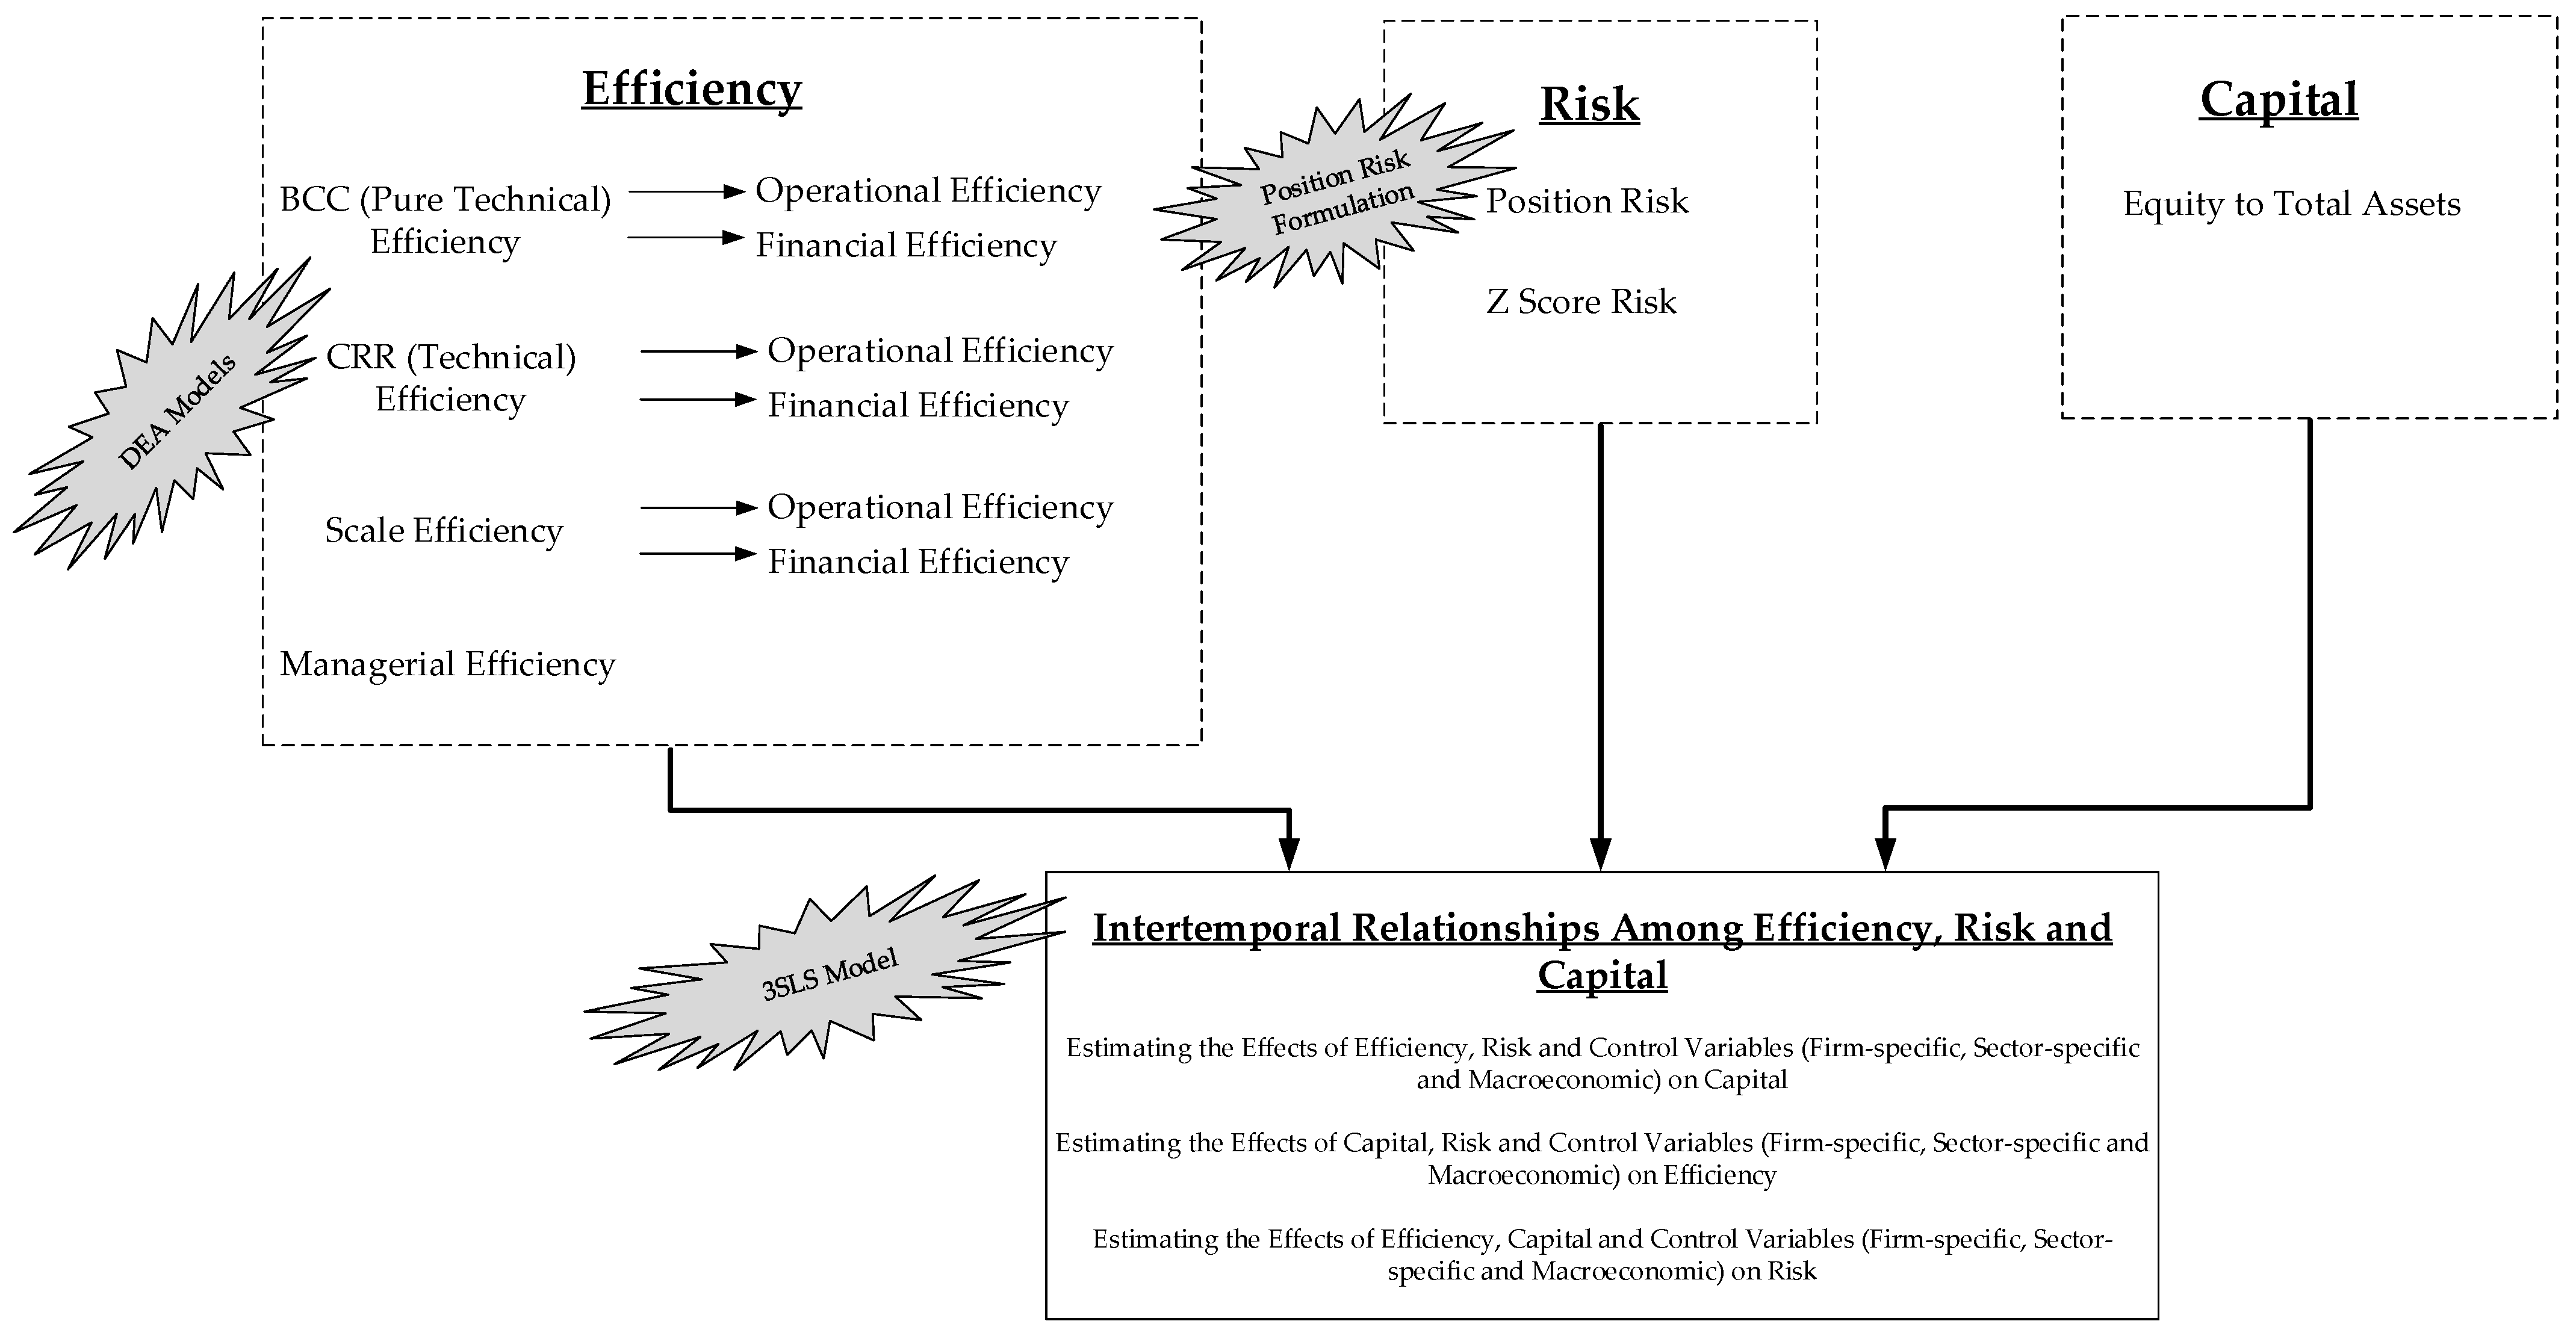
3.6. Summary of Methodological Framework

The methodological framework is summarized as in Figure 1, and the variables are described in Table 5.
As shown in the graph, first of all, alternative efficiency scores using different inputs and outputs were determined. Then, a score was created for the risk-taking tendencies of the intermediary institutions. Alternatively, the Z-score, which is widely used in the financial literature to determine bankruptcy risk, was calculated. Finally, we attempted to estimate the relationship between the alternative risk and efficiency scores determined above and the capital (i.e., the ratio of capital to total assets) simultaneously with the control variables used in the literature.

4. Results and Discussion

Considering the multi-part methodology of the study, the alternative efficiency and risk scores will be interpreted using the defined summary statistics and their correlations in the first part of this section. Next, the results of determining the risk, efficacy, and capital tripartite relationship will be evaluated.

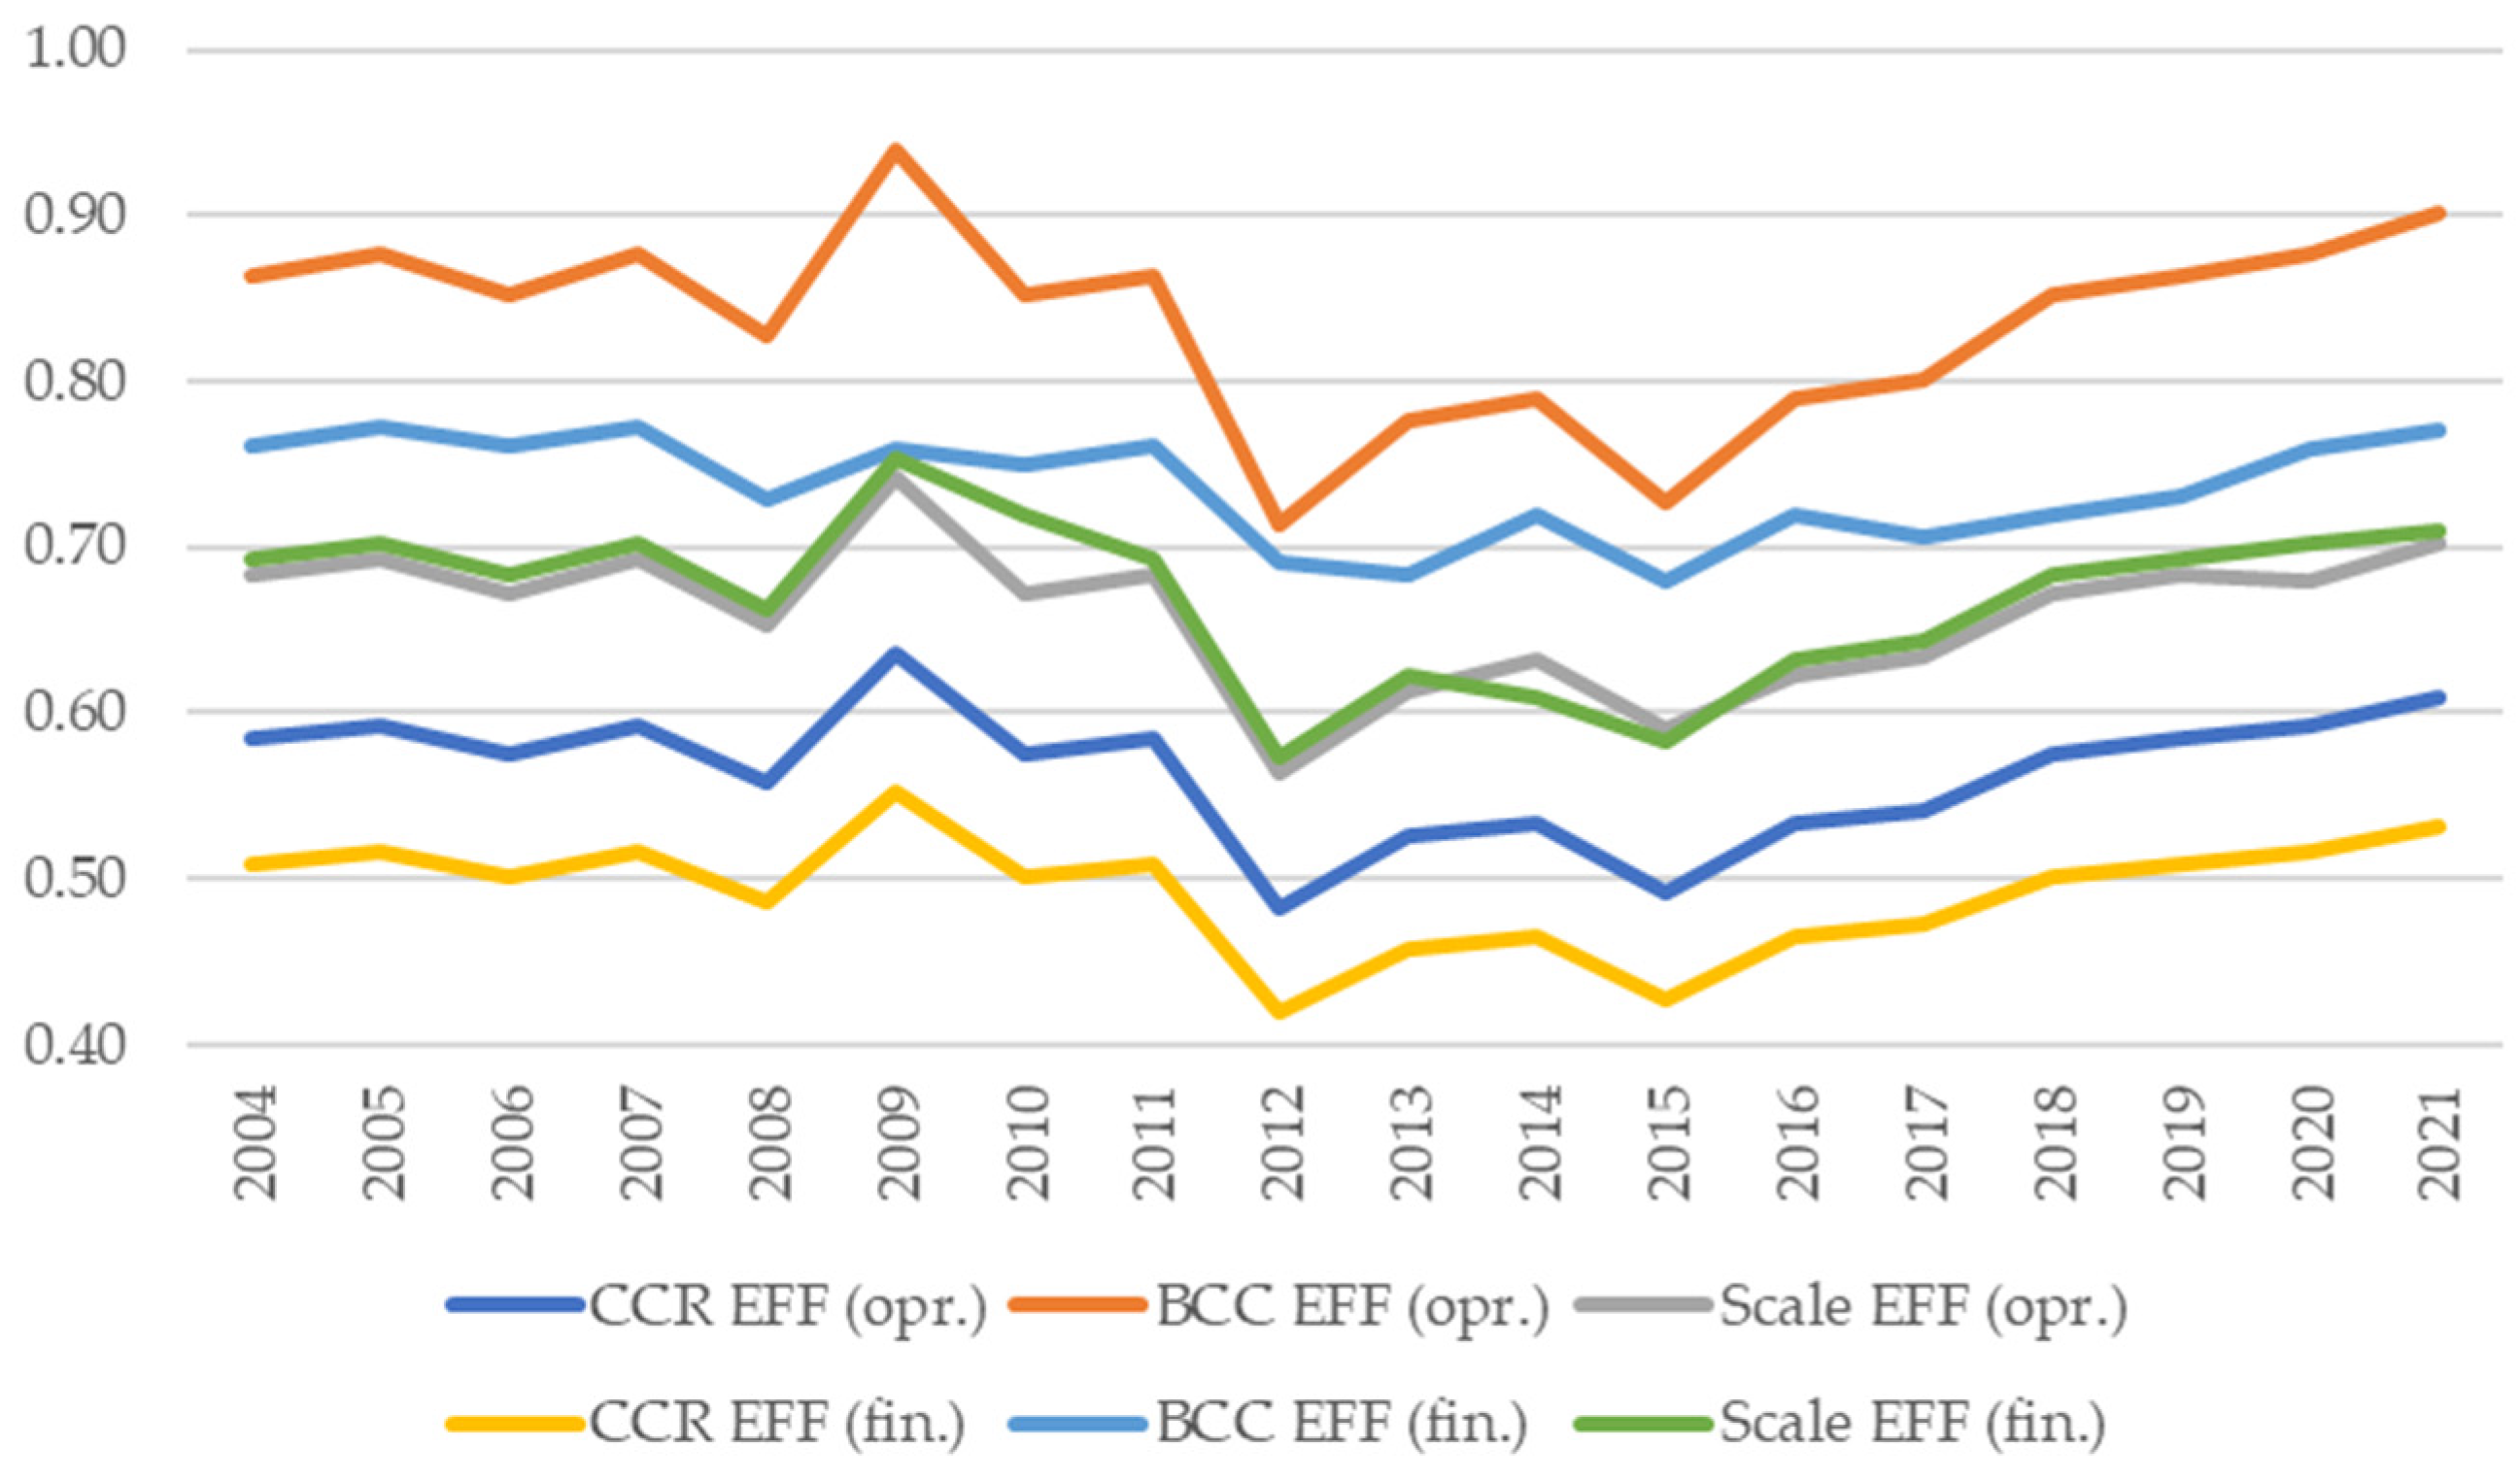
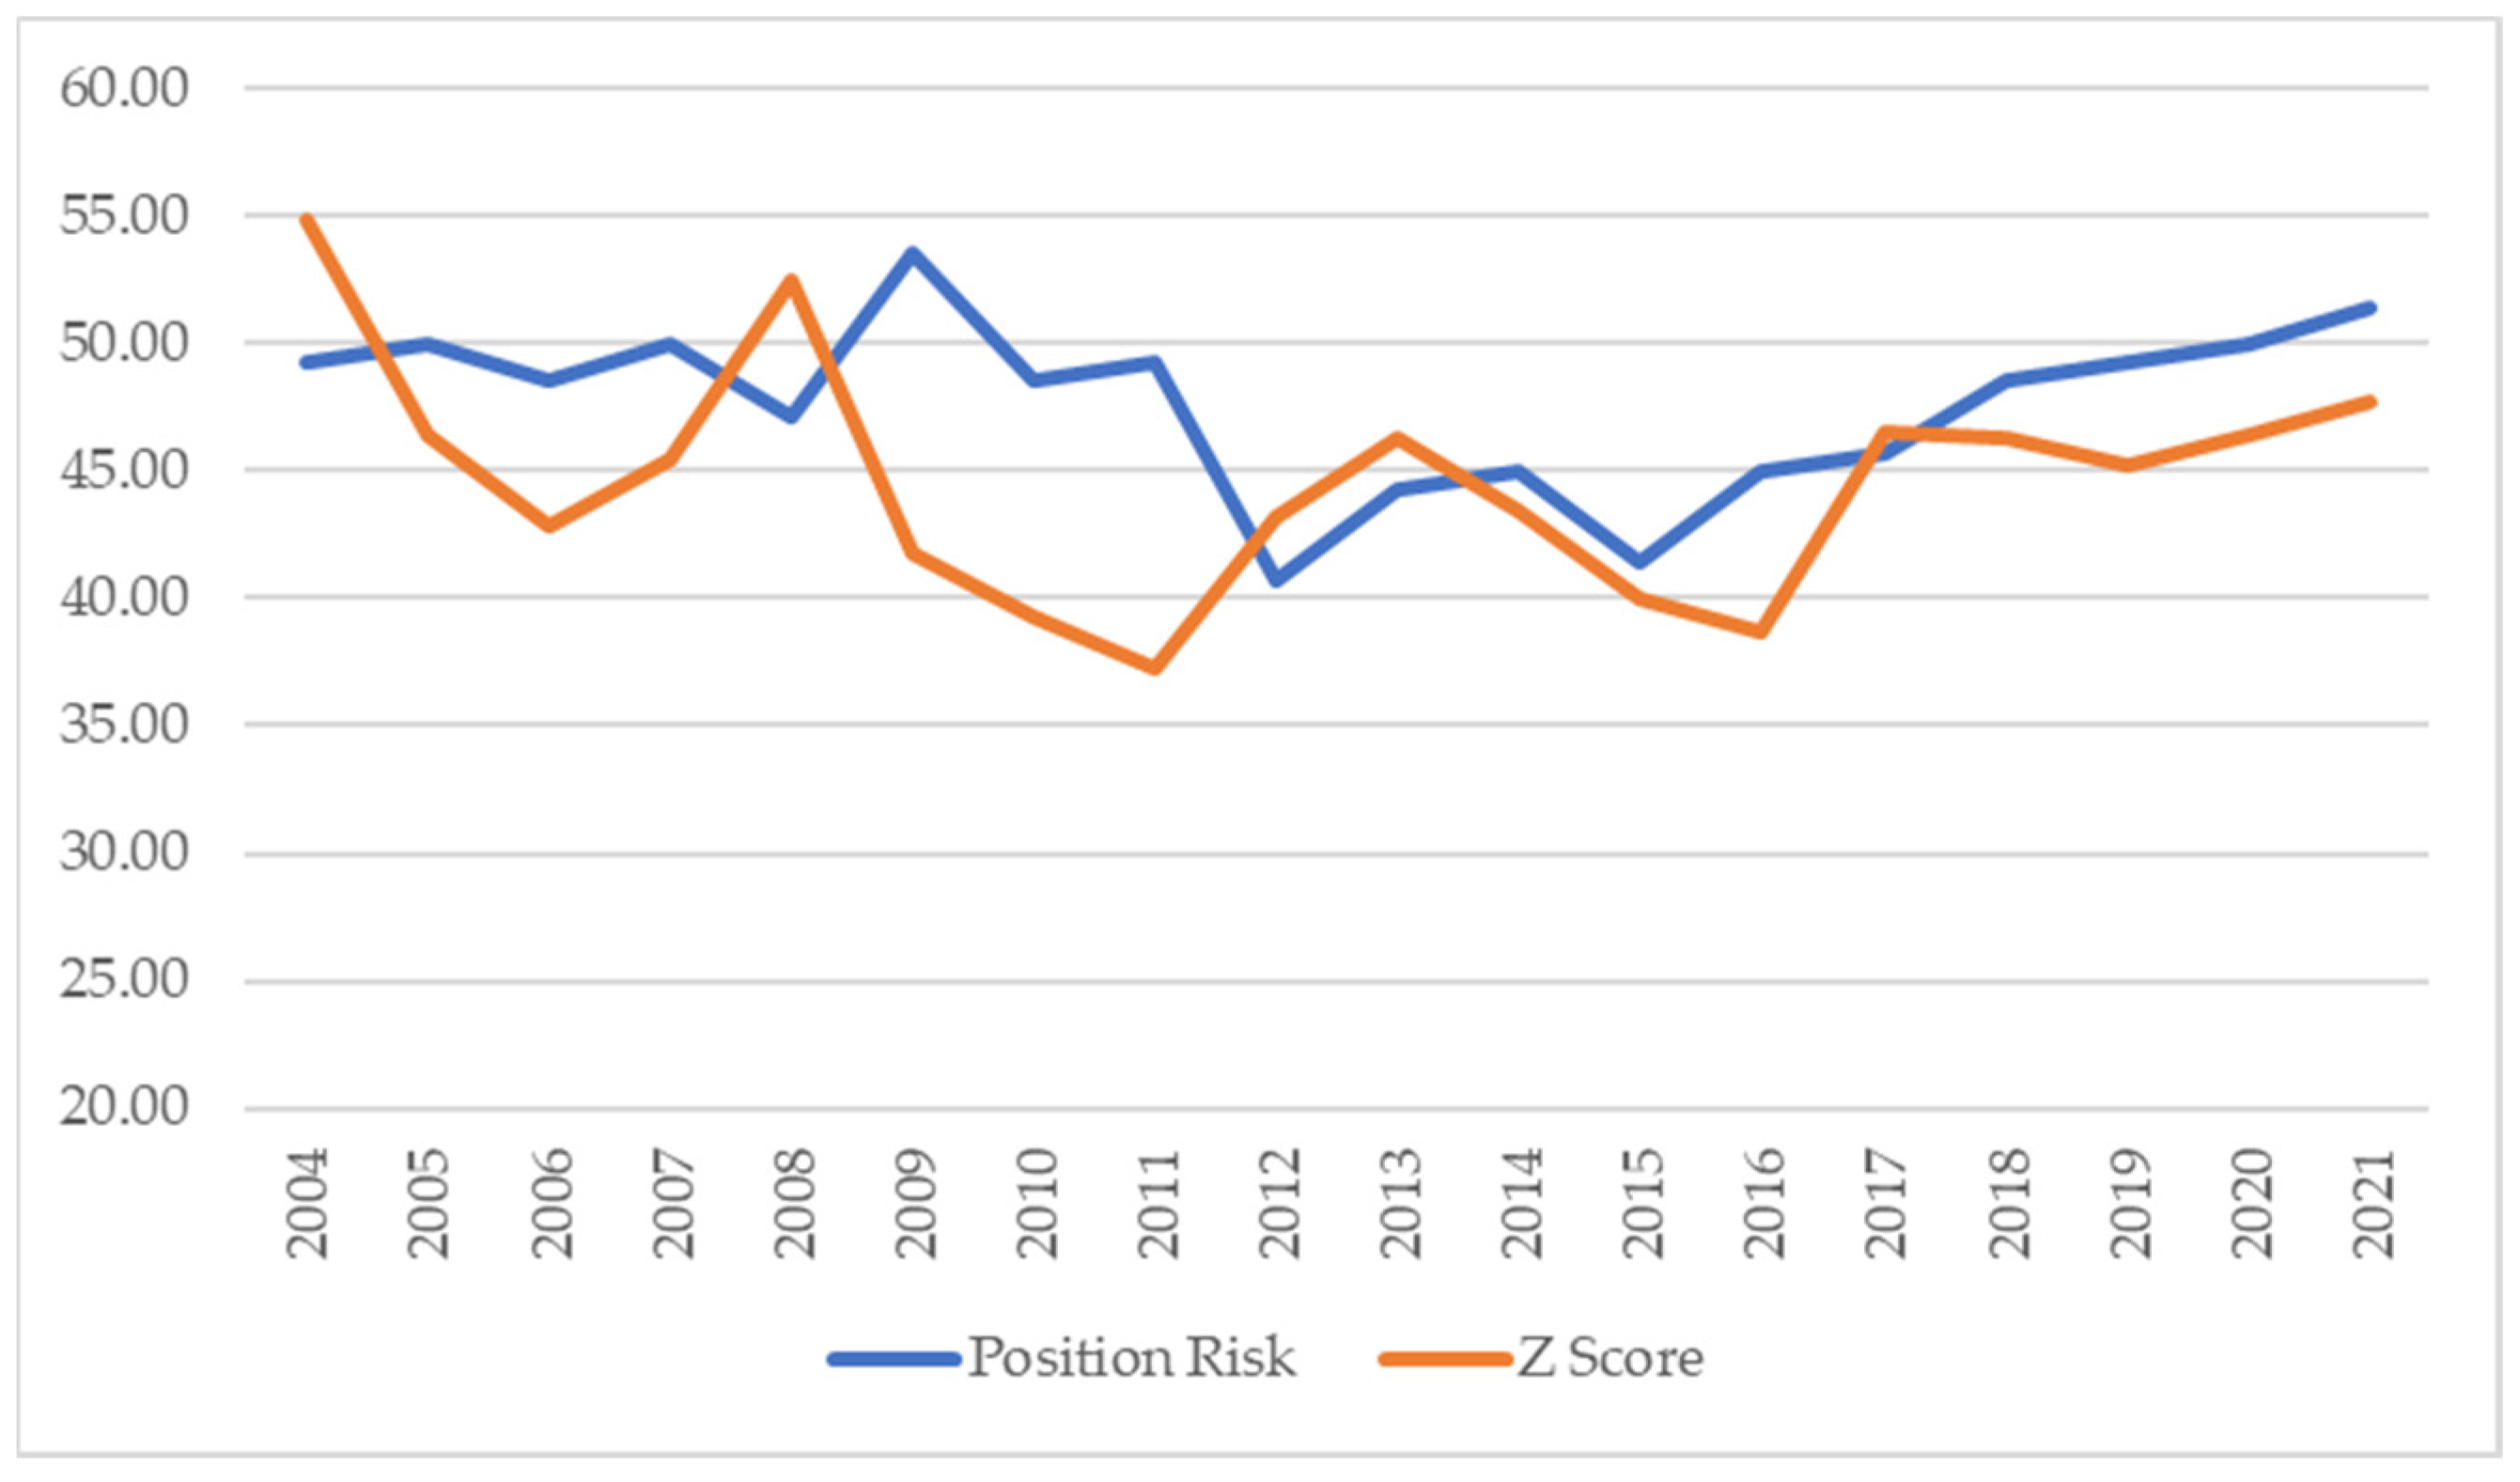
4.1. Results of the Efficiency and Risk Analyses

As shown in the efficiency scores in Figure 2, similar to former studies on Turkish securities firms (i.e., Bayyurt and Akın’s 2014; Demirbag et al. 2016), there was a clear increasing trend in the pure technical, technical, and scale efficiency scores over the period of 2004 to 2009. After 2009, the efficiency scores followed a fluctuating course. This could be explained by the developments in the brokerage sector and in an increasingly competitive environment over the period. While the scores had a decreasing trend between 2009 and 2012, they followed a horizontal course between 2012 and 2015 and then exhibited a rapid increase. In this period, both market conditions and regulations shaped a firm’s effectiveness.
An overall crisis period affected the efficiency of securities firms in Turkey as well as their peers in Korea (Lee et al. 2014) and the USA (Zhang et al. 2006).
The average technical efficiency was 0.565 when assuming a constant return to scale (i.e., perfect competition) and 0.845 when assuming a variable return to scale (i.e., imperfect completion), which implied that the sector is far away from its potential efficiency (namely, the efficiency frontier).
As in Japan (Fukuyama and Weber 1999) and Taiwan (Hu and Fang 2010), when considering the structure of the market (e.g., being affiliated with a bank, which implies a stronger capital and distribution channel), the BCC model was preferable for the Turkish brokerage industry. Accordingly, the efficiency scores were higher in the BCC model as CCR and Scale efficiencies.
Moreover, the technical efficiency scores that used operational variables were larger enough than the scores with financial variables. Briefly, the sector operational performance was much more than they earned.
Regarding the risk perspective (shown in Figure 3), the mean of the position risk (i.e., the risk-weighted asset ratio) was 0.48. The scores were modest at the beginning of the study period, which suggested that firms had moderate risk in their portfolios. Parallel to the market conditions, we observed that firms tended to invest in riskier assets in the following years. Again, the position risk scores followed a fluctuating course over the years, as did the efficiency scores. The lower level of the risk positions of Turkish securities firms, even in favorable market conditions, can be explained by the rigid regulations.
The mean of the Z-scores, which combined each firm’s profitability, capital ratio, and return volatility, was 44.2. When considering earlier studies that measured the bankruptcy risk of banks using the Z-score (Tan and Floros 2013; Wild 2016; Lepetit and Strobel 2013; etc.), it was seen that it was not much different from the rates calculated for Turkish securities firms. In the same studies, it was observed that the Z-score decreased more, especially during crisis periods, which was similar to the results of this study. Although it varied between years, it was seen that the Z-score and the position risk moved together in general.
Table 6 shows a summary of the statistics of the alternative efficiency and risk scores along with the control variables.
Regarding the capitalization aspect, the average of the equity to assets was around 0.5, which implied a strong capitalization due to minimum capital requirements.
When considering the control variables, the mean of the firms’ assets (in logarithm terms) was 16.9 and generally showed an upward trend over time.
We also observed that the income diversification of the firms increased over the years depending on national and global market conditions. Similarly, an improvement was observed in the rate of qualified personnel.
When we examined the market conditions, we saw that the concentration was decreasing gradually.
The correlation matrix of the variables is presented in Table 7. First of all, the correlation among the variables for each model was usually negligible, suggesting that our models were unlikely to suffer from major multicollinearity problems4.
The correlation between the efficiency scores calculated using the financial variables and operational variables were quite high, as expected. This correlation was even higher for the pure efficiency scores (BCC scores). This implied that scale was a considerable issue in the market. CEOs of the bank-affiliated brokerage firms may have different strategies (being market leaders or followers as its main partner; maximizing the trading volume or brokerage revenue; being involved in margin trading or not, etc.) than those of the non-banks.
It is important to note that the managerial efficiency sores had a higher correlation with the pure technical efficiency (especially those derived from financial variables) than the others. The correlation between the operational efficiency scores and the sector concentration was relatively low. The correlation between the risk indicators and the sector concentration also was low. The periods of high concentration were generally during crisis periods, and securities firms’ managers were thought to have had less incentive to improve the efficiency or take risks.

4.2. Results for the Relationships of Risk, Capital, and Efficiency

The empirical results obtained from the simultaneous estimations are presented in Table 8 and Table 9. Since the model that used the technical efficiency and scale efficiency had similar results, only estimations of the model with the pure technical efficiency (BCC model) are demonstrated in the tables.
Since the explanatory power (R-squared) of the model that used managerial efficiency (where the efficiency indicator was the cost-to-income ratio) was lower than that of the BCC model, only the models with pure technical efficiency scores are given5. In fact, for the bank affiliations with stronger capital and branch networks in the industry, the pure technical efficiency scores were more reliable.
Since we had alternative efficiency (efficiency scores derived from operational data and from financial tables) and risk indicators (i.e., position risk and Z-score) we employed 3SLS for four times. The results of each 3SLS model are shown in three equations (columns) for each dependent variable; namely, efficiency, risk, and capital.
It is worth the noting that the chi-squared tests for most equations indicated that the models in which the operational efficiency was adapted provided more robust results. Furthermore, the R-squared values for those models were larger.
Table 8 reports the relationships between firms’ operational efficiency, capital, and risk-taking level; Table 9 reports the relationships between the financial efficiency, capital, and risk-taking level.
Table 8a shows the results of the 3SLS model in which the risk was the position risk, and Table 8b shows the results of the model in which the risk was the Z-score. Similarly, Table 9a shows the results of the 3SLS model in which the risk is the position risk, and Table 9b shows the results of the model in which the risk was the Z-score.
According the first equation in Table 8a (where the dependent variable was the operational efficiency), the results can be interpreted as:
  • Estimating the effects of position risk on operational efficiency: The position risk had a significant and positive relationship with the operational efficiency. The findings suggested that the securities firms with higher position risks required a higher trading volume, proprietary trading, and margin trading, which were output for the operating efficiency.
  • Estimating the effects of capital on operational efficiency: The level of the capital-to asset-ratio and the operational efficiency were positively related, but the coefficient was negligible.
  • Estimating the effects of control variables on operational efficiency: The income diversification and qualified employee coefficients indicated that they had significant effect on the operational efficiency of a firm. When considering the output of operational efficiency, the more varied activities (brokerage, corporate finance, and margin trading) were associated with more diversified revenue. In addition, if a firm wants to engage in different activities given the level of capital, it needs further licensed market professionals (namely, a higher qualified-person ratio).
In terms of profitability, the coefficient of return on equity was higher in the model in which the dependent variable was the operational efficiency. This implied that operationally efficient organizations were also financially efficient. The results also highlighted the validity of the input–output selection in the data envelopment analyses.
The results also suggested that labor productivity was significantly and negatively related to the pure technical efficiency of Turkish securities firms. The employees with higher productivity required higher wages or salaries, and the resulting increase in the price of labor increased the input cost in securities operations, which preceded a decline in securities firms’ technical efficiency in Turkey.
When the adverse effects of labor productivity and profitability on the operational efficiency were evaluated together, it was found that firms were required to maintain them at an optimal level rather than hiring more employees in order to be effective. Thus, there was no significant relationship between asset size and operational efficiency. There was no significant evidence that larger firms had higher technical and pure technical efficiencies.
In terms of the industry-specific variables, the results indicated that more a concentrated market led a decrease in the technical efficiency of the Turkish brokerage industry. That is, in a highly concentrated market, firms’ managers had less incentive to improve the efficiency.
In Equation (2) in Table 8a, where the position risk is the dependent variable, the findings can be expressed as:
  • Estimating the effect of the operational efficiency’s on the position risk: The firms with higher position risk in their portfolio, operate more efficiently. As operational efficiency is relevant with wide range of activities, this result implies that the firms can engage in more business areas with more diversified portfolio.
  • Estimating the effect of the level of capitalization on the position risk: We can further report that there was also positive and significant relationship between the position risk and capital. In the context of the Turkish brokerage industry, this finding can be explained by the fact that firms with higher levels of capital were more capable of proprietary trading (with more risk assets), which increased their position risk. Moreover, the firms with more risk-weighted assets required more capital to compensate for potential loses.
  • Estimating the effect of control variables on the position risk: It was interesting to note that the results showed that there was a positive relationship between qualified persons and the position risk. This was mainly explained by engaging in risky and arbitrary proprietary transactions (e.g., derivatives and leveraged trading), which required qualified employees. Unsurprisingly, another significant piece of evidence was that the position risk and the asset size had a positive relationship.
The last equation in Table 8a shows the following:
  • Estimating the effect of the operational efficiency on the level of capitalization: The findings suggested that there was no evidence of an association between capital and the operational efficiency.
  • Estimating the effect of the position risk on the level of capitalization: The position risk had a positive effect on the capital, which can be interpreted as a higher position risk requiring additional capital due to market conditions.
  • Estimating the effect of the control variables on the level of capitalization: The size and growth of assets showed positive and significant relationships with the capitalization level, as expected. Income diversification also had a positive and significant relation with capital. Firms with a higher capitalization could engage in more varied activities. It is worth noting that there was no significant relation between capital and the ROE.
Table 8b describes the estimations using the Z-score as the risk indicator. Despite the fact that we found no studies that evaluated the efficiency, risk, and capital relations for securities firms, it was possible to make comparisons with previous studies that used the Z-score for risk when examining the triple relationship of banks.
In the first equation in Table 8b, where the operational efficiency is the dependent variable, most of the variables had a significant relationship with the operational efficiency. The model with risk represented by the Z-score as an independent variable returned similar results to the model with the risk represented by the position risk as an independent variable. The findings were the following:
  • Estimating the effects of the Z-score on the operational efficiency: There was a negative and significant relationship between the Z-score and the efficiency. The firms that operated more efficiently had higher Z-scores, which meant lower risk. This result implied that a firm with an optimal and efficient labor and branch network structure had a lower probability of distress. These findings were accordance with those of Tan and Floros (2013); Mamatzakis and Bermpei (2014), and Dong et al. (2017).
The second column demonstrated in Table 8b used the Z-score as the dependent variable.
  • Estimating the effects of the operational efficiency on the Z-score: The Z-score and capital were positively related, but the coefficient in the position risk was much higher.
  • Estimating the effects of capital on the Z-score: Capital and the Z-score were positively related, which signified that the probability of insolvency was reduced by the capital, as expected.
  • Estimating the effects of the control variables on the position risk: It was interesting note that the asset size also had a significant and negative relationship with the Z-score. The firms with a higher amount of assets were in the lower upper bound of insolvency risk.
The firms with diversified activities seemed more stable because their coefficients of income diversification were positive and significant. These results also were in line with the findings of Wild (2016), who investigated Eurozone banks; and Delis et al. (2014), who analyzed US banks.
The last column in Table 8b uses capital as the dependent variable. When taking the Z-score into consideration; the probability of distress and the capitalization level were significantly and positively related. In other words, a low capital structure will suffer from an insolvency risk, which confirmed our previous findings. This was also in line with Wild (2016) for European banks.
Table 9a,b present the estimations in which the financial efficiency scores were used. The results showed that most of the variables were in line with the findings given in Table 8a,b. When considering the input and output variables for each efficiency model, the financial efficiency estimators seemed to be more related to profit (namely, return on equity and labor productivity), as expected.
In the first column in Table 9a, the financial efficiency is the dependent variable. In terms of the sector-specific variables, the estimates implied that when the concentration ratio rose, the securities industry showed a decrease in technical efficiency (both with financial and operational variables). These results indicated that firms had less incentive to enhance their efficiency in higher competition conditions. Hence, firm managers normally balanced the higher costs with higher levels of capitalization. Market capitalization also had a significant and positive effect on brokerage firms’ productivity in Turkish capital markets. However, there was no evidence that the market capitalization had a significant effect on firms’ risk (both for position risk and insolvency risk) or the firms’ capital levels.
In terms of the macroeconomic environment, annual inflation and GDP growth rates were found to be positively related to Turkish securities firms’ efficiency. Technological improvements, which are one source of GDP growth, resulted in better production methods in firms’ operations, which preceded an increase in firms’ productivity. The positive impact of inflation on securities firms’ efficiency can be explained by the fact that in an inflation environment, investors prefer equities and other capital market instruments because the interest on bank deposits will not compensate for the erosion of the value of money.
The second equation in Table 9a represents the estimation results for which the position risk was the dependent variable. In the second equation in Table 8a, there was a positive relationship between risk and efficiency, which suggested that risk-taking firms generated revenue more efficiently. A deeper analysis at the firm level revealed that a couple of firms with high profits from proprietary trading may have affected this closure.
Based on the last equation, it was apparent that the level of capitalization and the financial efficiency were more related as compared to the results for Equation (3) in Table 8a. There was also strong evidence of a positive relationship between income diversification, the qualified staff ratio, and the capital level.

5. Conclusions

Securities firms are one of the most important institutions in the financial system because they are involved in buying and selling securities (brokerage) in both the primary and secondary markets. The efficiency assessment of these firms has become a contemporary major issue due to the increasingly intense competition, globalization, and innovation in capital markets. In many developing economies, such as in Turkey, commercial banks dominate the financial system, and the securities industry is still emerging.
While the establishment of a modern securities market in Turkey dates back to the 1980s, the capital market and securities firms have come to the fore in the last two decades thanks to a set of reforms of both the regulations and the market infrastructure. The new regulations increased the capital requirements and allowed new fields of activity for securities firms. With new technology, Turkish securities firms now function with higher global standards. Therefore, policymakers need to be more concerned with securities firms’ sector fragility by focusing on their risk, efficiency, and capital base.
This paper examined the intertemporal relationships between capital, efficiency, and risk in the securities industry in Turkey. We delved more deeply by including different efficiency scores and new risk indicators for the brokerage firms in Turkish capital markets for a period of 18 years (2004–2021) by using quarterly data. We contributed the risk-weighted assets ratio using publicly available data for the first time for securities firms. To address the relationships between capital, efficiency, and risk, we relied on a 3SLS model and used the following control variables: firm-specific variables, which were proxies of the size, profitability, business model, labor productivity, and qualified employees; sector-specific variables, which were proxies of the market size and design; and macroeconomic variables, namely inflation and GDP growth.
In terms of the efficiency assessment, similar to former studies on Turkish securities firms, the efficiency scores showed an increasing trend between 2004 and 2009. Due to an increasingly competitive environment and stickier regulations, they followed a fluctuating course. As for their peers in Korea and the USA, a crisis period affected the efficiency of securities firms in Turkey. It is worth mentioning that the technical efficiency scores that used operational variables were larger than the scores that used financial variables.
From a risk perspective, since there was no unique public indicator of securities firms’ asset quality or risk-weighted ratio, we proposed a position risk formula. The results suggested that securities firms had moderate risks in their portfolios in the early periods of the study. Although the position risk scores increased with favorable market conditions, we observed that the acceleration was somewhat limited by the regulations. The other risk indicator, the Z-score, which was widely used in bankruptcy risk analysis in the literature, combined the firms’ profitability, capital ratios, and return volatility. The scores were in parallel with those of earlier studies that measured the bankruptcy risk of banks (Tan and Floros 2013; Wild 2016; Lepetit and Strobel 2013; etc.).
When considering the simultaneous relationship between risk, efficiency, and capital, the model estimation was as follows:
  • In general, our results showed that there was a significant and positive relationship between a firm’s risk incentive (in terms of the risk-weighted assets ratio) and the technical, pure, and scale efficiencies.
  • The level of capitalization had a positive relationship with the risk incentive; this relationship was negative when the risk indicator was the Z-score (which is widely used as a proxy of firm distress). The firms that operated more efficiently had a higher Z-score, which implied that a firm with an optimal and efficient labor and branch network structure had a lower probability of distress.
  • The level of capital and the efficiency were positively related, but the coefficient was negligible in each alternative model.
  • In terms of the control variables, market capitalization also had a significant and positive effect on a brokerage firm’s productivity in Turkish capital markets. The estimates implied that when the concentration ratio rose, the securities industry showed a decrease in technical efficiency (with both financial and operational variables). These results indicated that firms had less incentive to enhance efficiency when the industry became more concentrated.
Based on a deep analysis of the relationships between efficiency, risk, and capital, we strongly believe that our empirical results may be helpful to the Turkish capital markets’ regulatory authority when creating relevant policies. The managerial and practical implications that were obtained in this study can be expressed as follows:
  • Performance and efficiency at the unit level has become a contemporary major issue for regulators that aids in the identification of significant inefficiency. This analysis may guide the regulator when new structural changes are required for regulators.
  • A risk-based efficiency analysis with a wide range of control variables will be a useful tool for policymakers, especially for minimum capital requirements.
  • As in other sectors, a clear efficiency assessment in the sector will also support shareholders in positioning themselves in the sector and determining their strategies.
  • The calculation of the position risk and efficiency score using a publicly available dataset allows securities firms to compare and position themselves with peer groups.
  • Firms can benefit from the relationships between efficiency and the control variables in the model (firms and sector- or macroeconomic-specific variables) while conducting a scenario analysis, even for strategies during changing market and economic conditions.
  • As the study was data-sensitive, maintaining the data in a precise and up-to-date manner affects the consistency of such studies. This fact emphasized the importance of data management in the securities industry. Such works require a statistical background for practitioners. In this context, it is important to support the practitioners and managers who provide such analyses for securities firms and the statistical information infrastructures with training and practices.
  • Last but not least, when considering the recent policy framework of banking regulations globally, e.g., the USA’s Volcker Rule or the UK’s ring-fencing of deposits, securities firms will become more remarkable; our findings offer valuable insight into how to better structure this industry.
Future studies need to apply the methodology for risk and efficiency indicators from this study for other datasets from the securities industry in both emerging markets and advanced markets, which may provide additional evidence on the impact of capital requirements. Apart from risk and capital assessments, an analysis that attempts to use new parameters such as competition, liquidity, and market anomalies that affect a firm’s efficiency can be a guide for both policymakers and market participants.

Author Contributions

Conceptualization, O.T. and G.C.; Methodology, O.T. and G.C.; Software, G.C.; Validation, O.T. and G.C.; Formal Analysis, O.T. and G.C.; Resources, G.C.; Data Curation, G.C.; Writing—Original Draft Preparation, O.T. and G.C.; Writing—Review and Editing, O.T. and G.C.; Supervision O.T. All authors have read and agreed to the published version of the manuscript.

Funding

This research received no external funding.

Informed Consent Statement

Not applicable.

Data Availability Statement

The raw data were generated by the Turkish Capital Markets Association, Borsa İstanbul, and the Turkish Statistical Institute. The derived data supporting the findings of this study are available from the corresponding author (G.C.) upon request.

Conflicts of Interest

The authors declare no conflict of interest.

Notes

1
Table 2 gives a brief review of prior studies.
2
This z-score should not be confused with the Altman (1968) z-score measure, which is a set of financial and economic ratios. This Altman (1968) z-score measure is used to predict the chances of a business going bankrupt.
3
In Turkey, the main activity of securities firms is brokerage services. More than half of their revenue comes from such services. Market making, corporate finance, and asset management are ancillary services.
4
We checked for multicollinearity issues by computing the variance inflation factor (VIF) given in Table 7, the highest value of which was about 1.49; the mean was approximately 1.2.
5
The estimates of each model are available upon request from the authors.

References

  1. Aktas, Huseyin, and Mamhmut Kargin. 2007. Efficiency and productivity of brokerage houses in Turkish capital market. Iktisat Isletme ve Finans 22: 97. [Google Scholar]
  2. Allen, Linda, and Anoop Rai. 1996. Operational efficiency in banking: An international comparison. Journal of Banking and Finance 20: 655–72. [Google Scholar] [CrossRef]
  3. Altman, Edward I. 1968. Financial ratios, discriminant analysis and the prediction of corporate bankruptcy. The Journal of Finance 23: 589–609. [Google Scholar] [CrossRef]
  4. Altunbas, Yener, Santiago Carbo, Edward P. M. Gardener, and Philip Molyneux. 2007. Examining the relationships between capital, risk and efficiency in European banking. European Financial Management 13: 49–70. [Google Scholar] [CrossRef]
  5. Aysan, A. F., and Ş. P. Ceyhan. 2008. What determines the banking sector performance in globalized financial markets? The case of Turkey. Physica A 387: 1593–602. [Google Scholar] [CrossRef] [Green Version]
  6. Azad, Abdul Kalam, Susila Munisamy, Abdul Kadar Muhammed Masum, and Paolo Saona. 2017. Bank efficiency in Malaysia: A use of malmquist meta-frontier analysis. Eurasian Business Review 7: 287–311. [Google Scholar] [CrossRef]
  7. Banker, Rajiv D., Abraham Charnes, and William Wager Cooper. 1984. Some models for estimating technical and scale inefficiencies in Data Envelopment Analysis. Management Science 30: 1078–92. [Google Scholar] [CrossRef] [Green Version]
  8. Barth, James, Chen Lin, Yue Ma, Jesús Seade, and Frank Song. 2013. Do Bank Regulation, Supervision and Monitoring Enhance or Impede Bank Efficiency? Journal of Banking & Finance 37: 2879–92. [Google Scholar]
  9. Bayyurt, Nizamettin, and Ahmet Akın. 2014. Effects of foreign acquisitions on the performance of securities firms: Evidence from Turkey. Procedia—Social and Behavioral Sciences 150: 156–61. [Google Scholar] [CrossRef] [Green Version]
  10. Beccalli, Elena. 2004. Cross-country comparisons of efficiency: Evidence from the UK and Italian investment firms. Journal of Banking and Finance 28: 1363–83. [Google Scholar] [CrossRef]
  11. Berger, Allen N., and Robert De Young. 1997. Problem loans and cost efficiency in commercial banking. Journal of Banking and Finance 21: 849–70. [Google Scholar] [CrossRef] [Green Version]
  12. Bitar, Mohammad, Kuntara Pukthuanthong, and Thomas Walker. 2018. The effect of capital ratios on the risk, efficiency and profitability of banks: Evidence from OECD countries. Journal of International Financial Markets, Institutions and Money 53: 227–62. [Google Scholar] [CrossRef]
  13. Boyd, John, and David Runkle. 1993. Size and performance of banking firms: Testing the predictions of theory. Journal of Monetary Economics 31: 47–67. [Google Scholar] [CrossRef]
  14. Boyd, John, Mr Gianni De Nicoló, and Abu Jalal. 2006. Bank Risk-Taking and Competition Revisited: New Theory and New Evidence. International Monetary Fund Working Paper, N. 297. Washington, DC: International Monetary Fund. [Google Scholar]
  15. Charnes, Abraham, William Wager Cooper, and Edwardo Rhodes. 1978. Measuring the efficiency of decision making units. European Journal of Operational Research 3: 429–44. [Google Scholar] [CrossRef]
  16. Chen, Shaw K., Xuanjuan Chen, Bing-Xuan Lin, and Rongsa Zhong. 2005. The impact of government regulation and ownership on the performance of securities companies: Evidences from China. Global Finance Journal 16: 113–24. [Google Scholar] [CrossRef]
  17. Chen, X., and Z. Chen. 2000. The prediction of Chian listed company’s financial dilemma. China Accounting Financial Review 3: 55–92. [Google Scholar]
  18. Chiaramonte, Laura, Ettore Croci, and Federica Poli. 2015. Should we trust the Z-score? Evidence from the European Banking Industry. Global Finance Journal 28: 111–31. [Google Scholar] [CrossRef]
  19. Coelli, Timothy, Dodla Sai Prasada Rao, Christopher J. O’Donnell, and George Edward Battese. 2005. An Introduction to Efficiency and Productivity Analysis, 2nd ed. New York: Springer. ISBN 978-0-7923-8062-7. [Google Scholar]
  20. Dahiyat, Ahmet. 2012. The Application of CAMELS Rating System to Jordanian Brokerage Firms. International Research Journal of Finance and Economics 88: 16–23. [Google Scholar]
  21. Delis, Manthos D., Iftekhar Hasan, and Efthymios G. Tsionas. 2014. The risk of financial intermediaries. Journal of Banking & Finance 44: 1–12. [Google Scholar]
  22. Demir, Nazmi, Syed F. Mahmud, and Senol Babuscu. 2005. The technical inefficiency effects of Turkish banks after financial liberalization. The Developing Economimes 43: 396–411. [Google Scholar] [CrossRef]
  23. Demirbag, Mehmet, McGuinness Martina, Akın Ahmet, Bayyurt Nizamettin, and Basti Eyup. 2016. The professional service firm (PSF) in a globalised economy: A study of the efficiency ofsecurities firms in an emerging market. International Business Review 25: 1089–102. [Google Scholar] [CrossRef] [Green Version]
  24. Dong, Yizhe, Claudia Girardone, and Jing-Ming Kuo. 2017. Governance, efficiency and risk taking in Chinese banking. The British Accounting Review 49: 211–29. [Google Scholar] [CrossRef]
  25. Dyson, Robert G., and Emmanuel Thanassoulis. 1988. Reducing Weight Flexibility in Data Envelopment Analysis. Journal of the Operational Research Society 39: 563–76. [Google Scholar] [CrossRef]
  26. Fiordelisi, Franco, David Marques-Ibanez, and Phil Molyneux. 2011. Efficiency and risk in European banking. Journal of Banking and Finance 35: 1315–26. [Google Scholar] [CrossRef] [Green Version]
  27. Fukuyama, Hirofumi, and Roman Matousek. 2011. Efficiency of Turkish banking: Two-stage network system. Variable returns to scale model. Journal of International Financial Markets 21: 75–91. [Google Scholar] [CrossRef]
  28. Fukuyama, Hirofumi, and William L. Weber. 1999. The efficiency and productivity of Japanese securities firms, 1988–1993. Japan and the World Economy 11: 115–33. [Google Scholar] [CrossRef]
  29. Greenley, Gordon. 1994. Strategic planning and company performance: An appraisal of theempirical evidence. Scandinavian Journal of Management 10: 383–96. [Google Scholar] [CrossRef]
  30. Guillén, Jorge, Rengifo Erick, and Ozsoz Emre. 2014. Relative power and efficiency as a main determinant of banks’ profita-bility in Latin America. Borsa Istanbul Review 142: 119–25. [Google Scholar] [CrossRef] [Green Version]
  31. Hannan, Timothy, and Gerald Hanweck. 1988. Bank Insolvency Risk and the Market for Large Certificates of Deposit. Journal of Money, Credit and Banking 20: 203–11. [Google Scholar] [CrossRef]
  32. Hausman, Jerry A. 1978. Specification Tests in Econometrics. Econometrica 46: 1251–71. [Google Scholar]
  33. Hellmann, Thomas F., Kevin C. Murdock, and Joseph E. Stiglitz. 2000. Liberalization, moral hazard, in banking and prudential regulation: Are capital requirements enough? American Economic Review 90: 147–65. [Google Scholar] [CrossRef] [Green Version]
  34. Hesse, Heiko, and Martin Čihák. 2007. Cooperative Banks and Financial Stability. International Monetary Fund Working Paper, 2. Washington, DC: International Monetary Fund. [Google Scholar]
  35. Hu, Jin-Li, and Chin-Yi Fang. 2010. Do market share and efficiency matter for each other? An application of the zero-sum gains data envelopment analysis. Journal of the Operational Research Society 61: 647–57. [Google Scholar] [CrossRef]
  36. Hu, Jin-Li, and Hsueh-E. Yu. 2015. Risk, capital, and operating efficiency: Evidence from Taiwan’s life insurance market. Emerging Markets Finance and Trade 51: S121–S32. [Google Scholar] [CrossRef]
  37. Hughes, Joseph P., and Choon-Goel Moon. 1995. Measuring Bank Efficiency when Managers Trade Return for Reduced Risk. Working Paper. Newark: Department of Economics, Rutgers University, vol. 20. [Google Scholar]
  38. Hughes, Joseph P., and Loretta J. Mester. 1998. Bank capitalization and cost: Evidence of scale economies in risk management and signaling. The Review of Economics and Statistics 80: 314–25. [Google Scholar] [CrossRef] [Green Version]
  39. Ihsan, Ihsan. 2007. Bank ownership and productivity developments: Evidence from Turkey. Studies in Economics and Finance 24: 115–39. [Google Scholar]
  40. Isik, Ihsan. 2008. Productivity, technology and efficiency of de novo banks: A counter evidence from Turkey. Journal of Multinational Financial Management 18: 427–42. [Google Scholar] [CrossRef]
  41. Kartal, Fikret. 2013. Development of Capital Markets in Turkey and Analysis of Financial Structure of the Intermediary Institutions. Eurasian Journal of Business and Management, Eurasian Publications 1: 1–14. [Google Scholar]
  42. Kwan, Simon, and Robert Allen Eisenbeis. 1997. Bank Risk, Capitalization, and Operating Efficiency. Journal of Financial Services Research 12: 117–31. [Google Scholar] [CrossRef]
  43. Laeven, Luc, and Ross Levine. 2007. Is there a diversification discount in financial conglomerates? Journal of Financial Economics 85: 331–67. [Google Scholar] [CrossRef] [Green Version]
  44. Lee, Dong-Gull, Jabonn Kim, and Hyounggoo Kang. 2014. Do larger brokerage firms enjoy larger economies of scale and scope? Seoul Journal of Economics 27: 445–67. [Google Scholar]
  45. Lee, Tung-Hao, and Shu-Hwa Chih. 2013. Does financial regulation affect the profit efficiency and risk of banks? Evidence from China’s commercial banks. The North American Journal of Economics and Finance 26: 705–24. [Google Scholar] [CrossRef]
  46. Lepetit, Laetitia, and Frank Strobel. 2013. Bank insolvency risk and time-varying Z-score measures. Journal of International Financial Markets Institutions and Money 25: 73–87. [Google Scholar] [CrossRef] [Green Version]
  47. Locurcio, Marco, Morano Pierluigi, Tajani Francesco, and Anelli Debora. 2021. A multi-criteria decision analysis for the assessment of the real estate credit risks. In Appraisal and Valuation. Contemporary Issues and New Frontiers. Cham: Springer, pp. 327–37. [Google Scholar]
  48. Mamatzakis, Emmanuel, and Theodora Bermpei. 2014. What drives investment bank performance? The role of risk, liquidity and fees prior to and during the crisis. International Review of Financial Analysis 35: 102–17. [Google Scholar] [CrossRef] [Green Version]
  49. Mare, Davide Salvatore, Fernando Moreira, and Roberto Rossi. 2017. Nonstationary Z-Score measures. European Journal of Operational Research 260: 348–58. [Google Scholar] [CrossRef] [Green Version]
  50. Mateev, Miroslav, Tarek Nasr, and Ahmad Sahyouni. 2022. Capital regulation, market power and bank risk-taking in the MENA region: New evidence for Islamic and conventional banks. The Quarterly Review of Economics and Finance 86: 134–55. [Google Scholar] [CrossRef]
  51. Radic, Nemanja, Franco Fiordelisi, and Claudia Girardone. 2012. Efficiency and risk-taking in pre-crisis in- vestment banks. Journal of Financial Services Research 41: 81–101. [Google Scholar] [CrossRef] [Green Version]
  52. Rime, Bertrand. 2001. Capital requirements and bank behavior: Empirical evidence for Switzerland. Journal of Banking and Finance 25: 789–805. [Google Scholar] [CrossRef] [Green Version]
  53. Saeed, Momna, and Marwan Izzeldin. 2016. Examining the relationship between default risk and efficiency in Islamic and conventional banks. Journal of Economic Behavior & Organization 132: 127–54. [Google Scholar]
  54. Saeed, Momna, Marwan Izzeldin, M. Kabir Hassan, and Vasileios Pappas. 2020. The inter-temporal relationship between risk, capital and efficiency: The case of Islamic and conventional banks. Pacific-Basin Finance Journal 62: 101328. [Google Scholar] [CrossRef]
  55. Sahut, Jean-Michel, and Mehdi Mili. 2011. Banking distress in MENA countries and the role of mergers as a strategic policy to resolve distress. Economic Modelling 28: 138–46. [Google Scholar] [CrossRef]
  56. Sealey, Calvin W., and James T. Lindley. 1977. Inputs, Outputs, and a Theory of Production and Cost at Depository Financial Institutions. Journal of Finance 32: 1251–66. [Google Scholar] [CrossRef]
  57. Seiford, Lawrence, and Robert Thrall. 1990. Recent developments in DEA: The mathematical programming approach to frontier analysis. Journal of Econometrics 46: 7–38. [Google Scholar] [CrossRef]
  58. Shrader, Charles, Lew Taylor, and Dan R. Dalton. 1984. Strategic planning and organisational performance: A critical review. Journal of Management 10: 149–71. [Google Scholar] [CrossRef]
  59. Shrieves, Ronald E., and Drew Dahl. 1990. The impact of regulation on bank equity infusions. Journal of Banking and Finance 14: 1920–28. [Google Scholar]
  60. Tan, Yong, and Christos Floros. 2013. Risk, capital and efficiency in Chinese banking. Journal of International Financial Markets, Institutions & Money 26: 378–93. [Google Scholar]
  61. TCMA. 2009. Turkish Economy & Capital Markets, 1st ed. Istanbul: Turkish Capital Markets Association Publication. ISBN 978-975-6483-23-7. [Google Scholar]
  62. Van Anh, Do. 2022. Does better capitalization enhance bank efficiency and limit risk taking? Evidence from ASEAN commercial banks. Global Finance Journal 53: 100617. [Google Scholar] [CrossRef]
  63. Vander, Vennet. 2002. Cost and profit efficiency of financial conglomerates and universal banks in Europe. Journal of Money, Credit, and Banking 34: 254–82. [Google Scholar]
  64. Wall, Larry D., and David R. Peterson. 1988. Capital changes at large affiliated banks. Journal of Financial Services Research 1: 253–75. [Google Scholar] [CrossRef]
  65. Wang, Kuo-Liang, Yu-Ting Tseng, and Chia-Hsiang Weng. 2003. A study of production efficiencies of integrated securities firms in Taiwan. Applied Financial Economics 13: 159–67. [Google Scholar] [CrossRef]
  66. Wild, Joerg. 2016. Efficiency and risk convergence of Eurozone financial markets. Research in International Business and Finance 36: 196–211. [Google Scholar] [CrossRef] [Green Version]
  67. Williams, Jonathan. 2004. Determining management behaviour in European banking. Journal of Banking and Finance 28: 2427–60. [Google Scholar] [CrossRef]
  68. Yeyati, Eduardo Levy, and Alejandro Micco. 2007. Concentration and foreign penetration in Latin American banking sectors: Impact on competition and risk. Journal of Banking & Finance 31: 1633–47. [Google Scholar]
  69. Zhang, Wei David, Shuo Zhang, and Xueming Luo. 2006. Technological progress, inefficiency, and productivity growth in the US securities industry, 1980–2000. Journal of Business Research 59: 589–94. [Google Scholar] [CrossRef]
  70. Zopounidis, Constantin, Emilios Galariotis, Michael Doumpos, Stavroula Sarri, and Kostas Andriosopoulos. 2015. Multiple criteria decision aiding for finance: An updated bibliographic survey. European Journal of Operational Research 247: 339–48. [Google Scholar] [CrossRef]
Figure 1. The Methodological Framework.
Ijfs 10 00110 g001
Figure 2. DEA Efficiency Scores.
Ijfs 10 00110 g002
Figure 3. Risk Scores.
Ijfs 10 00110 g003
Table 1. Literature matrix for studies measuring efficiency/performance of securities firms.
ReferencesTime HorizonCountryMethodologyConclusion
Fukuyama and Weber (1999)1988–1993JapanDEA + Malmquest Index (compared efficiency change during the research period)Input
-Labor (number)
-Physical capital
Output
-Brokerage revenue
Underwriting revenue
Big four securities companies were more cost-efficient than smaller ones. Overall cost efficiency remained constant during the research period (1988–1993).
Wang et al. (2003)1991–1993TaiwanDEA + Tobit (for examining the relationship between each efficiency measure and firm specific attributes—i.e., firm size, service composition, having branch)Input
-Labor (number)
-Capital (floor area of office)
Output
-Brokerage revenue-Equity-dealing revenue
-Underwriting revenue
The authors reported that smaller regional firms experienced large decreases in both efficiency and productivity. They also mentioned that the firm size had a positive impact on efficiency scores due to the existence of scale economies and the advantage from joint use of inputs.
Chen et al. (2005)1999–2000ChinaRatio Analysis + Regression analysis (profitability (ROE) as dependent variable and leverage, asset size, and government ownership as independent variables)Results showed that direct investment from the government will reduce a firm’s profitability. The authors suggested to reduce state ownership in this industry, which may lead to better corporate governance and improved financial performance in the long run.
Zhang et al. (2006)1980–2000USADEA + Malmquest Index (compared efficiency change during the research period)Input
-Labor (compensation)
-Fixed assets (non-labor, non-interest expense)
-Equity
Output (Revenue)
-Brokerage
-Market making
-Corporate finance
-Asset management
-Total
Results indicated that the US securities industry in general is quite cross-sectionally inefficient. The relative productivity of the US securities industry in general declined. They also stated that smaller regional firms, due to their inability to respond to technological innovation, were less efficient.
Hu and Fang (2010)2001–2005TaiwanDEA (maximizing the market share to analyze the competition among securities firms in Taiwan)Input
-Labor (number)
-Financial capital
Output
-Market share
The empirical results indicated that firms with larger market shares achieved higher efficiency scores. The authors suggested that mergers among large-sized financial institutions should be encouraged in order to increase market shares and efficiency scores.
Aktas and Kargin (2007)2000–2005TurkeyDEA + Malmquest Index (compared efficiency change during the research period)Input
-Equity
-Operating industry
Output
-Equity transactions
-Brokerage commissions
Results showed that larger firms were more efficient. The efficiency decreased overall during the research period.
Lee et al. (2014)2000–2007KoreaEstimation with Cobb–Douglas (hybrid, translog, and quadratic cost functions used separately) production function
(commission revenue determined by multiplying the commission rates with the total service amount for different service types; i.e., brokerage, prop trading, and wealth management)
Results showed that the firms broadly achieved economies of scale and substantially benefitted from the economies of scope. The authors posited that larger securities firms may benefit from M&A due to the economy of scale.
Table 2. Literature matrix for studies examining banks’ efficiency, risk, and capital.
ReferencesBanking Sectors InvestigatedTime HorizonMethodologyVariablesEmprical Results
Mamatzakis and Bermpei (2014)97 banks from G7 and Switzerland1997–2010Stochastic frontier analysis and dynamic panel threshold analysisSFA; input: personal exp/assets, operating expense/fixed assets; output: investment bank fee; fixed netput: equity; assets
Control variables: Z-score, liquidity/assets, and other control variables (equity/assets, securities/assets, income diver., GDP per capita, stock index, exchange rate, VIX index)
Results suggested a positive impact of Z-score on bank performance. Liquidity had a negative effect on bank efficiency.
Fiordelisi et al. (2011)1987 banks from EU-261995–2007Granger-causality techniques to investigate the relationship between bank risk, capital, and efficiency and GMMRisk: EDF (Moody’s KMV) + NPL/loan
Efficiency: SFA-input: labor, capital, fixed assets; output: deposits, loans, other earnings
Cap: Equity/assets and other control variables (income diver., asset size, HHI, GDP precipitate, GDP growth rate)
They showed that lower bank efficiency Granger-causes higher bank risk. They also found an increase in bank capital preceded cost efficiency improvements.
Tan and Floros (2013)101 banks in China2003–2009Three-stage least-squares estimation of banks’ efficiency; capital, and risk takingRisk: ROE volatility; Z-score, NPL/loan
Efficiency: DEA-input: equity, personal expense; output: loans, securities, non-interest income)
Cap: Equity/assets
Control variables: ROA, loan/asset, assets, revenue/labor Mcap/GDP, Inflation, GDP Growth)
There was a significant and negative relationship between risk (Z-score) and capitalization. The findings suggested that higher liquidity was associated with lower efficiency.
Delis et al. (2014)8000 banks in the USA1985 Q1–2012 Q4They modeled risk as the variance in profit where the variance was a multiplicative component of the error termRisk: risk-weighted assets/assets, NPL/loan, Z-score, coefficient of variation
Efficiency: DEA input: Pers. exps./expenses, int. exp./deposits, fixed-asset exp./expenses;
output: profits, loans;
Control variables: equity/assets, liquid assets/assets, cost/income, int. rates)
Proposed model was able to capture the increase risk in the US banking sector after 2000. Furthermore, larger banks were riskier after 2004. The findings showed that their measure was a good proxy of banks’ default risk.
Wild (2016)38,000 banks in 38 Eurozone countries1999–2012Beta and sigma convergence with GMM, fixed-effect estimation and OLSEfficiency: DEA-input: pers. exps., fixed assets, deposits output: loans, int. income; other inc.
SFA input: loans, securities; output: wages, int. cost, fixed assets
Risk: Z-score, capital/assets
For commercial banks, an efficiency convergence of both metrics was found. Savings banks showed no signs of convergence and cooperative banks only showed signs of SFA convergence.
Saeed et al. (2020)65 Islamic and 180 conventional banks in 14 countries2004–2016Seemingly unrelated regression (SUR) on banks’ efficiency, capital, and risk takingRisk: Z-score, CAP = equity/assets
SFA: input: capital, labor; output: loans, deposits
Control variables: M2/GDP, Mcap/GDP, inflation, asset size, ROE, concentration (3 large banks), etc.
The capitalization response to increases in insolvency risk was more pronounced for Islamic banks. While efficiency and risk were inversely proportional for conv. banks, it was the opposite for Islamic banks.
Van Anh (2022)146 banks in 5 ASEAN countries2005–2015Panel vector autoregression analysisRisk: Z-score, CAP = equity/assets
SFA: input: capital, labor. fund; output: loans, other earnings, credit/GDP
Control variables: GDP frowth, GDP per capita, inflation, concentration (5 large banks)
Better-capitalized banks in ASEAN countries were more efficient and took on less credit risk. Capital consistently influenced cost efficiency across banks with different ownership and sizes, and before and after the 2008 crisis.
Mateev et al. (2022)225 banks in 18 MENA countries2005–2018Unbalanced
dynamic panel model
Risk: Z-score, loan loss/total loan, ROE volat.; CAP = cap. adeq. ratio, Tier 1, equity/assets
Efficiency ROA, net int. margin, cost/income
Control variables: deposits/credit, size, income diversity, noninterest inc., GDP growth, inf.
Capital ratio had a strong positive impact on the credit risk of conventional banks, whereas this effect was insignificant in the sample of Islamic banks. Relationship between capital ratio and credit risk was not moderated by market competitive condition.
Z-Score for the Assessment of Banks’ Risk
Boyd et al. (2006)2500 banks in the USA and 2700 banks in 134 other countries1993–2004OLS and fixed-effect estimator GMMZ-Score, HHI index, and other control variables (asset size, non-interest cost/operating income, Mcap, labor force, unemployment rate)More competition was associated with lower probability of failure (higher Z-score). There was a positive relationship between competition and asset allocation (lending more).
Yeyati and Micco (2007)3000 banks from 8 countries in Latin America1993–2005OLS and weighted least-squares estimationZ-score, HHI index, and other control variables (asset size, ROA, equity/assets, deposits/assets, other income/assets, interest rates, inflation)Foreign penetration weakened banking competition. There was a negative relationship between foreign penetration and risk.
Hesse and Čihák (2007)16,000+ banks from 29 countries1998–2008OLS and fixed-effect estimator GMMZ-score and control variables (asset size, loans/assets, cost/income, income div., HHI, GDP growth, inflation, exchange rates, int. rates)Higher Z-scores were linked with a higher stability.
Lepetit and Strobel (2013)15,000 banks from G-20 countries1992–2009Compared different approaches to the construction of the Z-score with simple root-mean-squares error criteriaZ-score and its componentsTime-varying Z-score measures best fit the data.
Table 3. BCC and CCR DEA models.
BCCCCREquation No.
Objective functionminθ, λ θminθ, λ θ(1)
Subjected to:−yi + Y λ ≥0−yi + Y λ ≥ 0(2)
θxi − X λ ≥ 0θxi − X λ ≥ 0(3)
λ ≥ 0λ ≥ 0(4)
N1′λ = 1(5)
Where θ is a scalar, λ is N × 1 vector of constants, Y represents all input and output data for N firms, and xi and yi are the individual i-th firm’s (decision-making unit) input and output, respectively. The θ is an efficiency score for each firm that takes a value between 0 and 1. In this form, the most favorable weight set for “i” was chosen, which minimized the weighted sum of the input of xi.
Table 4. Calculated risk weights of assets for securities firms.
AccountRisk Weights (%)
Financial assets
 Shares (listed)20
 Shares (non-listed)50
 Corporate bonds
  >1 year10
  <1 year50
 Public bonds
  >1 year5
  <1 year10
Subsidiaries30
Short-term trade receivables50
Short-term other receivables30
Long-term trade and other receivables 50
Short-term liabilities5
Long-term liabilities10
Table 5. Description of variables used in the study.
VariablesAcronymDefinition
Position riskPosition risk Ratio of risk-weighted assets to capital
Default riskZ-scoreRatio between the return on assets plus capital/total assets and the standard deviation of the return on assets
Operational efficiency CCR EFF (opr.)Technical efficiency scores derived from operational data
BCC EFF (opr.)Pure technical efficiency scores derived from operational data
Scale EFF (opr.)Scale efficiency scores derived from operational data
Financial efficiencyCCR Eff (fin.)Technical efficiency scores derived from financial tables
BCC EFF (fin.)Pure technical efficiency scores derived from financial tables
Scale EFF (fin.)Scale efficiency scores derived from financial tables
Man. EFFRatio of operational expenses to operational income
CapitalCAPBook value of capital to total assets
Firm-specific variables
SizeSizeLogarithm of total assets
GrowthGrowthGrowth rate of total assets
ProfitabilityROEReturn on equity
Business modelInc. dıv.Ratio of non-brokerage income to total income
Labour productivity LPRatio of gross total revenue to total number of employees
Qualified employeesLaborThe number of staff that hold the related capital markets licenses for market professionals
Sector specific variables
Market designHHI Herfindahl–Hirschman Index of total trading volume
Market size McapLogarithm of total market capitalization of the exchange
Macroeconomic
InflationIRAnnual inflation rate
GDP growthGDPGAnnual GDP growth rate
Note: firm-specific variables (including risk and capital) are from the TCMA and Public Disclosure Platform. Industry-specific variables are from Borsa İstanbul. Macroeconomic variables are from the Turkish Statistical Institute (TurkStat).
Table 6. Summary of Statistics of Variables (2004 Q1–2021 Q4).
MeanS.D.MinMax.
Risk
Position risk (%)47.693.49.8118.9
Z-score44.221.66.5114.8
Operational Efficiency (%)
CCR Eff (opr.)56.529.821.1100
BCC EFF (opr.)84.526.914.9100
Scale EFF (opr.)66.130.218.6100
Financial Efficiency (%)
CCR Eff (fin.)49.225.919.4100
BCC EFF (fin.)73.523.413.9100
Scale EFF (fin.)67.026.220.3100
Managerial Efficiency (%)
Op. Income/Op. Expense98.250.628.8146.2
Capital
Equity to Total Assets45.064.430.884.9
Firm-Specific Variables
Assets (ln)16.91.613.818.9
Growth of assets (%)44.298.2−53.5218
Return on equity (%)8.414.4−3.649.7
Income diversification (%)40.422.47.287.6
Income per person (normalized)37.519.87.482.5
Qualified staff ratio (%)12.512.40.017.9
Sector-Specific Variables
HHI (trading volume)48.927.19.6106.0
Mcap (ln)12.615.31.513.4
Macroeconomics
GDPG5.34.0−4.711.1
IR9.43.44.025.2
Table 7. Correlation matrix of variables.
123456789101112131415161718
Position risk1100.0
Z-score218.1 *100.0
CCR EFF (fin.)315.2 *−39.9 *100.0
BCC EFF (fin.)414.9 *−40.7 **49.6100.0
Scale EFF (fin.)517.2−34.6 *45.250.0100.0
CCR EFF (opr.)624.4 *−16.4 *20.743.3 **50.2 **100.0
BCC EFF (opr.)712.2 *−36.210.039.6 *42.1 *28.9100.0
Scale EFF (opr.)814.1−42.0 *11.646.048.9 **33.632.7100.0
Man. EFF923.6−15.2 *10.711.6 **22.014.6 **78.262.6 *100.0
CAP10−44.0 **−15.1 *1.21.53.86.8 *31.7 *25.4 *6.8 **100.0
SizeSize27.6 **21.2−64.449.0 *42.1−12.8 *−20.3−16.2 *−12.8−19.2100.0
Inc. dıv.1228.98.422.928.827.732.246.437.132.247.4−17.3100.0
Growth13−1.8−4.931.728.2 *10.2 *−15.2 *−9.2 *−7.4−15.234.2 **−37.9 *49.2 **100.0
Labor1411.3 **−9.23.1−4.2−12.3 *2.75.04.0 *2.7 **−4.01.50.4 **−6.1 *100.0
LP152.7 *−16.9 **6.3−7.97.6 **15.5 **7.35.8 **−15.5 *17.43.331.9 *11.2 *−2.1100.0
ROE16−14.1 **30.4 **4.726.733.630.126.4 *21.127.240.0 *12.2 **1.819.228.434.6100.0
HHI172.43.12.9 *8.215.6 *47.57.1 **3.76.8 **4.420.07.72.56.2 *29.828.4100.0
Mcap1819.3 *25.40.61.2 *2.7 *6.316.2 *13.012.3 **3.5−1.2 *4.429.4 **1.2 *0.01.6 *−4.6 **100.0
Multicollinearity Diagnostic Statistics
Vari. inflation factor1.081.091.341.2301.421.361.191.801.101.211.283.141.321.491.291.091.701.131.70
Tolerance values0.990.920.750.850.980.940.880.920.880.830.820.310.750.700.770.920.650.820.68
* Correlation was significant at 5%; ** correlation was significant at 1%.
Table 8. Three-stage least-squares estimation of the relationship between securities firms’ capital, risk, and operational efficiency.
8a. Model in which Risk = Position Risk8b. Model in which Risk = Z-score
DV: EfficiencyDV: RiskDV: CapitalDV: EfficiencyDV: RiskDV: Capital
Equation (1) Y = BCC EFF (opr.)Equation (2) Y = RiskEquation (3) Y = CAPEquation (1) Y = BCC EFF (opr.)Equation (2) Y = Risk Equation (3) Y = CAP
Risk12.24 ** (0.35) 11.17 *** (8.07)0.123 (0.18) 8.66 * (1.10)
EFF 19.17 ** (−0.4)4.82 (1.05) 5.22 ** (2.11)23.66 ** (1.43)
CAP0.03 ** (1.79)34.08 *** (8.07) 0.002 (1.43)6.817 ** (1.10)
ROE7.32 ** (0.41)−15.66 * (−0.84)−6.18 (−0.14)7.12 ** (0.13)−7.06 (0.81)−27.12 (−0.64)
Size7.032 (7.23)3.27 ** (2.13)8.38 ** (1.35)0.03 *** (7.69)12.001 ** (2.23)−1.02 ***(−3.80)
Growth−0.28 * (−2.85)−0.29 (0.82)9.19 **(2.48)−2.02 *** (−3.58)0.9601 * (−1.66)−0.04 (−1.18)
Inc. Div. (%)3.05 ** (3.22)−7.68 * (0.21)5.09 ** (1.51)−1.04 *** (−2.68)5636 (−0.39)−0.903 (−1.04)
LP−1.25 ** (−1.08)3.02 (0.28)3.75 (1.47)9.013 ** (0.27)0.96 ** (2.33)3.62 (1.54)
Labour2.03 ** (1.79)15.13 ***(4.01)−0.902 (−1.07)1.81 * (1.93)0.112 (0.12)−34.42 (−0.58)
HHI−1.019 *** (−2.60)−3.13 (−0.42)0.57 (1.43)−1.018 *** (−2.80)7.82 * (−0.91)0.902 ** (2.21)
Mcap1.13 **(1.17)2.87 ** (2.03)7.64 (0.75)1.82 *(1.78)−0.0055 (−0.30)26.12 ** (2.54)
GDPG0.02 * (1.77)−0.003 ** (−2.13)−0.08 (−0.12)0.014 (1.30)297.63 (1.10)−0.1 (−0.16)
IR0.001 (0.13)−0.0005 (−0.62)0.396 (0.91)0.001 (0.14)347.5 * (1.96)−0.094 (−0.23)
Constant1.23 ** (2.49)−18.319 (−1.54)−18.18 (−0.65)1.4 *** (3.15)0.026 (0.52)61.55 ** (−2.18)
No of Obs.557555755575557555755575
Chi2906.86 ***1040.14 ***1238.32 ***112.55 ***77.55 **60.22 ***
R2 (Overall)37.6953.1844.4516.8237.6934.11
Note: The table reports the estimation results (t-statistics) for Equations (7)–(9) using a three-stage least-squares estimation. Specifically, we used the position risk (risk-weighted assets ratio) calculated as in Table 4 as the risk indicator in Table 8a and the Z-score derived from Equation (6) in Table 8b as the risk indicator. * Statistical significance at the 10% level; ** statistical significance at the 5% level; *** statistical significance at the 1% level. DV: dependent variable.
Table 9. Three-stage least-squares estimation of the relationship between securities firms’ capital, risk, and financial efficiency.
9a. Model in which Risk = Position Risk9b. Model in which Risk = Z-score
DV: EfficiencyDV: RiskDV: CapitalDV: EfficiencyDV: RiskDV: Capital
Equation (1) Y = BCC EFF (fin.)Equation (2) Y = RiskEquation (3) Y = CAPEquation (1) Y = BCC EFF (fin.)Equation (2) Y = RiskEquation (3) Y = Capital
Risk9.57 ** (0.27) 7.32 (1,04)0.875 ** (1.37) 18.45 ** (1.11)
EFF 15.147 ** (5.13)6.79 *** (1.45) 4.096 (1.65) **10.566 (1.42)
CAP2.39 *** (2.18)41.01 ** (9.04) 0.251 (0.37)2.216 (5.10) *
ROE4.93 ***(5.41)−28.35 * (−0.80)2.14 (5.12)---
Size−1.27 (0.26)9.03 *** (9.45)5.48 * (7.23)0.32 ** (0.41)9.39 **(3.27)4.45 ** (7.89)
Growth−0.1 * (−1.15)−0.001 (−0.15)−1.28 (1.58)−7.032 (7.23)1.134 (0.55)0.16 (−3.45)
Inc. Div. (%)2.17 **(2.22)0.2 (0.09)1.82 ** (1.76)3.05 *** (3.22)4.396 * (2.15)−29.03 (−0.49)
LP1.97 ***(0.98)2.154 ** (0.27)2.95 ** (2.13)1.14 ***(4.10)5.64 (1.18)0.89 ** (2.18)
Labour3.79 * (1.03)4.21 ** (1.04)6.37 ** (4.52)1.81 * (−1.93)0.0005 (0.987)26.26 ** (2.55)
HHI−0.196 (−1.18)−0.054 (0.53)0.89 ** (2.18)−8.885 (−60)9.53 * (−1.87)−0.93 (−1.06)
Mcap1.21 ** (0.47)−0.163 (−0.88)26.26 (2.55)2.73 ** (0.47)−0.5(0.97)20.375 (5.98)
GDPG−0.0002 (−0.30)−5.88 (−0.74)−0.007 (−0.35)2.17 (0.18)0.02 (0.26)0.42 (0.97)
IR0.005 (0.34)349.78 ** (1.98)−0.09 (−0.22)7.57 (0.28)237 (8.57)0.103 (0.16)
Constant1.39 *** (3.17)−3.16 (−0.45)−61.36 **(−2.18)3.14 *** (1.5)8.6 (7.5)−61.36 ** (−2.18)
No of Obs.557555755575557555755575
Chi2116.32 *60.05 *112.52 **87.78 ***60.489 **37.05 ***
R2 (Overall)30.1242.5435.5619.5339.3923.18
Note: the table reports the estimation results (t-statistics) for Equations (7)–(9) using a three-stage least-squares estimation. Specifically, we used the position risk (risk-weighted assets ratio) calculated as in Table 4 as the risk indicator in Table 9a and used the Z-score derived from Equation (6) in Table 9b as the risk indicator. * Statistical significance at the 10% level; ** statistical significance at the 5% level; *** statistical significance at the 1% level. DV: dependent variable.
Publisher’s Note: MDPI stays neutral with regard to jurisdictional claims in published maps and institutional affiliations.

