Article

ICT as a Key Determinant of Efficiency: A Bootstrap-Censored Quantile Regression (BCQR) Analysis for Vietnamese Banks

1
Institute for Development and Research in Banking Technology, University of Economics and Law, Ho Chi Minh City 700000, Vietnam
2
Vietnam National University, Ho Chi Minh City 700000, Vietnam
3
School of Aviation, Massey University, Palmerston North 4442, New Zealand
4
University of Economics & Business, Vietnam National University, Hanoi 100000, Vietnam
*
Authors to whom correspondence should be addressed.
Int. J. Financial Stud. 2022, 10(2), 44; https://doi.org/10.3390/ijfs10020044
Submission received: 11 May 2022 / Revised: 13 June 2022 / Accepted: 13 June 2022 / Published: 16 June 2022

Abstract

:
There is evidence that ICT developments can improve bank efficiency and performance. Previous studies often employ data envelopment analysis (DEA) to first examine bank performance and then use a second-stage regression to explain the influences of other environmental factors, including ICT, on such efficiency. Since DEA efficiency scores are bounded between the (0, 1] intervals, Tobit and truncated regressions are commonly used in this stage. However, none has accounted for the skewness characteristic of DEA efficiency. This paper applied a bootstrap-censored quantile regression (BCQR) approach to triply account for the issues of a small sample (via bootstrap), bounded intervals (via censored regression), and skewness (via quantile regression) in DEA analysis. We empirically examined the efficiency and performance of 27 Vietnamese commercial banks in the 2007–2019 period. The efficiency scores derived from our first stage revealed that they are skewed and thus, justify the use of the BCQR in the second stage. The BCQR results further confirmed that ICT developments could enhance bank efficiency, which supports the recent policy to restructure the Vietnamese banking sector toward innovation and digitalization. We also examined the impacts of other factors such as bank ownership, credit risk, and bank size on efficiency.

1. Introduction

Banking efficiency is a long-term topic for many researchers (Tripe 2010; Aiello and Bonanno 2016; Boubaker et al. 2022; Le et al. 2022b). While it is important to analyse how efficient a bank or banking system is; however, it is even more important to examine the determinants that can influence such efficiency and performance (Simar and Wilson 2007; Gardener et al. 2011; Dao et al. 2021). In modern banking, the role of information, technology, and communication (ICT) is becoming more important and thus, ICT is receiving more attention (Berger and DeYoung 2006; Salim et al. 2010; Arora and Arora 2013; Girmaye 2018).
On one hand, it is argued that technological developments for ICT can positively improve bank profitability and productivity (DeYoung 2001; Berger and DeYoung 2006; Beccalli 2007; Ho and Mallick 2010; Arora and Arora 2013)—such developments include, but not limited to, investments on computer hardware and software (e.g., computers, printers, operating systems, and applications), computer services (e.g., web hosting, data processing services, and networks), communication services (e.g., voice and data services), and communication equipment. On the other hand, the specific developments of ICT including electronic banking applications and Automated Teller Machines (ATMs) can also influence the bank’s operational and financial performance (Holden and El-Bannany 2004; Hernando and Nieto 2007; Ciciretti et al. 2009; Sathye and Sathye 2017).
Most previous studies employed data envelopment analysis (DEA), a nonparametric approach of efficiency measurement, to examine bank efficiency and performance (Dong et al. 2014; Sathye and Sathye 2017; Hammami et al. 2020; Ho et al. 2021), because such approach is suitable for small sample sizes and is more flexible for the complicated setting of the banking industry (Berger and Humphrey 1997; Ngo and Le 2019; Boubaker et al. 2020). It is also important to not only stop at analysing banking efficiency but to also examine its determinants (Vidal-García et al. 2018; Ngo and Tsui 2020; Dao et al. 2021), whereas a second-stage regression is often conducted to explain the influences of other environmental factors, including ICT, on such efficiency (Berger and Mester 1997; Simar and Wilson 2007; Salim et al. 2010; Sathye and Sathye 2017; Boubaker et al. 2018). Since DEA efficiency scores are bounded between the (0, 1] intervals, those studies mostly relied on the use of Tobit or truncated regressions in this second stage (Simar and Wilson 2007). While it is acknowledged that those scores are also skewed (Sowlati and Paradi 2004; Gajewski et al. 2009; Santín and Sicilia 2017), however, none of the previous studies has accounted for such skewness characteristic of DEA efficiency. To fill in this research gap, this paper therefore applies a bootstrap-censored quantile regression (BCQR) approach to triply account for the issues of a small sample (via bootstrap), bounded intervals (via censored regression), and skewness (via quantile regression). As such, this paper does not only contribute to the existing banking efficiency literature in terms of methodology but also can provide more robust results regarding the determinants of bank efficiency—such results will be of important to bank managers and policymakers.
The empirical analysis of this study utilised an unbalanced dataset consisting of 27 commercial banks operating in Vietnam during the 2007–2019 period. We select this sample because (i) the number of studies on the Vietnamese banking sector is still limited (Ho et al. 2021), (ii) ICT plays an important role in improving banking efficiency in emerging markets such as Vietnam (Arora and Arora 2013; Sathye and Sathye 2017; Ngo and Le 2022), and (iii) there is clear evidence that the DEA efficiency scores of the sampled banks are skewed (the details are presented in Section 4.1). Results from our BCQR estimations show that ICT development, including the ones on information technology infrastructure, human-related information technology, and strategies and policies regarding ICT implementations, can enhance bank efficiency.
The rest of the paper is constructed as follows. We first present a brief literature review of the recent studies on the role of ICT in bank performance in Section 2. We then describe the methods of DEA and BCQR in Section 3, alongside the relevant data and variables of interest. The results are presented and discussed in Section 4, while Section 5 concludes the paper.

2. Literature Review

Although there is a vast literature on the determinants of bank efficiency (Berger and Mester 1997; Simar and Wilson 2007; Salim et al. 2010; Sathye and Sathye 2017), empirical evidence on the role of ICT is still limited and only started to grow in the recent years (Scott et al. 2017; Appiahene et al. 2019; Dinçer and Yüksel 2020). According to Le and Ngo (2020) and Ngo and Le (2022), there are two main streams regarding such ICT examinations.
In the first stream, the topic of interest is the impacts of technological infrastructure and developments on bank performance. Most of those studies found that ICT developments can reduce bank costs and/or improve bank profits efficiency (Berger and DeYoung 2006; Salim et al. 2010; Girmaye 2018). For instance, Berger and DeYoung (2006) suggested that ICT helps US banks reduce agency costs, which makes banking services become more approachable to the customers and consequently increases bank profits. Further examinations of US banks by Beccalli (2007) and Arora and Arora (2013) also found that ICT outsourcing can improve their profit efficiency. Similar argument applies to commercial banks in Asia (Dinçer and Yüksel 2020), Australia (Salim et al. 2010), Ghana (Appiahene et al. 2019), India (Arora and Arora 2013), and Europe (Simper et al. 2019). Few studies, however, found the contrast. They provided the evidence that ICT investments did not help Spanish banks improve their profits during the 1983–20003 period (Martín-Oliver and Salas-Fumás 2008). Meanwhile, Ho and Mallick (2010) argued that the adoption and diffusion of ICT can lead to a negative network competition effect in the US banking system, which hinders their productivity and performance.
In the second stream, the focus is on the ICT-based services and applications such as phone banking, internet banking, and Automated Teller Machines (ATMs). Generally, it is argued that electronic banking services help improve bank performance (Hernando and Nieto 2007; Ciciretti et al. 2009; Weigelt and Sarkar 2012), ATMs help increase bank profitability (Holden and El-Bannany 2004; Le and Ngo 2020), while the combination of electronic payments and ATMs helps reduce bank costs (Valverde and Humphrey 2009). Such evidence is found in Bangladesh (Siddik et al. 2016), Lebanon (Chedrawi et al. 2019), the Europe (Akhisar et al. 2015; Tunay et al. 2015), Vietnam (Ngo and Le 2022), or even in a global context (Le and Ngo 2020). Conflicting results, however, are occasionally found, as in the study of DeYoung (2001), whereas internet-based US banks tended to earn lower non-interest income and profits, compared to their counterparts. Sathye and Sathye (2017) found that Indian banks with higher ATM intensity are associated with lower profitability due to the higher cost of investment.
Nevertheless, the debate on the impacts of ICT on bank efficiency and performance is still inconclusive. Addition empirical evidence, especially from emerging markets such as Vietnam, where the banking sector has been rapidly expanded with the help of ICT developments, is therefore important. We further argue that a possible reason for such inconclusive result may be due to the use of mean regression method (detailed discussions are in Section 3.2 below). We therefor apply a more robust method of BCQR for our analysis—such method is explained in the next section.

3. Methodologies and Data

3.1. The First Stage: Evaluating Bank Efficiency Using Data Envelopment Analysis

The basic DEA model considers a set of n banks, with each bank j ( j = 1 ,   ,   n ) using m inputs x i j ( i = 1 ,   ,   m ) to produce k outputs y r j ( r = 1 ,   ,   k ). Its objective is to assign the optimal weights for those inputs and outputs for each bank j0-th such that the bank’s efficiency score ( E F j 0 ) as in Equation (1) below is maximized.
E F j 0 = m a x u , v r m u r y r j 0 i k v i x i j 0 Subject   to , r m u r y r j i k v i x i j     1 ,   j ,   j = 1 ,   2 ,   ,   n u r ,   v i     ε ,   i ,   r
where E F j 0 is the efficiency score of the bank j0 (j = 1, 2, …, n) under examination; ur is the optimal weight assigned to the output yr (r = 1, 2, …, m) of the bank j0; vi is the optimal weight assigned to the input xi (i = 1, 2, …, k) of the bank j0; and ε is a non-Archimedean value designed to enforce positivity on those weights.
It is noted that Equation (1) examines the sampled banks under the constant returns to scale assumption (Charnes et al. 1978); one may set up the DEA optimization problem under different settings such as the variable returns to scale assumption (Banker et al. 1984), the super-efficiency model (Avkiran 2011), or the slack-based measure (Tone 2001)—readers are encouraged to look for more information from the mentioned literature and the references therein. This study, however, follows the approach of Hammami et al. (2020) and Ngo and Le (2022) to impose an Euclidean common set of weights (ECSW) for all banks in the sample since it allows for the comparison of those banks under the same facet, rather than allowing different banks to have different weights—such situation may bias the process of examining the determinants of bank efficiency in the second stage analysis. For instance, we may have two banks, of which the first one can reach its optimal efficiency by utilising more employees whilst the second bank may be best using more operating expenses/capital. Since the impacts of ICT on the two factors (i.e., number of employees and amount of operating expenses) are clearly different, hence, its influences on the banks’ efficiency are also different. With a common set of weights, the efficiency of those banks is evaluated consistently (among banks and among the inputs/outputs) so that the regression analysis can provide better insights. To save space, we briefly explain the algorithm of the ECSW methodology used in this study—their details are available in the original work of Hammami et al. (2020). The algorithm of ECSW is as follows.
Step 1: Use the slack-based measure of DEA (Tone 2001), or any relevant DEA model, to estimate the (independent) optimal weights for each bank in the sample. In a Euclidean space, one can compute and define the optimal position of each bank based on those optimal weights and the relevant data of the bank’s inputs and outputs.
Step 2: Start with an arbitrary ECSW. For each bank, compute the Euclidean distance between its optimal position (derived from Step 1) and the virtual position resulting from using the ECSW and its actual data of inputs/outputs. The ECSW that can minimize the sum of all Euclidean distances is the optimal ECSW.

3.2. The Second Stage: Using Bootstrap-Censored Quantile Regression (BCQR) to Examine the Determinants of DEA Efficiency

As discussed earlier, the ECSW efficiency scores are more suitable for the next step of determinants analysis. Our second stage is therefore to examine the impacts of ICT and its components on those ECSW efficiency. Such second-stage is popular in the banking efficiency literature (Berger and Mester 1997; Simar and Wilson 2007; Salim et al. 2010; Sathye and Sathye 2017), with most studies using the Ordinary Least Square (OLS), Tobit, and truncated regressions for their analysis. However, the Tobit and truncated regressions are often considered more appropriate than the OLS (Aiello and Bonanno 2016; Ngo and Tsui 2020; Dao et al. 2021) because they can account for the censored/truncated characteristic of the DEA efficiency scores derived from the first stage: by definition, such scores are bounded between the (0, 1] intervals (see Equation (1)). Simar and Wilson (2007) further argued that one should also utilize a bootstrap procedure to overcome the issue of a small sample size (it is common that the banking sector in a country has less than 30 banks) as well as to correct for the biases resulting from the correlation between the inputs/outputs of the first stage and the regressors of the second stage. In this paper, we suggest that one should also account for the skewness of those DEA efficiency scores by using quantile regression, which relies on the conditional quantiles rather than the conditional means as in OLS (Angrist et al. 2006). As discussed in Angrist et al. (2006), quantile regression can explain changes in distribution shape and spread, i.e., the skewness of DEA scores. Due to the triple benefits of BCQR to account for the issues of a small sample and bias-correction (via bootstrap), bounded intervals (via censored regression) and skewness of efficiency scores (via quantile regression), it is suggested that the BCQR would present more insightful information to researchers, compared to the traditional ones.
Following Koenker and Hallock (2001) and Baker (2014), among others, our BCQR has the form of,
E F j   =   α + β I C T j + γ i X i j + ε
where E F j is the ECSW efficiency of bank j estimated from the previous stage, I C T represents the development of ICT (and its components) in bank j, X i j is a vector of control variables that may also influence E F j , β and γ i are the parameters to be estimated using BCQR, and ε is the random errors. Data collection and the descriptive statistics of those variables are presented in the following section.

3.3. Variable Selection and Data

The key variables of Equation (2) are E F j , I C T j , and X i j . While the former variable can be estimated using the ECSW algorithm discussed in Section 3.1, which requires data on the inputs and outputs of the sampled banks (see Equation (1)), the latter two variables can be collected as secondary data. We first define the variables of interest and then describe our dataset.
DEA evaluates the efficiency of Vietnamese banks in terms of converting their inputs into outputs. There are several ways to treat the bank as a production unit, an intermediary, or a profit-making unit (Sealey and Lindley 1977; Avkiran 2011). In the first stage, we treat Vietnamese banks as intermediaries between savers and borrowers, as it is the main function of commercial banks (Koch and MacDonald 2010; Mishkin 2019). In this sense, banks use two inputs (i.e., Employees and Operating Expenses) to produce two outputs (i.e., Operating Incomes and Total Assets). Such inputs/outputs selection is popular in the banking efficiency literature and sometimes is referred to as the core-profit model (e.g., Avkiran 2011; Fujii et al. 2014; Delis et al. 2017; Hammami et al. 2020).
In the second stage, we examine the ICT development at the bank-level by considering both the overall ICT index ( I C T ) as well as its components, including the information technology infrastructure investment index ( I T I I ), the human-related information technology investment index ( H I T I ); the information technology applications index ( I T A ), and the strategies and policies to implement and develop ICT index ( S P I D I T ). The vector of control variables X i then consists of factors that can influence banking performance, which has been found in previous studies: the bank’s ownership status ( S O C B , a dummy variable that equals to 1 if the bank is state-owned, and 0 otherwise) (Avkiran 2011; Ho et al. 2021); the loan loss provision ratio ( L L P ) representing its risk management (Berger and Mester 1997; Dong et al. 2014); the value of off-balance sheet activities ( O B S ) representing its diversification (Lozano-Vivas and Pasiouras 2010, 2014); and the number of bank branches ( B R A N C H ) representing its size and network development (Berger and DeYoung 2001; Nguyen et al. 2018; Le 2021a).
The data used to investigate the determinants of bank efficiency in Vietnam were collected from two main sources. First, we extract the bank-level data (e.g., ownership and number of branches) from the Vietnamese banking database (Ngo and Le 2017). Such database consists of 622 bank-year observations for up to 45 banks during the 2002–2021 period. Second, data on the ICT index and its components were obtained from the Vietnam ICT Index Reports, a joint project between the Vietnam Association for Information Processing (VAIP) and the Ministry of Information and Communications (MIC) (MIC 2020). Those ICT reports cover from 20 to 40 domestic banks each year for the 2005–2019 period, yielding a total of 298 bank-year observations. After matching the two datasets, this arrived at an unbalanced panel data of 27 banks from 2007 to 2019, consisting of 180 observations. It is argued that when the temporal dimension of the panel (i.e., 13 years from 2007 to 2019) is shorter than the cross-sectional observations (i.e., 27 banks), the classical OLS fixed-effect estimators regarding the time-effect tend to be biased (Galvao 2011). It is therefore better to examine our data under a fixed-effect quantile regression as this method allows the estimation of the key determinants on the (skewed) DEA scores throughout their conditional distribution while controlling for individual and time-specific confounders (Lamarche 2021). The descriptive statistics of variables used in our two-stage DEA framework are presented in Table 1 below.

4. Results and Discussions

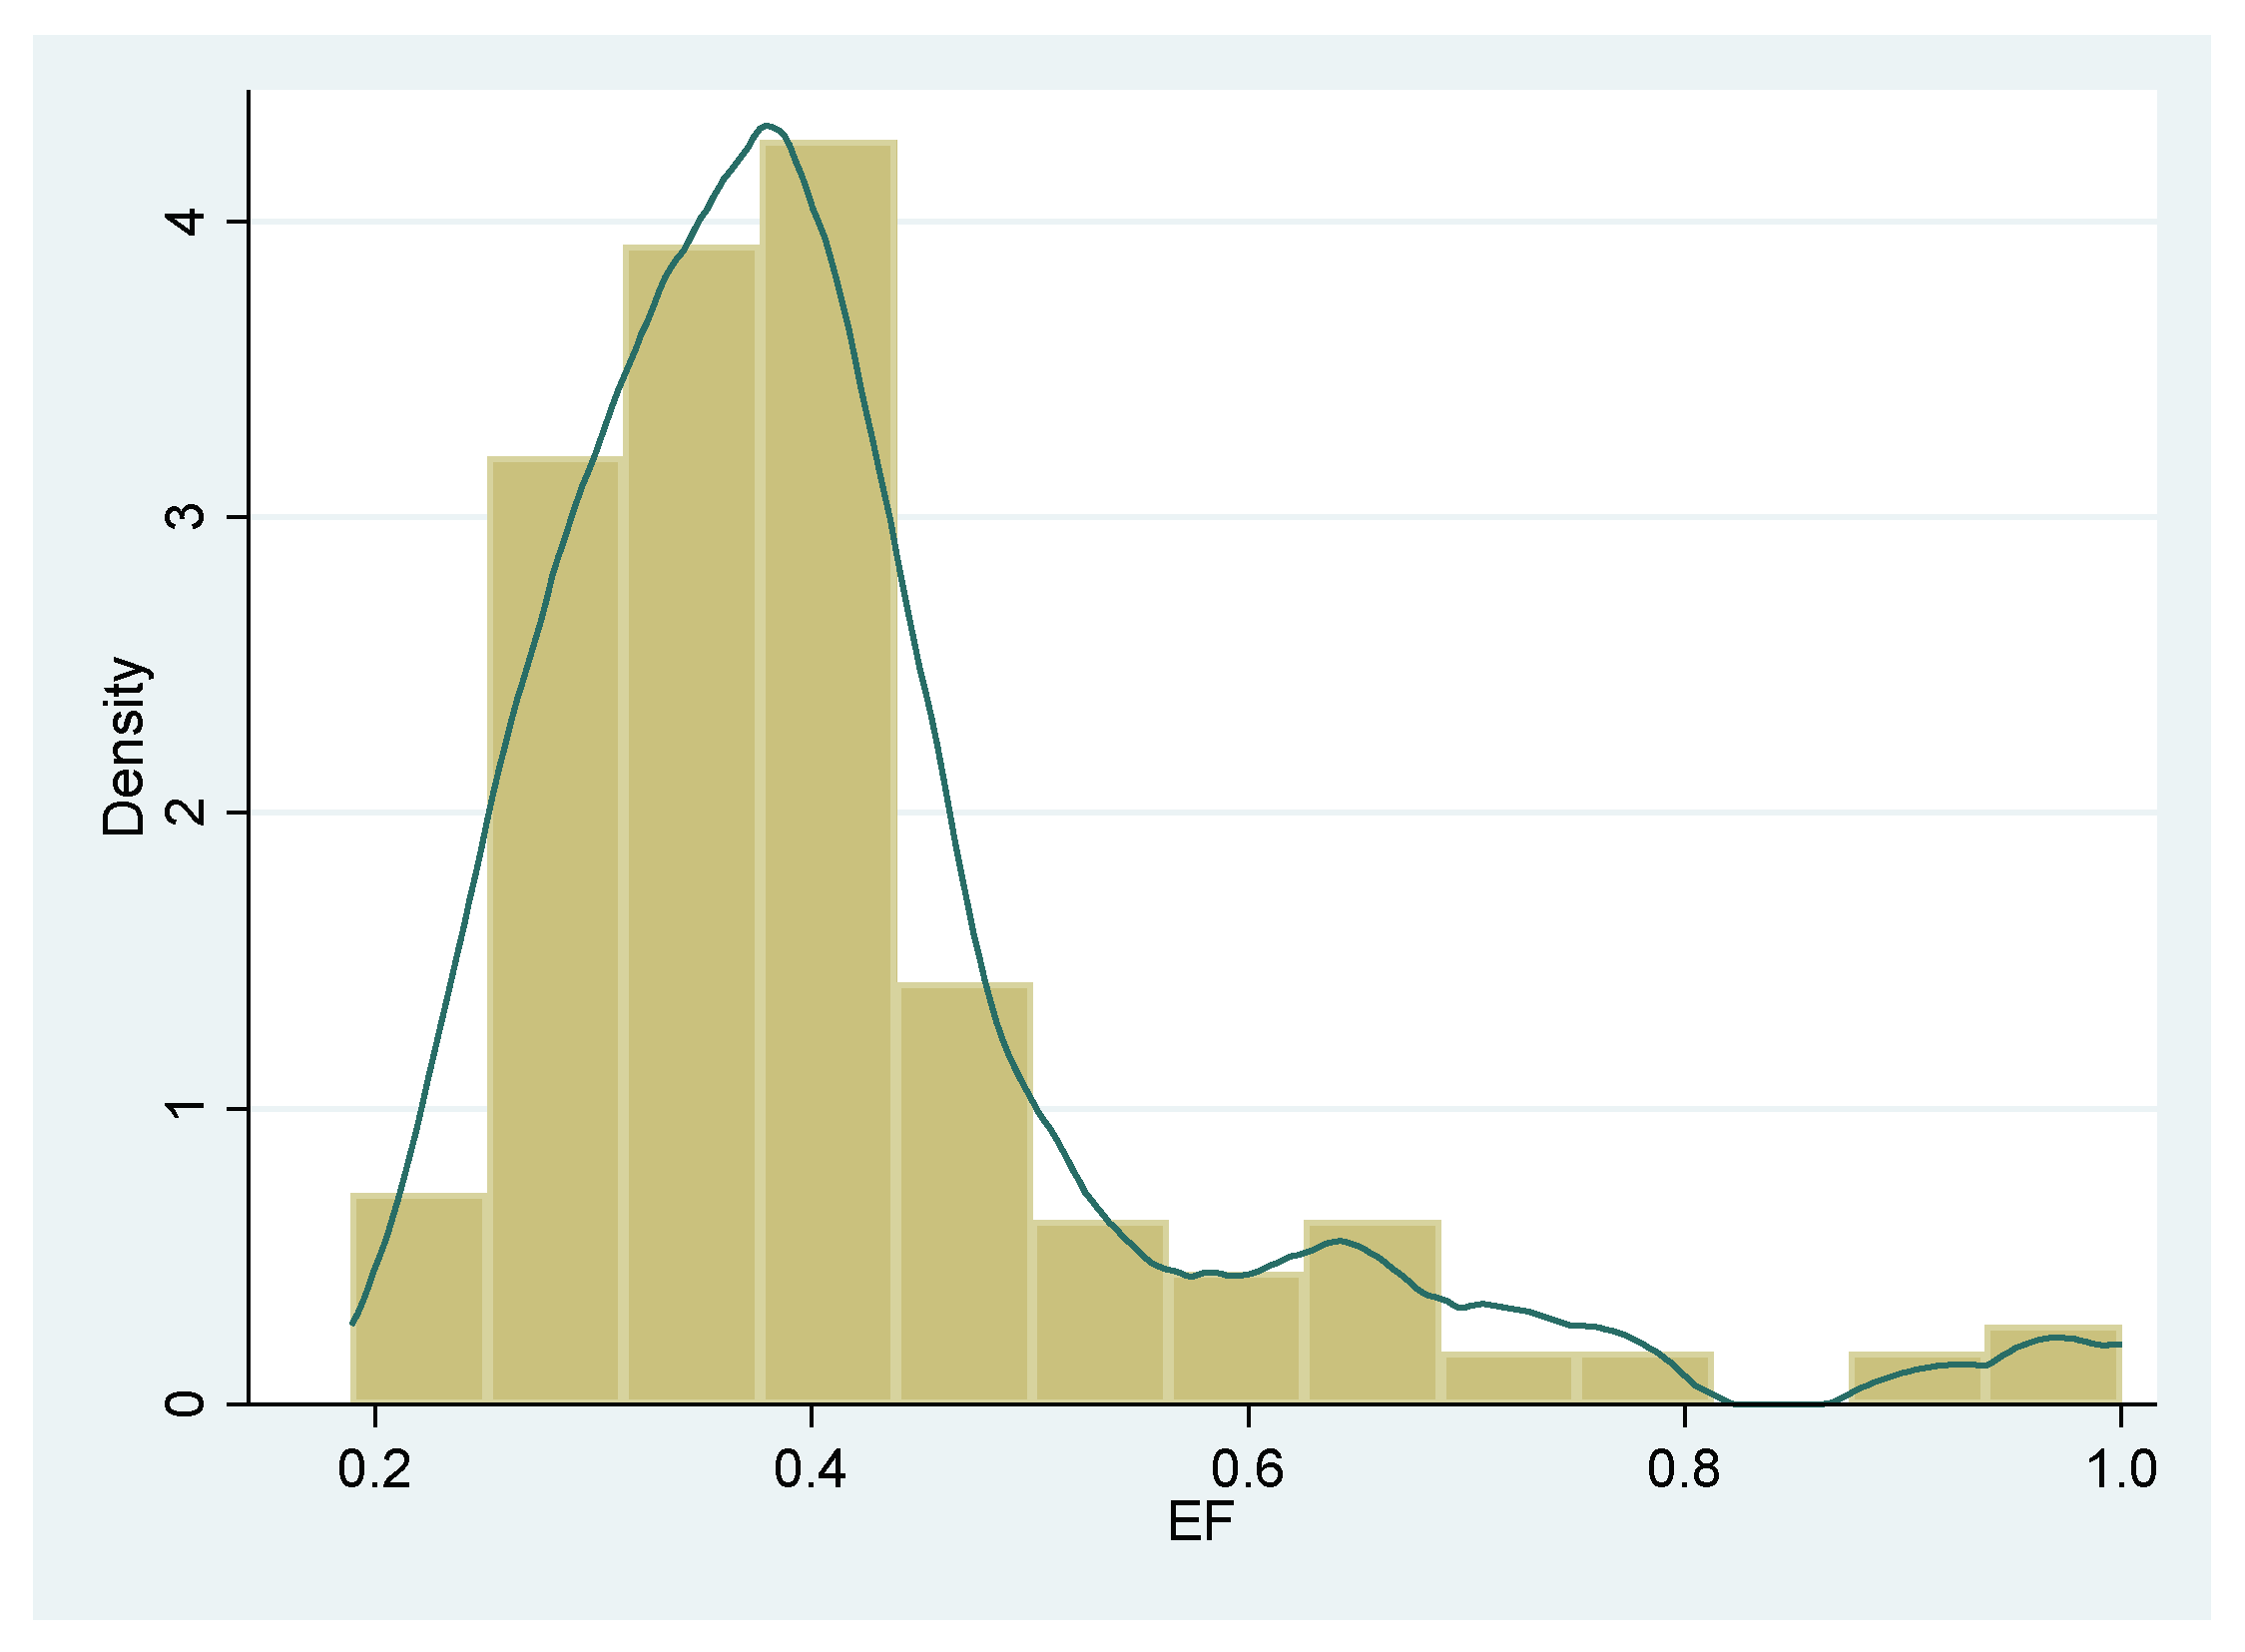
4.1. The Efficiency of Vietnamese Banks under DEA

We first report the ECSW efficiency scores (EF) for the sampled Vietnamese banks as they have been estimated in Ngo and Le (2022)—more information regarding the efficiency and performance of those banks can be found therein. Our focus is not the value of EF itself but its distribution. Figure 1 shows that the 10th and 90th quantile EF scores are 0.248 and 0.745, respectively, implying that bank efficiency may substantially differ across quantiles. Figure 1 also indicates a skewed distribution of bank efficiency with a heavy right tail. Such skewness is also found in other DEA studies, such as Sowlati and Paradi (2004), Gajewski et al. (2009), and Santín and Sicilia (2017), among others. Since the EF does not follow a normal distribution, OLS and Tobit/truncated regressions may not be appropriate. For instance, Galvao (2011) and Sun et al. (2016) argued that, compared to the mean regression, quantile regression is more robust and can deal with data with various distributions. We therefore argue that the second-stage regression, particularly for our case, must not only account for the truncated/censored characteristic of EF but also its skewed distribution. Consequently, a censored quantile regression approach (Baker 2014) should be used here—the empirical results derived from such approach are presented in the following section.

4.2. The Relationship between ICT and Bank Efficiency under BCQR

It is acknowledged that a two-stage DEA is one of the most common approaches used to investigate the determinants of bank efficiency (Simar and Wilson 2007; Stewart et al. 2016; Nguyen et al. 2019; Ngo and Le 2022). To better address the skewed distribution of the efficiency scores of banks, as discussed previously, we employ a bootstrap-censored quantile regression (BCQR) in this study. While the censored quantile regression model can provide more insightful information about the determinants of the efficiency of Vietnamese banks, including ICT and its components, compared to the traditional Tobit or truncated regression (Angrist et al. 2006; Castellano and Ho 2013; Baker 2014), the double-bootstrap technique can also help overcome the issue of small sample size and correcting for any bias therein (Simar and Wilson 2007; Stewart et al. 2016). The correlation matrix reported in Table 2 suggests no multicollinearity between our variables so the implementation of our BCQR is justified.
Table 3 shows the baseline findings of our BCQR results where five quantiles of E F (the 25th, 50th, 75th, 80th, and 90th quantiles) are examined. It is observed that the positive coefficients on I C T across those quantiles imply that ICT development could enhance bank efficiency. This finding supports the early suggestions of Appiahene et al. (2019) and Le and Ngo (2020).
When examining the ICT components, as shown in Table 4, bank efficiency is positively associated with information technology infrastructure investment ( I T I I ), human-related information technology investment ( H I T I ), and strategies and policies to implement and develop ICT ( S P I D I T ). The negative coefficients of information technology applications index (ITA) across different quantiles suggest that increasing investment in ICT applications tends to reduce bank efficiency. This can be explained by several reasons. First, the core banking structure of many Vietnamese banks is outdated and rigid, so the implementation of new ICT applications may not be fully synchronized and compatible. Therefore, this complicated process is time-consuming, and more importantly, also costly (Dinh 2020). When the increase in revenues is slower (and less) than those of bank costs, it is reasonable that ICT applications may negatively associate with bank efficiency. Second, the use of bank applications during the examined period was relatively low because Vietnamese consumers still preferred to conduct their transactions over the counters. For instance, the cash payment ratio in the Vietnamese economy was 11.33% in 2019, which is relatively higher than that in other economies (GSO 2019). Along with the developing and maintaining of bank applications, banks simultaneously enhance their services at the counters, thus may increase their costs. To support the cashless payment program introduced by the government (Vietnamese Government 2016a), banks are required to update their applications by adding more app services/features and offering promotions (e.g., higher deposit rates if using their apps compared to over the counter) to attract new users and provide more convenience for existing customers. Again, this may incur more costs for banks, especially in terms of research and development expenditures. Third, the development of ICT applications (e.g., mobile banking and internet banking) may require additional ongoing costs to fix accelerating security leaking and improve their cyber security to deal with hackers and cybercriminals.
Regarding the control variables, the positive coefficients of S O C B in all quantiles imply that SOCBs are generally more efficient than its counterparts. This finding is comparable with Le and Nguyen (2020) and Ho et al. (2021). One main reason is that SOCBs have received long-term support and subsidies from the Vietnamese government (Le et al. 2019; Le 2021a). Table 3 and Table 4 also show that bank efficiency is negatively associated with credit risk ( L L P ), and thereby the bad luck hypothesis may hold in the case of the Vietnamese banking system. When banks face higher risk caused by external events, additional costs/inputs are required to manage these problems. Nonetheless, this is in line with the findings of Le (2018) and Simper et al. (2019). Additionally, the coefficients of O B S and B R A N C H are negative and significant in most quantiles (except the 90th one), suggesting that a higher degree of bank diversification ( O B S ) and bank size ( B R A N C H ) tend to reduce bank efficiency. The former finding is consistent with those of (Lozano-Vivas and Pasiouras 2014), who argued that costs for non-traditional activities might outweigh those for traditional ones. The latter finding demonstrates that banks with larger size/network may exhibit a lower efficiency, indicating that diseconomies of scale exist in the Vietnamese banking system. This finding is consistent with earlier results of Sun and Chang (2011), Gardener et al. (2011), and Le et al. (2022a).
Given the significant impact of bank ownership, we further investigate whether the relationship between ICT development and bank efficiency may differ among bank ownership, as presented in Table 5. The negative coefficients on I C T S O C B across conditional distributions suggest that state-owned commercial banks with greater ICT investments tend to be less efficient than privately owned commercial banks. This reemphasizes that SOCBs generally seem to be more efficient than its counterparts due to greater government supports, especially the discount rate received from the State Bank of Vietnam for state-owned enterprises financing.
Furthermore, SOCBs have operated on a very large scale, especially in providing banking products/services on a national basis covering rural areas. Thus, this requires a substantially greater amount of money to implement ICT in the short run and ongoing training of employees to adopt the new system and maintain the consistency of the whole system. Table 6 shows the negative coefficients on I T I I × S O C B , H I T A × S O C B , and S P I D I T × S O C B , confirming the above explanations. As said, private- and foreign-owned banks are the most market-oriented (Nguyen et al. 2018; Le 2020a, 2021b), so their capacity to adapt to new ICT developments is much better than state-owned banks. Therefore, these banks tend to be more efficient by increasing their shares in deposits and lending markets away from the SOCBs (Le 2020b).

5. Conclusions

It is argued that ICT developments can improve bank efficiency and performance. Previous studies often employ DEA to first examine bank performance and then use a second-stage regression to explain the influences of other environmental factors, including ICT, on such efficiency. Since DEA efficiency scores are bounded between the (0, 1] intervals, Tobit and truncated regressions are commonly used in this stage. However, none has accounted for the skewness characteristic of DEA efficiency. This paper applied a bootstrap-censored quantile regression (BCQR) approach to triply account for the issues of a small sample (via bootstrap), bounded intervals (via censored regression), and skewness (via quantile regression) in DEA analysis.
We empirically examined the efficiency and performance of 27 Vietnamese commercial banks in the 2007–2019 period. The efficiency scores derived from our first stage revealed that they are skewed and thus, justify the use of the BCQR in the second stage. The BCQR results further confirmed that ICT developments could enhance bank efficiency, which supports the recent policy to restructure the Vietnamese banking sector toward innovation and digitalization (Vietnamese Government 2012b, 2017). Among the ICT components, the information technology infrastructure investment, human-related information technology investment, and strategies and policies to implement and develop ICT in the banks can improve their efficiency; whilst the information technology applications index tends to reduce bank efficiency. This negative impact is due to the costs of such implementation may increase faster than its benefits, especially when the cash payment ratio (i.e., non-bank transactions) in Vietnam is still high.
For other control variables, we observed that the state-owned banks are generally more efficient than its counterpart, which is due to higher government supports (Le et al. 2019; Le and Nguyen 2020). In fact, we further found that state-owned banks with greater ICT investments tend to be less efficient than privately-owned banks, suggesting a lower performance of the state-owned banks in terms of operations and investments. This finding is consistent across different ICT components. Additionally, we also found that bank efficiency is negatively associated with credit risk (i.e., the ‘bad luck hypothesis’), while bank diversification and bank branches tend to reduce bank efficiency. It is therefore suggested that non-traditional activities need to be better monitored because when the cost of those activities is still higher than that of traditional ones then their efficiency will be hindered (Lozano-Vivas and Pasiouras 2014). On the other hand, Vietnamese banks should also consider downsizing or to restructuring their branches and networks to deal with the diseconomies of scale problem. Consequently, our results support the restructuring policy of the Vietnamese government toward the banking sector with a major focus on the privatization of SOCBs (Vietnamese Government 2012a, 2016b) and digitalization in banking services (Vietnamese Government 2017).

Author Contributions

Conceptualization, T.D.Q.L. and T.N.; methodology and software, D.T.N.; validation, T.D.Q.L.; formal analysis, T.H.H.; investigation, D.T.N.; resources, T.H.H.; data curation, T.H.H.; writing—original draft preparation, T.H.H. and D.T.N.; writing—review and editing, T.D.Q.L. and T.N.; visualization and supervision, T.D.Q.L.; project administration, T.D.Q.L.; funding acquisition, T.D.Q.L. All authors have read and agreed to the published version of the manuscript.

Funding

This research was funded by the University of Economics and Law, Vietnam National University, Ho Chi Minh City, Vietnam.

Institutional Review Board Statement

Not applicable.

Informed Consent Statement

Not applicable.

Data Availability Statement

The data presented in this study are available on request.

Conflicts of Interest

The authors declare no conflict of interest. The funders had no role in the design of the study; in the collection, analyses or interpretation of data; in the writing of the manuscript or in the decision to publish the results.

References

  1. Aiello, Francesco, and Graziella Bonanno. 2016. Efficiency in banking: A meta-regression analysis. International Review of Applied Economics 30: 112–49. [Google Scholar] [CrossRef]
  2. Akhisar, İlyas, K. Batu Tunay, and Necla Tunay. 2015. The Effects of Innovations on Bank Performance: The Case of Electronic Banking Services. Procedia Social and Behavioral Sciences 195: 369–75. [Google Scholar] [CrossRef] [Green Version]
  3. Angrist, Joshua, Victor Chernozhukov, and Iván Fernández-Val. 2006. Quantile Regression under Misspecification, with an Application to the U.S. Wage Structure. Econometrica 74: 539–63. [Google Scholar] [CrossRef] [Green Version]
  4. Appiahene, Peter, Yaw Marfo Missah, and Ussiph Najim. 2019. Evaluation of information technology impact on bank’s performance: The Ghanaian experience. International Journal of Engineering Business Management 11: 1–10. [Google Scholar] [CrossRef] [Green Version]
  5. Arora, Hitesh, and Padmasai Arora. 2013. Effect of investments in information technology on bank performance: Empirical evidence from Indian public sector banks. International Journal of Business Information Systems 13: 400–17. [Google Scholar] [CrossRef]
  6. Avkiran, Necmi K. 2011. Association of DEA super-efficiency estimates with financial ratios: Investigating the case for Chinese banks. OMEGA 39: 323–34. [Google Scholar] [CrossRef]
  7. Baker, Matthew J. 2014. Adaptive Markov chain Monte Carlo sampling and estimation in Mata. Stata Journal 14: 623–61. [Google Scholar] [CrossRef] [Green Version]
  8. Banker, Rajiv D., Abraham Charnes, and William Wager Cooper. 1984. Some models for estimating technical and scale inefficiencies in data envelopment analysis. Management Science 30: 1078–92. [Google Scholar] [CrossRef] [Green Version]
  9. Beccalli, Elena. 2007. Does IT investment improve bank performance? Evidence from Europe. Journal of Banking & Finance 31: 2205–30. [Google Scholar] [CrossRef]
  10. Berger, Allen N., and Robert DeYoung. 2001. The Effects of Geographic Expansion on Bank Efficiency. Journal of Financial Services Research 19: 163–84. [Google Scholar] [CrossRef]
  11. Berger, Allen N., and Robert DeYoung. 2006. Technological progress and the geographic expansion of the banking industry. Journal of Money, Credit and Banking 38: 1483–513. [Google Scholar] [CrossRef] [Green Version]
  12. Berger, Allen N., and David B. Humphrey. 1997. Efficiency of financial institutions: International survey and directions for future research. European Journal of Operational Research 98: 175–212. [Google Scholar] [CrossRef] [Green Version]
  13. Berger, Allen N., and Loretta J. Mester. 1997. Inside the black box: What explains differences in the efficiencies of financial institutions? Journal of Banking & Finance 21: 895–947. [Google Scholar]
  14. Boubaker, Sabri, Asma Houcine, Zied Ftiti, and Hatem Masri. 2018. Does audit quality affect firms’ investment efficiency? Journal of the Operational Research Society 69: 1688–99. [Google Scholar] [CrossRef]
  15. Boubaker, Sabri, Duc Trung Do, Helmi Hammami, and Kim Cuong Ly. 2020. The role of bank affiliation in bank efficiency: A fuzzy multi-objective data envelopment analysis approach. Annals of Operations Research 311: 611–39. [Google Scholar] [CrossRef]
  16. Boubaker, Sabri, Tu D. Q. Le, and Thanh Ngo. 2022. Managing bank performance under COVID-19: A novel inverse DEA efficiency approach. International Transactions in Operational Research. Early view. [Google Scholar] [CrossRef]
  17. Castellano, Katherine Elizabeth, and Andrew Dean Ho. 2013. Contrasting OLS and Quantile Regression Approaches to Student “Growth” Percentiles. Journal of Educational and Behavioral Statistics 38: 190–215. [Google Scholar] [CrossRef]
  18. Charnes, A., William Wager Cooper, and Edwardo Rhodes. 1978. Measuring the efficiency of decision making units. European Journal of Operational Research 2: 429–44. [Google Scholar] [CrossRef]
  19. Chedrawi, Charbel, Bissane Harb, and Mariam Saleh. 2019. The E-Banking and the Adoption of Innovations from the Perspective of the Transactions Cost Theory: Case of the Largest Commercial Banks in Lebanon. In ICT for a Better Life and a Better World: The Impact of Information and Communication Technologies on Organizations and Society. Edited by Youcef Baghdadi and Antoine Harfouche. Cham: Springer International Publishing, pp. 149–64. [Google Scholar] [CrossRef]
  20. Ciciretti, Rocco, Iftekhar Hasan, and Cristiano Zazzara. 2009. Do internet activities add value? Evidence from the traditional banks. Journal of Financial Services Research 35: 81–98. [Google Scholar] [CrossRef]
  21. Dao, Thuy T. T., Xuan T. T. Mai, Thanh Ngo, Tu Le, and Huong Ho. 2021. From Efficiency Analyses to Policy Implications: A Multilevel Hierarchical Linear Model Approach. International Journal of the Economics of Business 28: 457–70. [Google Scholar] [CrossRef]
  22. Delis, Manthos, Maria Iosifidi, and Mike G. Tsionas. 2017. Endogenous bank risk and efficiency. European Journal of Operational Research 260: 376–87. [Google Scholar] [CrossRef] [Green Version]
  23. DeYoung, Robert. 2001. The financial performance of pure play Internet banks. Economic Perspectives 25: 60–75. [Google Scholar]
  24. Dinçer, Hasan, and Serhat Yüksel. 2020. The Role of IT Investment on the Bank Performance: A Cointegration and Causality Analysis for Asian Countries. In Role of IT- ITES in Economic Development of Asia: Issues of Growth, Sustainability and Governance. Edited by Soumyen Sikdar, Ramesh Chandra Das and Rajib Bhattacharyya. Singapore: Springer, pp. 13–25. [Google Scholar] [CrossRef]
  25. Dinh, Van Chuc. 2020. Information technology application in developing banking products and services in Vietnam. Journal of Finance 2: 1–5. (In Vietnamese). [Google Scholar]
  26. Dong, Yizhe, Robert Hamilton, and Mark Tippett. 2014. Cost efficiency of the Chinese banking sector: A comparison of stochastic frontier analysis and data envelopment analysis. Economic Modelling 36: 298–308. [Google Scholar] [CrossRef]
  27. Fujii, Hidemichi, Shunsuke Managi, and Roman Matousek. 2014. Indian bank efficiency and productivity changes with undesirable outputs: A disaggregated approach. Journal of Banking & Finance 38: 41–50. [Google Scholar]
  28. Gajewski, Byron J., Robert Lee, Marge Bott, Ubolrat Piamjariyakul, and Roma Lee Taunton. 2009. On estimating the distribution of data envelopment analysis efficiency scores: An application to nursing homes’ care planning process. Journal of Applied Statistics 36: 933–44. [Google Scholar] [CrossRef]
  29. Galvao, Antonio F. 2011. Quantile regression for dynamic panel data with fixed effects. Journal of Econometrics 164: 142–57. [Google Scholar] [CrossRef]
  30. Gardener, Edward, Philip Molyneux, and Hoai Nguyen-Linh. 2011. Determinants of efficiency in South East Asian banking. The Service Industries Journal 31: 2693–719. [Google Scholar] [CrossRef]
  31. Girmaye, Haftu. 2018. Information Communication Technology and Bank Profitability: Evidence from Ethiopia. Eastern Africa Social Science Research Review 34: 1–19. [Google Scholar] [CrossRef]
  32. GSO. 2019. Statistical yearbook of Vietnam. Hanoi: GSO. [Google Scholar]
  33. Hammami, Helmi, Thanh Ngo, David Tripe, and Dinh-Tri Vo. 2020. Ranking with a Euclidean common set of weights in data envelopment analysis: With application to the Eurozone banking sector. Annals of Operations Research 311: 675–94. [Google Scholar] [CrossRef]
  34. Hernando, Ignacio, and María J. Nieto. 2007. Is the Internet delivery channel changing banks’ performance? The case of Spanish banks. Journal of Banking & Finance 31: 1083–99. [Google Scholar]
  35. Ho, Shirley J., and Sushanta Kumar Mallick. 2010. The impact of information technology on the banking industry. Journal of the Operational Research Society 61: 211–21. [Google Scholar] [CrossRef]
  36. Ho, Tin H., Dat T. Nguyen, Thanh Ngo, and Tu D. Q. Le. 2021. Efficiency in Vietnamese Banking: A Meta-Regression Analysis Approach. International Journal of Financial Studies 9: 41. [Google Scholar] [CrossRef]
  37. Holden, Ken, and Magdi El-Bannany. 2004. Investment in information technology systems and other determinants of bank profitability in the UK. Applied Financial Economics 14: 361–65. [Google Scholar] [CrossRef]
  38. Koch, Timothy W., and S. Scott MacDonald. 2010. Bank Management, 7th ed. Mason: South-Western Cengage Learning. [Google Scholar]
  39. Koenker, Roger, and Kevin F. Hallock. 2001. Quantile Regression. Journal of Economic Perspectives 15: 143–56. [Google Scholar] [CrossRef]
  40. Lamarche, Carlos. 2021. Quantile Regression for Panel Data and Factor Models. In Oxford Research Encyclopedia of Economics and Finance. Oxford: Oxford University Press. [Google Scholar] [CrossRef]
  41. Le, Tu D. Q. 2018. Bank risk, capitalisation and technical efficiency in the Vietnamese banking system. Australasian Accounting Business & Finance Journal 12: 42–61. [Google Scholar] [CrossRef]
  42. Le, Tu D. Q. 2020a. Market discipline and the regulatory change: Evidence from Vietnam. Cogent Economics & Finance 8: 1757801. [Google Scholar] [CrossRef]
  43. Le, Tu D. Q. 2020b. Multimarket contacts and bank profitability: Do diversification and bank ownership matter? Cogent Economics & Finance 8: 1849981. [Google Scholar] [CrossRef]
  44. Le, Tu D. Q. 2021a. Geographic expansion, income diversification, and bank stability: Evidence from Vietnam. Cogent Business & Management 8: 1885149. [Google Scholar] [CrossRef]
  45. Le, Tu D. Q. 2021b. Can foreign ownership reduce bank risk? Evidence from Vietnam. Review of Economic Analysis 13: 1–24. [Google Scholar] [CrossRef]
  46. Le, Tu D. Q., and Thanh Ngo. 2020. The determinants of bank profitability: A cross-country analysis. Central Bank Review 20: 65–73. [Google Scholar] [CrossRef]
  47. Le, Tu D. Q., and Dat T. Nguyen. 2020. Intellectual capital and bank profitability: New evidence from Vietnam. Cogent Business & Management 7: 1859666. [Google Scholar] [CrossRef]
  48. Le, Tu D. Q., Son H. Tran, and Liem T. Nguyen. 2019. The impact of multimarket contacts on bank stability in Vietnam. Pacific Accounting Review 31: 336–57. [Google Scholar] [CrossRef]
  49. Le, Chau, Aleksandar Šević, Panayiotis G. Tzeremes, and Trong Ngo. 2022a. Bank efficiency in Vietnam: Do scale expansion strategies and non-performing loans matter? International Journal of Finance & Economics 27: 822–43. [Google Scholar] [CrossRef]
  50. Le, Tu D. Q., Tin H. Ho, Dat T. Nguyen, and Thanh Ngo. 2022b. A cross-country analysis on diversification, Sukuk investment, and the performance of Islamic banking systems under the COVID-19 pandemic. Heliyon 8: e09106. [Google Scholar] [CrossRef]
  51. Lozano-Vivas, Ana, and Fotios Pasiouras. 2010. The impact of non-traditional activities on the estimation of bank efficiency: International evidence. Journal of Banking & Finance 34: 1436–49. [Google Scholar]
  52. Lozano-Vivas, Ana, and Fotios Pasiouras. 2014. Bank Productivity Change and Off-Balance-Sheet Activities Across Different Levels of Economic Development. Journal of Financial Services Research 46: 271–94. [Google Scholar] [CrossRef]
  53. Martín-Oliver, Alfredo, and Vicente Salas-Fumás. 2008. The output and profit contribution of information technology and advertising investments in banks. Journal of Financial Intermediation 17: 229–55. [Google Scholar] [CrossRef] [Green Version]
  54. MIC. 2020. Vietnam ICT Index Reports. Hanoi: Ministry of Information and Communications (MIC). [Google Scholar]
  55. Mishkin, Frederic S. 2019. The Economics of Money, Banking, and Financial Markets, 12th ed. London: Pearson. [Google Scholar]
  56. Ngo, Thanh, and Tu D. Q. Le. 2017. Resource for Research: A Vietnamese Banking Database [Updated 2020]. Social Science Research Network. Available online: https://ssrn.com/abstract=3028996 (accessed on 2 February 2022).
  57. Ngo, Thanh, and Tu Le. 2019. Capital market development and bank efficiency: A cross-country analysis. International Journal of Managerial Finance 15: 478–91. [Google Scholar] [CrossRef]
  58. Ngo, Thanh, and Tu Le. 2022. Impact of Information and Communication Technology on Banking Efficiency: The Vietnamese Experiences (forthcoming). In Handbook of Banking and Finance in Emerging Markets. Edited by Duc Khuong Nguyen. Cheltenham: Edward Elgar. [Google Scholar]
  59. Ngo, Thanh, and Kan Wai Hong Tsui. 2020. A data-driven approach for estimating airport efficiency under endogeneity: An application to New Zealand airports. Research in Transportation Business & Management 34: 100412. [Google Scholar] [CrossRef]
  60. Nguyen, Tram, David Tripe, and Thanh Ngo. 2018. Operational Efficiency of Bank Loans and Deposits: A Case Study of Vietnamese Banking System. International Journal of Financial Studies 6: 14. [Google Scholar] [CrossRef] [Green Version]
  61. Nguyen, Hai-Dang, Thanh Ngo, Tu D. Q. Le, Huong Ho, and Hai T. H. Nguyen. 2019. The role of knowledge in sustainable agriculture: Evidence from rice farms’ technical efficiency in Hanoi, Vietnam. Sustainability 11: 2472. [Google Scholar] [CrossRef] [Green Version]
  62. Salim, Ruhul, Mohammad Ziaul Hoque, and Suyanto Suyanto. 2010. The role of governance, ICT and bad loans in Australian bank efficiency: An empirical study. Asia Pacific Journal of Economics and Business 14: 18–36. [Google Scholar]
  63. Santín, Daniel, and Gabriela Sicilia. 2017. Dealing with endogeneity in data envelopment analysis applications. Expert Systems with Applications 68: 173–84. [Google Scholar] [CrossRef]
  64. Sathye, Suneeta, and Milind Sathye. 2017. Do ATMs Increase Technical Efficiency of Banks in a Developing Country? Evidence from Indian Banks. Australian Accounting Review 27: 101–11. [Google Scholar] [CrossRef] [Green Version]
  65. Scott, Susan V., John Van Reenen, and Markos Zachariadis. 2017. The long-term effect of digital innovation on bank performance: An empirical study of SWIFT adoption in financial services. Research Policy 46: 984–1004. [Google Scholar] [CrossRef] [Green Version]
  66. Sealey, Calvin W., and James T. Lindley. 1977. Inputs, outputs, and a theory of production and cost at depository financial institutions. Journal of Finance 32: 1251–66. [Google Scholar] [CrossRef]
  67. Siddik, Md Nur Alam, Gang Sun, Sajal Kabiraj, Joghee Shanmugan, and Cui Yanjuan. 2016. Impacts of e-banking on performance of banks in a developing economy: Empirical evidence from Bangladesh. Journal of Business Economics and Management 17: 1066–80. [Google Scholar] [CrossRef] [Green Version]
  68. Simar, Leopold, and Paul W. Wilson. 2007. Estimation and inference in two-stage, semi-parametric models of production processes. Journal of Econometrics 136: 31–64. [Google Scholar] [CrossRef]
  69. Simper, Richard, Aristeidis Dadoukis, and Cormac Bryce. 2019. European bank loan loss provisioning and technological innovative progress. International Review of Financial Analysis 63: 119–30. [Google Scholar] [CrossRef]
  70. Sowlati, Taraneh, and Joseph C. Paradi. 2004. Establishing the “practical frontier” in data envelopment analysis. OMEGA 32: 261–72. [Google Scholar] [CrossRef] [Green Version]
  71. Stewart, Chris, Roman Matousek, and Thao Ngoc Nguyen. 2016. Efficiency in the Vietnamese banking system: A DEA double bootstrap approach. Research in International Business and Finance 36: 96–111. [Google Scholar] [CrossRef] [Green Version]
  72. Sun, Lei, and Tzu-Pu Chang. 2011. A comprehensive analysis of the effects of risk measures on bank efficiency: Evidence from emerging Asian countries. Journal of Banking & Finance 35: 1727–35. [Google Scholar]
  73. Sun, Xiaoyan, Limin Peng, Amita Manatunga, and Michele Marcus. 2016. Quantile regression analysis of censored longitudinal data with irregular outcome-dependent follow-up. Biometrics 72: 64–73. [Google Scholar] [CrossRef] [PubMed] [Green Version]
  74. Tone, Kaoru. 2001. A slacks-based measure of efficiency in data envelopment analysis. European Journal of Operational Research 130: 498–509. [Google Scholar] [CrossRef] [Green Version]
  75. Tripe, David. 2010. Using DEA to investigate bank safety and soundness—Which approach works best? Journal of Financial Economic Policy 2: 237–50. [Google Scholar] [CrossRef]
  76. Tunay, K. Batu, Necla Tunay, and İlyas Akhisar. 2015. Interaction Between Internet Banking and Bank Performance: The Case of Europe. Procedia Social and Behavioral Sciences 195: 363–68. [Google Scholar] [CrossRef] [Green Version]
  77. Valverde, S. Carbó, and David B. Humphrey. 2009. Technological innovation in banking: The shift to ATMs and implicit pricing of network convenience. In Financial Innovation in Retail and Corporate Banking. Edited by Luisa Anderloni, David T. Llewellyn and Reinhard H. Schmidt. Cheltenham: Edward Elgar. [Google Scholar]
  78. Vidal-García, Javier, Marta Vidal, Sabri Boubaker, and Majdi Hassan. 2018. The efficiency of mutual funds. Annals of Operations Research 267: 555–84. [Google Scholar] [CrossRef]
  79. Vietnamese Government. 2012a. Decision No. 254/QD-TTg on approving the scheme on “Restructuring the credit institutions System in the 2011–2015 Period”; Hanoi: Office of the Government.
  80. Vietnamese Government. 2012b. Decision No. 432/QD-TTg on the Viet Nam Sustainable Development Strategy for the 2011–2020; Hanoi: Office of the Government.
  81. Vietnamese Government. 2016a. Decision No. 2545/QD-TTg: Approval for Government Plan on Cashless Payment in the 2016–2020 Period; Hanoi: Office of the Government.
  82. Vietnamese Government. 2016b. Resolution No. 05-NQ/TW on Major Policies for Rennovation of Growth Models and Improvement of Growth Quality, Economic Productivity and Competitiveness; Hanoi: Office of the Government.
  83. Vietnamese Government. 2017. Directive No. 16/CT-TTg on the Strengthening of the Ability to Access the Fourth Industrial Revolution; Hanoi: Office of the Government.
  84. Weigelt, Carmen, and M. B. Sarkar. 2012. Performance implications of outsourcing for technological innovations: Managing the efficiency and adaptability trade-off. Strategic Management Journal 33: 189–216. [Google Scholar] [CrossRef]
Figure 1. Histogram for the efficiency scores (EF) of Vietnamese banks (2007–2019).
Ijfs 10 00044 g001
Table 1. Descriptive statistics of variables used in this study.
First-Stage DEA
NMeanSDMinMax
Inputs
STAFF1808930.697706.57523.0038,240.00
OE1806770.007100.00120.0036,500.00
Outputs
OI18020,800.0021,700.00357.00115,000.00
TA180265,000.00294,000.002940.001,490,000.00
Second-Stage BCQR
NMeanSDMinMax
Control variables
ICT1800.520.120.250.81
ITII1770.470.120.240.82
HITI1770.470.2401
ITA1770.510.2001
SPIDIT1770.6970.22001
SOCB1800.2280.42101
LLP1801.2850.5110.1933.702
OBS1800.1800.24101.390
BRANCH1805.2970.9203.3677.723
Notes: STAFF, the number of staff (in persons); OE, the operating expenses (in millions VND); OI, the operating income (in millions VND); TA, total assets (in millions VND); ICT, the overall ICT development index; ITII, information technology infrastructure investment index; HITI, human-related information technology investment index; ITA, information technology applications index; SPIDIT, strategies and policies to implement and develop ICT index; SOCB, a dummy variable that equals 1 for a state-owned bank, and 0 otherwise; LLP, the ratio of loan loss provision to total loans; OBS, the ratio of off-balance-sheet value to total assets; BRANCH, the natural logarithm of total bank branches; SD stands for standard deviation and N stands for the number of observations.
Table 2. Correlation matrix of variables.
EFF
0.02ICT
0.070.65 ***ITII
0.040.51 ***0.22 ***HITI
−0.060.62 ***0.22 ***0.03ITA
−0.040.75 ***0.38 ***0.25 ***0.31 ***SPIDIT
0.090.56 ***0.54 ***0.070.44 ***0.42 ***SOCB
−0.16 **0.34 ***0.36 ***0.060.24 ***0.3 ***0.53 ***LLP
−0.050.07−0.01−0.020.010.07−0.030.18 **OBS
−0.020.37 ***0.28 ***−0.110.35 ***0.33 ***0.51 ***0.19 **0.24 ***BRANCH
Notes: EFF, efficiency scores derived from first-stage DEA; ICT, the overall ICT development index; ITII, information technology infrastructure investment index; HITI, human-related information technology investment index; ITA, information technology applications index; SPIDIT, strategies and policies to implement and develop ICT index; SOCB, a dummy variable that equals 1 for a state-owned bank, and 0 otherwise; LLP, the ratio of loan loss provision to total loans; OBS, the ratio of off-balance-sheet value to total assets; and BRANCH, the natural logarithm of total bank branches. *** and ** denote the statistical significance at 1% and 5% levels, respectively.
Table 3. The result of our baseline model (with EF as the dependent variable).
Quantiles25th50th75th80th90th
ICT0.17 ***0.165 ***0.184 ***0.196 ***0.16 ***
(0.009)(0.016)(0.014)(0.019)(0.013)
SOCB0.143 ***0.137 ***0.13 ***0.171 ***0.145 ***
(0.002)(0.005)(0.008)(0.019)(0.007)
LLP−0.092 ***−0.008 ***−0.067 ***−0.088 ***−0.096 ***
(0.005)(0.011)(0.002)(0.011)(0.016)
OBS−0.052 ***−0.039 ***−0.046 ***−0.056 ***−0.072 ***
(0.01)(0.005)(0.007)(0.019)(0.018)
BRANCH−0.05 ***−0.037 ***−0.037 ***−0.053 ***−0.001
(0.01)(0.007)(0.009)(0.01)(0.028)
Constant−33.101 ***−33.08 ***−33.07 ***−33.07 ***−33.08 ***
(0.021)(0.012)(0.01)(0.012)(0.004)
Time fixed effectYesYesYesYesYes
N180180180180180
Notes: EF, ECSW efficiency scores derived from first-stage DEA; ICT, the overall ICT development index; SOCB, a dummy variable that equals 1 for a state-owned bank, and 0 otherwise; LLP, the ratio of loan loss provision to total loans; OBS, the ratio of off-balance-sheet value to total assets; and BRANCH, the natural logarithm of total bank branches. *** denotes for statistical significance at 1 % level. Standard errors are reported in parentheses. N stands for the number of observations.
Table 4. The impact of ICT components on bank efficiency.
Quantiles25th50th75th80th90th
ITII0.101 ***0.11 ***0.11 ***0.112 ***0.081 ***
(0.01)(0.005)(0.009)(0.009)(0.018)
HITI0.042 ***0.038 ***0.045 ***0.0310.075 ***
(0.003)(0.009)(0.008)(0.023)(0.018)
ITA−0.042 ***−0.037 ***−0.04 ***−0.04 ***−0.064 ***
(0.002)(0.003)(0.006)(0.005)(0.007)
SPIDIT0.039 ***0.054 ***0.066 ***0.051 ***0.093 ***
(0.013)(0.006)(0.011)(0.015)(0.014)
SOCB0.164 ***0.153 ***0.126 ***0.147 ***0.116 ***
(0.01)(0.008)(0.026)(0.008)(0.015)
LLP−0.082 ***−0.092 ***−0.103 ***−0.092 ***−0.062 ***
(0.009)(0.006)(0.009)(0.008)(0.014)
OBS−0.049 ***−0.035 ***−0.041 ***−0.044 ***−0.017
(0.005)(0.007)(0.003)(0.012)(0.027)
BRANCH−0.054 ***−0.041 ***−0.038 ***−0.036 ***0.027
(0.011)(0.005)(0.005)(0.005)(0.037)
Constant−34.18 ***−34.18 ***−34.16 ***−34.18 ***−34.19 ***
(0.002)(0.003)(0.02)(0.03)(0.01)
Time fixed effectYesYesYesYesYes
N177177177177177
Notes: ICT, the overall ICT development index; ITII, information technology infrastructure investment index; HITI, human-related information technology investment index; ITA, information technology applications index; SPIDIT, strategies and policies to implement and develop ICT index; SOCB, a dummy variable that equals 1 for a state-owned bank, and 0 otherwise; LLP, the ratio of loan loss provision to total loans; OBS, the ratio of off-balance-sheet value to total assets; and BRANCH, the natural logarithm of total bank branches. *** denotes for statistical significance at 1 % level. Standard errors are reported in parentheses. N stands for the number of observations.
Table 5. The results of interaction terms between ICT and bank ownership.
Quantiles25th50th75th80th90th
ICT0.37 ***0.381 ***0.355 ***0.358 ***0.212 ***
(0.002)(0.014)(0.014)(0.012)(0.043)
SOCB0.502 ***0.499 ***0.508 ***0.483 ***0.503 ***
(0.012)(0.014)(0.004)(0.014)(0.023)
ICT × SOCB−0.617 ***−0.634 ***−0.67 ***−0.663 ***−0.574 ***
(0.013)(0.008)(0.026)(0.016)(0.021)
Constant−32.88 ***−32.89 ***−32.85 ***−32.87 ***−32.83 ***
(0.002)(0.009)(0.02)(0.015)(0.031)
Time fixed effectYesYesYesYesYes
Other control variablesYesYesYesYesYes
N180180180180180
Notes: ICT, the overall ICT development index; SOCB, a dummy variable that equals 1 for a state-owned bank, and 0 otherwise. Other control variables include LLP (the ratio of loan loss provision to total loans), OBS (the ratio of off-balance sheet value to total assets), and BRANCH (the natural logarithm of total bank branches). *** denotes for statistical significance at 1 % level. Standard errors are reported in parentheses. N stands for the number of observations.
Table 6. The results of interaction terms between ICT components and bank ownership.
Quantiles25th50th75th80th90th
ITII0.207 ***0.215 ***0.221 ***0.181 ***0.242 ***
(0.008)(0.009)(0.01)(0.011)(0.026)
HITI0.077 ***0.114 ***0.139 ***0.135 ***0.131 ***
(0.022)(0.007)(0.014)(0.015)(0.012)
ITA−0.009−0.026 ***−0.01−0.017 **−0.011
(0.006)(0.006)(0.011)(0.008)(0.008)
SPIDIT0.047 ***0.045 ***0.061 ***0.0160.032 *
(0.003)(0.004)(0.007)(0.022)(0.019)
SOCB0.441 ***0.424 ***0.444 ***0.41 ***0.428 ***
(0.009)(0.013)(0.008)(0.015)(0.009)
ITII × SOCB−0.056 ***−0.054 ***−0.027 ***−0.054 ***−0.072 ***
(0.01)(0.008)(0.01)(0.01)(0.026)
HITI × SOCB−0.313 ***−0.295 ***−0.306 ***−0.301 ***−0.296 ***
(0.008)(0.003)(0.015)(0.003)(0.008)
ITA × SOCB0.004−0.007−0.01−0.0230.024
(0.009)(0.006)(0.008)(0.017)(0.017)
SPIDIT × SOCB−0.228 ***−0.181 ***−0.204 ***−0.204 ***−0.178 ***
(0.023)(0.01)(0.015)(0.015)(0.016)
Constant−30.688 ***−30.7 ***−30.67 ***−30.69 ***−30.7 ***
(0.005)(0.01)(0.014)(0.01)(0.013)
Time fixed effectYesYesYesYesYes
Other control variablesYesYesYesYesYes
N177177177177177
Notes: ICT, the overall ICT development index; ITII, information technology infrastructure investment index; HITI, human-related information technology investment index; ITA, information technology applications index; SPIDIT, strategies and policies to implement and develop ICT index; SOCB, a dummy variable that equals 1 for a state-owned bank, and 0 otherwise. Other control variables include LLP (the ratio of loan loss provision to total loans), OBS (the ratio of off-balance sheet value to total assets), and BRANCH (the natural logarithm of total bank branches). ***, **, and * denote for statistical significance at 1%, 5%, and 10% level, respectively. Standard errors are reported in parentheses. N stands for the number of observations.
Publisher’s Note: MDPI stays neutral with regard to jurisdictional claims in published maps and institutional affiliations.

