Abstract
We analyze the interaction between management and investors during Chinese IPO roadshows through Jaccard Similarity analysis of written Chinese logograms. We provide evidence that when agreement is high, investor optimism increases, leading to relatively large first-day underpricing. We further show that high agreement biases investors to systematically overestimate IPO prospects leading to poor long-run abnormal performance. Jaccard Similarity is different from current content analysis methodologies because it is language and culture agnostic, requiring no a priori construction of thematic dictionaries. Elimination of such dictionaries removes the danger that the researcher has imposed predispositions upon the study.
1. Introduction
The path-breaking work of Loughran and McDonald (2011, 2013, 2014) has legitimized the use of content analysis in financial economics research. The primary method to conduct content analysis is to use a pre-existing dictionary such as the Harvard Psychosociological Dictionary or DICTION, a popular textual analysis software program. (e.g., Das and Chen (2007) and Tetlock (2007) use the Harvard Dictionary; Ober et al. (1999) use DICTION). If a pre-existing dictionary is not used, then a customized dictionary is created as in Loughran and McDonald (2011), Brau et al. (2016, 2021) or Afanasyev et al. (2021). These customized dictionaries are argued to add more specificity to the content analysis methodology in financial economics. However, the construction of a researcher-customized dictionary potentially adds researcher bias to the analysis (Benson et al. 2015). In this paper we present an approach to remove such bias.
Prior to presenting our contribution to the literature, it is instructive to position our paper vis-à-vis prior IPO literature. The seminal articles, and many of those that have followed, explored the notion of three IPO phenomena. Namely, IPO underpricing (e.g., Brau et al. 2008); IPO long-run performance (e.g., Brau et al. 2007, 2012; Boubaker et al. 2017, 2020; Cao-Alvira and Rodríguez 2017); and the IPO hot markets cycle (e.g., Brau and Fawcett 2006a, 2006b).
Along with these three original anomalies of IPO study, the field has branched into: the costs of IPOs (Ang and Brau 2002); IPO lockups (Brau et al. 2004, 2005); SB IPOs (Brau and Carpenter 2012a, 2012b, 2013); real estate IPOs (Brau and Heywood 2008; Brau et al. 2013); healthcare IPOs (Brau and Holloway 2009; Brau and Carpenter 2017; Adcock et al. 2020); IPO surveys (Brau and Fawcett 2006a, 2006b; Brau et al. 2006); IPO harvesting (Brau et al. 2003, 2010); SCOR IPOs (Brau and Osteryoung 2001; Brau and Gee 2010); international IPOs (Brau and Rodríguez 2009; Brogi et al. 2020); why firms do IPOs (Ang and Brau 2003; Brau 2012); and earnings management in IPOs (Brau and Johnson 2009).
The great majority of this prior IPO research uses quantitative data, and neglects any potential information contained in the text of roadshows. As discussed above, those authors who do study soft information through textual or content analysis have typically explored the offering prospectus S-1 documents (e.g., Loughran and McDonald 2013). As explained below, we extend the research along two primary fronts.
First, we contribute to the prior IPO literature by performing content analysis on Chinese IPO roadshows. Second, our application is a method that does not require a dictionary or word list. We operationalize Jaccard Similarity, which in our application measures linguistic convergence between management and potential investors during the Q&A portion of the roadshow. The method of Jaccard similarity has been established in the English finance literature by Cohen et al. (2020). The efficacy of the Jaccard similarity approach in our current study is that it is language neutral.
We believe we are the first to apply it to native Chinese writing (logograms) and the first to study IPO roadshows with it. We apply fundamental tenets of communication accommodation theory to interpret increased language similarities as increased levels of agreement and positive interaction between managers and investors. When managers and investors are in agreement, they tend to adopt each other’s word choices and communication patterns, i.e., they form communicative unity. We argue that our Jaccard similarity measurement serves as an effective metric to measure this positive interaction between the parties. Throughout this paper, we will describe the positive interaction between managers and investors, and the resulting linguistic convergence, as agreement.
Our textual analysis work fits into several strands of prior readability literature. The Jaccard/Cosine similarity approach originates in the natural language processing literature (Manning and Schütze 1999), the IPO literature (Hanley and Hoberg 2010) and the conference call literature (Cicon 2017). Specifically, Hanley and Hoberg (2010) use cosine similarity to compare information content among pairs of matched IPOs. Cicon (2017) uses the Jaccard Cosine Similarity approach to analyze information production in corporate conference calls. Cicon (2017) shows a direct positive relationship between information production and firm performance. Other textual analysis methodologies include the readability approach used by Boubaker et al. (2019). Their approach measures the ‘difficulty level’ required to read particular documents by looking at length of words, number of syllables per words, and number of words per sentence.
In this paper we significantly extend the above literature by providing a methodology which permits researchers to study text written in languages in which they have little to no proficiency. So, whereas Cicon (2017) and Boubaker et al. (2019) study corporate documents written in their native language, in this paper, the English speaking authors develop a technique to permit them to study corporate documents written in Mandarin Chinese, of which we have little to no proficiency. This approach gains particular power when it is used by researchers, who use a phonological writing system. (e.g., English, which uses an alphabet of symbols to represent distinct spoken sounds (consonants and vowels) which are stringed together to represent words and phrases), to analyze written text based on logograms (e.g., Mandarin, which uses symbols representing entire words and phrases).
Our results find that agreement matters because it is priced. In our study, the top 20% of firms (by agreement) have mean underpricing of 105.08%. On the other hand, the bottom 20% of firms have mean underpricing of 34.85%. The difference of means between the two is statistically significant at the 1% level. Our empirical evidence suggests that agreement indicates strong demand at the time of the IPO (via underpricing) followed by disappointing long-run performance (via returns) indicating initial overestimation of firm value. Our study suggests that disagreement during the roadshow may help price IPOs more accurately, at least in China.
The remainder of the paper proceeds as follows: in the next section we analyze the extant economic literature regarding IPO pricing in the short and long-run. We then review the literature on content analysis and specifically how it has been applied in the IPO financial economics literature. After the literature review, we develop our testable hypotheses in Section 3. Section 4 provides a detailed explanation of the method, as it is a relatively new procedure for finance. Section 5 describes the data and provides summary statistics. The empirical results and robustness tests are discussed and presented in Section 6 and Section 7. The final section summarizes and concludes, to include implications, limitations, and future research avenues.
2. Literature Review
This review consists of three main sections: asset pricing, theory of communication accommodation, and empirical methodology. The pricing of IPOs in both the short term and long term has been studied extensively (e.g., the seminal work of Stoll and Curley (1970), Logue (1973) and Ibbotson (1975) on IPO underpricing and Ritter (1991) and Loughran and Ritter (1995) on long-run IPO returns). In general, IPOs have been shown to experience positive first-day returns, known as underpricing, and negative abnormal long-run returns (Bhabra and Pettway 2003). Communication accommodation has been widely studied in the fields of sociology and communication (Fischer 1958; Giles et al. 1973, 1987, 1991; Beebe and Giles 1984; Thakerar et al. 1982; Triandis 1960), and is a leading theory for how social dynamics affect communication. Textual or content analysis (to include Jaccard similarity) and its implications has been established in the finance literature fairly recently, so a summary in this section is appropriate. Extending Akerlof (1970), one can conceptualize a reduction in information asymmetry as the relationship between managers and investors improves and agreement increases. However, when selling securities on the primary market, homogeneous probabilities and information sets between investors and management motivates higher underpricing. The higher underpricing when agreement is high is tied to the fact that managers have an incentive to provide their primary investors with better initial returns. When agreement is high, management teams tend to provide a higher “discount” to their primary investors where those investors have more accurate expectations of the fundamental value of the company due to less information asymmetry through higher agreement.
A voluminous academic literature documents and attempts to explain why most IPOs end the first day of trading with a stock price that is significantly greater than the offer price that was sold to the primary market that same day. Underpricing is measured by most researchers as:
Underpricing = (1st Day Closing Price/IPO Offer Price) − 1
Over the period of 1960–2016, average underpricing in the US has been 16.76%, and for our sample period of 2004–2012, average underpricing has been 12.7%1. This underpricing represents “money left on the table” by the issuing firms (Loughran and Ritter 2002). Through the years many hypotheses have been proposed to explain why underpricing is observed and why it persists.
Theoretical models, such as Baron (1982) and Rock (1986), began explaining IPO underpricing in the context of asymmetric information (see also Li et al. (2005) and Boulton et al. (2021) for more recent treatments of information asymmetry in IPOs). Early empirical explanations of this anomaly have focused on quantifiable market and financial statement data (Beatty and Ritter 1986; Hanley 1993; Brau et al. 2014). Fedorova et al. (2022) demonstrate the influence of behavioral characteristics of management on IPO pricing. Finally, Brau et al. (2016) focused on the pricing of soft information on IPO pricing using a strategic word dictionary. They show that soft information exhibits a positive correlation to underpricing and a negative correlation to long-run stock performance. Specifically, IPOs with greater (less) usage of positive (negative) strategic words are correlated with greater (less) underpricing and better (worse) long-run performance. Communication Accommodation Theory (CAT) is a generalized extension of Speech Accommodation Theory, which encompasses all forms of communication. CAT has been largely supported by theoretical and empirical studies involving interpersonal (Giles et al. 1973; Giles 2016; Muir et al. 2016) and multicultural communication behaviors (Hajek et al. 2008; Simard et al. 1976). We are not the first to use similarity methods in measuring communication accommodation (Jones et al. 2014; Sagi and Diermeier 2017).
According to CAT, when two parties engage in positive social interactions (i.e., agreement) they tend to converge their communication style (word choice, intonation, phrasing, volume, etc.) in order to unify themselves with the other party (Giles et al. 1987; Kulesza et al. 2014). Conversely, insufficient accommodation or intentional non-accommodation can result in greater levels of disunity and conflict between two parties (Gasiorek and Giles 2012; Giles and Gasiorek 2013).
Empirical data supports the application of CAT and its subfields (Speech Accommodation Theory, Linguistic Style Accommodation, etc.) to negotiations (Sagi and Diermeier 2017; Swaab et al. 2011; Taylor and Thomas 2008) and online-multiparty interactions (Huffaker et al. 2011; Ludwig et al. 2014; Muir et al. 2017).
As seen in empirical studies, convergence in word choice reflects positive interactions and results in greater levels of unity and agreement (Kulesza et al. 2014; Linnemann and Jucks 2016; Muir et al. 2016, 2017; Sagi and Diermeier 2017; Van Baaren et al. 2003). We extend the communicative predictions, assumptions, and explanations of CAT to the financial negotiations during IPO roadshows. This approach allows us to quantify the quality of agreement between investors and firms by measuring the similarity in their word choices (using Jaccard (cosine) similarity methods) rather than using a dictionary of positive/negative terms which may unintentionally include cultural and language bias. Jaccard (cosine) similarity originates in the natural language processing literature (Manning and Schütze 1999) the information processing literature (Kwon and Lee 2003) and the finance and IPO literature (Hanley and Hoberg 2010). Specifically, Hanley and Hoberg (2010) use cosine similarity to compare content among pairs of matched IPOs. We use this approach in our paper because it enables us to study documents written in languages for which we have no reading or writing proficiency. This approach gains particular power when it is used by researchers, who use a phonological writing system (e.g., English which uses an alphabet of symbols to represent distinct spoken sounds, i.e., consonants and vowels, which are stringed together to represent words and phrases), to analyze written text based on logograms (e.g., Mandarin which uses symbols representing entire words and phrases).
We generalize linguistic convergence (similarity of word choice) as an indicator that communication between the two parties is positive and unifying. For simplicity, we define positive interactions during negotiations as agreement, i.e., the greater the linguistic convergence the greater the agreement between managers and investors.
3. Hypothesis Development
We use Jaccard similarity to measure agreement between management and investors during the IPO roadshow. Similarity in this context is consistent with a wide array of literature which relates linguistic decisions to interaction quality. We believe a plausible explanation is that managers do their best to match the style and diction of investors’ questions in their responses in order to improve interpersonal capital and perception (Jenkins and Owen 2021a, 2021b). Swaab et al. (2011) find that linguistic mimicry improved negotiation outcomes by improving interpersonal capital. Huffaker et al. (2011) find that linguistic convergence increased agreement between potential coalition partners in multiparty negotiations through improvements to interpersonal rapport. Kulesza et al. (2014) find that the repetition of a counterpart’s words increases their ability to elicit prosocial behavior from them. Sagi and Diermeier (2017) use latent semantic analysis similarity to measure the change in language similarity among negotiators and find that an increase corresponds to greater agreement among the parties. We should therefore expect similarity to proxy for agreement and perception in as much as it captures these linguistic strategies. Furthermore, we do not believe that positive perception will go unnoticed since Blankespoor et al. (2017) find that investor perception of CEOs is positively associated with price. We hypothesize that investors quiz management until they have sufficient information to make their investment decision. When the interaction between managers and investors is positive, we hypothesize that investors reach a satisfactory state more quickly and begin reaffirming previously stated information and providing feedback.
Langberg and Sivaramakrishnan (2010) suggest that this feedback may take the form of verbal praise in which the investor affirms that the information, provided by management, is valuable to them. In such a situation, the analyst is likely to repeat words and phrases that management used previously. The more quickly management and investors reach agreement the more time they will spend accommodating and converging their speech.
Likewise, if responses from management are dissatisfactory, investors will pose additional questions until satisfied. Interactions that struggle to become satisfactory yield less reaffirmation, feedback, and accommodation.
Our algorithms identify these situations by comparing the Chinese logograms used by managers to those used by investors. When both participants are using similar logograms, we say that there is agreement between manager and investor. We hypothesize two consequences to manager and investor agreement during a roadshow:
Hypothesis 1.
When investor and manager agreement is high during a roadshow, first day underperformance will be high.
Hypothesis 2.
When investor and manager agreement is high during a roadshow, subsequent long-term performance will be poor (investor over-optimism).
The first hypothesis is rooted in the notion that greater agreement indicates greater demand, which then manifests as greater underpricing (i.e., greater first-day return). The second hypothesis is founded on studies that show other types of over-optimism in IPOs (e.g., earnings management as in Teoh et al. 1998) lead to poor long-run performance. Empirically, Brau et al. (2016) show that greater first-day returns contribute to poor long-run underperformance as the stock price adjusts back to pricing equilibrium.
4. Textual Modeling Methodology
Measuring Agreement
Following Cohen et al. (2020), the Jaccard similarity measure is defined as the size of the intersection divided by the size of the union of two sets:
We extend this methodology to Chinese logograms, first parsing each roadshow transcript call into two separate documents. The first document contains only those comments made by management during the roadshow. The second document contains only those comments made by the investors during the roadshow.
We serialize the two documents into computer memory, Chinese character by Chinese character, to create logogram vector representations of each document. We remove non-informative logograms (Chinese equivalents of “the,” “a,” “is,” etc.). Each vector contains an element for each unique logogram in the section, where the element is a scalar count of the number of times that logogram appears in the session. We compute the Jaccard similarity between these vectors to determine the degree to which the two vectors are alike. A more rigorous analysis and application of this methodology can be found in Cicon (2017).
5. Data Description
The IPO companies are from the SME and ChiNext in ShenZhen Stock Exchange. Companies listed on the SME or ChiNext hold net roadshows at http://rsc.p5w.net/, (accessed on 7 February 2021) which allows us to use Python to web scrape the releases.
Our initial sample range is from 2004 and 2012. We end the sample of IPOs in 2012 because there are no IPOs in 2013, and China’s Securities Regulatory Commission stipulated an IPO’s first-day return cannot exceed 44% after January 1, 2014. See Appendix A.1, Appendix A.2, Appendix A.3 and Appendix A.4 for examples of interviews from which our textual analysis data is gleaned.
5.1. Dependent Variables
Our first hypothesis uses the dependent variable of IPO underpricing. The common definition uses First-day Return (Underpricing) as the IPO initial return, which is the percentage change in price from the IPO offer price to the closing price on the first day of trading. Our second hypothesis studies the impact of Agreement on Cumulative Abnormal Returns (CARs) relative to the ShenZhen index over a 1-, 2-, and 3-year horizon. The definition of the dependent variable here is CAR with the respective year.
We define CAR as:
where AR is the abnormal return for firm i on day t, R is the observed return of the firm on that day, and E[] is the expected return of the firm that day (R) adjusted for the return on the ShenZhen market that day (SZ), CAR is then the sum of the ARs for k equaling one-, two-, or three-year horizons for firm i.
ARi,t = Ri,t − E[Ri,t|SZt]
CARi,t+k = ΣkARi,t+k
5.2. Independent Variables
We use variables that have been shown in the extant literature to impact underpricing, along with our main variable of interest, Agreement. Following Borochin et al. (2018) we define each variable as:
Agreement = Jaccard similarity of the investor questions and management answers on the IPO Net Roadshow.
Tone of Question = Based on the NTUSD word list. The NTUSD word list is from Taipei university and is a general word list appropriate for native Chinese logograms.
Tone of Answer = Based on the NTUSD word list. The NTUSD word list is from Taipei University and is a general word list appropriate for native Chinese logograms.
Age = The age of the firm in years at the time it goes public.
Size = Total assets logged in the year before IPO.
ROE = Return on equity in the year before going public.
SOE = Dummy equaling one if state-owned and zero otherwise.
Lottery rate = The number of shares issued/the number of subscripted shares.
Offerprice = IPO offer price.
Offer_PE = IPO offer price/Earnings.
IPO Proceeds = The total number of shares offered in the IPO multiplied by price.
IPO Fees/IPO Proceeds = IPO Fees divided by IPO Offering Proceeds.
Primary Shares Offered = The number of shares offered where proceeds go to the firm.
Underwriter Prestige = Dummy equaling one if the underwriter is top 10.
Prior 3-month IPO volume = Sum of gross IPOs in the prior three months.
Average Prior 3-month Underpricing = Leading 3-month average underpricing IPOs.
Three-week Prior Market Return = ShenZhen stock market return for the 15 trading days before going public.
Fixed Effects = Controls for the year and industry of each offer.
5.3. Data Descriptive Statistics
Table 1 reports the sample distribution by industry and by year. The complete sample is composed of 980 firm observations drawn from the SME and ChiNext on the ShenZhen Stock Exchange, from 2004–2012.

Table 1.
Distribution of Sample by Industry and by Year. This Table reports the distribution of the sample by industry and by year. The full sample consists of 980 firm observations drawn from the SME and ChiNext on the ShenZhen Stock Exchange. The sample spans 2004 to 2012. The industry distributions are reported in Panel A and annual distributions are reported in Panel B.
As expected for the Chinese economy, manufacturing dominates the industry count with 715 IPOs (72.96% of the sample). The second most populous industry is information (n = 105, 10.71%). Every other industry has less than 3% representation and is fairly evenly distributed. The annual distribution of listings shows a low of 33 in 2004, following the global debt crisis, and a high of 316 in 2010.
The summary statistics for the sample are reported in Table 2. The average (median) underpricing for the sample is 63.6% (37.5%). Benchmarked to the US average underpricing of 17.6% mentioned earlier, this level of underpricing is relatively high. The agreement number has an average (median) of 21.3% (21.2%).
Table 2.
Summary Statistics of Sample Variables. This Table reports the summary statistics for our sample of 980 firm observations drawn from the SME and ChiNext on the ShenZhen Stock Exchange. The sample spans 2004 to 2012. Reported are the means, medians, standard deviation, minimum and maximum values for each of the variables used within our analysis. IPO Underpricing is the common definition that uses First-day Return (Underpricing) as the IPO initial return, which is the percentage change in price from the IPO offer price to the closing price on the first day of trading. Agreement is the Jaccard similarity of investor questions and management answers on the IPO Net Roadshow. Tone of Question = Based on the NTUSD word list. The NTUSD word list is from Taipei university and is a general word list appropriate for native Chinese logograms. Tone of Answer is based on the NTUSD word list. The NTUSD word list is from Taipei University and is a general word list appropriate for native Chinese logograms. Age is the age of the firm in years at the time it goes public. Size is the total assets logged in the year before IPO. ROE is defined as the return on equity in the year before going public and SOE is a dummy equal to one if state-owned and zero otherwise. Lottery rate is the number of shares issued/the number of subscripted shares. Offerprice and Offer PE are the IPO offer price and IPO offer price/earnings, respectively. IPO Proceeds represents the total number of shares offered in the IPO multiplied by price. IPO Fees/IPO Proceeds are the IPO Fees divided by IPO Offering Proceeds. Primary Shares Offered are the number of shares offered where proceeds go to the firm. Underwriter Prestige is a dummy equaling one if the underwriter is top 10. Prior three-month IPO volume is the sum of gross IPOs in the prior three months. Average Prior three-month Underpricing is the leading three-month average underpricing IPOs. Lastly, Three-week Prior Market Return is the ShenZhen stock market return for the 15 trading days before going public.
6. Empirical Results
In this section we discuss the empirical findings for our two testable hypotheses.
Table 3 reports Spearman correlation coefficients. Most significant for our research are the correlations between agreement and IPO underpricing, Tone of question, Tone of answer, SOE, lottery rate, offer price, offer PE, offer proceeds, underwriter prestige, prior three-month IPO volume, and prior three-month underpricing that are significant at the 1% level. In fact, only three variables in the study showed correlation with agreement at a significance level less than 10%, namely size, ROE, and three-week prior market return.
Table 3.
Correlations.
6.1. Univariate Analysis
We begin with a univariate analysis of the agreement-underpricing relationship. We divide sample IPO firms into five groups based on agreement. Group 1 has the lowest agreement while Group 5 has the highest. We then calculate the average underpricing for each of the five groups and plot the results in Figure 1. Figure 1 shows that the average underpricing in Group 1 is only 34.85%, whereas the average underpricing in Group 5 is 105.08%. The difference between the average underpricing in the two groups is statistically significant (p value < 0.01). The figure also shows that average underpricing increases monotonically when moving from Group 1 to Group 5.
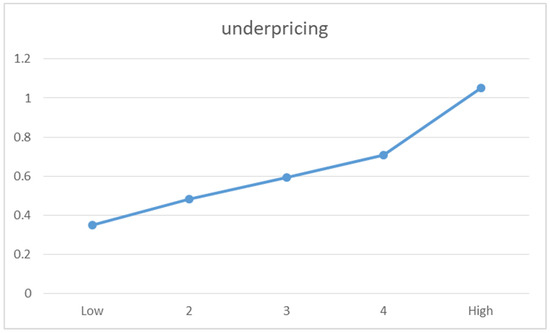
Figure 1.
Agreement and Underpricing: Univariate Analysis.
Figure 1 plots the average underpricing for quintiles by Agreement. We divide the sample into quintiles of interaction quality and plot the mean first-day return for each quintile. The x-axis is the respective quintile, and the y-axis is the average underpricing reported as a decimal. The difference between the average underpricing of the lowest and highest quintiles is statistically significant at the 1% level.
In unreported analyses we have conducted t-tests (means) and Wilcoxon nonparametric tests (medians) along with truncation and winsorization. Our results are robust to these tests. We feel our reported multivariate models are superior to pairwise means and medians testing as we can control for confounding effects and mitigate omitted variable bias. Figure 1 expands the statistics reported in Table 2 for underpricing. Next, we explore whether this effect persists in a multivariate framework.
6.2. Agreement and Underpricing
Table 4 is central to our paper because it clearly demonstrates a correlation between agreement and underpricing after adjusting for other factors. We report three different models to demonstrate the robustness of our agreement measure and to eliminate concerns of multicollinearity.
Table 4.
Agreement and Underpricing.
Model 1 shows a significant relationship between agreement and underpricing with no control variables other than year and industry fixed effects. Model 2 performs well with an increase in the goodness of fit, which is expected when additional controls are added. In Model 2 three new variables (size, roe, and SOE) are found to be significant with p value less than 5%. Model 3 also performs well. We see an incremental loss of economic significance when we add offer characteristics, but the loss is not remarkably large. Within our full model, Model 4, the agreement coefficient retains significant economic and statistical significance.
6.3. Agreement and Long-Term Performance
Like Table 4, Table 5 is central to our thesis. For this data, we used the IPO performance model. The results are displayed for several different periods ranging from one to three years. The post-IPO stock returns are significantly and negatively associated with agreement up to three years after the IPO. Such long-term underperformance by IPOs is common and aligns with the current theory. The economic impact of agreement on the post-IPO returns is also significant. A one standard deviation increase of agreement (0.034) is associated with one-year, two-year, and three- year post IPO abnormal returns of 2.61%, 3.60%, and 3.86%, respectively. This data shows that agreement retains its ability to predict CARs for at least three years. Agreement, therefore, is a key long-term variable currently missing from existing CAR models. The Agreement variable remains significant for Underpricing, BHAR-1, and BHAR-2. The Tone of Answer variable is robust to Underpricing, BHAR-1, and BHAR-3. Control variables also remain robust in each specification.
Table 5.
Agreement and Subsequent Cumulative Abnormal Performance.
7. Robustness Checks
7.1. Different Dependent Variables
Following Chen et al. (2015), we calculate market-adjusted underpricing:
where, P1 is the closing price of the first trading day, P0 is the IPO offering price, and M0 and M1 are the A-share market index closing prices on the IPO issuing day and the first trading day, respectively. For robustness, we provide Table 6, which is economically equivalent to Table 4.
Underpricing = (P1 − P0)/P0 − (M1 − M0)/M0
Table 6.
Robustness Check: Market Adjusted Underpricing and BHAR.
Following Brau et al. (2016), we use the abnormal buy-and-hold return (BHAR) to measure long-term performance. Again for robustness, we provide Table 6 which is qualitatively similar to Table 5.
We define BHAR as:
where R is the observed return for firm i on day t, and SZ is return on the ShenZhen market index that day. BHAR is computed as the product of one plus R over periods of k of one, two, and three years for firm i minus the product of one plus SZ over the corresponding periods.
BHARi,t+k = Πk(1 + Ri,t+k) − Πk(1 + SZi,t+k)
7.2. Industry-Adjusted Agreement
In this section we test for industry impacts that could possibly alter our findings as per Ibbotson et al. (1988, 1994) and Alti (2005). To operationalize this robustness test, we adjust the agreement variable by the median agreement of the IPO’s industry at the time of going public. Table 7 provides evidence that the Agreement variable is robust with all four dependent variables—Underpricing, 1-Year CAR, 2-Year Car, and 3-Year CAR. These results are robust to the entire portfolio of control variables as well as year and industry fixed effects. The Agreement variable remains significant for Underpricing, BHAR-1, and BHAR-2. The Tone of Answer variable is robust to Underpricing, BHAR-1, and BHAR-3. Control variables also remain robust in each specification. Thus, the Agreement variable and Tone of Answer variables remain robust. In addition, the relevant control variables continue to hold explanatory power.
Table 7.
Robustness Check: Industry-adjusted Agreement.
8. Conclusions
We find statistically significant correlations between agreement at the Chinese roadshows and key metrics of the resulting IPOs, including underpricing and cumulative abnormal returns. Our research suggests that a company is better able to avoid underpricing its IPO when there is serious discussion and disagreement during the Q&A session of its roadshow. Were this pattern found to be consistent across all roadshows and all languages, a company could strategically encourage disagreement at its roadshow question and answer sessions to price its IPO to minimize underpricing and maximize equity issuance revenue.
The agreement variable also provides an additional metric that both investors and managers can use to predict short- and long-term stock value behavior from as early as the issuer’s IPO roadshow. While agreement cannot be used alone as a crystal ball investing tool, our research suggests that agreement fits into, and improves existing IPO pricing models leading to more precise calculations and therefore reducing money lost due to model error. Agreement is a particularly good indicator of cumulative abnormal returns for at least three years after an IPO is made.
Our findings have practical and policy implications. Regulators could improve original IPO pricing by encouraging or creating policies that promote vigorous debate and discussion pertaining to the firm in question. This increased rigor could lead to less underpricing and more efficient pricing. In addition to initial IPO pricing, improved policy to increase careful and thoughtful discussion during roadshows can lead to better long-term price predictions.
Like all studies, our paper contains limitations to consider. We study only one country, China, with one method, Jaccard Similarity. We cannot say whether our results will extend to other countries, cultures, or languages. As such, further research avenues could include using Jaccard Similarity methods on other languages and in other countries to study agreement in the roadshow. In addition, other methods of agreement could be developed, as well as studying alternative corporate events surrounding IPOs, such as analyst reports and filing prospectuses.
In conclusion, this study has presented empirical evidence that agreement among investors and insiders in IPOs during the roadshow has statistically significant pricing impacts both in the short- and long-term. We apply Jaccard Similarity to the IPO literature as a language-neutral textual analysis tool and demonstrate that soft information that is gleaned from roadshows is not trivial.
Author Contributions
The three authors contributed equally. All authors have read and agreed to the published version of the manuscript.
Funding
This research received no external funding.
Data Availability Statement
Data conditionally available upon request.
Conflicts of Interest
The authors declare no conflict of interest.
Appendix A
Appendix A.1. Text of Sample Questions and Responses
A1: Sample Question Text
Company ID: 002275
Company Industry: Manufacturing
IPO Date: 2009-07-10
我问的是”前十大自然人股东有几个是邹总亲戚,比如妻,子,儿媳,女婿”,不是问”董事会任职”,谢谢!
公司现金流充沛,为何还要融资??
一旦对项目的投资超过预算或投资期被迫延长,公司是打算继续追加投资还是放弃?
公司上市后对组织结构有何调整?
请问公司经营目标如何实现?
请说一下公司上游产业的情况?
其他企业进入医药行业有哪些壁垒?
公司如何保障新产品开发在竞争中持续领先?
请介绍贵公司的客户情况?
2006年,国家有关部门出台了一系列政策对医药行业进行调控,请问这些调控对于医药行业的影响如何?
请问邹节明董事长:公司是否实施了股权激励?若无,今后是否有实施股权激励的打算?
请问王总,即将出台的《基本药物目录》对三金药业的发展会有什么样的影响?谢谢
请问金融危机对公司影响如何?
现在有股票上市后跌破了发行价,这说明投资者已经逐步开始理性投资,董事长,您对自己的股票是否有信心?贵公司的股票是否会跌破发行价?
请问:产品提价后,公司产品销量08年下降,此时融资扩大生产,公司是何打算,能详细谈谈吗?
你们一年的广告费用是多少?
上市前这么高比例的现金分红,是否会影响社会公众股东的利益?
上市后还会保持这么高比例的分红么?如何保证?
请问:与目前沪深股市的平均市盈市比较,你认为三金药业首发市盈率是高还是低,每股净资产是否太低。19.8元的申购价是否具有吸引力,当前申购是否是最佳时机。谢谢。
董事长,跟我们说说公司研发机构的设置情况吧?
公司募集到的,超过募投项目的资金,将如何处理?
你们公司有实行股权激励计划吗
请问邹董事长,你认为三金上市后股价会达到多少? 你自己的心理价位是多少?
请问董事长:三金拳头产品”西瓜霜”系列确实热卖过,但不可否认,其高峰期已经过去.公司如何保证上市后持续营利的能力,有何规划?公司没有在高速成长期申请上市而选择此时上市,是不是也因为业务走下坡路的现状而逼迫大股东以上市的方式寻求股权退出!谢谢.
请问公司上市后,以后会不会有资产注入的预期?
土地对价支付了吗?我算你看看。公司经营性净资产11982.11万元,扣除职工安置等三项(1033.95万元、166.4万元、2200.66万元),正好等于打折前净资产8581.11万元,而招股书P46”经评估确认的发行人经营性净资产扣除土地使用权、职工安置费、离退休人员医药费及补贴,剩余99,039,397.90 元”据此测算土地价值应为879.82万元,土地价款体现在哪了?实在不明白
网友提问 的问题是不是100都回答呢?
我们注意到,贵公司本次公开发行4600万股,占发行后总股本45400万股的10.13,证券法规定,公开发行的股份达到公司股份总数的百分之二十五以上,是否矛盾?
对于有人实名举报至证监会,公司是否存在向立立电子一样申购完成但无法上市的情景?
这么多年的苦心经营不易啊,这么好的一个国有企业(93年末净资产2040万元,97年末已达13103万元,还不包括其间高得惊人的工资支出和可能的利润分配),4年净资产增长5倍啊,打6折就变为个人公司了,有何感慨?
你们有进行行业内并购的想法吗,以实现公司跨越式发展
Appendix A.2. Translation Text of Sample Questions and Responses
A2: Google Translation of Sample Question Text
Company ID: 002275
Company Industry: Manufacturing
IPO Date: 2009-07-10
I asked the “top ten natural person shareholders are a few relatives of Zou, such as his wife, son, daughter, son-in-law,” is not asked “Board of Directors”, thank you!
Company cash flow, why should the financing? The
Once the investment in the project exceeds the budget or the investment period is forced to extend, the company is going to continue to increase investment or give up?
What is the structure of the company after the listing of the adjustment?
What is the business objectives of the company?
Please talk about the company’s upstream industry situation?
What are the barriers to other companies entering the pharmaceutical industry?
How does the company ensure that new product development continues to lead in the competition?
Please introduce your company’s customer situation?
In 2006, the relevant state departments issued a series of policies to regulate the pharmaceutical industry, I would like to ask these controls on the impact of the pharmaceutical industry?
What is the company’s implementation of the equity incentive? If not, whether the future implementation of equity incentive plan?
Will Wang, the upcoming “essential drugs directory” on the development of three gold medicine will have what kind of impact? Thank you
What is the impact of the financial crisis on the company?
Now there is a stock listed below the issue price, which shows that investors have gradually began to rational investment, chairman of the stock, whether you have confidence in their own stock? Will your company’s stock be below the issue price?
I ask: product price increases, the company’s product sales decline in 2008, this time financing to expand production, the company is how to plan to talk about it?
What is the cost of advertising for your year?
Will such a high percentage of cash dividends before the listing affect the interests of the public shareholders?
After the listing will maintain such a high proportion of dividends it? How to guarantee?
I would like to ask: Compared with the current average market surplus in Shanghai and Shenzhen stock market, do you think Sanjin Pharmaceutical is the first P / E is high or low, whether the net assets per share is too low. 19.8 yuan purchase price is attractive, whether the current purchase is the best time. Thank you.
Chairman, tell us about the company’s R & D institutions set up it?
The company raised, more than raised funds raised funds, how will deal with?
Does your company have a equity incentive plan?
Will Zou chairman, do you think the three gold after the listing will reach the number of shares? What is your own psychological price?
I would like to ask the chairman: three gold fist products “watermelon cream” series really hot, but it is undeniable that the peak has passed. How to ensure that the company after the listing of the ability to continue to profit, what planning? The company did not apply for listing in the high-speed growth period Choose this time listed, is not because of the status quo of the business downhill and forced the way the majority of shareholders to seek equity exit! Thank you.
Will the company listed, the future will not be expected to inject assets?
Is land payment paid? I count you look. The net assets of the company operating 11,982.11 million, net of workers and other three (10,339,500 yuan, 1.664 million yuan, 22,006,600 yuan), just equal to the discount before the net assets of 85.811 million yuan, and prospectus P46 “assessed by the issuer Operating net assets deducted land use rights, staff placement fees, retired staff medical expenses and subsidies, the remaining 99,039,397.90 yuan “According to the estimated land value should be 8.7982 million yuan, where the land price reflected? Really do not understand.
User question is not 100 questions to answer?
We note that your company’s public offering of 4600 million shares, accounting for the total issued share capital of 45,400 million shares of 10.13, the securities law provides that the public offering of shares to reach more than 25 percent of the total number of shares, whether contradictory?
For someone to report to the SFC, the company has the same as the establishment of legislation to complete the purchase of electronic but can not be listed on the scene?
(93 at the end of the net assets of 20.4 million yuan, at the end of 97 has reached 131.03 million yuan, not including the high amazing wage expenditure and possible profit distribution), 4 years Net assets increased 5 times ah, playing 6 fold into a personal company, and what feeling?
Appendix A.3. Text of Sample Response
A3: Sample Response Text
Company ID: 002275
Company Industry: Manufacturing
IPO Date: 2009-07-10
通过上市融资渠道,把公司做大做强,为社会承担更大的责任;其次公司上市将促进公司更进一步的规范运作,使公司能建立与资本市场相通的发展平台,参与国内、国际竞争;最后公司成为公众公司之后,公司的融资渠道将进一步扩宽,公司资本结构将变得更加合理。便于公司在资本市场上进行资本运作。谢谢!
我们的投资预算经过严格的论证和反复的测算,具备较强的可行性。同时,在项目建设过程中,我们也会对各项支出予以严格控制,确保将投资总额控制在预算之内。谢谢!
公司将向规模化方向发展,调整部门设置、工作职责;兼顾决策权、指挥权、监督权相对分离,形成运作高效、协调有力、管理有序的企业组织新格局。公司将进一步健全公司的治理,按照《公司章程》的规定,强化股东大会、董事会、监事会的职能,充分发挥董事会下设之战略委员会、薪酬与考核委员会等专业委员会的作用,强化独立董事的职能,加强公司内部管理。谢谢!
公司为达到经营目标的实现,预计将从以下方面着手:1、加强市场开发策略及系统支持2、加强销售网络建设3、推进技术开发及管理4、强化质量管理5、加强生产管理6、完善人力资源管理7、加强企业管理谢谢!
中药行业的上游行业为原料中药材的种植和供应,就目前来看,上游中药材价格基本保持稳定,中药行业的原料成本变化不大。但从长远来看,中成药原料药材大部分来源于野生自然生长、季节采集的地产药材,产地分布具有明显的地域性,目前暂时无法实施大面积种植,由于野生药材生长速度无法跟上采挖的速度,而且中药资源的开发利用缺乏法规保护,目前处于无序开发的状况,如果发生自然灾害或经济环境等因素发生较大变化,可能会出现原材料短缺或价格上涨的情况,导致供求关系出现比较大幅度的波动。谢谢!
进入医药行业需要面对的壁垒主要可以分为政策壁垒、资金壁垒和品牌壁垒等三个方面。具体体现在:1、政策壁垒。我国对药品生产企业实行许可证制度,开办药品生产企业,必须具备一定的条件,必须获得国家药品监督管理部门颁发的药品生产许可证。为了加强对医药企业的质量管理,保证人民用药安全有效,国家规定所有药品制剂和原料药的生产都必须符合GMP要求。2、资金壁垒。医药行业是高技术、高风险、高投入的产业。一般情况下,药品从研究开发、临床试验、试生产到最终产品的销售,需要投入大量的时间、资金、人才、设备等资源。随着《药品管理办法》的颁布实施,我国中药行业的发展日益规范化和产业化,而且随着中药生产现代化步伐的加快,中药企业在技术、设备、人才等方面的投入越来越大。中药行业已经发展成为技术密集型、资金密集型和规模效益型企业,没有一定的技术、资金的支撑和先进的管理,是无法在日益激烈的市场竞争中立足的,因此,对于进入中药行业的企业有较高的资金和规模要求。3、品牌壁垒。品牌中药产品定位明确、疗效确切、消费忠诚度高,销售稳定。中药服用者的用药习惯比较稳定,对已使用产品忠诚度高。新建的中药企业要想从现有企业手中争夺客户,就必须在产品、营销等方面进行大规模的投资,并且这种投资具有很大的风险。谢谢。
公司形成了有利于技术创新和发展的机制与环境,为今后公司的持续发展奠定了基础。具体体现在以下方面:1、明确的技术创新发展战略多年来公司为了取得长久竞争优势,一直坚持走自主创新的道路,确定了企业技术创新发展战略:坚持以中医药理论为指导,现代科学技术为手段,广西丰富的中草药和壮、瑶等民族用药经验为依托,开发安全、有效、质量可控、市场空白或紧缺,有三金特色的有独立知识产权的现代中成药。2、有效的企业技术创新体系公司高度重视企业的自主创新体系建设,以企业技术中心为核心,建立了以公司级领导亲任技术中心主任的技术创新体系,同时鼓励各层次的群众性技术创新,使整个企业形成了领导重视,员工积极参与技术创新、产品创新、工艺创新的良好的创新环境和文化氛围。在建设创新体系过程中,建立了较完善的组织机构,企业技术创新体系包括决策层、管理层和实施层。3、树立了满足市场需要和科技进步为核心的技术开发理念公司的技术开发形成了传统技术、一般技术、高新技术相结合的多层次结构,其中,市场的需要和科技进步是公司技术开发的核心。4、建立了有利于技术开发的激励机制为增强技术中心的自主创新能力,公司建立了有效的人才引进、培养、激励、考核等机制,形成了一整套促进技术开发和技术创新的政策。公司在工资分配、出国考察、在职培训等方面均向专业技术人才倾斜,还制定了公司科技进步奖励管理条例,以鼓励技术创新。
Appendix A.4. Translation Text of Sample Response
A4: Google Translation of Sample Response Text
Company ID: 002275
Company Industry: Manufacturing
IPO Date: 2009-07-10
Through the listed financing channels, the company bigger and stronger for the community to assume greater responsibility; followed by the company listed will promote the company to further standardize the operation so that the company can establish a development platform with the capital market, participate in domestic and international competition; After the company became the public company, the company’s financing channels will be further widened, the company’s capital structure will become more reasonable. To facilitate the company in the capital market for capital operation. Thank you!
Our investment budget through rigorous argument and repeated estimates, with a strong feasibility. At the same time, in the project construction process, we will be the expenditure to be strictly controlled to ensure that the total investment in the budget control. Thank you!
The company will be the direction of the development of large-scale, adjust the department set up, job responsibilities; taking into account the decision-making power, command, the right to monitor the relative separation of the formation of efficient operation, coordination and orderly business structure of a new pattern. The Company will further improve the governance of the Company and strengthen the functions of the Shareholders’ General Meeting, the Board of Directors and the Supervisory Committee in accordance with the provisions of the Articles of Association, give full play to the role of the professional committees under the Board of Directors, the Commission of Remuneration and Appraisal Committee, and strengthen the functions of independent directors, To strengthen the company’s internal management. Thank you!
The company to achieve business objectives, is expected to proceed from the following aspects: 1, to strengthen market development strategies and system support 2, to strengthen the sales network construction 3, to promote technology development and management 4, strengthen quality management 5, strengthen production management 6, Human resources management 7, strengthen business management Thank you!
Chinese medicine industry upstream industry as raw materials for the cultivation and supply of Chinese herbal medicines, for now, the upstream Chinese herbal medicine prices remained stable, the traditional Chinese medicine industry, raw material costs change little. However, in the long run, most of the raw materials of traditional Chinese medicine are derived from wild natural growth. The seasonal distribution of real estate medicinal materials and origin has obvious regionality. At present, large-scale cultivation can not be carried out temporarily. Since the growth rate of wild medicinal materials can not keep up with the excavation The development and utilization of traditional Chinese medicine resources, the lack of regulatory protection, is currently in a disorderly development of the situation, if a natural disaster or economic environment and other factors have changed greatly, there may be raw material shortage or price increases, resulting in supply and demand Relatively large fluctuations. Thank you!
Access to the pharmaceutical industry needs to face the barriers can be divided into policy barriers, financial barriers and brand barriers and other three aspects. Specifically embodied in: 1, policy barriers. China’s pharmaceutical production enterprises to implement the licensing system, the establishment of pharmaceutical production enterprises, must have certain conditions, must obtain the national drug regulatory authorities issued by the drug production license. In order to strengthen the quality management of pharmaceutical enterprises to ensure the safety and effectiveness of the people’s medication, the state provides that all pharmaceutical preparations and API production must meet the GMP requirements. 2, capital barriers. The pharmaceutical industry is a high-tech, high-risk, high-input industry. Under normal circumstances, drugs from research and development, clinical trials, trial production to the final product sales, need to invest a lot of time, capital, talent, equipment and other resources. With the promulgation and implementation of the “Drug Administration Measures”, the development of Chinese medicine industry has become increasingly standardized and industrialized, and with the accelerated pace of modernization of Chinese medicine production, Chinese medicine enterprises in technology, equipment, personnel and other aspects of investment is growing. Chinese medicine industry has developed into a technology-intensive, capital-intensive and economies of scale enterprises, there is no certain technology, capital support and advanced management, is unable to compete in the increasingly fierce market foothold, therefore, for the Chinese medicine industry Enterprises have higher funding and scale requirements. 3, brand barriers. Brand Chinese medicine product positioning clear, effective, high consumer loyalty, sales stability. Traditional Chinese medicine medication habits are relatively stable, high loyalty to the use of products. New Chinese medicine enterprises in order to compete for customers from the hands of existing enterprises, it must be in the product, marketing and other aspects of large-scale investment, and this investment is a great risk. Thank you.
The company formed a favorable mechanism for technological innovation and development of the environment and the future for the company’s sustainable development laid the foundation. Concrete in the following areas: 1, a clear strategy for the development of technological innovation Over the years the company in order to achieve long-term competitive advantage, has always insisted on the path of independent innovation, to determine the development of enterprise technology innovation strategy: adhere to the theory of Chinese medicine as a guide, modern science and technology.
Note
| 1 | See Jay Ritter’s IPO data found at https://site.warrington.ufl.edu/ritter/ipo-data/ (accessed on 7 February 2021). |
References
- Adcock, D. Kamiko Ho’okano, James C. Brau, and Jessica West. 2020. An empirical analysis of hospital public equity financing. Management in Healthcare 4: 360–74. [Google Scholar]
- Afanasyev, Dmitriy, Elena Fedorova, and Svetlana Ledyaeva. 2021. Strength of words: Donald Trump’s tweets, sanctions and Russia’s ruble. Journal of Economic Behavior and Organization 184: 253–77. [Google Scholar] [CrossRef]
- Akerlof, George A. 1970. The market for ‘lemons’: Qualitative uncertainty and the market mechanism. Quarterly Journal of Economics 84: 488–500. [Google Scholar] [CrossRef]
- Alti, Aydogan. 2005. IPO market timing. Review of Financial Studies 18: 1105–38. [Google Scholar] [CrossRef]
- Ang, James S., and James C. Brau. 2002. Firm transparency and the costs of going public. Journal of Financial Research 25: 1–17. [Google Scholar] [CrossRef]
- Ang, James S., and James C. Brau. 2003. Concealing and confounding adverse signals: Insider wealth-maximizing behavior in the IPO process. Journal of Financial Economics 67: 149–72. [Google Scholar] [CrossRef]
- Baron, David P. 1982. A model of the demand for investment banking advising and distribution services for new issues. Journal of Finance 37: 955–76. [Google Scholar] [CrossRef]
- Beatty, Randolph P., and Jay R. Ritter. 1986. Investment banking, reputation, and the underpricing of initial public offerings. Journal of Financial Economics 15: 213–32. [Google Scholar] [CrossRef] [Green Version]
- Beebe, Leslie M., and Howard Giles. 1984. Speech-accommodation theories: A discussion in terms of second-language acquisition. International Journal of the Sociology of Language 46: 5–32. [Google Scholar] [CrossRef]
- Benson, David F., James C. Brau, James Cicon, and Stephen P. Ferris. 2015. Strategically camouflaged corporate governance in IPOs: Entrepreneurial masking and impression management. Journal of Business Venturing 30: 839–64. [Google Scholar] [CrossRef]
- Bhabra, Harjeet S., and Richard H. Pettway. 2003. IPO prospectus information and subsequent performance. Financial Review 38: 369–97. [Google Scholar] [CrossRef]
- Blankespoor, Elizabeth, Bradley E. Hendricks, and Gregory S. Miller. 2017. Perceptions and price: Evidence from CEO presentations at IPO roadshows. Journal of Accounting Research 55: 275–327. [Google Scholar] [CrossRef]
- Borochin, Paul A., James E. Cicon, R. Jared DeLisle, and S. McKay Price. 2018. The effects of conference call tones on market perceptions of value uncertainty. Journal of Financial Markets 40: 75–91. [Google Scholar] [CrossRef]
- Boubaker, Sabri, Alexis Cellier, Riadh Manita, and Narjess Toumi. 2020. Ownership structure and long-run performance of French IPO firms. Management International 24: 135–52. [Google Scholar] [CrossRef]
- Boubaker, Sabri, Dimitrios Gounopoulos, Antonios Kallias, and Konstantinos Kallias. 2017. Management earnings forecasts and IPO performance: Evidence of a regime change. Review of Quantitative Finance and Accounting 48: 1083–121. [Google Scholar] [CrossRef] [Green Version]
- Boubaker, Sabri, Dimitrios Gounopoulos, and Hatem Rjiba. 2019. Annual report readability and stock liquidity. Financial Markets, Institutions & Instruments 28: 159–86. [Google Scholar]
- Boulton, Thomas J., Bill B. Francis, Thomas Shohfi, and Daqi Xin. 2021. Investor awareness or information asymmetry? Wikipedia and IPO underpricing. Financial Review 56: 535–61. [Google Scholar] [CrossRef]
- Brau, James C. 2012. Why do firms go public. In The Oxford Handbook of Entrepreneurial Finance. New York: Oxford University Press, pp. 467–94. [Google Scholar]
- Brau, James C., and C. Troy Carpenter. 2013. SB IPOs and IPO Anomalies: An Empirical Analysis of the Small Firm Uniqueness Hypothesis. The Journal of Entrepreneurial Finance (JEF) 16: 75–96. [Google Scholar]
- Brau, James C., and David Heywood. 2008. IPO and SEO waves in health care real estate investment trusts. Journal of Health Care Finance 35: 70–88. [Google Scholar]
- Brau, James C., and Gordon Gee. 2010. Micro-IPOs: An analysis of the Small Corporate Offering Registration (SCOR) procedure with national data. Journal of Entrepreneurial Finance, JEF 14: 69–89. [Google Scholar]
- Brau, James C., and Jonathan M. Holloway. 2009. An empirical analysis of health care IPOs and SEOs. Journal of Health Care Finance 35: 42–64. [Google Scholar] [PubMed]
- Brau, James C., and Javier Rodríguez. 2009. An empirical analysis of Mexican and US closed-end mutual fund IPOs. Research in International Business and Finance 23: 1–17. [Google Scholar] [CrossRef]
- Brau, James C., and Jerome S. Osteryoung. 2001. The determinants of successful micro-IPOs: An analysis of issues made under the Small Corporate Offering Registration (SCOR) procedure. Journal of Small Business Management 39: 209–27. [Google Scholar] [CrossRef]
- Brau, James C., and J. Troy Carpenter. 2012a. Small-Firm uniqueness and signaling theory. Journal of Business Economics and Finance 1: 50–63. [Google Scholar]
- Brau, James C., and J. Troy Carpenter. 2012b. Efficacy of the. 1992 Small Business Incentive Act. Journal of Financial Economic Policy 4: 204–17. [Google Scholar] [CrossRef]
- Brau, James C., and J. Troy Carpenter. 2017. Equity Issuance of Health Care Firms after the. 2007 Market Crash and the. 2010 Affordable Care Act. Journal of Health Care Finance 43: 1–15. [Google Scholar] [CrossRef]
- Brau, James C., and Peter M. Johnson. 2009. Earnings management in IPOs: Post-engagement third-party mitigation or issuer signaling? Advances in Accounting 25: 125–35. [Google Scholar] [CrossRef]
- Brau, James C., and Stanley E. Fawcett. 2006a. Initial public offerings: An analysis of theory and practice. The Journal of Finance 61: 399–436. [Google Scholar] [CrossRef]
- Brau, James C., and Stanley E. Fawcett. 2006b. Evidence on what CFOs think about the IPO process: Practice, theory, and managerial implications. Journal of Applied Corporate Finance 18: 107–17. [Google Scholar] [CrossRef]
- Brau, James C., Bill Francis, and Ninon Kohers. 2003. The choice of IPO versus takeover: Empirical evidence. The Journal of Business 76: 583–612. [Google Scholar] [CrossRef] [Green Version]
- Brau, James C., David A. Carter, Stephen E. Christophe, and Kimberly G. Key. 2004. Market reaction to the expiration of IPO lockup provisions. Managerial Finance 30: 87–103. [Google Scholar] [CrossRef]
- Brau, James C., Drew Dahl, Hongjing Zhang, and Mingming Zhou. 2014. Regulatory reforms and convergence of the banking Sector: Evidence from China. Managerial Finance 40: 956–68. [Google Scholar] [CrossRef]
- Brau, James C., Francis E. Laatsch, and Mingsheng Li. 2008. IPO Pricing and Equity Return Swap. Financial Decisions 20: 1–31. [Google Scholar]
- Brau, James C., James Cicon, and Grant McQueen. 2016. Soft strategic information and IPO underpricing. Journal of Behavioral Finance 17: 1–17. [Google Scholar] [CrossRef]
- Brau, James C., J. Troy Carpenter, Mauricio Rodriguez, and C. F. Sirmans. 2013. REIT going private decisions. The Journal of Real Estate Finance and Economics 46: 24–43. [Google Scholar] [CrossRef]
- Brau, James C., Mingsheng Li, and Jing Shi. 2007. Do secondary shares in the IPO process have a negative effect on aftermarket performance? Journal of Banking & Finance 31: 2612–31. [Google Scholar]
- Brau, James C., Ninon Kohers Sutton, and Nile W. Hatch. 2010. Dual-track versus single-track sell-outs: An empirical analysis of competing harvest strategies. Journal of Business Venturing 25: 389–402. [Google Scholar] [CrossRef]
- Brau, James C., Patricia A. Ryan, and Irv DeGraw. 2006. Initial public offerings: CFO perceptions. Financial Review 41: 483–511. [Google Scholar] [CrossRef]
- Brau, James C., Robert B. Couch, and Ninon Kohers Sutton. 2012. The desire to acquire and IPO long-run underperformance. Journal of Financial and Quantitative Analysis 47: 493–510. [Google Scholar] [CrossRef]
- Brau, James C., J. Troy Carpenter, James Cicon, and Shelly Howton. 2021. Soft Information and the underpricing of REIT Seasoned Equity Offerings. Journal of Real Estate Portfolio Management 27: 137–48. [Google Scholar] [CrossRef]
- Brau, James C., Val E. Lambson, and Grant McQueen. 2005. Lockups revisited. Journal of Financial and Quantitative Analysis 40: 519–30. [Google Scholar] [CrossRef]
- Brogi, Marina, Valentina Lagasio, and Valerio Pesic. 2020. Can governance help in making an IPO “successful”? New evidence from Europe. Journal of International Financial Management and Accounting 31: 239–69. [Google Scholar] [CrossRef]
- Cao-Alvira, Jose J., and Javier Rodríguez. 2017. IPO and Aftermarket Performance of Single-Listed Chinese ADRs. Journal of International Financial Management and Accounting 28: 5–26. [Google Scholar] [CrossRef] [Green Version]
- Chen, Yibiao, Steven Shuye Wang, Wei Li, Qian Sun, and Wilson H.S. Tong. 2015. Institutional environment, firm ownership, and IPO first-day returns: Evidence from China. Journal of Corporate Finance 32: 150–68. [Google Scholar] [CrossRef]
- Cicon, James. 2017. Say it again Sam: The information content of corporate conference calls. Review of Quantitative Finance and Accounting 48: 57–81. [Google Scholar] [CrossRef]
- Cohen, Lauren, Christopher Malloy, and Quoc Nguyen. 2020. Lazy prices. Journal of Finance 75: 1371–415. [Google Scholar] [CrossRef]
- Das, Sanjiv R., and Mike Y. Chen. 2007. Yahoo! for Amazon: Sentiment extraction from small talk on the web. Management Science 53: 1375–88. [Google Scholar] [CrossRef] [Green Version]
- Fedorova, Elena, Sergei Dryuchok, and Pavel Drogovoz. 2022. The impact of news sentiment and topics on the underestimation of IPO prices: US data. International Journal of Accounting and Information Management 30: 73–94. [Google Scholar] [CrossRef]
- Fischer, John L. 1958. Social influences on the choice of a linguistic variant. Word 14: 47–56. [Google Scholar] [CrossRef]
- Gasiorek, Jessica, and Howard Giles. 2012. Effects of inferred motive on evaluations of nonaccommodative communication. Human Communication Research 38: 309–31. [Google Scholar] [CrossRef]
- Giles, Howard. 2015. Communication accommodation theory. The International Encyclopedia of Communication Theory and Philosophy 1: 1–7. [Google Scholar]
- Giles, Howard, Anthony Mulac, James J. Bradac, and Patricia Johnson. 1987. Speech accommodation theory: The first decade and beyond. Annals of the International Communication Association 10: 13–48. [Google Scholar] [CrossRef]
- Giles, Howard, and Jessica Gasiorek. 2013. Parameters of non-accommodation: Refining and elaborating communication accommodation theory. In Social Cognition and Communication. Hove: Psychology Press, pp. 155–72. [Google Scholar]
- Giles, Howard, Donald M. Taylor, and Richard Bourhis. 1973. Towards a theory of interpersonal accommodation through language: Some Canadian data. Language in Society 2: 177–92. [Google Scholar] [CrossRef]
- Giles, Howard, Nikolas Coupland, and Justine Coupland. 1991. 1. Accommodation theory: Communication, context, and contexts of accommodation. In Developments in Applied Sociolinguistics. Cambridge: Cambridge University Press, pp. 1–68. [Google Scholar]
- Hajek, Christopher, Howard Giles, Valerie Barker, Mei-Chen Lin, Yan Bing Zhang, and Mary Lee Hummert. 2008. Expressed trust and compliance in police-civilian encounters: The role of communication accommodation in Chinese and American settings. Chinese Journal of Communication 1: 168–80. [Google Scholar] [CrossRef]
- Hanley, Kathleen W. 1993. The underpricing of initial public offerings and the partial adjustment phenomenon. Journal of Financial Economics 34: 231–50. [Google Scholar] [CrossRef] [Green Version]
- Hanley, Kathleen W., and Gerard Hoberg. 2010. The information content of IPO prospectuses. The Review of Financial Studies 23: 2821–64. [Google Scholar] [CrossRef] [Green Version]
- Huffaker, David A., Roderick Swaab, and Daniel Diermeier. 2011. The language of coalition formation in online multiparty negotiations. Journal of Language and Social Psychology 30: 66–81. [Google Scholar] [CrossRef]
- Ibbotson, Roger G. 1975. Price performance of common stock new issues. Journal of Financial Economics 2: 235–72. [Google Scholar] [CrossRef]
- Ibbotson, Roger G., Jody L. Sindelar, and Jay R. Ritter. 1988. Initial public offerings. Journal of Applied Corporate Finance 1: 37–45. [Google Scholar] [CrossRef]
- Ibbotson, Roger G., Jody L. Sindelar, and Jay R. Ritter. 1994. The market’s problems with the pricing of initial public offerings. Journal of Applied Corporate Finance 7: 66–74. [Google Scholar] [CrossRef]
- Jenkins, Porter, and Stephen Owen. 2021a. Structured Embeddings of Financial Documents with Graph Attention Networks. Working Paper. Denton: University of North Texas. [Google Scholar]
- Jenkins, Porter, and Stephen Owen. 2021b. Conference Call Information: The Effects of Dodgy Managers on Security Performance. Working Paper. Denton: University of North Texas. [Google Scholar]
- Jones, Simon, Rachel Cotterill, Nigel Dewdney, Kate Muir, and Adam N. Joinson. 2014. Finding Zelig in text: A measure for normalising linguistic accommodation. Coling 25: 455–65. [Google Scholar]
- Kulesza, Wojciech, Dariusz Dolinski, Avia Huisman, and Robert Majewski. 2014. The echo effect: The power of verbal mimicry to influence prosocial behavior. Journal of Language and Social Psychology 33: 183–201. [Google Scholar] [CrossRef]
- Kwon, Oh-Woog, and Jong-Hyeok Lee. 2003. Text categorization based on k-nearest neighbor approach for web site classification. Information Processing & Management 39: 25–44. [Google Scholar]
- Langberg, Nisan, and K Sivaramakrishnan. 2010. Voluntary disclosures and analyst feedback. Journal of Accounting Research 48: 603–46. [Google Scholar] [CrossRef]
- Li, Mingsheng, Thomas H. McInish, and Udomsak Wongchoti. 2005. Asymmetric information in the IPO aftermarket. Financial Review 40: 131–53. [Google Scholar] [CrossRef]
- Linnemann, G. A., and R. Jucks. 2016. As in the question, so in the answer? Language style of human and machine speakers affects interlocutors’ convergence on wordings. Journal of Language and Social Psychology 35: 686–97. [Google Scholar] [CrossRef]
- Logue, Dennis E. 1973. On the pricing of unseasoned equity issues: 1965–1969. Journal of Financial and Quantitative Analysis 8: 91–103. [Google Scholar] [CrossRef]
- Loughran, Tim, and Bill McDonald. 2011. When is a liability not a liability? Textual analysis, dictionaries, and 10-Ks. The Journal of Finance 66: 35–65. [Google Scholar] [CrossRef]
- Loughran, Tim, and Bill McDonald. 2013. IPO first-day returns, offer price revisions, volatility, and form S-1 language. Journal of Financial Economics 109: 307–26. [Google Scholar] [CrossRef]
- Loughran, Tim, and Bill McDonald. 2014. Measuring readability in financial disclosures. Journal of Finance 69: 1643–71. [Google Scholar] [CrossRef]
- Loughran, Tim, and Jay R. Ritter. 1995. The new issues puzzle. Journal of Finance 50: 23–51. [Google Scholar] [CrossRef]
- Loughran, Tim, and Jay R. Ritter. 2002. Why don’t issuers get upset about leaving money on the table in IPOs? Review of Financial Studies 15: 413–44. [Google Scholar] [CrossRef]
- Ludwig, Stephan, Ko De Ruyter, Dominik Mahr, Martin Wetzels, Elisabeth Brüggen, and Tom De Ruyck. 2014. Take their word for it. MIS Quarterly 38: 1201–18. [Google Scholar] [CrossRef] [Green Version]
- Manning, Christopher, and Hinrich Schütze. 1999. Foundations of Statistical Natural Language Processing. Cambridge, MA: MIT press. [Google Scholar]
- Muir, Kate, Adam Joinson, Rachel Cotterill, and Nigel Dewdney. 2016. Characterizing the linguistic chameleon: Personal and social correlates of linguistic style accommodation. Human Communication Research 42: 462–84. [Google Scholar] [CrossRef]
- Muir, Kate, Adam Joinson, Rachel Cotterill, and Nigel Dewdney. 2017. Linguistic style accommodation shapes impression formation and rapport in computer-mediated communication. Journal of Language and Social Psychology 36: 525–48. [Google Scholar] [CrossRef]
- Ober, Scot, Jensen J. Zhao, Rod Davis, and Melody W. Alexander. 1999. Telling it like it is: The use of certainty in public business discourse. The Journal of Business Communication 36: 280–96. [Google Scholar] [CrossRef]
- Ritter, Jay R. 1991. The long-run performance of initial public offerings. Journal of Finance 46: 3–27. [Google Scholar] [CrossRef]
- Rock, Kevin. 1986. Why new issues are underpriced. Journal of Financial Economics 15: 187–212. [Google Scholar] [CrossRef]
- Sagi, Eyal, and Daniel Diermeier. 2017. Language use and coalition formation in multiparty negotiations. Cognitive Science 41: 259–71. [Google Scholar] [CrossRef] [PubMed] [Green Version]
- Simard, Lise M., Donald M. Taylor, and Howard Giles. 1976. Attribution processes and interpersonal accommodation in a bilingual setting. Language and Speech 19: 374–87. [Google Scholar] [CrossRef]
- Stoll, Hans R., and Anthony J. Curley. 1970. Small business and the new issues market for equities. Journal of Financial and Quantitative Analysis 5: 309–22. [Google Scholar] [CrossRef]
- Swaab, Roderick I., William W. Maddux, and Marwan Sinaceur. 2011. Early words that work: When and how virtual linguistic mimicry facilitates negotiation outcomes. Journal of Experimental Social Psychology 47: 616–21. [Google Scholar] [CrossRef] [Green Version]
- Taylor, Paul J., and Sally Thomas. 2008. Linguistic style matching and negotiation outcome. Negotiation and Conflict Management Research 1: 263–81. [Google Scholar] [CrossRef] [Green Version]
- Teoh, Siew Hong, Ivo Welch, and Tak J. Wong. 1998. Earnings management and the long-run market performance of initial public offerings. Journal of Finance 53: 1935–74. [Google Scholar] [CrossRef] [Green Version]
- Tetlock, Paul C. 2007. Giving content to investor sentiment: The role of media in the stock market. Journal of Finance 62: 1139–68. [Google Scholar] [CrossRef]
- Thakerar, Jitendra N., Howard Giles, and Jenny Cheshire. 1982. Psychological and linguistic parameters of speech accommodation theory. Advances in the Social Psychology of Language, 205–55. [Google Scholar]
- Triandis, Harry C. 1960. Cognitive similarity and communication in a dyad. Human Relations 13: 175–83. [Google Scholar] [CrossRef]
- Van Baaren, Rick B., Rob W. Holland, Bregje Steenaert, and Ad Van Knippenberg. 2003. Mimicry for money: Behavioral consequences of imitation. Journal of Experimental Social Psychology 39: 393–98. [Google Scholar] [CrossRef]
Publisher’s Note: MDPI stays neutral with regard to jurisdictional claims in published maps and institutional affiliations. |
© 2022 by the authors. Licensee MDPI, Basel, Switzerland. This article is an open access article distributed under the terms and conditions of the Creative Commons Attribution (CC BY) license (https://creativecommons.org/licenses/by/4.0/).