Abstract
Rapid launch is one of the key indicators of UAV swarm operations, and one of the key decisions that determines the ultimate success of launch system development is the choice of its product architecture. The high-definition design structure matrix (HDDSM) method is introduced to model the product architecture of a UAV launch system, which reduces the workload of creating binary DSMs and improves the repeatability of product architecture design matrix (PADSM) creation. On this basis, this paper presents the classification of row (column) elements based on PADSM to correct the clustering objective function, and introduces the network structure clustering algorithm (SCAN). Combined with matrix block processing, a better UAV launch system architecture modular configuration scheme is obtained.
1. Introduction
Due to the needs of modern warfare, UAV swarms have attracted the attention of the militaries around the world. In order to quickly make the swarm UAVs fall into formation in the air and ensure that a certain number of UAVs can be put into the combat environment in a timely and effective manner, it is necessary to develop a rapid launch system for UAVs as part of a clustered collaborative combat system.
So far, UAV launch systems that have been developed can be divided into six categories: (1) pneumatic, (2) hydraulic, (3) bungee cord, (4) kinetic energy, (5) electromagnetic, and (6) RATO and other methods [,,]. Based on launch performance, pneumatic systems are probably the best because they have huge launch power and can launch many types of UAVs designed for different missions (reconnaissance, aerial targeting) []. The general UAV launch system design only uses the Pugh matrix for the overall conceptual design to complete the selection decision of product components [,], but does not select and combine modules through product architecture clustering. The electromechanical workings of systems such as pneumatic launch systems, having complex structures and large numbers of components, require many data to check the interactions between elements, which causes great trouble in the development of product architecture.
To design a complex system, it is necessary to break it down into smaller modular components to facilitate design, integration, operation, and future upgrades. Typically, system decomposition analysis is performed during the initial system design phase using an abstract system architecture model []. One of the main purposes of developing a system architecture is to choose modules that are as independent as possible, i.e., modules with relatively few external interactions and relatively more internal interactions []. In complex systems, it is quite common to have both modular and integrated subsystems []. Capturing the mapping of functions to components and the interactions between them, and building a complete and well-structured design matrix DSM, are the basis for a comprehensive and robust product architecture.
Product architecture design structure matrix (PADSM) is a method for decomposing and modularizing the system architecture. Product architecture is simply defined as the mapping of a product’s functional requirements to its physical elements and the interactions between them []. The DSM is a network modeling tool used to represent the elements that make up a system and their interactions, thereby highlighting the architecture of the system (or structure of a design). The DSM is represented as a square matrix, mapping the interactions among the set of N system elements. Product architecture DSM is the mapping of the interaction network between product components, also known as system architecture DSM, product DSM, and component-based DSM []. The first application of DSM in product and system architecture was by Pimmler and Eppinger []. Baldwin and Clark [] used the DSM model to illustrate the nature of modularity in product architecture and discuss the advantages of modular architecture. Sharman and Yassine [] used DSM to identify several characteristic patterns in product architecture, including modules, chunks, various kinds of buses, pinning, and holding away. Engel and Browning [] proposed to use a clustering objective function to enable architectural options, i.e., modularize the components with the greatest variations in cost and functionality. The interactions between these elements can also take various forms; for example, according to the balance between functional and physical elements, the types of interaction between product elements can be appropriately described from the four aspects of space, energy, information, and matter []. The interactions between the components of a UAV launch system are complex and diverse, and a faster product architecture matrix model needs to be developed to map these complex relationships.
The high definition design structure matrix (HDDSM) is a product representation model that captures specific types of interactions between product components []. In a review of the literature of component DSM, no formal method for populating the PADSM matrix was found. This means that the person or team creating the PADSM only needs to fill in the cells of the DSM as needed. This can become overwhelming, making it difficult to view a PADSM with multiple cells at the same time. HDDSM completes product architecture by using a layered system approach [], allowing systems to be grouped and modeled individually. This process of creating models based on modular functions makes it easier to focus on specific areas of the product rather than trying to absorb and examine the entire system at once. Tilstra [] explored the HDDSM approach, which reduces the effort of creating binary DSMs, facilitates distributed modeling strategies, and aims to improve the reproducibility of component DSM creation. Kaur [] used the high definition design structure matrix (HDDSM) (the next level of DSM) to represent each type of interaction between components in a standalone DSM. The article by Thomas and Burris [] shows that HDDSM for complex engineered systems (CES) sheds light on how to translate comprehensive system models into genotypic equivalents. The HDDSM approach allows system engineers to build PADSM for UAV pneumatic launch systems in stages, from a subsystem-level architecture model with coarse-grained resolution to a component-level architecture model incorporating fine details. This greatly reduces the workload of traversing the entire PADSM manually to check interactions one by one, thereby saving development time for the system architecture. The system architecture design based on the HDDSM method is one of the key technologies in the complex system development process and is gaining traction in the systems engineering community.
The decomposition of the system architecture can vary widely due to the different interests of the stakeholders in the system. In this article, the product development team initially divided the UAV pneumatic launch system into functionally based subsystems. However, the assembly department always prefers component-based decomposition—that is, for them, the system should be divided into modules that are easy to test and assemble. Therefore, when deciding on the final system decomposition, the system architect needs to integrate the needs of different stakeholders and improve the initial UAV launch system architecture, especially the integrated bus [] clustering module spanning multiple subsystems, which enables system-level analysis to complete product modularity or system complexity management.
The development of modular products requires identifying highly interacting groups of elements and arranging (i.e., clustering) them into modules []. Tian-Li Yu et al. [] used the design structure matrix (DSM) to visualize the product architecture and developed a new clustering method based on the minimum description length (MDL) principle and a simple genetic algorithm GA. Clustering techniques have been widely used to solve various engineering problems, such as system architecture, modular product/system design, group techniques, and machine layout []. AlGeddawy [] proposed a hierarchical clustering method based on DSM to automatically build product hierarchy. Borjesson and Hölttä-Otto [] proposed a hybrid module generation algorithm called R-IGTA that balances module independence and product similarity, which is more balanced compared to traditional coupling-based clustering (such as DSM-based methods) and similar types of module-driven clustering (such as hierarchical clustering applied to DPM/MIM).
Product architecture DSM, as an efficient representation of product components and their interrelationships, documents the product decomposition and interaction network []. A network is a collection of vertices that are connected together by edges to represent relationships between objects. Network clustering (or graph partitioning) is a fundamental method for detecting hidden structures in networks and has many interesting applications, attracting increasing attention in computer science [,], physics [], and bioinformatics []. Among them, the structured network clustering algorithm SCAN is an excellent algorithm for clustering vertices based on the structural similarity measure. The SCAN clustering algorithm scans cluster vertices based on their common neighbors, assigning two vertices to a cluster based on how they share neighbors []. Chen, J.J. et al. [] applied the SCAN algorithm to a parallel environment and proposed a parallel network clustering algorithm based on structural similarity. Zhao, W. et al. [] proposed a PSCAN parallel structure clustering algorithm for detecting clusters or community structures in large networks based on the structure algorithm of SCAN. By transforming SCAN into a series of highly regular and independent concurrent operations, Stovall, T.R. et al. [] proposed a CUDA-based parallel implementation of SCAN–GPUSCAN. It can be seen from these studies that this algorithm is fast and efficient, and each vertex is visited only once, which is especially suitable for the graph representation model corresponding to PADSM studied in this paper.
However, most clustering techniques do not solve the problem of bus detection. Especially in electromechanical products, many interactions between components are mixed with bus classes (such as main body) or unidirectional (such as electrical control). In addition, the interface between modules needs to be considered; that is, the overlapping elements between clusters in PADSM are judged and divided. It is very difficult to choose a suitable objective function and a reasonable clustering scheme. Aiming at these problems, this paper proposes the processing methods of element classification and matrix block, corrects the clustering objective function, and completes the optimization of the modular design scheme of PADSM.
The main contributions of this paper are as follows:
- The modular modeling method of HDDSM was utilized, and the complete HDDSM architecture model of UAV launch system was captured and derived.
- In accordance with the classification of PADSM row and column elements, the detection method of bus class elements is proposed, and the clustering objective function was modified.
- The SCAN community discovery algorithm was simplified, the adjacency matrix was divided in PADSM, and the optimal clustering scheme of UAV launch system architecture is shown.
2. Modular Modeling Method Based on HDDSM Format
2.1. Hierarchical Decomposition of a UAV Launch System
In systems engineering, one often requires a multilevel system decomposition, i.e., DSM models at different granularity levels. For example, the engineering V-model advocates the use of hierarchical system decompositions []. The digital prototype model of the UAV pneumatic launch system studied in this paper is shown in Figure 1. The schematic diagram of the corresponding UAV pneumatic launch system is shown in Figure 2. According to the division of specific fields based on systems engineering [], the pneumatic launch system is divided into four subsystems: mechanical subsystem, pneumatic subsystem, reset subsystem, and electronic control subsystem. Combined with the allocation of the component serial numbers indicated in Figure 2, the initial hierarchical decomposition of the UAV pneumatic launch system can be obtained, as shown in Figure 3.
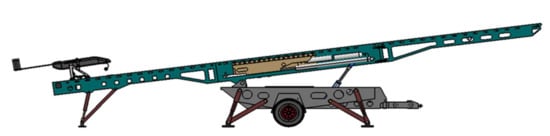
Figure 1.
Physical model of our UAV pneumatic launch system.
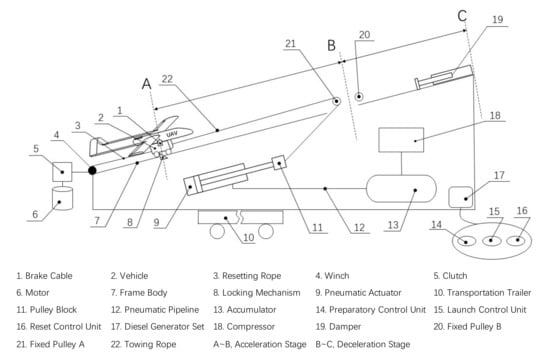
Figure 2.
Components of our UAV pneumatic launch system.
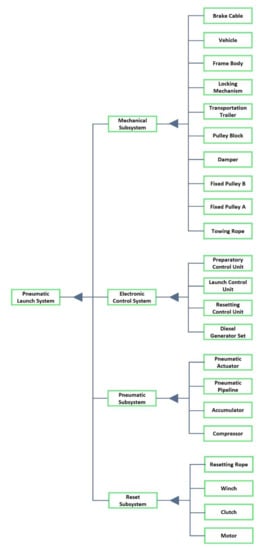
Figure 3.
Hierarchical decomposition of UAV pneumatic launch system.
2.2. Building a System-Level HDDSM
When creating HDDSM, the product should be thought of as a system that exists in the environment. Elements within a system interact with each other, and some elements may have interactions that span the boundaries of the system and interact with the environment outside the system []. Therefore, the HDDSM format of the launch system should include an “external” element to capture any interaction outside the system boundaries, including drones, transport vehicles, and external environmental elements, such as fuel and atmosphere. We add a column “E” to the outermost and the bottom of the PADSM to establish the UAV pneumatic launch system-level HDDSM, as shown in Figure 4.
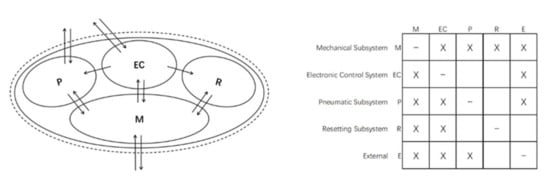
Figure 4.
The abstract model of the launch system interacting with the external and its HDDSM.
In order to explain the HDDSM modular modeling method, an abstract system model of the UAV pneumatic launch system shown in Figure 4 is established. The model includes four sets of subsystems that interact with each other, and some subsystems may interact with the environment outside the system. The model can also be represented by the corresponding HDDSM. The arrows in Figure 4 indicate the presence and direction of interactions between elements, and the arrow directions indicate input and output. Model boundaries are clearly defined by dashed lines. In Figure 4, external element E is used to represent the interactions between elements in the system and the external environment of the system boundary. Interactions between components are evaluated in binary, with interactions marked with an “X” in the matrix cells, where the column elements are the inputs to the interaction.
2.3. Building a Subsystem-Level HDDSM
During the development of HDDSM, it was recognized that a modular product representation model could improve the model development task. By decomposing the system logic into groups that can be modeled separately and then put together, the effort required to create a detailed model can be reduced []. The HDDSM model of the UAV pneumatic launch system has been established, and the HDDSM of each subsystem needs to be established next. In this part, we will model the reset subsystem including the components separately (Figure 5) to complete the modularization of the subsystem-level product architecture model.
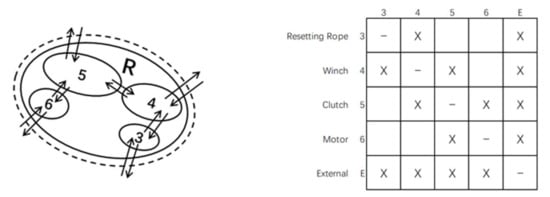
Figure 5.
The abstract model of reset subsystem interacting with the external and its HDDSM.
In Figure 5, a schematic diagram of interactions between components within the reset subsystem is shown together with their corresponding HDDSMs. The first model in Figure 4 uses four subsystem elements to represent the entire UAV launch system. The model in Figure 5 is an “enlarged” view of the reset subsystem in Figure 4, and uses four elements to represent its components, with the element numbers corresponding to the component numbers in Figure 2.
2.4. Merge Subsystem-Level HDDSM into System-Level HDDSM
Potential interactions between elements of the newly expanded model can be identified by combining information from every system model in Figure 4 and Figure 5. For easy understanding, Figure 6 divides the HDDSM models of the transmitting system and the reset subsystem into corresponding sub-matrices, and the dark areas correspond one-to-one. To create a new system model at a higher level of detail, the submatrix in Figure 7 was used to assemble the overall system model, and the HDDSM of the reset subsystem was incorporated into the model of the HDDSM of the launch system.
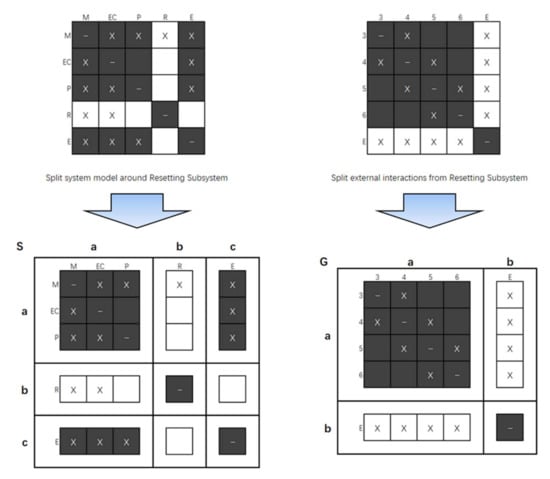
Figure 6.
Independent HDDSM models split into sub-matrices.
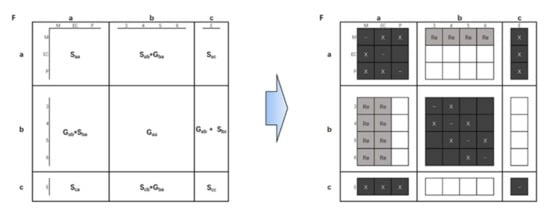
Figure 7.
Interactions between the component elements of the predicted reset subsystem and the rest of the subsystem elements.
The submatrix represents interactions between component elements 3, 4, 5, and 6 and subsystem elements M, EC, and P. Inputs from 3, 4, 5, and 6 act on M, EC, and P. All the “X” symbols in the matrix are represented as “1,” and the rest are treated as “0.” Formula (1) can be established; that is, the submatrix is obtained by multiplying and . indicates that input from subsystem element R acts on subsystem elements M, EC, and P. B indicates that the inputs of component elements 3, 4, 5, and 6 act on the external element E.
As shown in Figure 7, by multiplying the appropriate vectors, similarly to Equation (1), a new matrix is created that correctly identifies possible interactions between elements at different levels. The “Re” (review) in the matrix cell in Figure 7 represents the element to be examined to check if there is indeed an interaction there. For example, the electronic control subsystem EC has no interaction with the reset rope 3 and the winch 4. The remaining cells can be ignored, as there are no possible interactions there. Figure 8 shows the resulting expanded matrix model after review, with cells that need to be checked in grey areas.
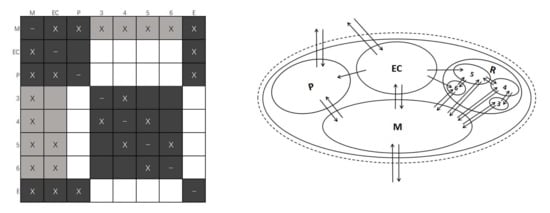
Figure 8.
Final system model after reviewing.
It is worth noting here that we restored the HDDSM model after the review of Figure 8 to an abstract model of graphical representation. At this time, we found that the actual interactions at the component level of the reset subsystem in Figure 8 are different from the representations in Figure 5. This is because the outer elements of a subsystem-level element are distinct from those of a component-level element, although both are denoted by a capital “E.” For the component elements of the reset subsystem, other subsystems may be external elements. Therefore, the actual interactions between the component elements of the final reset subsystem should be put back into the overall system.
3. Modular Evaluation Method Based on PADSM Format
3.1. Building PADSM
The HDDSM process allows system architects to divide a product into multiple subsystems or modules. This enables different groups of modules in the product to be modeled separately and then merged into the system HDDSM. This process facilitates the creation of PADSM models by breaking down the system into manageable parts rather than modeling all the parts at once [].
Combined with the component composition and hierarchical decomposition in 2.1, we repeated the process of separate modeling from 2.2 to 2.4 to model merging, and then removed the rows and columns of external elements. The complete PADSM model of the UAV pneumatic launch system at the component level of detail, as shown in Figure 9, was then obtained.
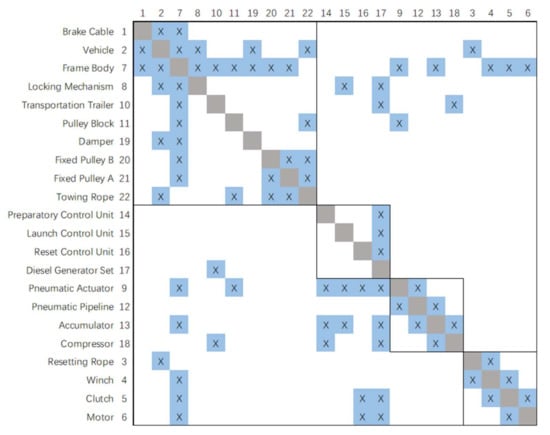
Figure 9.
PADSM model of the complete UAV pneumatic launch system.
The 22 row (column) elements in Figure 9 and their four modules correspond to the 22 components and four subsystems in Figure 3. The row (column) element numbers of the PADSM correspond to the component numbers in Figure 2. Here, in order to distinguish HDDSM and facilitate the cluster analysis of the system architecture later, the shading of the interactive mark “×” is blue and the shading of the diagonal cells is gray.
The module division of PADSM in Figure 9 is the initial clustering result completed based on the self-defined subsystems and included components. Clustering is also an assignment problem in nature, seeking the optimal assignment of N components to M clusters []. Improper decomposition and clustering of product architecture will result in too many connections between subsystems, making it difficult to complete the integration of each subsystem. Then, the objective function to evaluate the quality of clustering needs to consider not only the combination relationship between components, but also the interface relationship between modules under the premise of combined function decomposition. Based on the above factors, here we propose an improved row (column) element classification and a revised clustering objective function.
3.2. Row (Column) Elements Classification
In order to facilitate adopting different clustering division and evaluation methods for different types of row (column) elements, we classify the row (column) elements in the PADSM model. According to the different modules to which row (column) elements belong, they are divided into two categories: bus module elements and common module elements.
In the PADSM model, a bus-class element refers to an element that is associated with most other row (column) elements. This is similar to the definition of “bus” in interface technology in computers, where one element becomes the carrier of other elements []. All bus-class row (column) elements form a bus module.
Modules other than bus modules are called ordinary modules. The row (column) elements that make up an ordinary module are called ordinary module elements. According to the characteristics of the square matrix, common module elements can be divided into symmetrical and asymmetrical .
The row (column) elements that can overlap between adjacent common modules are called interface elements.
3.3. Detection of Bus Module Elements
Since the number of interactions of bus class elements is much higher than that of common elements, the detection of bus module elements is a process of finding outliers in interaction values.
Outlier detection and cluster analysis are two highly related tasks. Cluster analysis finds various patterns in a dataset, and outlier detection attempts to catch those anomalies that deviate significantly from the majority pattern. The quality of data preprocessing largely determines the quality of model analysis results.
In order to facilitate the observation and comparison of data points, this paper first presents the interactions of all row (column) elements of the UAV launch system in the form of a scatter plot, as shown in Figure 10. It should be emphasized that since the PADSM of the UAV launch system is an asymmetric matrix, the number of interactions takes the larger values of the row element and the column element—that is, .
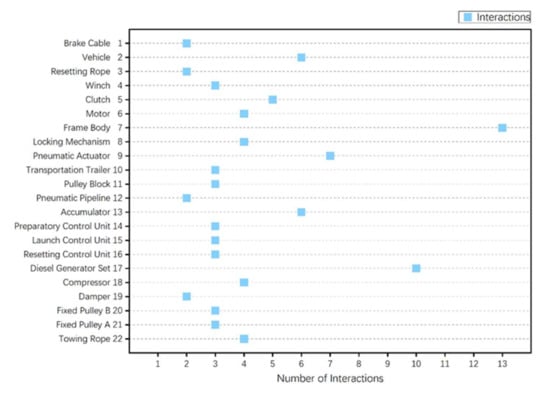
Figure 10.
Scatter plot of the number of interactions between the components of the UAV launch system.
The abnormal data detection method in this paper is a method of displaying and marking outliers through box plots [], which is mainly suitable for the case of univariate and large sample size. The main idea is as following:
; then, is a mild outlier;
; then, is an extreme outlier.
Combining the scatter plot Figure 10 and the box plot Figure 11, it can be seen that the mild outliers in the number of component element interactions of the UAV launch system are the diesel engine units and the extreme outliers are the launch racks. From this, the bus module elements of the UAV launch system PADSM are numbered 17 and 7.
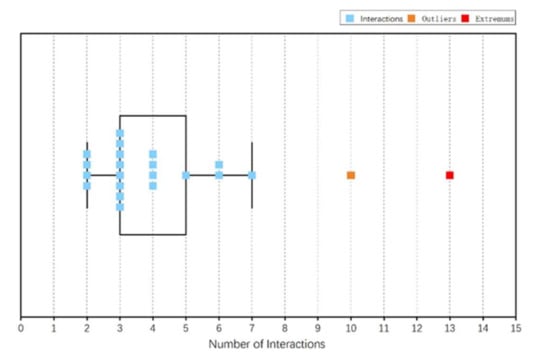
Figure 11.
Boxplot of the number of interactions between components of the UAV launch system.
3.4. Clustering Objective Function
The clustering objective function of DSM analysis trades off two conflicting objectives: (1) minimizing out-of-cluster interactions and (2) minimizing the sizes of the clusters []. Determining an appropriate objective function for PADSM clustering can lead architects to discover better product architectures.
Combined with the classification of row (column) elements, this paper revises the objective function based on the PADSM common module cluster analysis in the literature [], adds the influencing factors of the bus module part, and establishes Formula (2), which is used for the decision of the UAV launch system architecture.
Among them, M is the number of clusters, is the size of the cluster, is the number of interactions outside the cluster, and is the number of interactions between common module elements and the bus module; , , and are the corresponding weights. Due to the literature [], we made = 10 and = 100. Since the bus module element is expressed as a special interaction between the ordinary module and the ordinary module, and takes the half value of . In order to facilitate the calculation, in this paper = 1, = 10, and = 5.
4. Division and Analysis of Modules
4.1. Community Discovery Algorithm SCAN
A Structural Clustering Algorithm for Networks (SCAN) is a method for clustering graph nodes based on structural similarity measure []. This paper simplifies the algorithm of SCAN, which is used for the division of symmetric common modules in PADSM. In order to facilitate the description of the algorithm, relevant definitions are given here.
Vertex similarity: the ratio of the number of common neighbors of two vertices to the geometric mean of the number of neighbors of the two vertices (the neighbors here all include the vertex itself); see Formula (3).
where represents the set of vertexes and its adjacent vertices.
-neighbor: the -neighbor of a node is defined as the set of nodes whose similarity is not less than ; see Formula (4).
This paper simplifies the algorithm idea of SCAN: traverse all the vertices in Figure 12, and put all the -neighbors of the vertex v into the queue. For each vertex in the queue, compute all connected vertices that satisfy -neighboring, and insert those vertices that are still unclassified into the queue. Repeat this operation until the queue is empty, and the set of all dequeuing vertices in the queue is recorded as a cluster in Figure 12. After the traversal is completed, all the clusters in Figure 12 will be found and the clustering is complete.
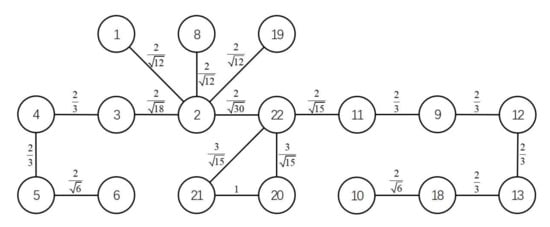
Figure 12.
Undirected graph with vertex similarity.
According to the classification and screening of module elements in Section 3, we classified and made a matrix of the PADSM model in Figure 9, and divided the bus module {17, 4} and asymmetric ordinary modules {14, 15, 16}, and then a 17 17 symmetric adjacent square matrix could be obtained. The adjacency matrix is a matrix that represents the adjacent relationship between vertices. The adjacency matrix of Figure 12 can be represented as an undirected, unweighted vertex association graph, as shown in Figure 12. Among them, the number in the vertex represents the number of the element, the edge represents the interaction between elements, and the value on the edge is the similarity between adjacent vertices.
Figure 9 can be divided into different clustering schemes by selecting the values of different intervals according to the numerical range of vertex similarity, and the results are shown in Table 1.

Table 1.
Evaluation of the division scheme of the SCAN clustering algorithm.
What needs to be explained here is: when , there is only one cluster, and clustering is meaningless; when , a single vertex must appear as a cluster, and a single-element module is meaningless in DSM.
4.2. Completing Division of PADSM
After representing the optimal division scheme obtained by the simplified SCAN clustering algorithm in a symmetric adjacency matrix, we still found that there will be six elements outside the module, which is caused by not considering the overlapping elements at the module interface. The elements located in the two modules are 3 and 2, 2 and 22, and 22 and 11, respectively. As can be seen in Figure 10, in terms of the number of interactions, element 2 > element 22 > element 11 > element 3. Components with fewer interactions have lower architectural complexity and are more suitable as interfaces. Therefore, we chose elements 3, 22, and 11 as overlapping elements at the three interfaces of the four modules. At this time, the objective function of the symmetric adjacency matrix is 96, which is much lower than the clustering division without considering overlapping elements.
We can then assign the three elements of the asymmetric common module {14, 15, 16} to the corresponding module with a higher degree of interaction, and aggregate the bus module {17, 4} back into the matrix to obtain the complete module division of the UAV launch system PADSM, as shown in Figure 13.
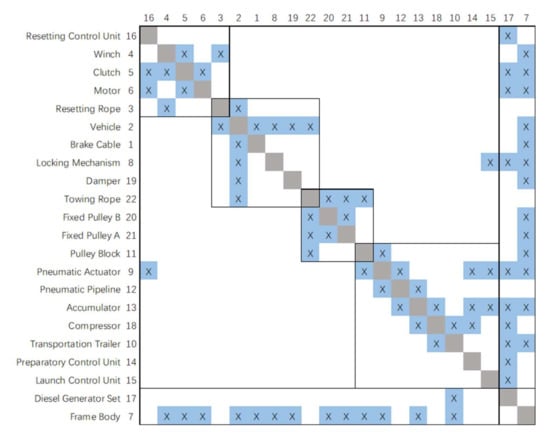
Figure 13.
The final clustering scheme of the PADSM model of the UAV launch system.
Combined with the objective function given in Section 3.3, the initial clustering scheme and the final clustering scheme were evaluated, and the results are shown in Table 2. It can be seen in Table 2 that the interactive objective function value of the final clustering scheme is 33.6% lower than that of the initial clustering scheme, which greatly optimizes the product architecture of the UAV launch system and is a more reasonable module division scheme.
Table 2.
Evaluation results of the objective function of the clustering scheme.
4.3. Analysis of Module Division
The initial clustering scheme splits the system from the perspective of a specific field (mechanics, electricity, gas, etc.), and the resulting unit is a “subsystem,” which is only a subjective preliminary division of components from traditional discipline classification and shows a lack of clear understanding of product architecture layout.
The final clustering scheme splits subsystems and re-clusters and merges components from the perspective of functional logic. Considering the influences of bus-like elements and asymmetric common elements, the resulting unit is a “module,” which is for separation of duties. Unit reuse, in particular, provides better insights into the interface relationship between modules.
As asymmetrical common module elements, the three control units are assigned to their corresponding main control module. This is because the electrically actuated components actually controlled by the control unit are all elements in other corresponding modules, and there is no interaction between the control units in parallel. This also reflects that the electromechanical module of the actual product needs to be taken into consideration. Of course, in actual operation, the buttons of the control unit are usually uniformly installed in the control box, as shown in Figure 2.
Combined with the engineering background of the UAV launch system in this paper, the reset ropes and traction ropes in the interface elements of the final clustering scheme are all available for purchase, and there is only a selection problem. Therefore, the launch frame as the bus element and the speed-increasing pulley device as the interface element are the design objects that need to be considered.
According to the diagonal order of the final clustering scheme, the UAV launch system can be divided into reset module, taxi module, traction module, pneumatic module, and bus module in turn, as shown in Figure 14.
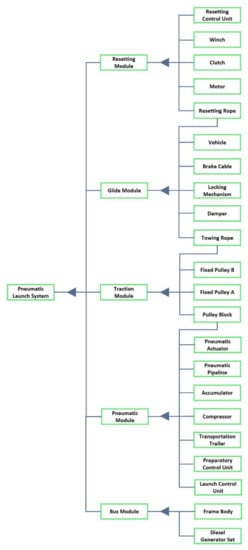
Figure 14.
Module division of the UAV pneumatic system.
Based on the theory of systems engineering, complex products should be decomposed into small-scale, easy to develop, and relatively independent subsystems (modules) for development, and then integrated to complete the overall function. The decomposition clustering process can reduce the complexity and speed up the development through a parallel process. However, the initial decomposition and clustering of the product architecture of UAV launch system are improper, and the division scheme is too simple. Hence, the links between subsystems are dense and scattered, which results in information blocking between developers. The final clustering scheme based on SCAN algorithm not only formulates a more reasonable module division, but also defines the interface elements between modules, which reduces the interaction cost between developers. Moreover, it can also reduce the number of iterations in the development process and shorten the product development cycle.
5. Conclusions
The development of UAV launch system architecture is a process of dividing the system into several modules from top to bottom. HDDSM is a product architecture model combined with a modular modeling method. In this paper, the initial allocation of components was carried out through system logic decomposition, and the HDDSM of UAV pneumatic launch system was created from the HDDSM assembly of subsystems and components. The modular distributed modeling method can distribute HDDSM tasks among multiple developers, reducing the workload of building fine-grained PADSM.
Most clustering methods are based on the assumption that each sample must only belong to one sample cluster, and so does each feature. This assumption is not conducive to correctly capturing the real structure of data. As in most real data sets, clusters may have overlaps, which means that data may belong to different clusters. According to the data characteristics of PADSM, we performed the element classification. Combined with matrix block, the SCAN clustering algorithm was introduced. As a result, the interactive objective function value in the module division of UAV launch system is reduced by 33.6%, which significantly optimizes the product architecture module clustering.
Product architecture is the core of product development, and module integration is the key to architecture development. The research in this paper shows that the model creation based on HDDSM and the module division based on an intelligent algorithm can greatly help the development teams better understand and innovate the product architecture.
Considering the diversity and complexity of interaction types between product component elements in practical engineering, future research can be carried out from the following aspects. Firstly, it is necessary to establish a non-Boolean UAV launch system, PADSM, from the aspects of space, energy, information, and matter according to the balance between functional and physical elements. Then the index should be quantified by combining weights, and a clustering algorithm should also be developed for numerical DSM, in order to obtain a more comprehensive and detailed product module division scheme. Furtherly, it is also of importance to provide a more perfect decision support for the architect.
Author Contributions
Conceptualization, X.F. and X.W.; methodology, L.G.; software, H.C.; validation, X.F.; formal analysis, L.G.; investigation, Z.Z.; resources, Z.Z.; data curation, L.G.; writing—original draft preparation, L.G.; writing—review and editing, H.C.; visualization, H.C.; supervision, X.W.; project administration, X.W. All authors have read and agreed to the published version of the manuscript.
Funding
The Fundamental Research Funds for the Central Universities(No. NT2021004), the National Defense Outstanding Youth ScienceFoundation (No. 2018-JCJQ-ZQ-053) and the Priority Academic Program Development of Jiangsu Higher Education Institutions.
Institutional Review Board Statement
Not applicable.
Informed Consent Statement
Not applicable.
Data Availability Statement
All data, models, and code generated or used during the study appear in the article.
Conflicts of Interest
The authors declare no conflict of interest.
Nomenclature
| Subsystem-level matrix | |
| Component-level matrix | |
| Submatrix | |
| First quartile | |
| Third quartile | |
| Interquartile Range | |
| Objective function | |
| Number of the cluster | |
| , , | Weight coefficient |
| Size of the cluster | |
| Number of interactions outside the cluster | |
| Number of interactions between common module elements and the bus module | |
| Vertex similarity | |
| , | Vertex |
| Set of vertex and its adjacent vertices | |
| Critical value | |
| set of nodes whose similarity is not less than |
List of Acronyms
| UAV | Unmanned Aerial Vehicle |
| HDDSM | High Definition Design Structure Matrix |
| PADSM | Product Architecture Design Structure Matrix |
| SCAN | Structure Clustering Algorithm |
| RATO | Rocket Assisted Take Off |
| DSM | Design Structure Matrix |
| CES | Complex Engineered System |
| MDL | Minimum Description Length |
| GA | Genetic Algorithm |
| R-IGTA | Reangularity- Idicula, Gutierrez, and Thebeau Algorithm |
| DPM | Design Property Matrix |
| MIM | Module Indication Matrix |
| PSCAN | Parallel Structural Clustering Algorithm |
| CUDA | Compute Unified Device Architecture |
| GPUSCAN | Graphical Processing Unit Structural Clustering Algorithm |
References
- Novaković, Z.; Medar, N. Lansirni Sistemi Bespilotnih Letelica, Podaci o Naoružanju, Podaci o Naoružanju-Faktografske Sveske; Vojnotehnički Institut: Beograd, Serbia, 2015; Volume XXXVIII. Available online: http://www.vti.mod.gov.rs/fs/156/156.htm (accessed on 23 January 2022).
- Francis, J. Launch System for Unmanned Aerial Vehicles for Use on RAN Patrol Boats, Final Thesis Report. 2010. Available online: https://ojs.unsw.adfa.edu.au/index.php/juer/article/download/368/205 (accessed on 23 January 2022).
- Novaković, Z.; Medar, N. Design of UAV Elastic Cord Launch. In Proceedings of the 6th International Scientific Conference on Defensive Technologies OTEH 2014, Belgrade, Serbia, 9–10 October 2014. [Google Scholar]
- Novaković, Z.; Vasić, Z.; Ilić, I.; Medar, N.; Stevanović, D. Integration of tactical-medium range UAV and launch launch system. Sci. Tech. Rev. 2016, 66, 22–28. [Google Scholar] [CrossRef]
- Huxley, S.D.C.; Lacasse, B.R.; Garcia, D.M.; Cearns, J.J. UAV Launch. 2019. Available online: https://digitalcommons.calpoly.edu/mesp/487/ (accessed on 23 January 2022).
- Miller, B.; Valoria, C.; Warnock, C.; Coutlee, J. Lightweight UAV Launcher. 2014. Available online: https://digitalcommons.calpoly.edu/cgi/viewcontent.cgi?article=1230&context=mesp (accessed on 23 January 2022).
- Sinha, K.; Han, S.Y.; Suh, E.S. Design structure matrix-based modularization approach for complex systems with multiple design constraints. Syst. Eng. 2020, 23, 211–220. [Google Scholar] [CrossRef]
- Rechtin, Eberhardt. Systems Architecting: Creating and Building Complex Systems; PTR Prentice-Hall: Englewood Cliffs, NJ, USA, 1991. [Google Scholar]
- Sosa, M.E.; Eppinger, S.D.; Rowles, C.M. Identifying modular and integrative systems and their impact on design team interactions. J. Mech. Des. 2003, 125, 240–252. [Google Scholar] [CrossRef] [Green Version]
- Eppinger, S.D.; Browning, T.R. Design Structure Matrix Methods and Applications; MIT Press: Cambridge, MA, USA, 2012. [Google Scholar] [CrossRef]
- Ulrich, K.T. The role of product architecture in the manufacturing firm. Res. Policy 1995, 24, 419–440. [Google Scholar] [CrossRef] [Green Version]
- Pimmler, T.U.; Eppinger, S.D. Integration analysis of product decompositions. In Proceedings of the International Design Engineering Technical Conferences and Computers and Information in Engineering Conference, Minneapolis, MN, USA, 11–14 September 1994; Volume 12822, pp. 343–351. [Google Scholar] [CrossRef]
- Baldwin, C.Y.; Clark, K.B. Design Rules: The Power of Modularity; MIT Press: Cambridge, MA, USA, 2000. [Google Scholar] [CrossRef]
- Sharman, D.M.; Yassine, A.A. Characterizing complex product architectures. Syst. Eng. 2004, 7, 35–60. [Google Scholar] [CrossRef]
- Engel, A.; Browning, T.R. Designing systems for adaptability by means of architecture options. Syst. Eng. 2008, 11, 125–146. [Google Scholar] [CrossRef]
- Tilstra, A.H. Representing Product Architecture and Analyzing Evolvable Design Characteristics. Ph.D. Thesis, The University of Texas at Austin, Austin, TX, USA, 2010. Available online: http://hdl.handle.net/2152/ETD-UT-2010-08-1546 (accessed on 23 January 2022).
- Tilstra, A.H.; Campbell, M.I.; Wood, K.L.; Seepersad, C.C. Comparing matrix-based and graph-based representations for product design. In Proceedings of the DSM 2010: Proceedings of the 12th International DSM Conference, Cambridge, UK, 22–23 July 2010. [Google Scholar]
- Tilstra, A.H.; Seepersad, C.C.; Wood, K. Distributed modeling of component DSM. In Proceedings of the 11th International Design Structure Matrix Conference, Greenville, SC, USA, 12–13 October 2009. [Google Scholar]
- Kaur, K. Bid Packaging Decisions in Construction Projects. Master’s Thesis, San Diego State University, San Diego, CA, USA, 2018. Available online: https://www.researchgate.net/profile/Kawalpreet-Kaur-2/publication/344306448_BID_PACKAGING_DECISIONS_IN_CONSTRUCTION_PROJECTS/links/5f65478da6fdcc00862d11b3/BID-PACKAGING-DECISIONS-IN-CONSTRUCTION-PROJECTS.pdf (accessed on 23 January 2022).
- Thomas, L.D.; Burris, K. Generational Evolution in Complex Engineered Systems. In Disciplinary Convergence in Systems Engineering Research; Springer: Cham, Switzerland, 2018; pp. 751–764. [Google Scholar] [CrossRef]
- Yu, T.L.; Yassine, A.A.; Goldberg, D.E. An information theoretic method for developing modular architectures using genetic algorithms. Res. Eng. Des. 2007, 18, 91–109. [Google Scholar] [CrossRef]
- Zakarian, A. A new nonbinary matrix clustering algorithm for development of system architectures. IEEE Trans. Syst. Man Cybern. Part C (Appl. Rev.) 2007, 38, 135–141. [Google Scholar] [CrossRef]
- AlGeddawy, T.; ElMaraghy, H. Optimum granularity level of modular product design architecture. CIRP Ann. 2013, 62, 151–154. [Google Scholar] [CrossRef]
- Borjesson, F.; Hölttä-Otto, K. A module generation algorithm for product architecture based on component interactions and strategic drivers. Res. Eng. Des. 2014, 25, 31–51. [Google Scholar] [CrossRef]
- Ding, C.H.; He, X.; Zha, H.; Gu, M.; Simon, H.D. A min-max cut algorithm for graph partitioning and data clustering. In Proceedings of the 2001 IEEE International Conference on Data Mining, San Jose, CA, USA, 29 November–2 December 2001. [Google Scholar] [CrossRef]
- Shi, J.; Malik, J. Normalized cuts and image segmentation. IEEE Trans. Pattern Anal. Mach. Intell. 2000, 22, 888–905. [Google Scholar] [CrossRef] [Green Version]
- Newman, M.E.; Girvan, M. Finding and evaluating community structure in networks. Phys. Rev. E 2004, 69, 026113. [Google Scholar] [CrossRef] [PubMed] [Green Version]
- Guimera, R.; Amaral, L.A.N. Functional cartography of complex metabolic networks. Nature 2005, 433, 895–900. [Google Scholar] [CrossRef] [PubMed] [Green Version]
- Xu, X.; Yuruk, N.; Feng, Z.; Schweiger, T.A. Scan: A structural clustering algorithm for networks. In Proceedings of the 13th ACM SIGKDD International Conference on Knowledge Discovery and Data, San Jose, CA, USA, 12–15 August 2007; pp. 824–833. [Google Scholar] [CrossRef]
- Chen, J.J.; Chen, J.M.; Liu, J.; Huang, V.L. PSCAN: A parallel structural clustering algorithm for networks. In Proceedings of the 2013 International Conference on Machine Learning and Cybernetics, Tianjin, China, 14–17 July 2013; Volume 2, pp. 839–844. [Google Scholar] [CrossRef]
- Zhao, W.; Martha, V.; Xu, X. PSCAN: A parallel Structural clustering algorithm for big networks in MapReduce. In Proceedings of the 2013 IEEE 27th International Conference on Advanced Information Networking and Applications (AINA), Barcelona, Spain, 25–28 March 2013; pp. 862–869. [Google Scholar] [CrossRef]
- Stovall, T.R.; Kockara, S.; Avci, R. GPUSCAN: GPU-based parallel structural clustering algorithm for networks. IEEE Trans. Parallel Distrib. Syst. 2014, 26, 3381–3393. [Google Scholar] [CrossRef]
- Wilschut, T.; Etman, L.F.P.; Rooda, J.E.; Adan, I.J.B.F. Multilevel flow-based Markov clustering for design structure matrices. J. Mech. Des. 2017, 139, 121402. [Google Scholar] [CrossRef]
- Graessler, I.; Hentze, J. The new V-Model of VDI 2206 and its validation. At-Automatisierungstechnik 2020, 68, 312–324. [Google Scholar] [CrossRef]
- Tilstra, A.H.; Seepersad, C.C.; Wood, K.L. The repeatability of high definition design structure matrix (HDDSM) models for representing product architecture. In Proceedings of the International Design Engineering Technical Conferences and Computers and Information in Engineering Conference, Montreal, QC, Canada, 15–18 August 2010; Volume 44137, pp. 529–542. [Google Scholar] [CrossRef]
- McGill, R.; Tukey, J.W.; Larsen, W.A. Variations of box plots. Am. Stat. 1978, 32, 12–16. [Google Scholar] [CrossRef]
Publisher’s Note: MDPI stays neutral with regard to jurisdictional claims in published maps and institutional affiliations. |
© 2022 by the authors. Licensee MDPI, Basel, Switzerland. This article is an open access article distributed under the terms and conditions of the Creative Commons Attribution (CC BY) license (https://creativecommons.org/licenses/by/4.0/).