Article

Initial Assessment of a Fuel Cell—Gas Turbine Hybrid Propulsion Concept

Bauhaus Luftfahrt e.V., Willy-Messerschmitt-Str. 1, 82024 Taufkirchen, Germany
*
Author to whom correspondence should be addressed.
Aerospace 2022, 9(2), 68; https://doi.org/10.3390/aerospace9020068
Submission received: 17 December 2021 / Revised: 14 January 2022 / Accepted: 20 January 2022 / Published: 26 January 2022

Abstract

:
A fuel cell—gas turbine hybrid propulsion concept is introduced and initially assessed. The concept uses the water mass flow produced by a hydrogen fuel cell in order to improve the efficiency and power output of the gas turbine engine through burner steam injection. Therefore, the fuel cell product water is conditioned through a process of condensation, pressurization and re-vaporization. The vaporization uses the waste heat of the gas turbine exhaust. The functional principles of the system concept are introduced and discussed, and appropriate methodology for an initial concept evaluation is formulated. Essential technology fields are surveyed in brief. The impact of burner steam injection on gas turbine efficiency and sizing is parametrically modelled. Simplified parametric models of the fuel cell system and key components of the water treatment process are presented. Fuel cell stack efficiency and specific power levels are methodically derived from latest experimental studies at the laboratory scale. The overall concept is assessed for a liquid hydrogen fueled short-/medium range aircraft application. Block fuel savings of up to 7.1% are found for an optimum design case based on solid oxide fuel cell technology. The optimum design features a gas turbine water-to-air ratio of 6.1% in cruise and 62% reduced high-level NOx emissions.

1. Introduction

Driven by the drastic need for decarbonization in aviation, hydrogen as a zero in-flight CO2 emissions fuel has recently experienced a great revival in aeronautical research and development. Beyond the well-known and demonstrated option of hydrogen combustion in classic gas turbine (GT) engines, significant technological progress in electrochemical conversion systems adds to the dynamic development of hydrogen-based visions for future air transport. However, the application of fuel cells (FCs) in the scheme of propulsion and power for transport category aircraft holds great challenges, and classic GT engines still feature significant advantages in power-specific weight over future FC systems. At the same time, further efficiency improvements and significant NOx emission reduction will be required for future aero engines. The injection of water in the compression section or the combustion chamber of a GT engine is well-known for its enhancement of cycle-specific work and efficiency, as well as its potential for significant cuts in NOx emissions.
In this paper, a synergistic concept for a FC–GT hybrid aircraft propulsion system is introduced and initially assessed. A basic functional schematic of concept is presented in Figure 1. The concept utilizes the product water of the FC in order to improve the performance and emission characteristics of the GT engine. The FC product water is first condensed and separated from the FC residual air mass flow, then pressurized and re-evaporated before being injected in the GT engine. This treatment process allows for minimum work effort for the water pressurization—due to the incompressibility of liquid water—while the energy required for its re-evaporation is drawn from the GT exhaust heat. The electric power produced by the FC is available as a convenient source for on-board electric customers, including aircraft subsystems and possibly decentralized or distributed propulsors. Operational flexibility may be enhanced through an intermediate storage possibility for the liquefied water, in order to decouple the GT steam injection from the FC power setting.
At first, important developments in the key field of the technology relevant for the studied FC–GT hybrid propulsion system type are reviewed in the paper. Subsequently, the methodological foundation for the conceptual assessment is formulated and discussed, before the results obtained from isolated power system and aircraft-integrated design studies are presented and examined.

2. Review of Key Technologies

The presented study is motivated by and based upon a number of key technological developments in different fields, including hydrogen as an alternative fuel option for aviation, significant advances in FC technology, high-performance heat exchangers (HEXs) and advanced GT technology involving steam injection in the thermodynamic cycle. In this section, relevant aspects of technological progress in those fields are surveyed in brief.

2.1. Hydrogen Fuel in Aviation

Combustion and electrochemical conversion of hydrogen do not create carbon emissions. In a recent well-to-wake analysis of CO2 equivalent emissions, green hydrogen by far outperformed conventional jet fuel as well as all other considered synthetic fuel options [1]. As a typical intermediate product along many production pathways for alternative hydrocarbon-based fuels, minimum fuel selling prices of liquid hydrogen (LH2) are likely to be more affordable than most synthetically produced sustainable drop-in fuels [2]. Due to a different stoichiometry of the chemical reaction, the use of hydrogen fuel yields a water production rate that is approximately 2.5 times as high as the one obtained from the combustions of kerosene fuel. The effect of the resulting water vapor emissions on climate change is not yet fully understood—the debate mainly centers around conditions for the formation and avoidance of persistent contrails [3].
For commercial air transport, hydrogen as a fuel poses significant challenges for vehicular design [4] as well as in terms of ground infrastructural prerequisites [5]. The amounts of energy required for typical commercial transport aircraft missions require hydrogen fuel to be stored in its most compact form, i.e., as LH2. The cryogenic temperature levels associated with LH2, combined with a persisting low volumetric energy density in comparison to hydrocarbon fuels, require unconventional and complex onboard storage solutions that involve considerable structural mass and aerodynamic drag penalties.
Nevertheless, hydrogen-based aircraft designs have been considered in both theoretical and experimental studies throughout the history of commercial aviation. Famous hydrogen-fuelled flight tests were performed in the 1950s on a modified Martin B-57 “Canberra” and later in the 1980s on the Tupolev Tu-155, a modified version of the commercial Tu-154. Extensive preliminary design studies were performed in the 1970s by Boeing [6] and Lockheed [7,8] under NASA contract as well as during the European Commission (EC) funded CryoPlane project led by Airbus in the early 2000s. Since then, the topic of hydrogen-fuelled aircraft has been continuously investigated as part of academic research, for example at Cranfield University, yielding a series of doctoral theses on hydrogen-fuelled aero-engine and aircraft systems (e.g., [9,10], as well as the ongoing EC-funded project ENABLEH2 [11]).
A multitude of advanced hydrogen-fuelled aircraft concepts have recently been published by research organisations (e.g., NASA’s N3-X [12], Bauhaus Luftfahrt’s Hyliner2.0 [13], FlyZero [14]) and announced as technology concept planes by the industry (e.g., Airbus ZeroE [15], Do228 FC demonstrator [16]). A broad overview on hydrogen technology, economics and climate impact by 2050 is provided by a study issued by the European “CleanSky” and “Fuel Cells and Hydrogen” Joint Undertakings in 2020 [17]. As a first key technology brick in the context of the present paper, a brief overview of advanced fuel cell concepts is provided in the next section.

2.2. Advanced Fuel Cell Concepts

An FC is an electrochemical energy conversion device, which enables the direct conversion of chemical energy stored in a fuel to electricity. The fuel, typically hydrogen, is oxidized at the anode, while ambient oxygen is reduced at the cathode. In the process, water—and in the case of fuels other than hydrogen—additional by-products are formed and released from the cell (cf. Equation (1)):
H 2 + 0.5   O 2 H 2 O .
The voltage that could theoretically be drawn from this reaction is 1.23 V at room temperature [18], however, various voltage losses occur in the cell, e.g., due to hindered mass transport, electrical resistance, fuel crossover or sluggish kinetics. Consequently, the practically achievable voltages UCell are significantly lower, the electrical efficiency ηStack of the cell stack in reference to the heating value per mol of fuel FHVmol (cf. Equation (2)) is diminished and the surplus energy is released as heat:
η S t a c k = 2 · F · U C e l l F H V m o l   ,
where F is the Faraday constant.
In an effort to find FCs applicable to versatile operating environments and application demands, various cell types have been developed. Out of these, the polymer electrolyte FC (PEFC), which is schematically depicted in Figure 2a, is the current state-of-the-art FC for transportation applications due to its comparably high specific power and quick load response. Therefore, most hydrogen-electric aircraft designs based on FC-electric propulsion rely on the PEFC (e.g., research projects Go4Hy2, BALIS, BILBO). This is comprised of a proton-conducting membrane, most commonly a perfluorosulfonic acid (PFSA) polymer that transports the protons formed on the anode over to the cathode while avoiding gas crossover and preventing short-circuiting due to its electrically insulating properties. As these functionalities are only maintained when the membrane’s water content is high enough, inlet gases are typically humidified. Generally, water management is crucial for successful PEFC operation in order to balance sufficient humidification on the one hand and the avoidance of excess amounts of (product) water causing pore flooding and mass transport losses on the other. Gas-diffusion layers (GDLs) are employed to aid water removal and gas transport to the catalytically active sites in the catalyst layer (CL). Catalysts are required to enhance the reaction kinetics of the hydrogen oxidation reaction and the oxygen reduction reaction (HOR and ORR); state-of-the-art high-performance materials are based on the noble metal Pt. It should be briefly noted that the schematics in Figure 2 only depict the core components of FCs. One individual cell would deliver a relatively small voltage as discussed above, which is why typically numerous cells are connected in series through bipolar plates, or so-called interconnects for higher temperature applications, to obtain an FC stack with technically usable output voltage. The stack itself is accompanied by balance-of-plant components such as compressors, humidifiers, thermal management, etc. The entire assembly will, in the following, be termed “FC system”.
The standard operating temperature of the PEFC is between 60 and 90 °C, which is a range in which reaction kinetics employing the above-mentioned catalysts are high enough to yield technically feasible current densities and the membrane is stable and (when humidified) well-conductive, while material degradation is limited. While PEFC systems are continuously further developed to match performance, cost and weight targets for various propulsion applications, they have already reached a high technological maturity and are utilized in commercial applications at the 100 kW scale [19].
Another FC type that has been developed to a high technological readiness level (TRL) is the solid oxide FC (SOFC) [20]. In contrast to the PEFC, the SOFC employs a solid ceramic electrolyte, typically yttria-stabilized zirconia (YSZ), which conducts O2−-ions (cf. OCC, oxygen-conducting ceramic in Figure 2d). In these cells, particularly high electrical efficiency can be achieved as gas crossover is mostly avoided. Furthermore, for sufficient electrolyte conductivity, high operating temperatures (>650 °C and up to 1200 °C) are needed, which enhance the reaction kinetics, minimize activation losses and further improve electrical efficiency, even when fully non-noble metal catalysts are employed. Drawbacks for transportation applications of the SOFC are the brittleness of the ceramic materials used, challenges related to the operating temperature (e.g., unsuitability of metallic interconnects, difficulty to find adequate sealing materials), limited specific power and a slow start up time. Recent lab-scale developments, however, show significant progress of both planar and microtubular designs, reaching stack power densities of up to 17 kW/L and start-up times well below 10 min [20,21,22,23,24].
To overcome the temperature-related struggles described for the low- and high-temperature FCs introduced above, i.e., the need for noble-metal catalysts, humidification issues and difficulty in thermal management of the PEFC on the one hand, and material-related challenges in sealing and interconnecting as well as thermal degradation for the SOFC on the other hand, intermediate temperature approaches are of interest. These can be realized by a change of electrolyte and a concomitant adaption of the catalysts in either the ceramic or the polymeric FC type.
For the former, instead of an OCC, proton-conducting ceramics (PCC) have also been developed. These materials’ ion conductivity reaches technically usable values at a significantly lower temperature, starting at around 300 °C [25]. With that, so-called proton-ceramic FCs (PCFCs, cf. Figure 2c) provide a much wider choice of materials for sealing, interconnecting and balance-of-plant components that can sustain the respectable temperature range than SOFCs do [26,27].
When it comes to polymeric electrolytes, a variety of membranes have been proposed, which are mostly phosphoric acid-doped such as PA-PBI (phosphoric acid-doped benzimidazoles) [28]. These cover operating temperatures ranging from 140 to 200 °C (cf. HT-PEFC, Figure 2b) and are proton-conductive without external humidification. Therefore, they alleviate the stringent requirements on the operating conditions that the PFSA membranes pose [29].
It should be noted that the latter two FC types are not at a development stage comparable to the PEFC or the SOFC. Scalability, especially close to the MW-scale as required for aviation, has not yet been shown, neither have standardized accelerated stress tests been systematically performed to assess the durability. Moreover, the bulk of related publications uses the power per electrode area as a means of comparison, whereas stack and system specific power are not specified for the often only lab-scale sized devices. Nevertheless, for the present work, all four cell types have been taken under consideration, aiming at exploring the application potential of each for the proposed hybrid concept for propulsion application in aviation. Forming the complement of the investigated hybrid propulsion concept, the effects of water/steam injection in GT engines are reviewed in brief below.

2.3. Water/Steam Injection in Gas Turbine Engines

The idea of improving the performance of GT engines through water or steam injection has been known at least since the publication of a British patent from 1944 [30]. The performance impact of water injection on the compressors of turbojet engines was analysed by Wilcox and Trout in 1950 [31]. The primary effects obtainable by GT water/steam injection—depending on the injection location and the condition of the injected water—include an increased cycle specific work and enhanced thermodynamic efficiency, as well as the reduction of NOx emissions during the combustion process. Typical locations for water/steam injection in a GT engine include the air inlet as well as the compression combustion and turbine sections. Inlet and compressor water injection was applied to a number of the first generation, low-bypass ratio turbofan engines in the 1950s in order to enhance engine thrust for an improved take-off performance (e.g., J57 engine on the B-52 and KC-135 aircraft, JT3C engine on Boeing 707, JT9D engine on Boeing 747-100/200 and RR Spey engine on BAC 1–11 aircraft).
The injection of steam into the GT cycle is commonly used in stationary power plant technology (cf. [32,33,34]) in order to enhance both power output and thermodynamic efficiency. So-called “Steam-Injected Gas turbine” (STIG) power plants, with the steam typically produced using the GT exhaust heat, have been offered as commercial product solutions (cf. [33]) since 1987 [35].
Cheng demonstrated efficiency increases of up to 40% over a comparable simple GT cycle with a simultaneously enhanced power output by 70% for a steam injection rate of approximately 20% [32]. Noticeable efficiency gains may already be expected at much lower steam injection rates [36,37]. A consolidated overview of proposed and implemented GT cycles featuring water/steam injection is provided by Jonsson and Yan [38]. Daggett et al. have shown the significant cuts in NOx emissions from kerosene combustion due to water injection in the compression section of turbofan engines [39,40]. The emission effects due to the ultra-wet combustion of natural gas and hydrogen have been numerically and experimentally studied by Göke et al., showing significant NOx reductions for both types of fuel [41,42]. The most recent concept of a “Water-Enhanced Turbofan” (WET) engine, featuring in-flight water-recovery from the GT exhaust flow [43], has been initially assessed by Pouzolz et al. [44] and is currently under technology demonstration [45].

2.4. Advanced Heat Exchangers for Aeronautical Application

High-performance Heat Exchangers (HEXs) play a key role in the investigated propulsion system concept. This includes the HEX applications as part of the water treatment process as well as the HEXs required for the FC thermal management. HEXs are well-known from stationary applications as bulky and heavy components, especially when large amounts of heat need to be transferred. Therefore, HEX applications onboard transport category aircraft today refer exclusively to heat exchange tasks associated with engine auxiliaries and aircraft subsystems, such as air or fuel cooled oil coolers, or as part of the aircraft environmental control system, for instance.
The main heat management of classic GT based propulsion systems is intrinsically alleviated by the fact that most of the waste heat produced by the thermodynamic cycle is rejected at a relatively high temperature level via the core nozzle exit mass flow. This highly efficient heat rejection mechanism, at the same time, represents a significant source of losses in the power plant system. Therefore, significant research and development efforts have been invested over the last three decades in order to tackle the thermal losses in the GT exhaust flow. Common technical concepts include bottoming cycles that take the GT exhaust heat as a source of power, the utilization of the exhaust heat for the generation of steam and GT internal exhaust heat recuperation. For the latter concept, ultra-compact, high temperature resistant air-air HEX components have been developed and demonstrated for aero-engine integration [46,47]. Further advanced HEX configurations have been conceptually elaborated for an improved integration in the nozzle section of aircraft engines [48,49] as well as for secondary fluid recuperation based on multi-fluid HEXs [50]. In parallel, light-weight compact HEX designs for an application as compressor intercoolers have been developed [51,52] in order to increase the achievable fuel optimum cycle pressure ratios. Even more specialized high-performance microchannel HEXs originally developed for intercooling tasks in high-speed propulsion application are available [53].
Further momentum in the development of more advanced HEX technology certainly results from the thermal management demands posed by electrical components used in hybrid electric propulsion and power systems (cf. e.g., [54,55]). The need for rejecting significant amounts of waste heat at low temperature levels is also particularly relevant in the context of low-temperature FC application (cf. Section 2.2 above). Moreover, thermal management systems including various kinds of HEX will be crucial for the use of LH2 systems for aircraft propulsion, as is reflected in ongoing research [56,57].
Existing empirical data for compact HEX designs are documented in [58,59], allowing the derivation of customized empirical correlations for HEX key performance for propulsion system conceptual design purposes.

2.5. Fuel Cell—Gas Turbine Hybrid Systems

In the quest for high system efficiencies, a number of studies have investigated the possibility of combining FCs with heat engines, typically GTs. While mostly developed for power generation applications in stationery use, these systems have also been proposed as (auxiliary) power units in aircraft and unmanned aerial vehicles [60,61,62].
Due to their similar operating temperature range, GTs are typically coupled with SOFCs, whereby two general concepts are distinguished: FC topping cycles versus FC bottoming cycles, i.e., energy conversion in the FC occurs upstream or downstream of the turbine [63]. A comprehensive review of past publications related to FC–GT hybrids is beyond the scope of this work and can be found elsewhere (cf. e.g., [60,64,65]). Nevertheless, some noteworthy examples in the context of the present work shall be briefly described in the following.
As mentioned above, one key aspect of the present concept is the use of the FC’s product water to enhance the performance of the turbine and benefit from the concomitantly reduced emissions. Utilizing the product water for various purposes in the aircraft, e.g., cabin humidity, grey water or even drinking water, has been proposed in several patents owned by aerospace companies, including Boeing, Airbus and Liebherr Aerospace [66,67,68,69]. A direct interaction between an FC and a turbofan engine in order to enhance the engine’s efficiency was, to the best of our knowledge, first described in 2016 by General Electric [70]. Amongst other approaches to efficiency enhancement, the author here puts forward the utilization of the FC product water for cooling of the turbofan engine as well as its direct injection into the core air flow path to alter temperature and/or compressibility properties. A suitable conditioning path for the FC product water that is required in order to minimize energy penalties for the water pressurization to relevant GT cycle pressure levels, and to exploit system synergies such as the GT waste heat utilization for the water vaporization, was very recently proposed as part of a patent application by Bauhaus Luftfahrt (BHL) [71].
FC technology as an option for the primary power supply on transport category aircraft, i.e., for the purpose of propulsion, has just very recently picked up momentum, together with the debate on hydrogen as an alternative fuel in aviation (cf. e.g., [72]). A hybrid system employing an SOFC, GTs and lithium ion batteries in order to boost take-off power was conceptually designed and assessed to be initially viable in larger aircraft applications by Collins et al. [73].
Lastly, it has been established that a high-pressure operation (up to 50 bar) could theoretically enhance the overall system efficiencies of FC–GT hybrids [74]. This is based on the fact that, theoretically, FC performance should increase with higher pressure due to an increased Nernst voltage and lower voltage losses [74,75,76,77]. Furthermore, the need for auxiliary components of FC–GT hybrid systems could simultaneously be lowered. These pressure levels have, however, not yet been practically realized as state-of-the-art FC technology cannot sustain the mechanical forces induced by these operating conditions. Even to realize operation at intermediate pressures (up to 15 bar [75,77]) the FCs are placed into pressure vessels designed to minimize fluctuations of pressure and consequently the mechanical strain on the FCs components.

3. Concept Evaluation Methodology

In this section, the methodological foundation of the aspired initial concept assessment is formulated and discussed. This includes the definition of system efficiencies and control volumes as well as the specification of key figures of merit for concept performance assessment at power system and aircraft level. Beyond this, the modelling of the power system’s key components is presented, the derivation of lab-scale FC technology properties is discussed and a simplified aircraft scaling approach for the integrated concept assessment at the vehicular level is introduced.

3.1. System Definition and Efficiency Formulation

Following the definition of the Thrust Specific Fuel Consumption (TSFC) as fuel flow per unit net thrust produced, the overall efficiency ηov of aero propulsion systems is given by the ratio of fuel supply power Psupply, i.e., the product of fuel mass flow m ˙ f and its heating value FHV, and the effective propulsive power Pthrust (cf. e.g., [78]):
η o v = P t h r u s t P s u p p l y = V 0 · F N m ˙ f · F H V   ,
where V0 represents the flight velocity and FN denotes the streamtube net thrust.
For the purpose of the present conceptual investigation, the classic breakdown of ηov into the product of the core efficiency ηco, the transmission efficiency ηtr and the propulsive efficiency ηpr, is conveniently reorganized to yield ηov as the product of the effective core engine efficiency ηco,eff and the effective propulsive device efficiency ηpd,eff (cf. [79]):
η o v = η c o · η t r · η p r = η c o , e f f · η p d , e f f   ,
where ηpd,eff relates the propulsive power demand in terms of FN and V0 to the effective core engine exit power Pco,eff, and ηco,eff forms the ratio of Pco,eff and Psupply [79]:
η p d , e f f = V 0 · F N P c o , e f f , η c o , e f f = P c o , e f f m ˙ f · F H V   .
In GT power plants, Pco,eff is composed by the free shaft power extracted from the LPT in order to drive the propulsor Pco,sht and the residual excess power in the core flow at the LPT exit (Station 5) Pco,res (cf. [79]):
P c o , e f f = P c o , s h t + P c o , r e s   .
For turbofan engines Pco,sht and Pco,res are thermodynamically expressed as (cf. [79]):
P c o , s h t , G T = m ˙ c o · Δ h L P T , f r e e = P F a n , o η m e c h , L P = m ˙ b p · Δ h F a n , o η m e c h , L P   ,
P c o , r e s , G T = m ˙ c o · Δ h i s , 5 a m b V 0 2 2   ,
where Δ h L P T , f r e e denotes the effective specific free work of the LPT and Δ h F a n , o is the effective specific work of the outer fan. The term Δ h i s , 5 a m b represents the ideal residual work remaining after the turbine expansion process. The core and bypass mass flows are indicated by m ˙ c o and m ˙ b p , respectively, while η m e c h , L P denotes the low pressure spool mechanical efficiency. The efficiency-optimal ratio between P c o , s h t , G T and P c o , r e s , G T can be determined based on ideality conditions for turbofan engines [80] as well as for turboprop engines [81].
In the case of a combined power system, such as the considered FC–GT hybrid, Pco,eff equals the sum of the effective core engine exit powers for the installed GT engines, Pco,eff,GT, and the correspondingly equivalent effective power output of the FC power train, Pco,eff,FC:
P c o , e f f = P c o , e f f , G T + P c o , e f f , F C   .
The primary power output of the FC power train is the shaft power delivered by the electric motor, Psht,eMot, which is driven by the FC system (FCS) electric power output. It is correlated to the fuel power supplied to the FC, namely m ˙ f · F H V F C , via the chain of electric component efficiencies:
P s h t , e M o t = m ˙ f · F H V F C · η F C S · η P M A D · η e M o t ,
where ηFCS represents the FC system electric efficiency, ηPMAD refers to the efficiency of the Power Management And Distribution (PMAD) system and ηeMot denotes the efficiency of the controlled electric motor.
Beside its (primary) electric power output, an FC delivers thermo-kinetic power via the stack outflow. The usefulness of this thermo-kinetic power strongly depends on the FC type and operating conditions, namely temperature and pressure. In case of high temperature and/or high pressure FCs, the stack outflow is typically expanded through a turbine in order to provide power for system internal customers such as the inlet air compressor. The residual thermo-kinetic power at the exit of the FC system, Pco,res,FC, eventually adds to the effective electric shaft power delivery:
P c o , e f f , F C = P s h t , e M o t + P c o , r e s , F C .
As part of the present power system concept, the FC exit mass flow is routed through a condenser HEX in order to extract liquid water from it. While the extracted liquid water is pressurized and piped to the GT, the residual of the FC exit mass flow m ˙ F C , r e s , d r y and its remaining ideal work potential at the condenser exit Δ h i s | C o n d , e x , d r y a m b define P c o , r e s , F C analogously to Equation (8):
P c o , r e s , F C = m ˙ F C , r e s , d r y · Δ h i s | C o n d , e x , d r y a m b V 0 2 2   .
Applying the definition of ηco,eff (cf. Equation (5))to the FC power train yields:
η c o , e f f , F C = P c o , e f f , F C P s u p p l y , F C = P s h t , e M o t + P c o , r e s , F C m ˙ f · F H V F C
and for the GT, respectively:
η c o , e f f , G T = P c o , s h t , G T + P c o , r e s , G T m ˙ f · F H V G T   .
With this, the effective core efficiency for a FC–GT hybrid power system can be formulated as a power weighted superimposition of the GT and FC power train:
η c o , e f f = P c o , e f f P s u p p l y = P c o , e f f , G T + P c o , e f f , F C m ˙ f · F H V G T + m ˙ f · F H V F C   .
While for GT engines, the lower heating value of the supplied fuel is used, it should be noted that in the case of low temperature FCs, the water contained in the product mass flow at the fuel exit might be condensed, i.e., in a liquid state, therefore requiring the application of the higher heating value of the fuel.
As can be seen from the equations above, the specific control volume definition of the effective core efficiency ηco,eff ensures a direct consistency of the main power outputs of both parts of the FC–GT hybrid power system, namely the free shaft power available from the GT LPT(s), Pco,sht,GT, and the shaft power delivered by the FC electric power train(s) P s h t , e M o t , while also catering for the residual powers that are available for the conversion to propulsive thrust.
A key design and performance descriptor for FC–GT hybrid power systems is the power split parameter PS, which can be defined as follows:
P S = P s h t , e m o t P c o , e f f = P c o , e f f , F C P c o , e f f , G T + P c o , e f f , F C   .
As can be seen from Equation (16), the PS parameter expresses the share of the FC power train output relative to the total power system output, based on the ηco,eff control volume.
For the fuel burn assessment, the Breguet-Coffin equation in integral form is solved for consumed fuel mass mf as a function of aircraft instantaneous gross weight mA/C,end at the end of a considered range segment ΔR:
m f = m A / C , e n d · e Δ R · g F H V · L / D · η o v 1   ,
where L/D refers to the aircraft’s aerodynamic efficiency, namely the ratio of lift-to-drag, and g represents the gravity constant. FHV is the effective fuel heating value of the hybrid power system, averaged according to the supply power split between the GT and FC power train parts. For all three parameters, FHV, L/D and ηov, representative value for the considered flight segment should be used when evaluating Equation (17).

3.2. Mapping of Key Power System Component Properties

In order to facilitate an initial performance and emissions assessment of the investigated power system concept, the efficiency and mass properties of all key components are estimated using suitably simplified methods. All thermodynamic data for mass flows of semi-ideal gases are based on NASA’s Chemical Equilibrium with Applications (CEA) database [82], while all thermodynamic data for air-water mixtures are read from a real gas database based on the IAPWS IF-97 standard [83]. The used hydrogen-specific thermodynamic data also refer to [82]. Important assumptions and model paradigms for the individual power system components are documented in the following.

3.2.1. Fuel Cell

The FC as a system includes the cell stack as well as a variety of auxiliary systems, including balance of plant and thermal management systems in often complex arrangements. The objective of the FC modelling in this paper is an appropriately simplified representation of aspects relevant for the hybrid power system concept. This includes the water production rate obtainable from the FC, but also the mapping of the FC system efficiency ηFCS (cf. Equation (10)). Moreover, for the estimation of the overall system mass, the thermal household requires suitable consideration.
The FC system efficiency ηFCS describes the ratio of net electric power delivered by the FC system PFCS,el to the system power supply via fuel flow, i.e., the product of fuel mass flow required for the cell redox reaction and its heating value m ˙ · F H V H 2 :
η F C S = P F C S , e l m ˙ · F H V H 2 = P S t a c k , e l P A u x , e l m ˙ · F H V H 2   ,
where PFCS,el equals the stack electric power output PStack,el, reduced by all electric power demands PAux of the FC auxiliary systems including balance of plant and thermal management. It should be noted that, given the considered FC operating conditions in the present study, the lower heating value LHV is used for all FC efficiency evaluations.
Now, with η S t a c k (cf. Equation (2)) rewritten as:
η S t a c k = P S t a c k , e l m ˙ · F H V H 2   .
ηFCS can be expressed in a factorized form:
η F C S = η S t a c k · f η , B o P , T M S   ,
with an efficiency factor f η , B o P , T M S capturing all auxiliary electric power demands within the FC system being defined as:
f η , B o P , T M S = 1 P A u x , e l P S t a c k , e l   .
Typical customers of PAux,el amongst the FC auxiliary systems mainly focus on the reactant supply units, i.e., pumps and compressors, and electric controllers. It should be noted that the residual effective excess power of the FC power train P c o , r e s , F C (cf. Equation (12)) is conservatively neglected when evaluating η c o , e f f , F C acc. to Equation (13).
While for the present study, fuel supply pressure is assumed to be provided through an active regulation of the LH2 fuel tank delivery pressure, the FC inlet air supply requires active pressurization. This is realized by a turbo compressor. For low temperature FCs without sufficient thermo-kinetic power at the exit of a FC stack, the inlet air compressor requires an electric drive. The correspondingly required power for the compression of inlet air mass flow m ˙ a i r to the stack operating pressure is calculated as follows:
P c o m p , a i r = m ˙ a i r · c ¯ p · T i n η C o m p , a i r · p o u t p i n γ 1 γ 1   ,
where c ¯ p and γ are the representative isobaric specific heat and isentropic exponents for the air compression process. The compressor inlet total pressure p i n results from the freestream total pressure with an inlet pressure ratio of 99% assumed for the study. The compressor outlet total pressure p o u t corresponds to the FC operating pressure. The efficiency η C o m p , a i r includes the isentropic efficiency of the turbo compressor, the mechanical efficiency of its shaft and bearing system and its electric drive unit. It should be noted that in the case of high temperature and/or high pressure FCs, the stack outflow is typically expanded through a turbine in order to drive the inlet air compressor, thereby reducing P c o m p , a i r to zero.
In order to obtain the value of PAux,el, and thus f η , B o P , T M S , the power requirements of all customers need to be added together. Beside P c o m p , a i r , this also includes the power required in order to drive the liquid water pump within the product water treatment process (see Section 3.2.2). The electric power demand for the FC electric controller and auxiliary pumps and blowers within the balance of plant is assumed to be 3% of PStack, el.
The water mass flow m ˙ S t a c k , H 2 O produced by an FC can be expressed as a function of PStack,el, ηStack, the heating value per mol of fuel FHVmol and the product water’s molar Mass M H 2 O :
m ˙ S t a c k , H 2 O = P S t a c k , e l · M H 2 O η S t a c k · F H V m o l   .
A parametric study of Equation (23) for a hydrogen FC is presented in Figure 3 below. As can be seen, the expectable water mass flows for typical stack efficiencies range from approximately 0.10 kg/s to 0.18 kg/s per MW of stack electric power.
All FC stacks considered in the study are assumed to be technically operated at an excess supply of reactants. While the excess air is simply passed through the stack, the unused fuel is assumed to be recirculated to the stack inlet without leakage.
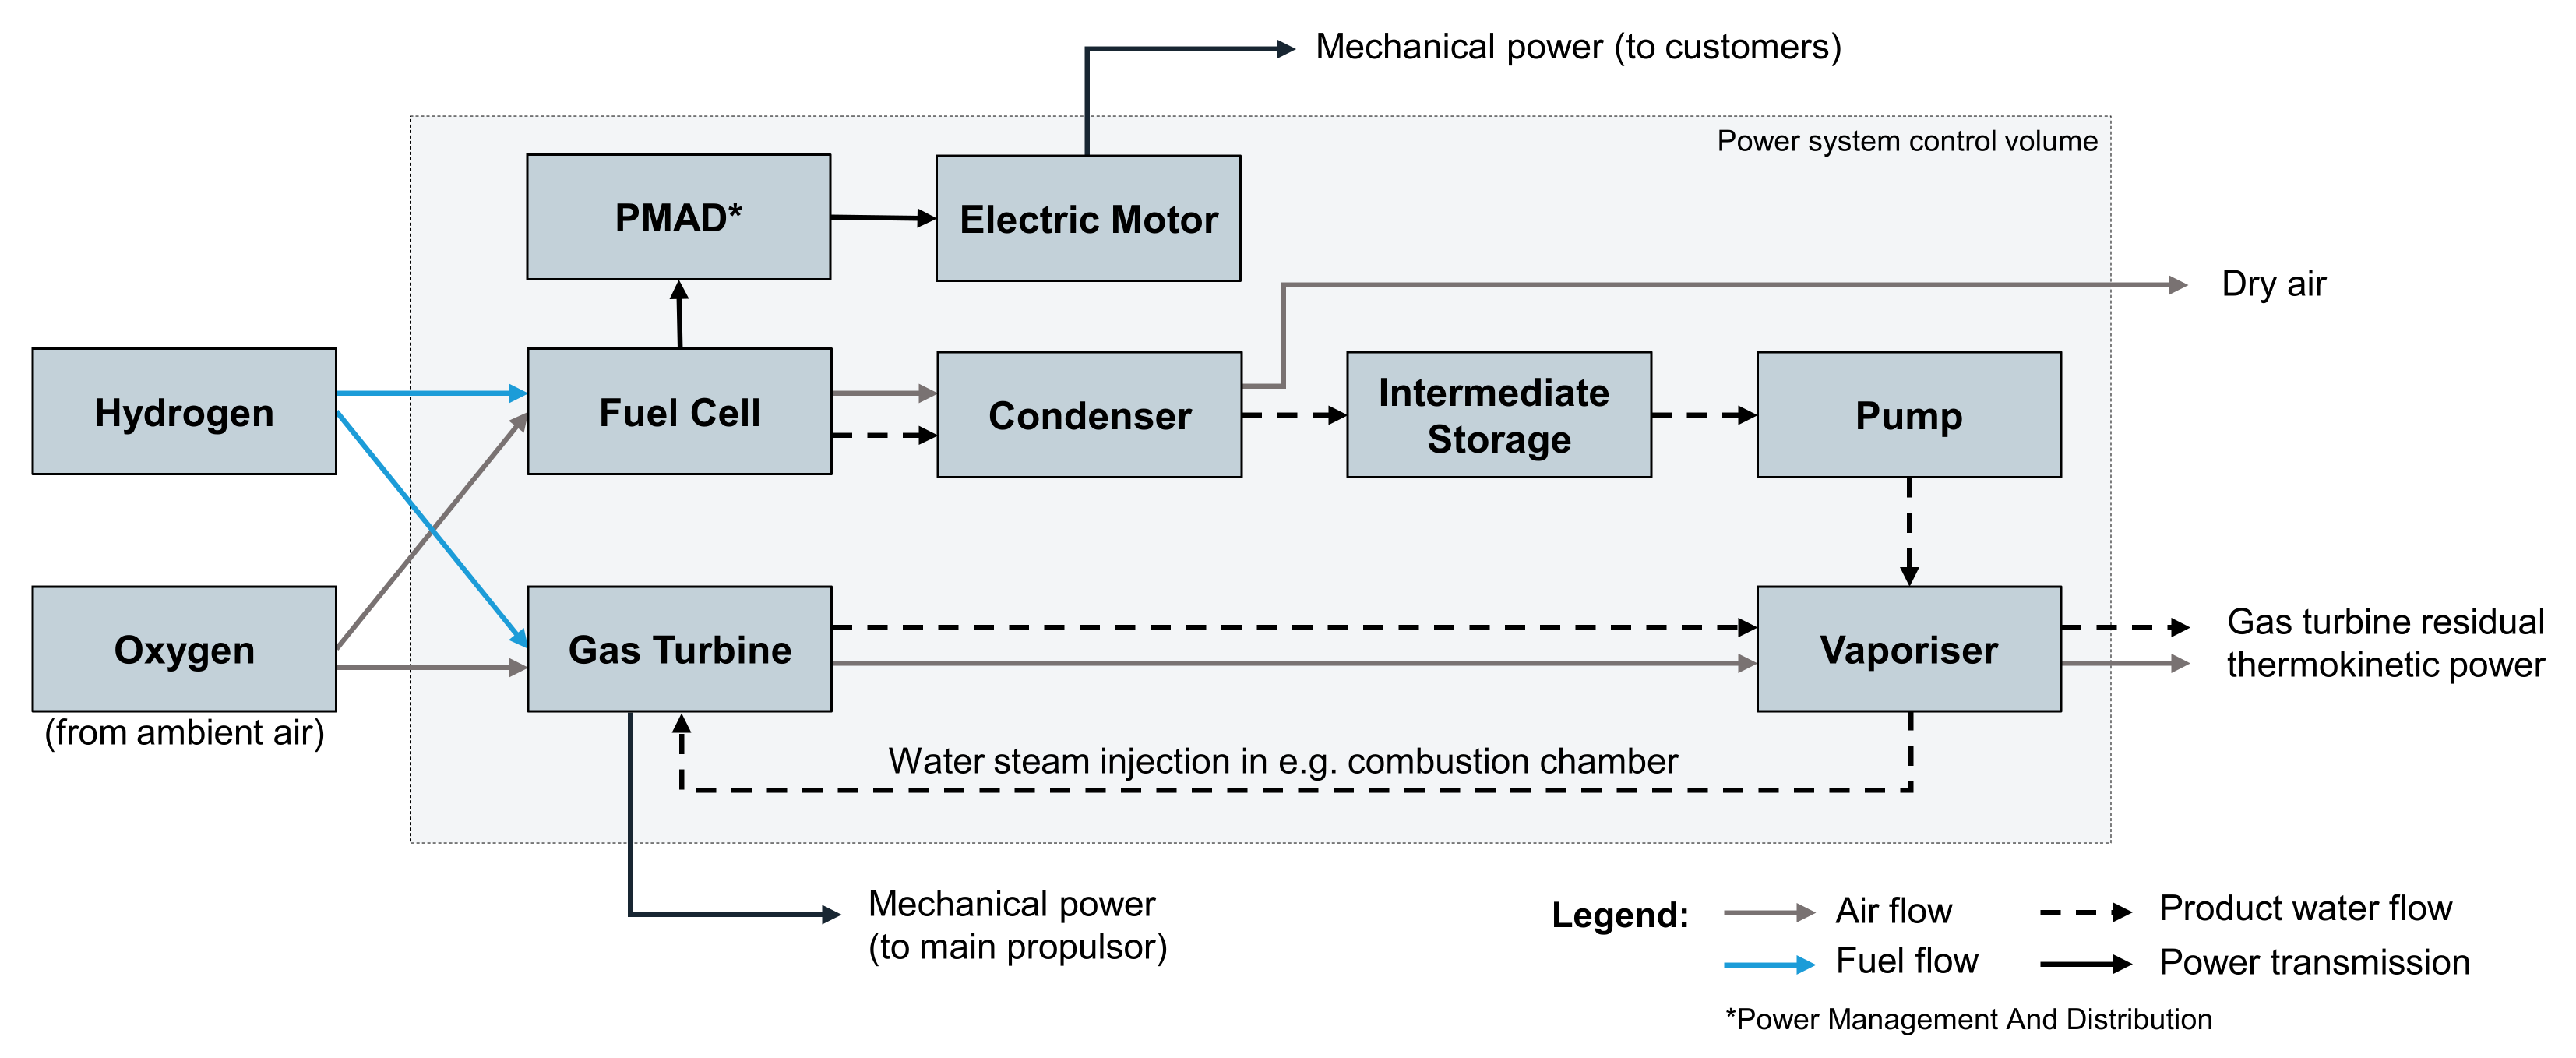
While for the efficiency formulation above only the net mass flow rate of fuel that is effectively participating in the cell redox reaction was relevant, the thermal balance requires a more careful consideration of the actual mass flow rate of the reactants. In order to simplify the modelling of this, the stack is embedded in an auxiliary control volume that internalizes the recycling of unused fuel as well as any potentially required preheating of the fuel prior to entering the stack. A schematic representation of the stack and the auxiliary control volume referred to as “FC module” is presented in Figure 4.
The thermal balance of the FC module in Figure 4 is given by the heat production rate due to the redox reaction in stack   Q ˙ S t a c k , p r o d , the net enthalpy flow across the FC due to its reactants net mass inflows, i.e., fuel and air supply, and its product mass outflow Δ H ˙ F C and the residual waste heat to be removed from the cell Q ˙ F C , c o o l . The stack internal heat source term can be calculated from the stack efficiency:
Q ˙ S t a c k , p r o d = m ˙ · F H V H 2 P S t a c k , e l = P S t a c k , e l · 1 η S t a c k 1 .
The heat transfer terms result from the mass flows entering and exiting the control volume of the FC module:
Δ H ˙ F C = m ˙ · h H 2 + m ˙ · h a i r m ˙ · h F C , p r o d ,
Q ˙ F C , c o o l = m ˙ · h c o o l , i n m ˙ · h c o o l , o u t .
As discussed above, m ˙ · h a i r represents the enthalpy of the gross stack inlet air flow, while m ˙ · h H 2 refers to the enthalpy of the net fuel inflow. For a stationary equilibrium stack operating temperature, the following balance must be reached:
Δ H ˙ F C + Q ˙ S t a c k , p r o d + Q ˙ F C , c o o l = 0 .
while the FC heat production rate Q ˙ F C , p r o d is always positive, the sign and absolute value of Δ H ˙ F C depend on the inflow temperatures of the reactants, the stack operating temperature and the effective operating stoichiometry, i.e., the excess air supply ratio.
In a case where Δ H ˙ F C is negative and its value exceeds Q ˙ S t a c k , p r o d this would mean residual waste heat to be removed from the FC becomes negative, i.e., the cell needs to be heated in order to maintain its operating temperature. While this may be less relevant for low temperature FCs, this may often be the case for highly efficient high-temperature FCs. High temperature cell operation also increases the demand for a preheating of the reactants prior to entering the stack in order to reduce local thermal stresses. While preheating of the pre-compressed inlet air is often not applicable, fuel preheating is often required. In practice, both requirements are tackled by utilising the heat contained in the stack’s product exit mass flow to preheat the fuel inlet mass flow [18,60].
In order to emulate this for the present study, heat is transferred from the stack product mass flow to the fuel inflow via an FC internal HEX until Δ H ˙ F C equals Q ˙ S t a c k , p r o d , in cases where Q ˙ F C , c o o l would otherwise be <0. As a result in these cases, the temperature of the product mass flow leaving the FC is reduced relative to the stack operating temperature. The total pressure of the product outflow is assumed to be sufficiently close to the stack operating pressure.
The hydrogen fuel is preheated from the fuel supply temperature at the FC entry. Prior to entering the control volume of the FC, the hydrogen fuel mass flow from the LH2 storage in the fuel tank is assumed to have absorbed a certain amount of heat due to its function as a cryogenic heat sink, e.g., used for the electric power train components as well as non-perfect thermal insulation of the fuel transmission system. A fuel supply temperature to the FC of 200 K is assumed for the present study.

3.2.2. Water Treatment Process

In order to allow for an efficient injection of the FC product water as superheated steam in the GT combustion chamber, the water first needs to be extracted from the FC product outflow, then pressurized in liquid form and re-vaporized. The basic thermodynamic implications of such a water treatment process are illustrated in Figure 5 based on a temperature entropy diagram for water. The water treatment process examples illustrated in the figure refer to the water released by a typical PEMFC and a typical SOFC, respectively.
An SOFC releases its product water at the anode (cf. Figure 2) while all other considered FC types release the water at the cathode, together with the excess mass flow from the cells’ oxidant supply. With the hydrogen fuel recirculated inside the FC, this means a pure water condenser for SOFCs. For all other FC types, the condenser sees a mixture of the FC product water mass flow and the residual air fraction of FC oxidant supply. Consequently, the partial pressure of the PEMFC’s product water in 
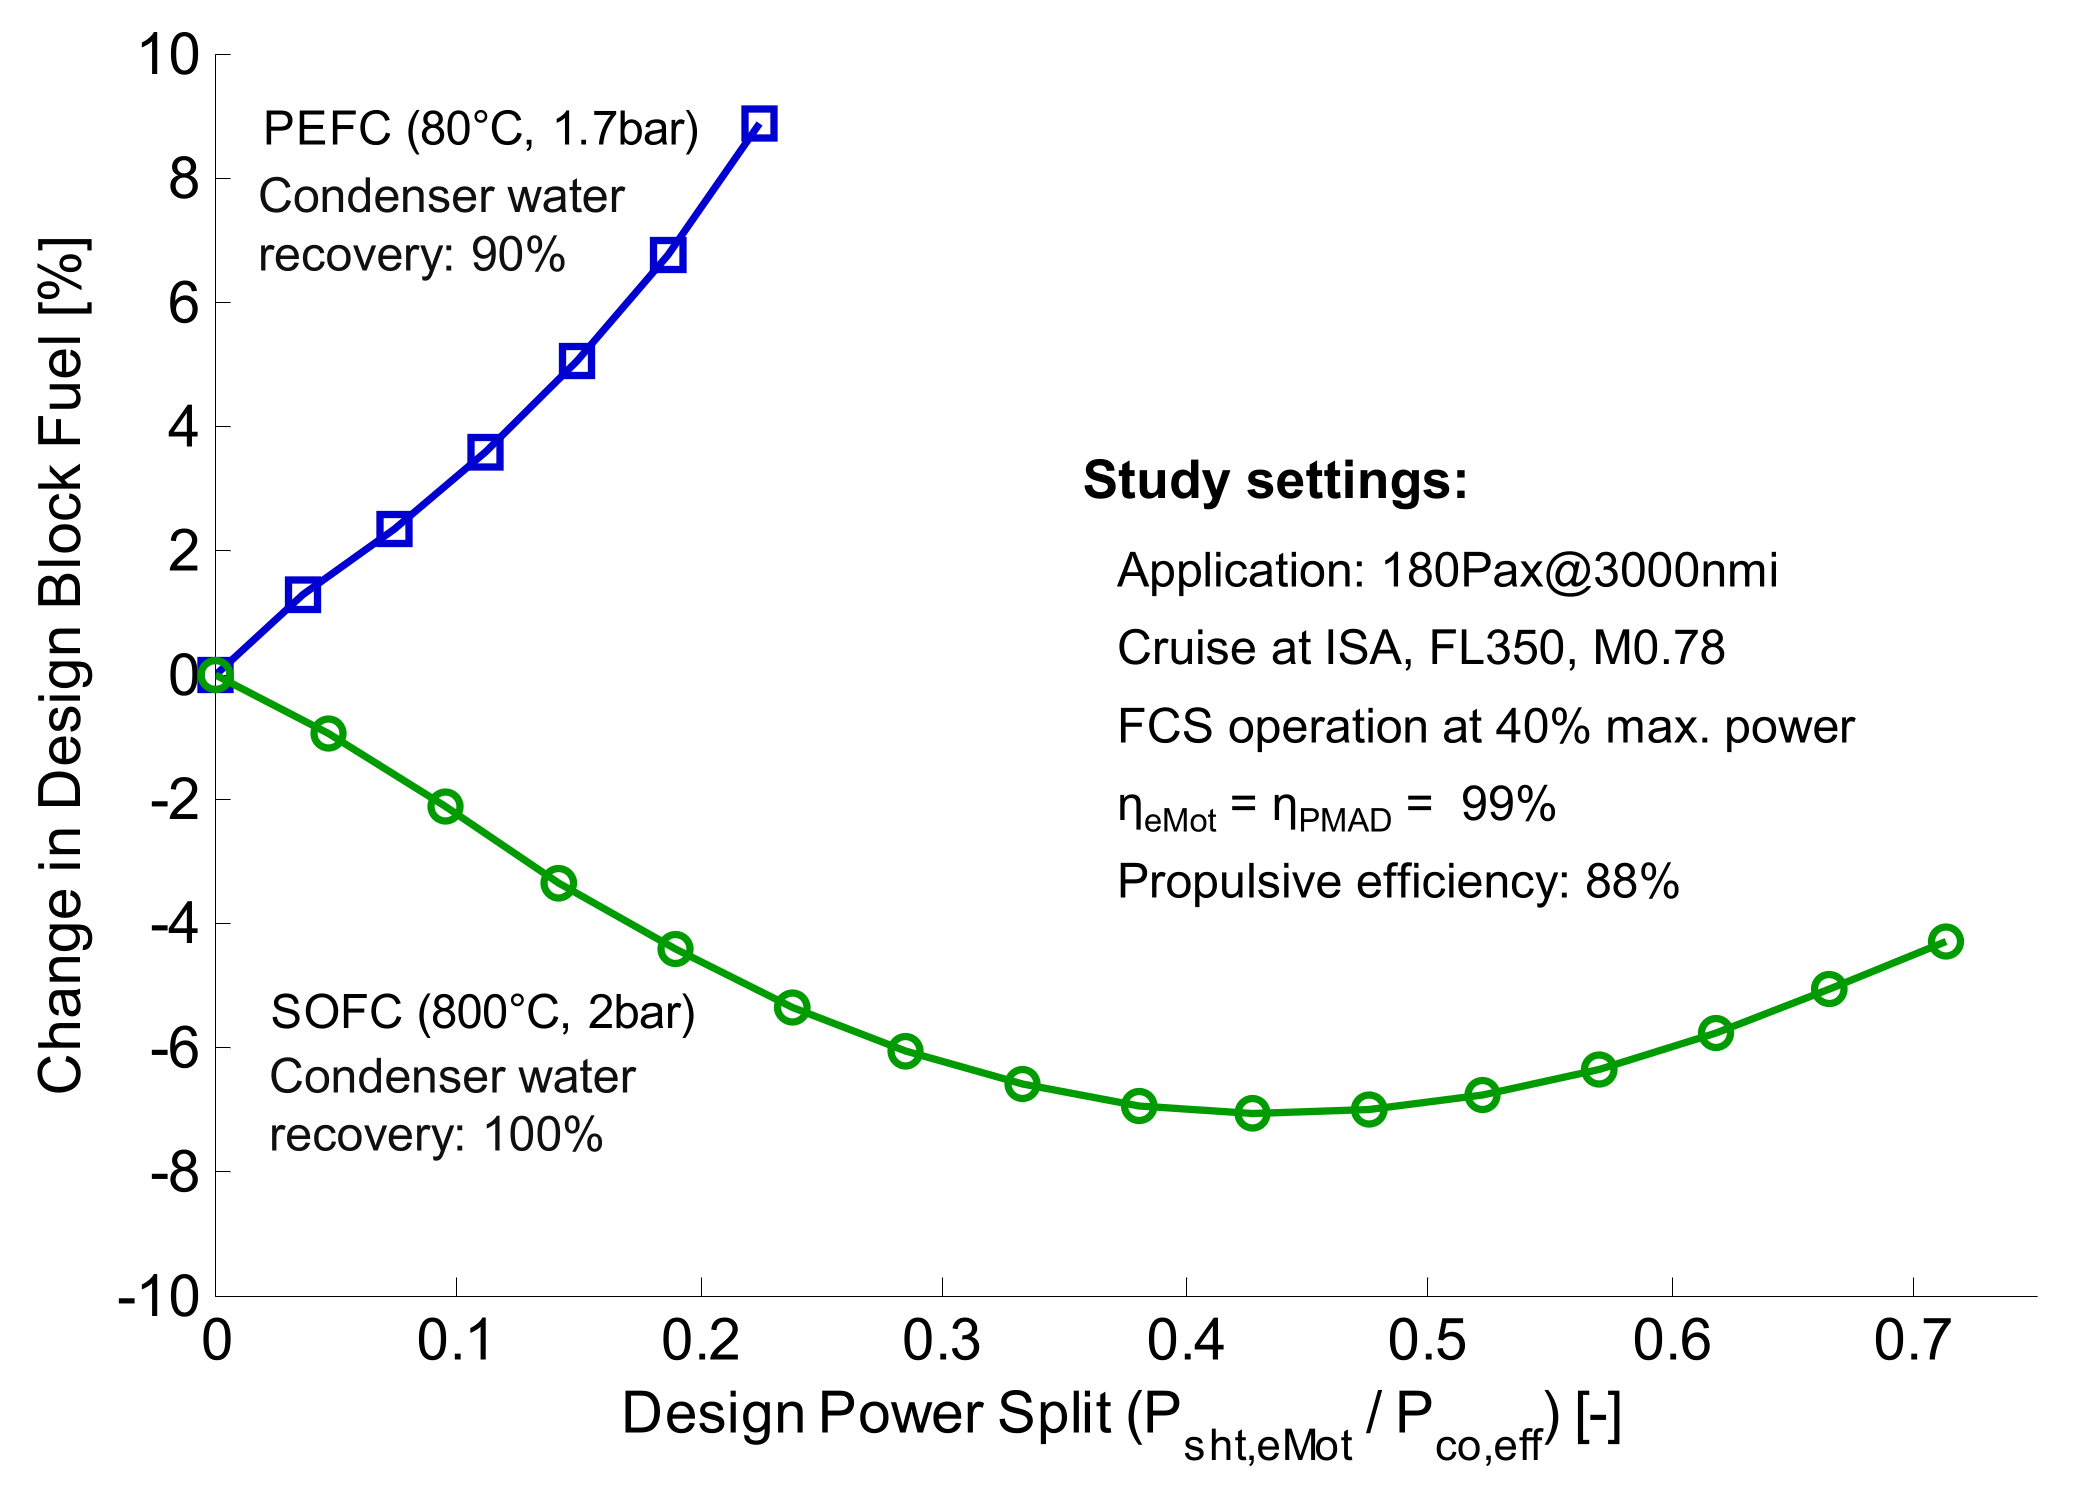
Figure 5 is significantly lower than that of the SOFC, resulting in a larger removal of heat required for the condensation process. At the same time, the condensation process of the PEMFC product water takes place at a lower temperature. The precooling of the FC product mass flow before condensation starts obviously requires more effort for the SOFC example due to the higher release temperature at the FC system exit.
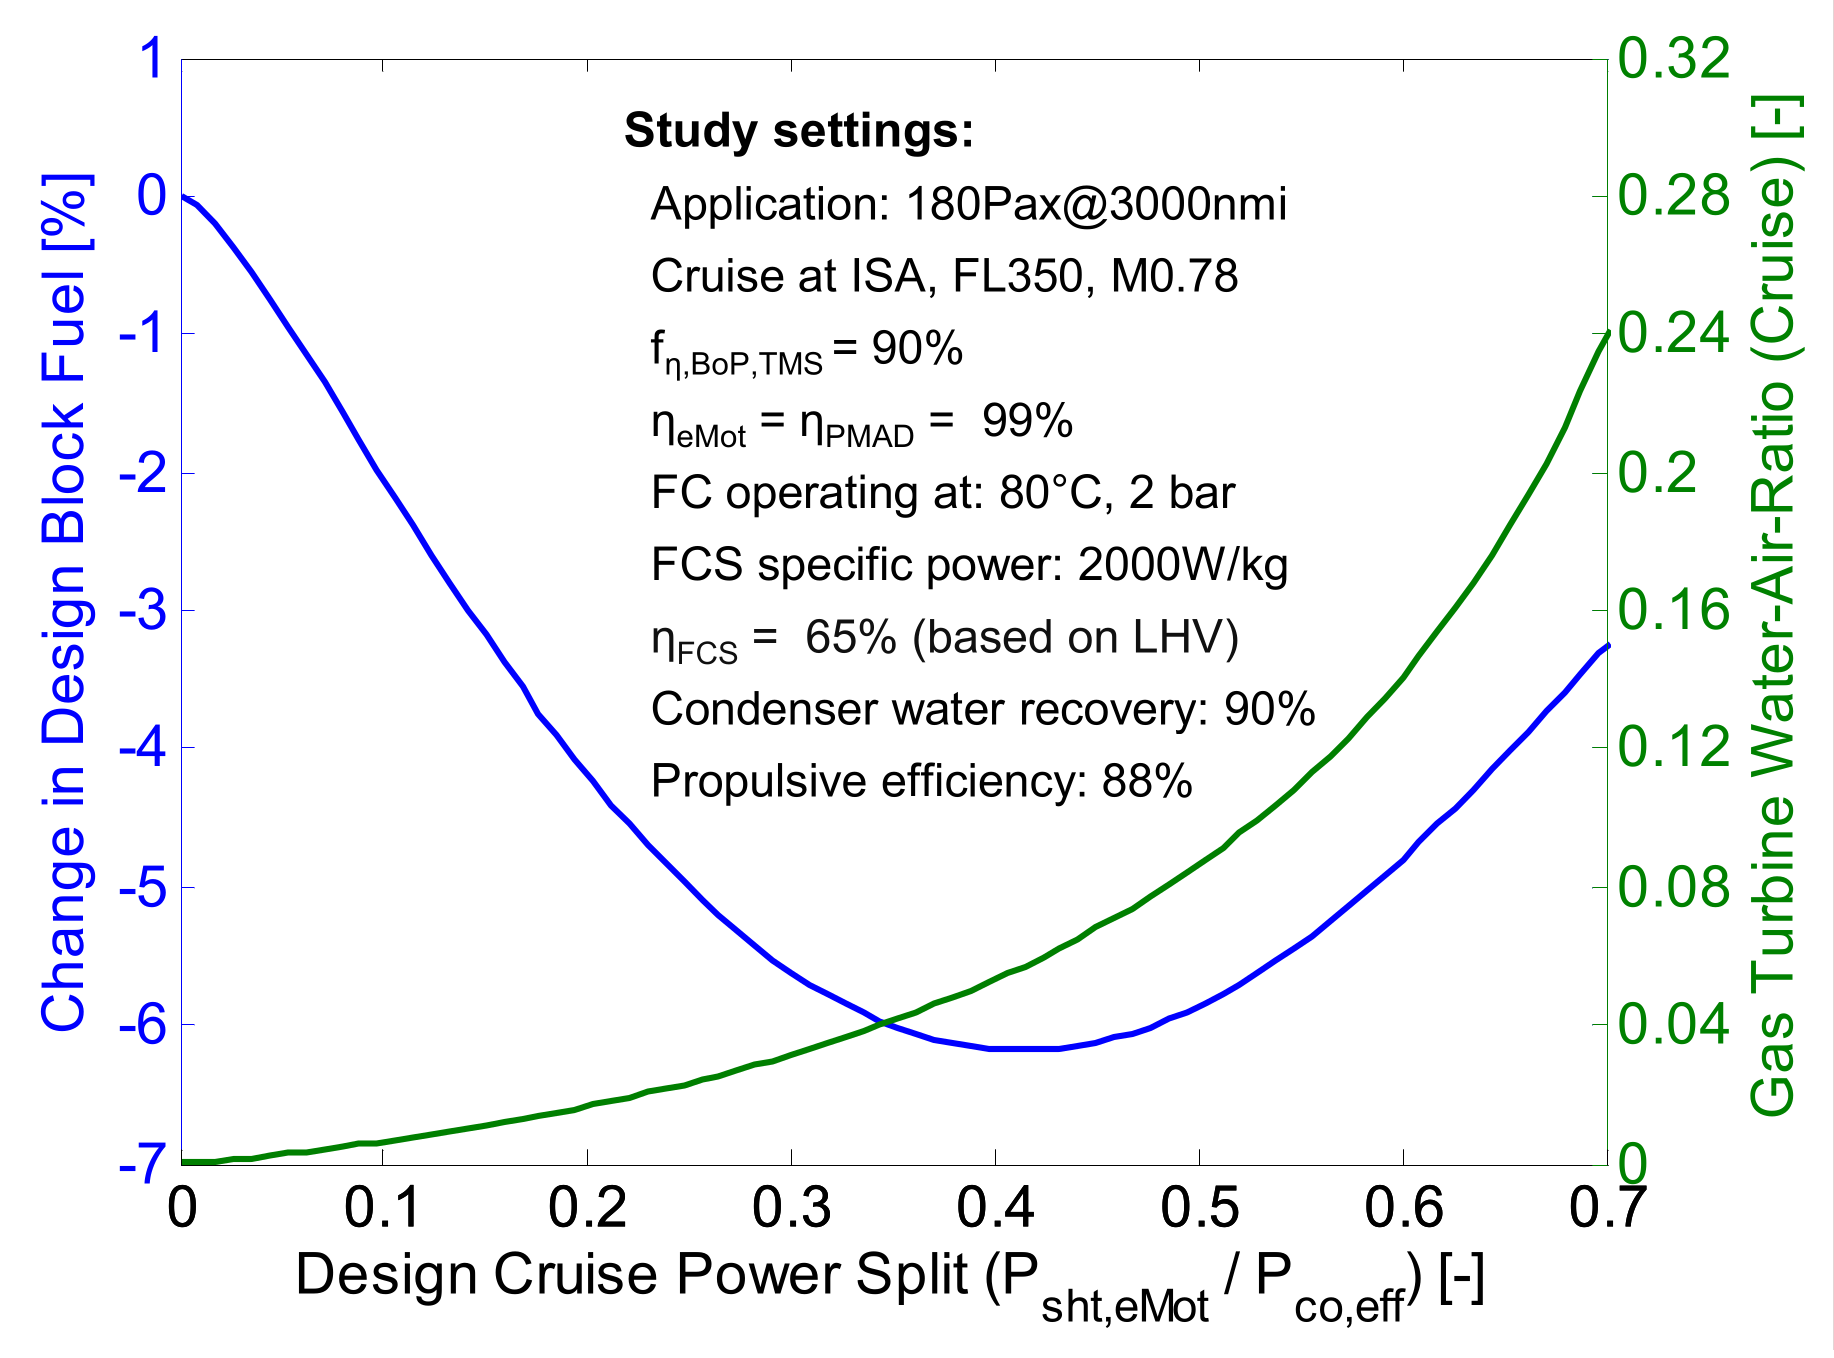
For all studies presented in this paper, a liquid recovery of ≥90% of the FC product water can be assumed. The corresponding heat exchanger design modelling is discussed in Section 3.2.4. The liquefied fraction of the FC product water is subsequently pressurized by a water pump to a pressure level suitably above the total pressure in the GT combustion chamber and is then piped to the gas turbine core exhaust locations where the high-pressure water is reheated, vaporized and superheated using the residual GT exhaust heat. The power input required for the water pressurization is expressed as follows:
P P u m p = m ˙ H 2 O ρ H 2 O , l i q u i d · P o u t P i n η P u m p   .
where m ˙ H 2 O is the liquid water mass flow through the pump and ρ H 2 O , l i q u i d refers to the corresponding fluid density. The pump system efficiency ηPump includes the hydraulic efficiency of the pump as well as the involved mechanical, electric drive and power system efficiencies. A typical pump-delivered pressure level pout would be 80 bar. The water inlet pressure level to the pump system, Pin, is defined by the FC operating pressure reduced by all pressure losses along the water treatment process between the FC stack and the pump inlet. Assuming Pin of 1.5 bar and ηPump to be 0.5, the resultant water mass flow specific power input to the water pump system yields 15.7 kW/(kg/s). Extracted from the FC system this equals less than 0.2% of its electric power output. This low pumping power requirement is also reflected the water T-s diagram (cf. Figure 5) where the condenser outlet conditions (in case of full water recovery) are in immediate proximity of the vaporizer inlet conditions.
The mass of the water pump is calculated from a reference pump given in [61] using water mass flow-based proportional mass scaling. The mass of the required water piping system is derived in analogy to the aircraft fuel system. As a reference point, fuel system mass and throughput characteristics similar to an Airbus A320 aircraft are assumed. Piping system mass is then estimated via mass flow scaling using the liquid water throughput. An optional water tank acting as an intermediate reservoir of liquid water for increased operational flexibility of the overall system is not yet considered in the modelling.

3.2.3. Gas Turbine Engine

For the present study, the GT water injection is assumed to be realized via superheated steam injection into the combustion chamber. The resulting immediate effects on the thermodynamic cycle include an additional turbine mass flow due to injected water/steam and an increased mass flow-specific heat capacity in turbine, as well as a reduced compressor mass flow for a given power demand. A key descriptor for the implications of GT water/steam injection is the water-air-ratio (WAR), being defined as the ratio of steam mass flow m ˙ S t e a m to compressor delivery mass flow at the combustor inlet m ˙ 31 , in the present study:
W A R = m ˙ S t e a m m ˙ 31 .
The increased heat capacity in the turbine section for different levels of temperature and WAR is displayed in Figure 6a, while Figure 6b shows the reduction of core compressor mass flow against increasing steam injection.
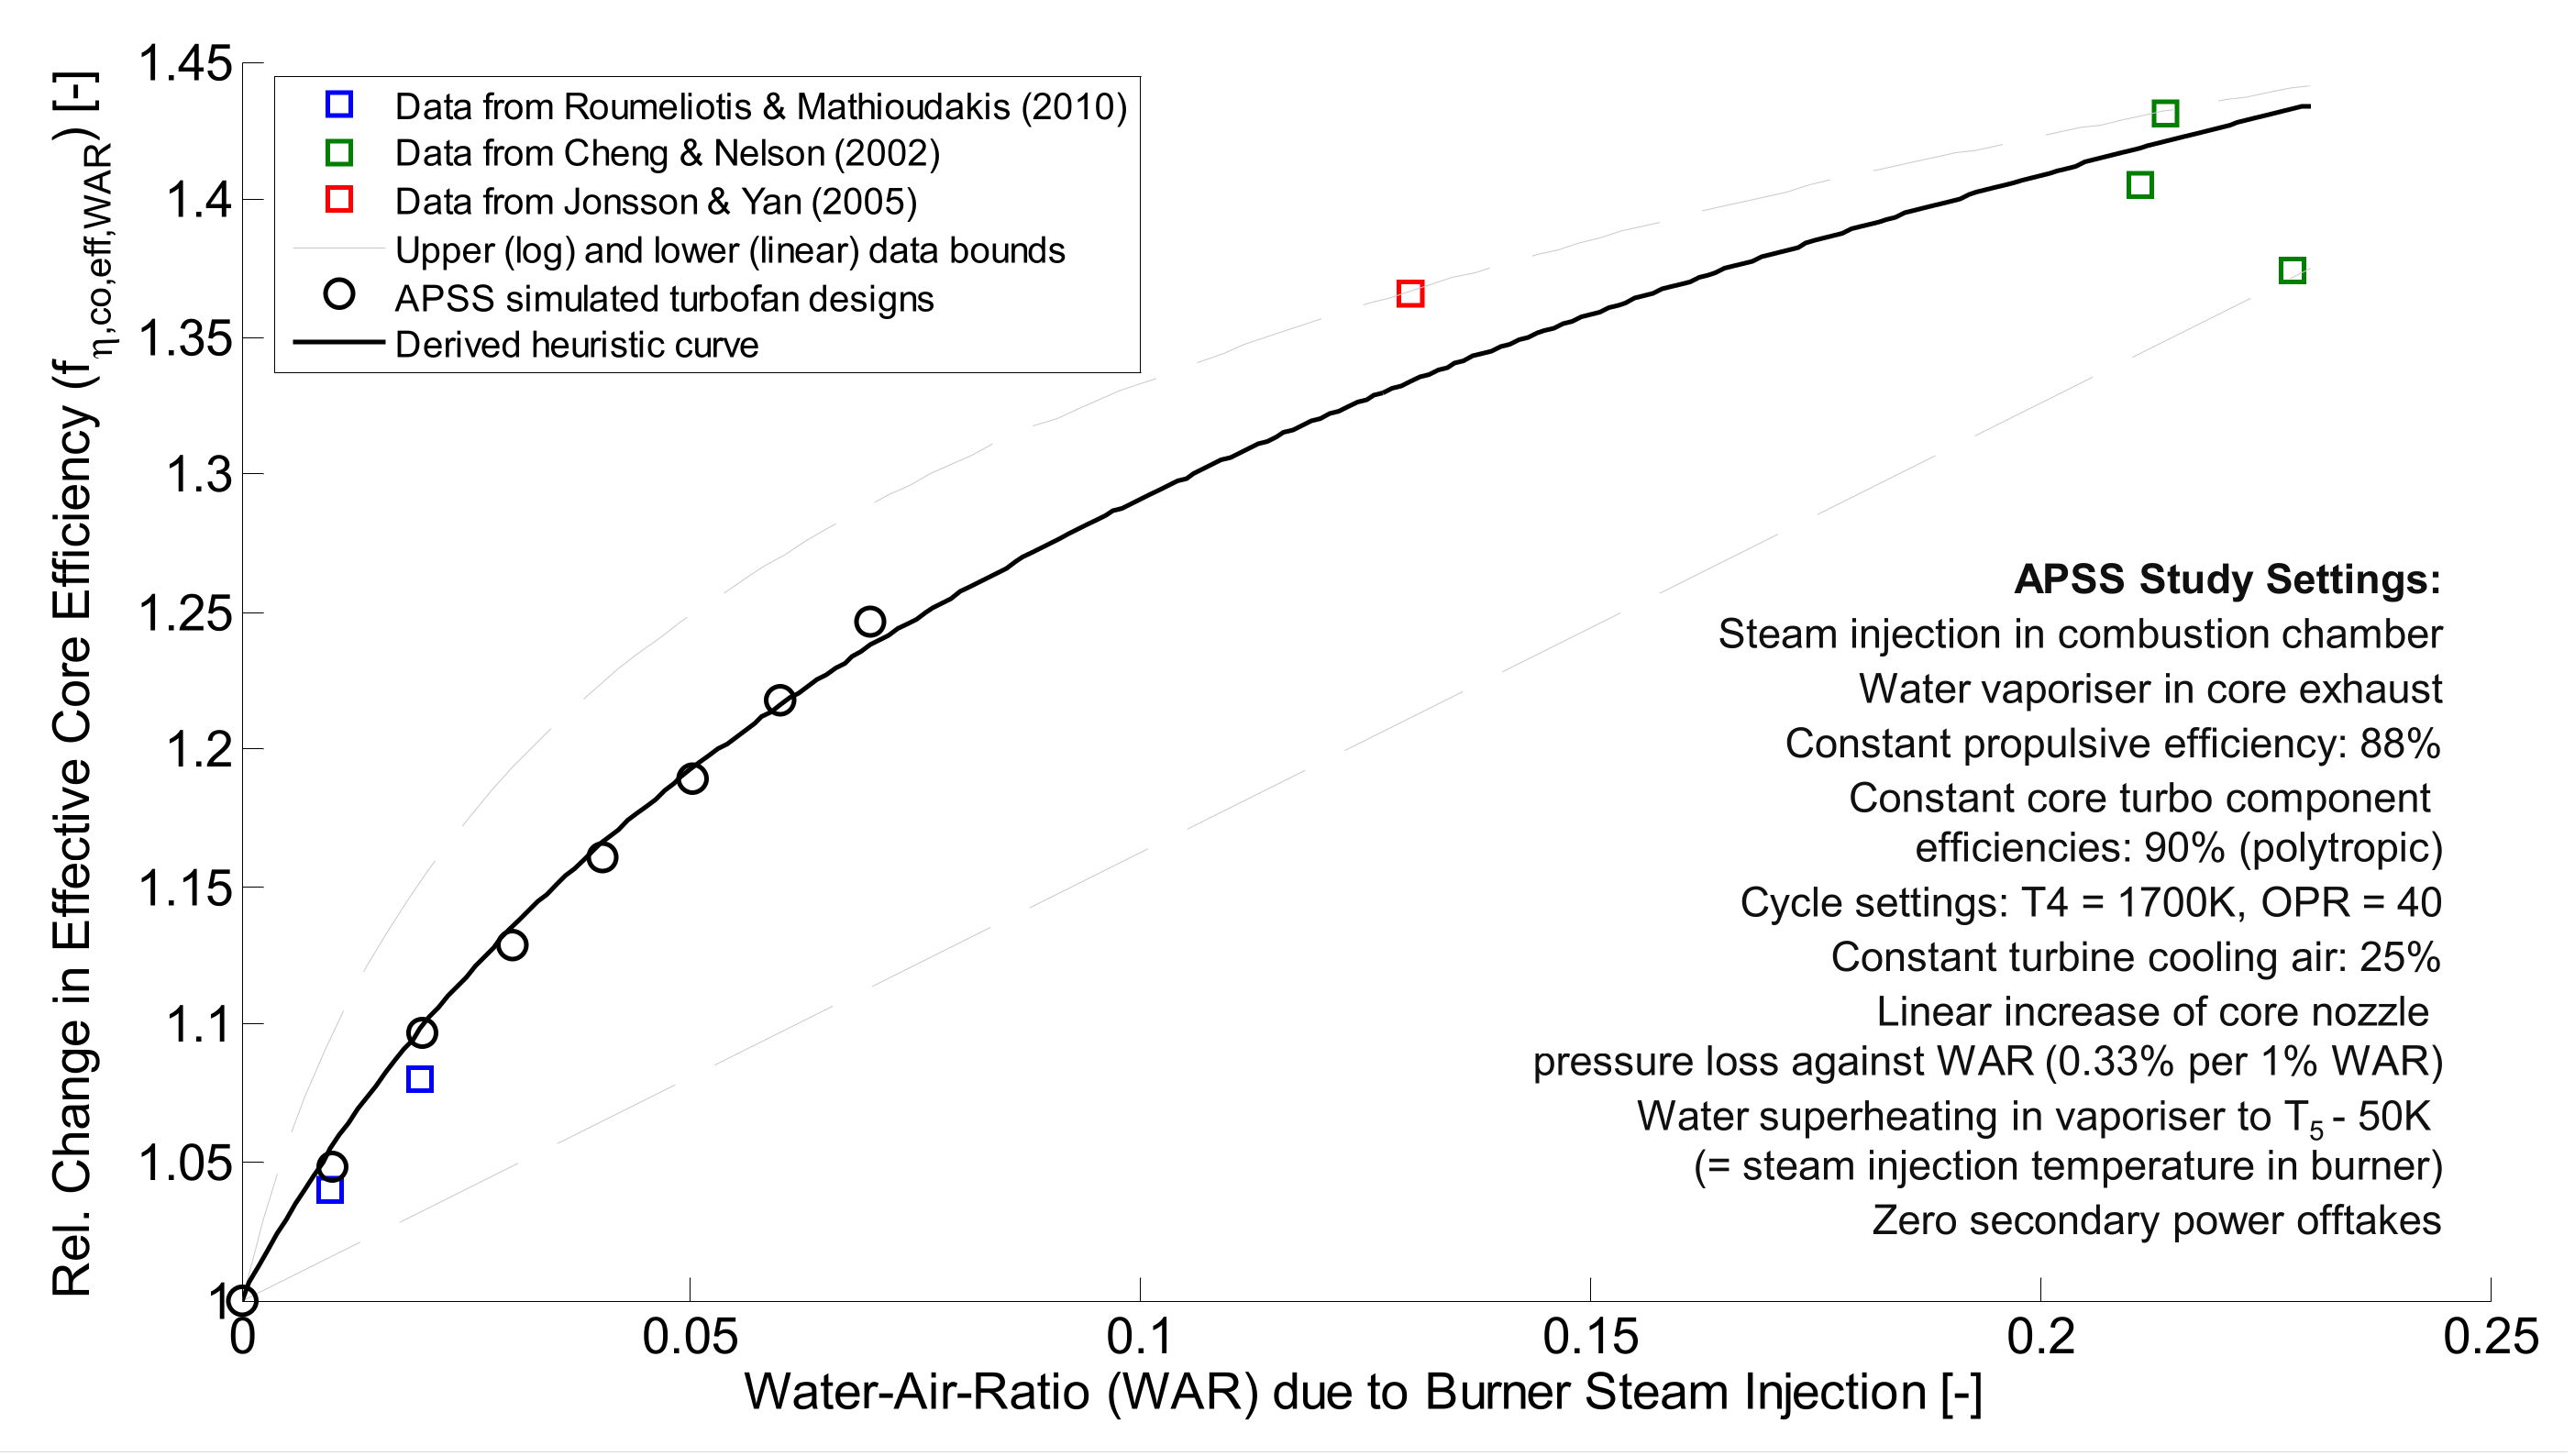
As can be seen from the figure above, the specific work potential enhancement due to change of thermodynamic fluid properties is significant, e.g., approximately 25% at WAR = 0.3 for a typical average temperature level in the turbine section. At the same time, the core compressor mass flow reduces at a steep rate of approximately 1.8% per percent WAR increase, if a constant cycle output power is prescribed. This over-proportional compressor mass flow decrease results from the combined effect of the increased specific heat capacity in turbine flow and the added steam mass flow acting in the turbine section only. In this case, the required cycle output power is additionally reduced by the power produced through water supplying FC and the core compressor mass flow is reduced by more than 50% at WAR = 0.1.
Assuming the steam production from the liquefied FC product water mass flow to be performed using heat from the GT exhaust mass flow, the presence of the HEX in the core engine exhaust section will cause a pressure loss as a function of the amount of heat to be exchanged and as a trade-off with HEX size and mass.
In order to appropriately capture these main effects on the GT’s effective core efficiency, a simplified formulation approach is used for the present study. Accordingly, all the primary effects due to the steam injection are combined in the efficiency factor f η , c o , e f f , W A R . The GT effective core efficiency ηco,eff,GT is obtained when multiplying the steam injection efficiency factor with a baseline efficiency value η c o , e f f , b a s e :
η c o , e f f , G T = f η , c o , e f f , W A R · η c o , e f f , b a s e P c o , e f f , G T .
It should be noted that the baseline efficiency η c o , e f f , b a s e will strongly depend on GT size effects. In order to also allow for technological sensitivity, the modelling of η c o , e f f , b a s e is factorised into two parameters, and a technology factor f η , c o , e f f , t e c h is used to emulate the ηco,eff,GT impact of advanced technology status and a true reference efficiency η c o , e f f , r e f , which is modelled as a function of P c o , e f f , G T :
η c o , e f f , b a s e = f η , c o , e f f , t e c h · η c o , e f f , r e f P c o , e f f , G T .
For η c o , e f f , r e f , a simple data fitting based on BHL-internal models of existing aircraft GT engines of different power classes typical for the year 2000 in service technology is employed in this paper:
η c o , e f f , r e f = 0.5089 5.0654 · P c o , e f f , G T M W + 3.8 1.9 .
Based on its regression input data set, the validity of the η c o , e f f , r e f correlation ranges from P c o , e f f , G T   ≈ 1.5 MW up to P c o , e f f , G T   ≈ 30 MW in cruise. Throughout the studies presented in this paper, a value of 1.2 is chosen for f η , c o , e f f , t e c h in order to represent an appropriately advanced technology level.
For the f η , c o , e f f , W A R factor, a simple heuristic based on published data and in-house performance synthesis computations was derived. The data basis for the heuristic law is visualized in Figure 7 below.
Roumeliotis and Mathioudakis [37] investigated the effects of water injection on GTs more generally, taking varying injection locations and conditions into account. For water steam injection in the combustion chamber, a potential for core efficiency enhancement of approximately 4% per 1% WAR is stated for low WAR injection rates and constant turbine inlet temperature operation. In Figure 7, data points for 2% and 4% WAR are depicted. Jonsson and Yan [38] collected data for various GT water/steam injection options. Again, a relevant data point derived from efficiency values provided for steam injection in the combustion chamber is annotated in Figure 7. Finally, Cheng and Nelson predicted a potential for an efficiency increase of up to 43% at WAR slightly above 20% while using exhaust gas recuperation for steam generation.
In order to supplement the data obtained from the literature, a number of GT cycle design points were computed for the present study using BHL’s in-house “Aircraft Propulsion System Simulation” (APSS) framework (cf. e.g., [84,85,86]). For these in-house simulated data points (black circles in Figure 7), steam injection in the combustion chamber of a 2-spool turbofan engine architecture was modelled using constant core turbo component polytropic efficiencies of 90%, a cycle featuring a burner exit temperature T4 of 1700 K at an Overall Pressure Ratio (OPR) of 40 and a constant turbine cooling air supply of 25% of the high pressure compressor exit mass flow. Secondary customer offtakes including power and bleed air were set to zero. The vaporization and superheating of the recovery FC product water mass flow were modelled via a turbine exit duct-mounted vaporizer assuming a water heating up to LPT exit temperature T5-50 K (=steam injection temperature in burner). To reflect the increasing heating effort required for the water vaporization and superheating as the water to GT exhaust air flow ratio grows, a linear correlation of core nozzle pressure loss against WAR was assumed that yields 5% at WAR = 0.15. For a given ideal nozzle exit velocity ratio according to Gasparovic [80], this effectively equals an increased back pressure for the cycle, hence reduced turbine expansion capacity. As such, the efficiency implication of the water vaporizer behind the LPT is effectively mapped to the effective core efficiency of the GT.
The heuristic correlation for f η , c o , e f f , W A R derived from the data collected in Figure 7 yields:
f η , c o , e f f , W A R = 1 + 0.21 · ln 30 · W A R + 1 .
As can be seen in Figure 7, the correlation is supported by reference data up to WAR values of approximately 20%. As a first indication for the correlation’s confidence level, the logarithmic upper and linear lower bounds of the reference data basis are indicated as dashed lines in the figure.
The impact of steam injection in the GT combustion chamber on cruise NOx emissions is estimated based on the experimental results for ultra-wet hydrogen combustion published by Göke et al. in their Figure 8 [42]. Therefore, quadratic data fittings for the NOx concentrations measured in the combustion products under water-to-air ratios between 0% and 30% were produced at relevant combustion temperature levels. For a given WAR, an average NOx concentration can be calculated from the set of data fittings. Absolute GT NOx emissions obtained as the product of NOx concentration and actual fuel flow can then be related to the NOx emissions at WAR = 0 in order to evaluate the NOx reduction potentials. Assuming zero NOx emissions from the FC system, GT-produced NOx represents the total NOx emissions of the propulsion system.

3.2.4. Heat Exchangers

While for the efficiency of the FC module internal HEX used for the preheating of fuel (cf. Section 3.2.1), a prescribed value of 90% is assumed, the HEXs involved in the water treatment process require a more detailed consideration: The first one along the process is a HEX (condenser) required for water recovery from the FC product mass flow. It should be noted that the composition and thermal conditions of the relevant part of the FC outflow strongly depend on the FC type (cf. Section 3.2.2).
The condenser is modelled to be operated with freestream air as a coolant. The freestream mass flow rate is tailored to ensure a sufficient pinch point temperature difference between hot and cold HEX sides of 40 K at design point conditions (FL350, M0.78, ISA+10). The HEX performance calculation is therefore divided into two steps:
  • temperature reduction down to saturation conditions; and,
  • subsequent further cooling for latent heat transfer during phase change.
A second HEX (vaporizer) uses the GT exhaust gas mass flow for the vaporization and superheating of the pressurized water. The heat transfer of this HEX is segmented in three parts:
  • heating the liquid water to boiling temperature;
  • water vaporization; and,
  • subsequent superheating of the water steam.
For sufficient thermodynamic conservatism in the studies presented in Section 4, steam superheating was limited to T5 − 50 K. Both HEXs are modelled as counter flow HEXs with assumptions on pressure losses as summarized in Table 1.
HEX efficiency η H E X for the condenser and vaporizer components is defined by the ratio of realized temperature difference between inlet to outlet and the theoretically maximum temperature difference between HEX hot side and cold side inlet:
η H E X , C o n d = T C o n d , i n , h T C o n d , o u t , h T C o n d , i n , h T C o n d , i n , c ,     η H E X , V a p = T V a p , o u t , c T V a p , i n , c T V a p , i n , h T V a p , i n , c   .
HEX mass estimation is based on a semi-empirical method for air-air HEX acc. to Grieb [59]. Therefore, data for mass flow-specific matrix weights of exhaust recuperators versus HEX efficiency η H E X provided in [59] were fitted and scaled by a constant factor representing GT exhaust recuperator HEX installation weight effects f m , H E X , i n s t , yielding the following correlation:
m H E X = f m , H E X , i n s t · 82 · m ˙ a i r · η H E X + 0.2 8.1   ,
where m ˙ a i r is the representative air mass flow through the HEX matrix. Taking into account the specific matrix weight data used for the regression, the validity of Equation (34) ranges from η H E X ≈ 0.6 up to η H E X ≈ 0.9. For all HEX weight estimates in the present paper, a value of 1.6 is assumed for f m , H E X , i n s t (cf. also [59]).
In order to emulate the sizing of the multi-fluid, multi-phase HEXs involved in the water treatment process, the correlation in Equation (35) is applied using an equivalent air mass flow derived from the actually required heat capacity flows in the condenser and vaporiser HEXs. The respective equivalent air mass flows are tailored to facilitate the same amounts of heat transfer at the same temperature differences as the real multi-fluid, phase-changing condensers and vaporizers.

3.2.5. Electric Power Train

The electric power train represents the link between the net electric output power of the FC system and the mechanical shaft power absorbed by the targeted onboard customers. As such, it is constituted by a Power Management And Distribution (PMAD) system and a dedicated number of controlled electric motors. In the studies presented in this paper, as a first approach, the FC electric power is used to assist in driving the installed propulsive devices on the aircraft. Owing to the presence of the onboard LH2 fuel storage as a convenient low-temperature heat sink, the employment of cryogenic technologies for key components of the electric power train seems warranted. This is reflected in a PMAD system efficiency ηPMAD of 99%, as well as the assumption of a High Temperature Superconducting (HTS) electric motor design paradigm also featuring 99% controlled efficiency (cf. e.g., [78]). Correspondingly, an advanced specific power target of 10 kW/kg is assumed for the overall electric power train.

3.2.6. Propulsive Devices

The propulsive device represents the assembly of the ducted fan, including the fan module, the fan drive gear system and the nacelle system. For all propulsive devices in the study, an effective propulsive device efficiency of 75% during typical cruise is assumed. This corresponds to a classic propulsive efficiency of approximately 88%, representing an advanced low specific thrust fan design.
Propulsive device mass is modelled based on a prescribed thrust-to-weight ratio in cruise. For the study, a cruise thrust-to-weight ratio of 1.7 is assumed, which is approximately 3 times the cruise thrust-to-weight ratio estimated for the advanced turbofan-type power plant systems.

3.3. Derivation of Lab-Scale Fuel Cell Technology Properties

In an attempt to evaluate the application potential of several FC types as introduced in Section 2.2 for the hybrid-concept presented herein, a number of recent publications on FC developments were taken into consideration [21,23,24,29,73,87,88,89,90]. Note that the focus lies on power performance only—other considerations of employing an FC in an aircraft (e.g., vibration tolerance, transient performance, etc.) go beyond the scope of this evaluation (cf. Appendix A.1).
As the polarization curves of novel FC developments are typically quoted per electrode area (i.e., in W/cm2), a number of assumptions (e.g., on thickness and weight share of cell components) were made in order to estimate the respective specific power in kW/kg as required for an assessment of the presented hybrid concept. For each FC type, a value for a conservative and a more aggressive estimation is specified in Table A1.
All corresponding assumptions, technical details and references are given in Appendix A.2 to Appendix A.4. After recalculating the polarization curve in terms of stack specific power by normalizing with the derived peak power tabulated in Appendix A.5, the two best performing candidates were identified. Figure 8 displays the so-calculated performance characteristics of both cases based on the aggressive assumptions introduced in Appendix A.
For a given electric power output requirement and a specified operating point along the polarization curve, FC stack mass m S t a c k can be calculated from the data provided in Figure 8. In order to obtain the total mass of the FC system m F C S including its balance of plant and auxiliaries, the following correlation is used:
m F C S = m S t a c k + m S t a c k · f m , B o P , T M S + f m , B o P , A i r c o m p + f m , B o P , R e s   ,
where the additive mass factors f m , B o P indicate typical masses of key component groups of the balance of plant in relation to the stack mass. A synopsis of the factors used for the estimation of the FC system masses associated with the PEMFC and SOFC technology cases in Figure 8 is provided in Table 2.
For the FC system mass calculation, three main component groups of the balance of plants and auxiliaries are distinguished: for the FC thermal management ( f m , B o P , T M S ), the air compression system ( f m , B o P , A i r c o m p ) and the residual of all other components ( f m , B o P , R e s ). As can be seen from Table 2, the values of the individual additive mass factors strongly depend on the FC type and its typical operating conditions, namely temperature and pressure. In particular, the significant additional mass connected to the thermal management system of the low-temperature FC technology option, namely the PEMFC, should be noted.

3.4. Simplified Aircraft Scaling Approach

Aircraft conceptual design and sizing for the integrated power system assessment studies presented in Section 4 of the paper is realized using a simplified discipline-oriented set of analysis modules based on Seitz [92]. Starting from the definition of the configurational setup of the aircraft and the integrated propulsion system, the design synthesis procedure includes
  • the basic geometric description of the aircraft and its components primarily relevant for the study;
  • the estimation of key aircraft component masses based on the underlying simplified geometric descriptions;
  • the computation of aircraft aerodynamics during high-speed operation using the pre-calculated geometric and weight properties; and,
  • the analysis of aircraft design mission performance based on the system weights, the aerodynamic properties and the energy and propulsion system efficiency characteristics.
During aircraft sizing, these disciplinary modules are consecutively evaluated. The required feedback correlations during the iterative aircraft scaling procedure are handled using a gradient-free iteration strategy as described and validated in [92]. Further verification and validation of the aircraft scaling approach were performed by Seitz and Engelmann [93]. For the present study, the pre-existing set of methods was supplemented in order to appropriately facilitate the aspired design studies for an LH2-fuelled short-/medium range aircraft, with the cryogenic fuel storage accommodated in the fuselage. In the following, key relevant modelling aspects are discussed along the main disciplinary modules.

3.4.1. Geometry

Lifting surfaces are represented by simple trapezoidal planforms. Wing reference area scaling is performed for a prescribed wing loading at maximum landing weight in order to ensure appropriate low speed performance without detailed modelling of high-lift performance. Wing sweep is determined based on the simple sweep theory, i.e., employing cosine correction of the design cruise Mach number, applied to the aerodynamic center line at 25% chord length. Here, the effective design incidence Mach number for the wing airfoils is used as in input. Wing taper ratio is balanced to approximate elliptical spanwise lift distribution as a function of aircraft design cruise Mach number, wing aspect ratio and sweep angle according to Torenbeek [94]. Tail plane sizes are mapped as functions of wing reference area through prescribed volume coefficients. The wetted areas of lifting surfaces are determined based on the exposed regions of the component planform, translated using an empirical correlation given by McCormick [95]. Fuselage dimensioning in terms of diameter and overall length is performed under consideration of the design payload capacity and volumetric requirement associated with the accommodation of the onboard LH2 fuel storage. The assumed LH2 tank shape features spherically shaped heads that enclose an optional cylindrical center section. For the presented studies, an inner tank volume utilization of 87% is assumed, which corresponds to a 1.2 bar filling pressure and a venting pressure of 4 bar [9]. The corresponding gravimetric density of LH2 is read from [9]. An additional allowance of 4% for trapped and unusable fuel in the tank is taken into account. A volumetric ratio of the tank walls to the inner storage volume of 40% is assumed based on results presented by Winnefeld et al. [96]. In summary, this yields a volumetric efficiency of the LH2 storage, i.e., ratio of design mission fuel volume to the external displacement volume of the LH2 tank in the fuselage, of 64%. During parametric studies with constant design passenger payload, fuselage diameter is retained constant, setting an upper limit to the allowable outer tank diameter. Hence, variations in required LH2 tank size are accommodated via stretching or shrinking the length of the cylindrical fuselage center section.

3.4.2. Weights

The mapping of aircraft component masses is based on a combination of suitable textbook methods. The selection of the employed handbook methods for the individual components is made in order to secure appropriate functional sensitivity for essential physical effects connected to the aspired conceptual design study at aircraft level. A compact overview of the weight prediction methods for key aircraft components is given as follows: Wing and fuselage structural masses are calculated according to [97]. For LH2 tank mass estimation a constant gravimetric tank efficiency as defined by Verstraete [9] of 50% is assumed, i.e., the tank’s structural mass equals the stored fuel mass. The mass of the LH2-specific onboard fuel system is considered as a constant fraction (2.5%) of aircraft Maximum Take-Off Weight (MTOW). All other airframe components, systems and equipment masses are summarized in a residual share of MTOW. Optimized mass and balance for aircraft with fuselage stored LH2 tanks is neglected, in the first instance.

3.4.3. Aerodynamics

The mapping of aircraft aerodynamics is based on handbook methods (cf. [95,98,99,100]). A simple symmetric polar approach is used with the induced drag share modelled based on the wing’s geometric properties using a correlation for Oswald’s efficiency factor given by [100]. Skin friction and form drag for the wing and fuselage components are determined according to [95]. For wing aerodynamic mapping, the Mean Aerodynamic Chord (MAC) is treated as representative. The flow around the fuselage is assumed to be fully turbulent. The relative chordwise transition point from laminar to turbulent flow along the wing’s MAC is prescribed by a free input parameter. The skin friction and form drags of all other aircraft components, including the empennage and propulsion system nacelles, are directly geared to the wing’s drag using a constant factor. The wave drag of the overall aircraft is prescribed as a constant share of its total drag. The additional drag due to the rejection of water condenser as well as the FC waste heat is estimated as a delta in drag coefficient based on a change in drag counts per rejected heat load given by Pratt et al. [101]. Trim drag (typically 1–2% of aircraft total drag) is not explicitly modelled, but is considered as part of the induced drag share.

3.4.4. Performance

The performance mapping of the study aircraft is based on the performance formulation presented in Section 3.1. For the mission, fuel burn calculation during aircraft sizing is evaluated using the Breguet-Coffin equation as provided in Equation (17). Mission trip fuel is computed solely based on the performance properties for a typical cruise point. As such, the transversal flight phases are averaged as part of the considered cruise segment. Mission block fuel is obtained by adding a mass fraction of 1% of aircraft MTOW for LTO cycle and taxi fuel to the calculated trip fuel mass. For the computation design loaded fuel, the design stage length is increased by an additional 800 nmi as a convenient means of incorporating the required contingencies and reserves.

4. Concept Evaluation Results

In this section, the evaluation results for the investigated hybrid propulsion and power system concept are presented. Therefore, initial design studies at the isolated power system level and at the integrated vehicular level are introduced and discussed, before the impact of two selected scenarios of lab-scale FC technology on the potential aircraft design fuel and in-flight NOx emission savings is assessed. To round off, more advanced integration options for the investigated technology concept are discussed in brief. The power system layout considered throughout the initial assessment features one FC system driving an electrically powered fan and two under-wing installed turbofan-type GT power plants. Specific aircraft-level integration implications of a third propulsive device, such as geometric integration aspects, changed structural load paths and local aerodynamic interference drag effects, as well as center of gravity shifts, control surface sizing impacts and changed OEI climb gradients during aircraft sizing, are not taken account in the first instance. Instead, the shaft power absorbed, the thrust produced and the mass added by the electrically driven fan is simply added to the propulsive devices of the turbofan power plants, thereby emulating a twin-engine aircraft configuration. All system and component sizing during the concept evaluation studies presented in the following are purely based on representative cruise conditions with typical margins built in for key high-power and low-speed operating points.

4.1. Initial Power System Design Study

In order to gauge the basic behavior of key design properties of the investigated hybrid power system concept, a variation of the design power split PSdes between the FC based and the GT based branches of the overall power train (cf. Equation (16)) is studied in this section. The study is conducted at typical cruise conditions, with the components of the two parallel branches of the power system and the water treatment process sized for a range of PSdes between 0 (all GT powered) and 0.7 (70% FC, 30% GT powered), assuming a constant Pco,eff of 10 MW for the overall system. All water recovered from the fuel cell exit is immediately applied to the GT cycle, i.e., no intermediate water storage is considered. For the study, an advanced FC system operating at 80 °C and 2 bar is assumed featuring a specific power of 2 kW/kg at a constant efficiency of 60% in cruise. The FC system efficiency includes a constant efficiency factor for auxiliary electric power customers assumed to be 0.9 in the first instance, meaning 10% of the stack electric power output would be absorbed by the balance of plant. The water treatment process is sized for a 95% recovery of FC product water. Electric power train and propulsive device settings refer to Section 3.2.5 and Section 3.2.6, respectively. The primary figures of merit targeted in the study include the power system total effective core efficiency ηco,eff and the overall mass of the power system plus propulsive devices. The results obtained from the study are presented in Figure 9, including an annotation of key relevant settings.
Inspection of the effective core efficiency trends displayed in Figure 9 reveals how the effective core efficiency of the overall power system results from the power split-based superimposition of the efficiency trending behaviors of its two parallel branches. While the ηco,eff,FC appears constant against PSdes, ηco,eff,GT is strongly affected by both the increasing water-air-ratio and reducing size as effective core excess power is incrementally shifted over to the FC branch via the PSdes descriptor. Given the decreasing positive gradient of f η , c o , e f f , W A R as WAR incrementally rises (cf. Equation (33)) and the simultaneously increasing negative gradient of η c o , e f f , r e f as P c o , e f f , G T diminishes (cf. Equation (32)), a maximum of η c o , e f f , G T is formed at PSdes = 0.45. In consequence, an optimum of the complete power system effective core efficiency ηco,eff is obtained in the middle ground between ηco,eff,GT and ηco,eff,FC. In the studied case with ηco,eff,FC exceeding the maximum value of η c o , e f f , G T , ηco,eff for the complete power system occurs at a larger design power split than for the GT branch alone, i.e., PSdes = 0.56.
Figure 9 also shows the trending behaviour of the overall propulsion system normalized mass stack-up as PSdes is varied. Starting from the pure turbofan baseline arrangement at PSdes = 0, the GT masses reduce constantly as PSdes increases. The simultaneously rising masses of the FC power train and water treatment process components, however, lead to a monotonic increase of the overall propulsion system mass. The linear behavior of the GT, FC and the electrically powered propulsor (propulsive device including electric drive motor and PMAD system) results from the constant specific power assumptions for the individual components. The study behaviour of the HEX component masses is mainly driven by linear scaling effects of the involved HEX fluid mass flows, such as the linear increase in FC product water mass flow as PSdes is raised. A synopsis of relevant design performance and mass data for the key design cases of the study is provided in Table 3.
Table 3 shows that for the η c o , e f f optimum design at PSdes = 0.56, the total mass of the overall propulsion system is increased by 49% over the baseline design purely featuring turbofan engines. The corresponding relative improvement η c o , e f f amounts to 11% with a WAR in the GT cycle of 13.3%. The water treatment in this case is sized for an FC product water mass flow of approximately 0.7 kg/s, yielding a share of 19% of the overall propulsion system mass. The pumping power required for the pressurisation of the water mass flow is only 0.17% of the electric power output of the FC stack. It can be seen that the heat transfer required for the water condensation Q ˙ H E X , C o n d clearly exceeds the heat transfer during steam production Q ˙ H E X , V a p .
The ratio between the heat produced by the FC stack Q ˙ S t a c k , p r o d and its residual waste heat to be removed by the thermal management system Q ˙ F C , c o o l indicates that in the study case, approximately 20% of Q ˙ S t a c k , p r o d is rejected from the FC through the net balance of its reactants and product enthalpy flows · H ˙ F C .

4.2. Initial Aircraft-Integrated Assessment

In order to obtain an initial aircraft-integrated fuel burn assessment of the FC–GT hybrid power system concept, the previously presented propulsion system study is transferred to the vehicular level. As a relevant and convenient technology application case, a generic LH2-fuelled short-/medium-range transport task is selected featuring a design payload capacity of 180 passengers on a 3000 nmi stage length. Key characteristics of the corresponding advanced baseline aircraft are listed in Table 4 below.
The baseline aircraft characterised in Table 4 is powered by turbofan-type GT engines without hybridization. The efficiency properties given in the table, namely Lift/Drag, TSFC and propulsion system efficiency figures, refer to typical (mid-)cruise conditions. The additional structural and systems masses intrinsic to the use of LH2 as the onboard fuel are reflected in the OEW which is considerably higher than for a kerosene fueled aircraft with similar MTOW. The effective MTOW mass shares for the baseline aircraft’s airframe structure and for its systems and equipment are 30% and 15%, respectively. The baseline aircraft’s increased fuselage size and corresponding drag characteristics due to the internal LH2 fuel storage are additionally reflected in the aircraft’s aerodynamic efficiency, which might otherwise be interpreted as relatively low for a highly advanced short-/medium-range aircraft.
Similarly to the power system level study, the design power split parameter PSdes in cruise is investigated as part of the aircraft integrated sizing study targeting design mission block fuel as the central figure of merit. In order to ensure first order consistency against the investigated aircraft design variations, a number of basic aircraft scaling laws are followed throughout the study: The aircraft lifting surfaces are scaled at a constant maximum loading. Correspondingly, the maximum loading of the wing, i.e., aircraft MTOW per wing reference area Sref,Wing, is retained at a constant of 650 kg/m2 in order to ensure appropriate low-speed aerodynamic performance. Propulsion system scaling is performed based on the Pco,eff design requirement obtained from the aircraft during cruise. Identical design specific thrust settings are adopted for all aircraft designs. The scaling implications of the onboard LH2 infrastructure refer to the description provided in Section 3.4.
Together with the PSdes parameter, the study includes sensitivities for key FC system design and performance figures, namely FC system efficiency ηFCS,cr and specific power SPFCS,cr in cruise. For the study, again, a low temperature FC type is assumed, operating at a temperature of 80°C and pressure of 2 bar. An FC product water recovery of 90% in the condenser is assumed. The results of the aircraft-integrated sizing study in terms of design mission block fuel are summarised in Figure 10, where Figure 10a shows the ηFCS,cr and Figure 10b displays the sensitivity with regard to SPFCS,cr.
As expected, the block fuel saving potential of the FC–GT hybrid propulsion concept increases with both, improving FC system efficiency and FC system specific power (cf. Figure 10). Design fuel savings may generally be expected when ηFCS,cr and SPFCS,cr lie above 60% and 1500 W/kg, respectively. Above these values, improving FC efficiency and specific power continuously enhances the potential for fuel burn reduction while simultaneously shifting the fuel-optimum design cruise power splits to higher values. It should be noted, however, that the lever for further improvement through additional enhancement of SPFCS,cr progressively diminishes as the FC system mass share of the aircraft gross weight declines. Further improvements in FC system efficiency, in contrast, may open the potential for significant further fuel savings. For a selected representative scenario of ηFCS,cr and SPFCS,cr from the performed study, a more detailed view is presented in Figure 11 below.
Beside the characteristic design block fuel trend versus design cruise power split, Figure 11 also displays the associated nonlinear increase in GT water-to-air ratio as design power is shifted more and more to the FC branch of the overall power system. In the region of low block fuel designs, GT WAR notably ranges from 5% to 10%. The corresponding implications can be exemplified for the fuel optimum design at PSdes,cr ≈ 0.42 as highlighted in Table 5.
As can be seen from the table above, the selected fuel optimum aircraft design from Figure 11 features a ηco,eff improvement of 12.8% at an increase of the overall propulsion system mass of 35% compared to the non-hybrid baseline aircraft design. The aerodynamic drag penalty calculated for the propulsion system heat rejection expressed in terms of the aircraft zero-drag coefficient c D 0 yields approximately 2.3%. In summary, a design block reduction of 6.2% is obtained. Together with the GT fuel flow reduction of 44.1% at the given PSdes,cr the WAR in the GT engines of approximately 5.7% leads to a calculated NOx emission reduction of approximately 61%.

4.3. Introduction of Lab-Scale Fuel Cell Technology

In an important final step of the initial assessment of the investigated FC–GT hybrid propulsion concept, the generic assumptions regarding FC design characteristics from the previous studies are replaced by lab-scale experimental data of pre-selected low- and high-temperature FC technology concepts taken from the technology survey presented in Section 2.2 (corresponding assumptions in Appendix A). Therefore, suitable cruise operating points are selected from the performance curves of the PEMFC and SOFC stacks characterised in Section 3.3 (cf. Figure 8). In the first instance, cruise operation of both the stack technologies is considered to be at 40% of maximum loading, thereby ensuring adequate power reserves for high-power low-speed operations such as take-off and go-around (cf. [78]). Nevertheless, it should be noted that the present study is a purely stationary consideration, i.e., no transient implications are taken into account in the first instance. In order to meet rapid transient response time requirements, the SOFC-based hybrid power system would be expected to necessitate, for example, an additional high specific power battery and/or enhanced operational characteristics of the involved GT engines.
The cruise operating points deliver both the design specific powers and the efficiencies of PEMFC and SOFC stacks. The balance of plant efficiency factors f η , B o P , T M S for both FC system cases are predicted as described in Section 3.2.1. The FC system masses are calculated from the stack specific powers at cruise conditions (cf. Figure 8) using the additive mass factors for the balance of plant items provided in Table 2. A summary of the resulting FC cruise efficiency and specific power metrics at stack and system level is provided in Table 6 below.
The SOFC technology case in the table above features a higher system efficiency η F C S than the PEMFC concept. This is rooted in both, a higher stack efficiency and lower losses associated with the balance of plant systems, as the air supply compressor is driven by an exhaust turbine. With regard to the calculated stack specific powers P/WStack the PEMFC case shows clear advantages over the SOFC. The significant masses added by the balance of plant, especially by the thermal management system, however, diminish this advantage of the low temperature technology case, when benchmarking the specific powers at FC system level P/WFCS. The resulting aircraft design block fuel trends of both FC technology cases is plotted versus the PSdes,cr parameter in Figure 12.
While hybridization based on the selected PEMFC technology case does not lead to a design fuel reduction, Figure 12 displays a clear opportunity for fuel savings for the studied SOFC case. This is primarily due to the higher system efficiency, but also due to the slightly lower masses at FC system level and for the HEXs within the water treatment process. As a result of this, a full FC product water recovery is numerically achieved in contrast to a best and balanced 90% recovery in the PEMFC case. A brief characterization of the optimum fuel design for the SOFC technology case is given in Table 7.
Minimum design block fuel for the SOFC case is obtained at PSdes,cr ≈ 0.43, equivalent to an improvement of approximately 7.1% over the turbofan powered baseline aircraft. The corresponding cruise NOx emission benefit of the optimum hybrid design is calculated to approximately 62%.

4.4. Discussion of Advanced Integration Options

The initial concept assessment studies presented earlier in this section were performed for a most simplistic implementation option for the proposed FC–GT hybrid power system. However, a number of more advanced conceptual implementation options are very well conceivable that could feature an even more synergistic integration of technologies at the aircraft level. A few important aspects with regard to advanced technology integration opportunities based on the studied hybrid power system are briefly discussed here.
Depending on the effectively achievable design power split values for the hybrid power system, there are multiple potential onboard customers for the FC system electric power output. These include the electric subsystems of the aircraft as well as distributed propulsion systems and advanced aircraft annexed technologies such as wing tip propellers for vortex drag improvements, wing hybrid laminar flow control or the possibility of emission free ground operation.
The presence of an onboard cryogenic heat sink due to the LH2 fuel storage certainly is a key enabler for the consideration of superconducting technology as part of the fuel cell based electric power train. Beyond this, the inevitable boil-off from the LH2 storage might be an attractive source of power for independent ground operations. While a purely LH2-based fuel supply appears most attractive for the proposed hybrid propulsion concepts, a dual-fuel configuration is also conceivable with the FC operated on hydrogen while the GT engines remain fueled by a sustainable drop-in fuel.
The FC system itself could be strategically decentralized through distributed stacks and structurally embedded HEXs, thereby enhancing structural load alleviation of the dry wing design in case of LH2-fuelled aircraft and tapping the potential for efficient heat rejection through aircraft external surfaces without dedicated radiator devices [102,103].
From the investigation of lab-scale FC technologies, the benefits of high-temperature SOFC technology for the use in the presented hybrid have been clearly identified in this assessment focusing on specific power performance only. The key issue of SOFC operational limitations due to very slow transient responses is certainly alleviated through the combination with GT engines in a hybrid concept when compared to a fully SOFC based propulsion system. However, further work will be required to investigate the transient operational implications of FC–GT hybrid system designs with a special focus on SOFC technology options.
An intermediate storage capability for the liquefied FC product water will facilitate new opportunities for optimally tailored system performance characteristics within the entire flight envelope, and for minimized local NOx emissions.
The GT performance benefits obtainable from a given fuel product water mass flow depend on the engine size and the specific work capacity of the underlying cycle. For an increased specific work capacity of the baseline cycle, a predefined water mass flow translated to a higher water-to-air ratio in the cycle. Therefore, the hybrid combination of advanced FC technology with high specific work GT cycles, for example through topping cycles such as that realized in a Composite Cycle Engine [84,104,105] seems to be most beneficial. First steps towards the evaluation of hydrogen-fueled Composite Cycle Engine concepts are presented in [106].
A particularly synergistic technology configuration becomes obvious when combining the proposed LH2-fuelled FC–GT hybrid power system with fuselage boundary layer ingesting propulsion as implemented by the recently proven Propulsive Fuselage Concept [107].

5. Conclusions and Further Work

In the present paper, a FC–GT hybrid propulsion concept was introduced and initially assessed. The studied concept uses the by-product of one central system element, i.e., the water mass flow released by a hydrogen FC while producing electric power, in order to improve the efficiency and power output of another key system element, namely a GT engine enhanced by a steam-injected thermodynamic cycle. The FC product water is conditioned through a process of condensation, pressurization and re-vaporization prior to its GT injection. The water vaporization is performed using the waste heat in the GT core exhaust.
The concept assessment was performed for an LH2 fueled short-/medium range transport task featuring a design of 180 passengers on a 3000 nmi stage length. The assessment included design studies for the isolated propulsion system as well as at the integrated aircraft level. Therefore, appropriate methodology was formulated, and parametric modelling of all key components was performed. As a key power system parameter, the impact of the design power split ratio, i.e., the ratio between the power delivered by the FC branch and the total power delivery of the hybrid power system, was investigated.
At the power system level, an increasing design power split ratio at constant total power output has two main effects on the efficiency of the involved GT engines: (1) The FC product water mass flow increases proportionately with the increasing power output of the FC stack. Together with the simultaneously reducing size and power output target of the GT engines, the ratio of injected water mass flow to the GT air mass flow, i.e., the water-to-air-ratio, rises non-linearly and causes significant enhancements of the cycle efficiency. (2) The shrinking GT size diminishes the associated baseline efficiency. The resulting GT efficiency trending behavior against the design power split ratio, when superimposed with the more constant efficiency scaling behavior of the FC, forms a distinct efficiency optimum of the hybrid power system sized for a total power output of 10 MW. The pumping power required for the pressurization of the water mass flow is lower than 0.2% of the electric power output of the FC stack, and thus has only a minor impact on power system efficiency.
Despite monotonic increases in overall propulsion mass due to the components of the FC and water treatment process as design power split is shifted more to the FC branch, the optimal behavior of the power system efficiency basically translates also to the vehicular level. For the studied aircraft application case, design fuel savings were found as soon as the efficiency of the FC system in cruise reached 60% and higher at simultaneous cruise-specific powers of 1.5 kW/kg or above.
These findings were completed by the investigation of two distinct study cases based on selected lab-scale PEMFC and SOFC technology, which showed that a propulsion system hybridization using the selected PEMFC technology case does not lead to design fuel reductions for the air transport task considered. In contrast, the studied SOFC technology case displayed a clear opportunity for design fuel savings. This was primarily due to the higher system efficiency for the SOFC case in cruise when compared to the selected PEMFC concept. It should be noted, however, that no transient operation was considered, which represents one of the operational advantages of the PEFC.
Specifically, minimum design block fuel for the SOFC case was identified at a design power split ratio of approximately 43%, yielding an improvement of 7.1% over the turbofan powered baseline aircraft. The corresponding water-to-air ratio of approximately 6.1% in the GT cycle and the simultaneous design fuel flow reduction of 44% in the GT combustion chambers translated to a cruise NOx emission benefit of approximately 62%.
The conceptual design evaluation studies presented in this paper were performed for a most simplistic architectural implementation of the proposed hybrid propulsion concept, featuring two under-wing podded turbofan engines and an electric ducted fan driven by a central FC power train. Specific aircraft-level integration implications of a third propulsive device were not taken into account. All water recovered from the FC exit was immediately applied to the GT cycle, i.e., no intermediate water storage was considered. The system and component sizing was mainly based on representative cruise conditions without detailed consideration of key high-power and low-speed operating points. Therefore, further work needs to exhaustively analyse all relevant operating conditions within the design and sizing of the hybrid propulsion system concept. This particularly includes the consideration of the aircraft’s overall thermal household and abnormal operating modes, e.g., under partial system failure, as well as optimized operations featuring an intermediate storage of the liquefied FC product water, which will need to be explored and reflected in order to obtain best and balanced design solutions.
For a broader evaluation of the efficiency and emission-saving potentials associated with the presented concept, further studies should also include synergistically annexed technologies combined in consistent overall aircraft technology configurations. Therefore, the compatibility of the FC product water utilization in advanced high specific power heat engine cycles needs to be explored. Among various potential customers for the electric power produced by the FC branch of the hybrid power system, the fuselage boundary layer ingesting propulsor of a propulsive fuselage concept aircraft certainly represents a particularly attractive option.
To summarize, the performed initial assessment demonstrates the potential of future SOFC technology synergistically combined with GT engines for application in transport aircraft propulsion and power systems. Exploiting the synergies of the key components within the presented hybrid concept enables promising opportunities for relevant emission reductions and, consequently, a reduced climate impact of aviation.

Author Contributions

Conceptualization: A.S., M.N. and F.T.; Methodology: A.S., M.N. and K.E.; Validation: A.S., M.N. and K.E.; Formal analysis: A.S., M.N. and K.E.; Investigation: A.S. and M.N.; Data curation: A.S., M.N. and K.E.; Writing—original draft preparation: A.S., K.E., M.N. and F.T.; Writing—review and editing: A.S., K.E., M.N. and F.T.; Visualization: A.S., M.N. and K.E. All authors have read and agreed to the published version of the manuscript.

Funding

This research received no external funding.

Conflicts of Interest

The authors declare no conflict of interest.

Nomenclature

Abbreviation/AcronymDescription
ACAREAdvisory Council for Aviation Research and innovation in Europe
APSSAircraft Propulsion System Simulation
BHLBauhaus Luftfahrt
CEAChemical Equilibrium with Applications
CLCatalyst Layer
CO2Carbon Dioxide
EqEquation
FCFuel Cell
FCSFuel Cell System
FHVFuel Heating Value
GDLGas Diffusion Layer
GTGas Turbine
GTFGeared TurboFan
H2OWater
HEXHeat EXchanger
HORHydrogen Oxidation Reaction
HTHigh Temperature
IAPWSInternational Association for the Properties of Water and Steam
LH2Liquid Hydrogen
LHVLower Heating Value
LPTLow Pressure Turbine
LTOLanding and Take-Off
MTOWMaximum Take-Off Weight
NOxNitrogen Oxides
OCCOxygen Conducting Ceramic
OEWOperative Empty Weight
OPROverall Pressure Ratio
ORROxygen Reduction Reaction
PA-PBIPhosphoric Acid-Doped Benzimidazoles
PAXPassengers
PCCProton Conducting Ceramic
PCFCProton-Ceramic Fuel Cell
PEFCPolymer Electrolyte Fuel Cell
PEMFCProton-Exchange Membrane Fuel Cell
PFSAPerfluorosulfonic Acid
PMADPower Management and Distribution
PSPower Split
SOFCSolid Oxide Fuel Cell
SPSpecific Power
STIGSteam-Injected Gas Turbine
TMSThermal Management System
TRLTechnology Readiness Level
TSFCThrust Specific Fuel Consumption
WARWater-Air-Ratio
WETWater-Enhanced Turbofan
YSZYttria-Stabilized Zirconia
SymbolUnitDescription
c ¯ p J k g · K Representative specific heat capacity
F C m o l Faraday constant
fm-Mass scaling factor
ftech-Technology factor
fη-Efficiency factor
FHV J k g Fuel Heating Value
FL 100   f e e t Flight Level
FN N Streamtube Net Thrust
g m s 2 Gravity constant
H J Enthalpy
h J k g Specific enthalpy
ISA K International Standard Atmosphere
L/D-Aerodynamic Lift-to-Drag ratio
m k g Mass
m ˙ k g s Mass flow
M-Mach number
P W Power
Q ˙ J s Heat flux
s J k g · K Specific enthropy
TKTemperature
U V Voltage
V m s Velocity
x-Water steam fraction
η-Efficiency
γ -Isentropic exponent
ρ k g m 3 Density
Indices/Subscripts
31Gas turbine thermodynamic station at burner inlet
5Gas turbine thermodynamic station at low pressure turbine exit
ambAmbient conditions
auxAuxiliary
baseBaseline
BoPBalance of Plant
bpBypass
cCold
coCore
CompCompressor
CondCondenser
crCruise
desDesign
effEffective
elElectric
eMotElectric Motor
Fan,oOuter fan
hHot
isIsentropic
inAt inlet
liquidIn liquid state
LPLow Pressure shaft system
LPTLow Pressure Turbine
mechMechanical
outAt outlet
ovOverall
prPropulsive
prodProduct
PumpPump system
refReference
resResidual
shtShaft
StackFC Stack
SteamWater in gaseous state
techTechnological Advanced
trTransmission
VapVapoPropulsion D1 & M33 D5riser

Appendix A. Explanatory Notes on Lab-Scale FC Technology

Appendix A.1. Assumptions on FC Specifications

In the following, the assumptions that have been taken to estimate the relevant FC specifications (most importantly the specific power of the stack) are described in detail. It should be pointed out that these numbers are merely indicative, as power performance is mostly only described per electrode area (W/cm2), while exact material densities/porosities and detailed device configurations are often left unclear. Furthermore, the performance characterization has been executed on lab-scale sized setups and the recorded power performance may not translate to large-scale systems. Nevertheless, in an attempt to evaluate their potential future power performance in the proposed hybrid propulsion system, we have given these estimations our best effort. Further, it should be noted that there are other considerations beyond power performance when employing an FC in an aircraft (e.g., durability, tolerance to vibration, etc.) which are, however, beyond the scope of this work, which focuses on power performance.

Appendix A.2. PEFC & HT-PEFC

As these two FC types’ components closely resemble one another, similar assumptions have been taken when it comes to the weight of the non-active layers: For the GDLs, an average thickness and density of the commercially available GDLs at Freudenberg [108] was used for calculation, while for the bipolar plates as major stack weight contributors two approaches were calculated. Both consider metallic bipolar plates using coated SUS304 as the main material, however, in the conservative approach 0.3 mm thickness is assumed, while in an aggressive approach the thickness is set to 0.1 mm, as shown, for example, in [109]. As an example of a high-performance laboratory-scale PEFC, a cell featuring a surface-tuned catalyst, as presented by Fichtner et al. [87], is used for calculation. For the HT-PEFCs, a cell operated at 120 °C [88] as well as an ion-pair polymer based approach operated at 240 °C [29] are considered. Furthermore, values of laboratory-scale prototypes of a commercial supplier are given as a reference in [91]. As additional hardware for, e.g., compression is needed in the stack in addition to the cell block, a 30% reduction of cell block specific power is assumed for stack-specific power.

Appendix A.3. PCFC

While there have been several reports of PCFC performance reaching power densities beyond 0.5 W/cm2, we will take [89] as a primary reference for this cell type, as, on the one hand, outstanding performance at low temperature is demonstrated and, on the other hand, materials are processed using a scalable method that would allow for large cell areas. The temperature dependence of the cell performance has also been investigated in detail. Furthermore, details of layer thicknesses and materials are specified, enabling estimations of the cell specific power density. To do so, the peak electrode power density is divided by the bulk material weight (calculated from the layer thicknesses specified and corresponding bulk material densities). The weight-share of non-active components (sealing, interconnects) is factored in (a) a conservative estimation by using the values provided by [73], where the interconnects are responsible for ca. 66% of the total stack weight, while sealing and insulation amounts to ca 6%, or (b) an aggressive estimation considering ultrathin 0.1 mm stainless steel for forming the interconnects instead [110].

Appendix A.4. SOFC

For SOFC performance, several options are considered: the first one is a planar design operated at 0.785 V and 750 °C within a pressure vessel made from a composite material for which the relevant parameters are all specified in the publication [73]. To calculate the stack specific power or the microtubular design as presented by [21], the following assumptions are taken: (1) extensive sealings are not needed due to the intrinsic tight tubular design, (2) the void space due to the tubes is ca. 50% as estimated from the SEM images provided, (3) interconnects are assumed to be ceramic and to make up ca. 20% of the total mass. Lastly, an anode supported SOFC published by Udomsilp et al. [23]. As details on layer thickness and materials were specified in the latter publication and in [111], the specific power density could again be estimated in an a) conservative or b) aggressive manner as described above.

Appendix A.5. Summary of Lab-Scale FC Performance Characteristics

Table A1. Summary of the performance characteristics of lab-stage FC developments. Values in grey italic font have been calculated/estimated using the assumptions described above, while values in standard font have been taken directly from the cited publications.
Cell TypeEstimation TypeElectrode Power Density +Stack Specific Power *+xOperating PressureOperating TemperatureNotesRef.
W/cm2kW/kgBar°C--
PEFCconservative1.334.20 (6.01)x1.780H2/O2[87]
PEFCaggressive1.339.86 (14.09) x1.780H2/O2[87]
HT-PEFC-~0.73n.a.160 [91]
HT-PEFCconservative0.5121.55 (2.22) x1 (100 sscm H2, 200 sscm O2)120H2/O2[88]
HT-PEFCaggressive0.5122.77 (3.96) x1 (100 sscm H2, 200 sscm O2)120H2/O2[88]
HT-PEFCconservative0.912.58 (3.69) x1.47240H2/air[29]
HT-PEFCaggressive0.916.2 (8.86) x1.47240H2/air[29]
PCFCconservative0.5350.33n.a.500Planar[89]
PCFCconservative1.610.99n.a.650Planar[89]
PCFCaggressive0.5350.63n.a.500Planar[89]
PCFCaggressive1.611.90n.a.650Planar[89]
PCFCconservative0.5480.15n.a.500Planar[90]
PCFCconservative1.40.38n.a.650Planar[90]
PCFCaggressive0.5480.38n.a.500Planar[90]
PCFCaggressive1.40.97n.a.650Planar[90]
SOFC-n.a.1.88 (at 0.785 V)5.07750Planar, including pressure vessel[73]
SOFC-n.a.4.6 (at 0.785 V)5.07750Monolithic, incl. pressure vessel[73]
SOFC-n.a.2.5n.a.850Planar[24]
SOFC 1.272.7–4.7n.a.
(30 sscm)
800Micro-monolithic, allows fast startup[21]
SOFCconservative3.134.2n.a. (1000 sscm H2, 2000 sscm O2)800Anode supported[23]
SOFC
SOFC
conservative1.962.6n.a. (1000 sscm H2, 2000 sscm O2)650Anode supported[23]
aggressive3.135.4n.a. (1000 sscm H2, 2000 sscm O2)800Anode supported[23]
SOFCaggressive1.963.4n.a. (1000 sscm H2, 2000 sscm O2)650Anode supported[23]
+ peak power unless stated otherwise. * cell block components only. x for (HT-)PEFCs, additional hardware e.g., for compression is needed in the stack. This is estimated to result in a ca. 30% reduced stack specific power. The values in parenthesis refer to the corresponding specific power of the cell block.

References

  1. Penke, C.; Falter, C.; Batteiger, V. Pathways and environmental assessment for the introduction of renewable hydrogen into the aviation sector. In Progress in Life Cycle Assessment 2019; Springer: Cham, Switzerland, 2021. [Google Scholar]
  2. Sizmann, A.; Roth, A.; Batteiger, V. Renewable jet fuel: Upcoming technology options. In Proceedings of the 4th International Symposium of Bauhaus Luftfahrt, Taufkirchen near Munich, Munich, Germany, 8 May 2019. [Google Scholar]
  3. Lee, D.S.; Fahey, D.W.; Skowron, A.; Allen, M.R.; Burkhardt, U.; Chen, Q.; Doherty, S.J.; Freeman, S.; Forster, P.M.; Fuglestvedt, J.; et al. The contribution of global aviation to anthropogenic climate forcing for 2000 to 2018. Atmos. Environ. 2021, 244, 1–29. [Google Scholar] [CrossRef] [PubMed]
  4. Rao, A.G.; Yin, F.; Werij, H. Energy Transition in Aviation: The Role of Cryogenic Fuels. Aerospace 2020, 7, 181. [Google Scholar] [CrossRef]
  5. Hoelzen, J.; Silberhorn, D.; Zill, T.; Bensmann, B.; Hanke-Rauschenbach, R. Hydrogen-powered aviation and its reliance on green hydrogen infrastructure—Review and research gaps. Int. J. Hydrog. Energy 2021, 244. [Google Scholar] [CrossRef]
  6. Boeing Preliminary Design Department. An Exploratory Study to Determine the Integrated Technological Air Transportation System Ground Requirements if Liquid-Hydrogen-Fueled Subsonic, Long-Haul Civil Air Transports; NASA Contractor Report No. 2699; National Aeronautics and Space Administration: Washington, DC, USA, September 1976.
  7. Brewer, G.D. LH2 Airport Requirements Study; NASA Contractor Report No. 2700; NASA: Burbank, CA, USA, 1976; p. 91520.
  8. Brewer, G.D. Hydrogen Aircraft Technology, 1st ed.; CRC Press: Boca Raton, FL, USA, 1991; ISBN 0-8493-5838-8. [Google Scholar]
  9. Verstraete, D. The Potential of Liquid Hydrogen for Long Range Aircraft Propulsion. Ph.D. Thesis, Cranfield University, Cranfield, UK, 2009. [Google Scholar]
  10. Svensson, F. Potential of Reducing the Environmental Impact of Civil Subsonic Aviation by Using Liquid Hydrogen. Ph.D. Thesis, Cranfield University, Cranfield, UK, 2005. [Google Scholar]
  11. Sethi, B. Enabling Cryogenic Hydrogen-Based CO2-Free Air Transport. Hambg. Aerosp. Lect. Ser. 2021. [Google Scholar] [CrossRef]
  12. Kim, H.D.; Felder, J.L.; Tong, M.T.; Armstrong, M. Revolutionary Aeropropulsion Concept for Sustainable Aviation: Turboelectric Distributed Propulsion. In Proceedings of the 21th ISABE Conference, Busan, Korea, 9–13 September 2013. ISABE-2013-1719. [Google Scholar]
  13. Troeltsch, F.M.; Engelmann, M.; Scholz, A.E.; Peter, F.; Kaiser, J.; Hornung, M. Hydrogen Powered Long Haul Aircraft with Minimized Climate Impact. In Proceedings of the AIAA AVIATION 2020 FORUM, Virtual Event, 15–19 June 2020; American Institute of Aeronautics and Astronautics: Reston, VI, USA, 2020. ISBN 978-1-62410-598-2. [Google Scholar]
  14. The Engineer. FlyZero Concept Promises Carbon-Free Flights. 2021. Available online: https://www.theengineer.co.uk/concept-aircraft-ati-flyzero-liquid-hydrogen/ (accessed on 14 December 2021).
  15. Airbus. Airbus Reveals New Zero-Emission Concept Aircraft: Airbus Press Release. Available online: https://www.airbus.com/en/newsroom/press-releases/2020-09-airbus-reveals-new-zero-emission-concept-aircraft (accessed on 15 December 2021).
  16. Perry, D. DLR Prepares Do 228 for Fuel Cell Conversion Alongside MTU. Available online: https://www.flightglobal.com/aerospace/dlr-prepares-do-228-for-fuel-cell-conversion-alongside-mtu/146587.article (accessed on 15 December 2021).
  17. McKinsey & Company. Hydrogen-Powered Aviation: A Fact-Based Study of the Hydrogen Technology, Economics, and Climate Impact by 2050. 2020. Available online: https://www.fch.europa.eu/sites/default/files/FCH%20Docs/20200507_Hydrogen%20Powered%20Aviation%20report_FINAL%20web%20%28ID%208706035%29.pdf (accessed on 8 July 2020).
  18. Larminie, J.; Dicks, A. Fuel Cell Systems Explained; John Wiley & Sons, Ltd.: West Sussex, UK, 2003; ISBN 9781118878330. [Google Scholar]
  19. Hyzon Motors. Third Party Tests Confirm Hyzon Motors’ New Liquid-Cooled Fuel Cell Stack Leads the World in Power Density. Available online: https://hyzonmotors.com/third-party-tests-confirm-hyzon-motors-leads-fuel-cell-power-density/ (accessed on 8 July 2021).
  20. Boldrin, P.; Brandon, N.P. Progress and outlook for solid oxide fuel cells for transportation applications. Nat. Catal. 2019, 2, 571–577. [Google Scholar] [CrossRef] [Green Version]
  21. Li, T.; Heenan, T.M.M.; Rabuni, M.F.; Wang, B.; Farandos, N.M.; Kelsall, G.H.; Matras, D.; Tan, C.; Lu, X.; Jacques, S.D.M.; et al. Design of next-generation ceramic fuel cells and real-time characterization with synchrotron X-ray diffraction computed tomography. Nat. Commun. 2019, 10, 1497. [Google Scholar] [CrossRef]
  22. Wachsman, E.D.; Lee, K.T. Lowering the temperature of solid oxide fuel cells. Science 2011, 334, 935–939. [Google Scholar] [CrossRef]
  23. Udomsilp, D.; Rechberger, J.; Neubauer, R.; Bischof, C.; Thaler, F.; Schafbauer, W.; Menzler, N.H.; De Haart, L.G.J.; Nenning, A.; Opitz, A.K.; et al. Metal-Supported Solid Oxide Fuel Cells with Exceptionally High Power Density for Range Extender Systems. Cell Rep. Phys. Sci. 2020, 1, 100072. [Google Scholar] [CrossRef]
  24. NASA. High Power Density Solid Oxide Fuel Cell. Available online: https://technology.nasa.gov/patent/LEW-TOPS-120 (accessed on 15 March 2021).
  25. Gao, J.; Meng, Y.; Duffy, J.H.; Brinkman, K.S. Low Temperature Protonic Ceramic Fuel Cells through Interfacial Engineering of Nanocrystalline BaCe0.7Zr0.1Y0.1Yb0.1O3-δ (BCZYYb) Electrolytes. Adv. Energy Sustain. Res. 2021, 2, 2100098. [Google Scholar] [CrossRef]
  26. Hossain, S.; Abdalla, A.M.; Jamain, S.N.B.; Zaini, J.H.; Azad, A.K. A review on proton conducting electrolytes for clean energy and intermediate temperature-solid oxide fuel cells. Renew. Sustain. Energy Rev. 2017, 79, 750–764. [Google Scholar] [CrossRef]
  27. Le, L.Q.; Hernandez, C.H.; Rodriguez, M.H.; Zhu, L.; Duan, C.; Ding, H.; O’Hayre, R.P.; Sullivan, N.P. Proton-conducting ceramic fuel cells: Scale up and stack integration. J. Power Sources 2021, 482, 228868. [Google Scholar] [CrossRef]
  28. Haider, R.; Wen, Y.; Ma, Z.-F.; Wilkinson, D.P.; Zhang, L.; Yuan, X.; Song, S.; Zhang, J. High temperature proton exchange membrane fuel cells: Progress in advanced materials and key technologies. Chem. Soc. Rev. 2021, 50, 1138–1187. [Google Scholar] [CrossRef] [PubMed]
  29. Gittleman, C.S.; Jia, H.; De Castro, E.S.; Chisholm, C.R.I.; Kim, Y.S. Proton conductors for heavy-duty vehicle fuel cells. Joule 2021, 45, 57. [Google Scholar] [CrossRef]
  30. Fairey Aviation Co. Ltd. Improvements in or relating to power plants for jet propelled aircraft. British Patent GB 583341A, 19 October 1944. [Google Scholar]
  31. Wilcox, E.C.; Trout, A.M. Analysis of Thrust Augmentation of Turbojet Engines by Water Injection at Compressor Inlet Including Charts for Calculating Compression with Water Injection. NASA Report No. 1006. Available online: https://ntrs.nasa.gov/citations/19930092063 (accessed on 16 December 2021).
  32. Cheng, D.Y.; Nelson, A.L.C. The Chronological Development of the Cheng Cycle Steam Injected Gas Turbine During the Past 25 Years. In Proceedings of the Volume 2: ASME Turbo Expo 2002, Parts A and B: Power for Land, Sea, and Air, Amsterdam, The Netherlands, 3–6 June 2002; pp. 421–428, ISBN 0-7918-3607-X. [Google Scholar]
  33. Badeer, G.H. GE Aeroderivative Gas Turbines—Design and Operating Features; GE Power Systems: Evendale, OH, USA, 2000. [Google Scholar]
  34. Bahrami, S.; Ghaffari, A.; Genrup, M.; Thern, M. Performance Comparison between Steam Injected Gas Turbine and Combined Cycle during Frequency Drops. Energies 2015, 8, 7582–7592. [Google Scholar] [CrossRef] [Green Version]
  35. Cheng, D.Y. The Distinction Between the Cheng and STIG Cycles. In Proceedings of the ASME Turbo Expo 2006: Power for Land, Sea, and Air, Volume 4: Cycle Innovations; Electric Power; Industrial and Cogeneration; Manufacturing Materials and Metallurgy, Barcelona, Spain, 8–11 May 2006; pp. 101–116, ISBN 0-7918-4239-8. [Google Scholar]
  36. Daggett, D.L. Water Injection Feasibility for Boeing 747 Aircraft. NASA Contractor Report 2005-213656; 2005. Available online: https://ntrs.nasa.gov/citations/20060004124 (accessed on 16 December 2021).
  37. Roumeliotis, I.; Mathioudakis, K. Evaluation of water injection effect on compressor and engine performance and operability. Appl. Energy 2010, 87, 1207–1216. [Google Scholar] [CrossRef]
  38. Jonsson, M.; Yan, J. Humidified gas turbines—A review of proposed and implemented cycles. Energy 2005, 30, 1013–1078. [Google Scholar] [CrossRef]
  39. Daggett, D.L.; Hendricks, R.C. Water Misting and Injection of Commercial Aircraft Engines to Reduce Airport NOx. NASA Contractor Report 2004-212957; 2004. Available online: https://ntrs.nasa.gov/citations/20040035576 (accessed on 16 December 2021).
  40. Daggett, D.L.; Hendricks, R.C.; Fucke, L.; Eames, D.J.H. Water Injection on Commercial Aircraft to Reduce Airport Nitrogen Oxides; NASA Technical Memorandum 2010-213179; NASA: Cleveland, OH, USA, 2010. Available online: https://ntrs.nasa.gov/citations/20100015629 (accessed on 16 December 2021).
  41. Göke, S. Ultra Wet Combustion. Ph.D. Thesis, Technische Universität Berlin, Berlin, Germany, 2012. [Google Scholar]
  42. Göke, S.; Füri, M.; Bourque, G.; Bobusch, B.; Göckeler, K.; Krüger, O.; Schimek, S.; Terhaar, S.; Paschereit, C.O. Influence of steam dilution on the combustion of natural gas and hydrogen in premixed and rich-quench-lean combustors. Fuel Processing Technol. 2013, 107, 14–22. [Google Scholar] [CrossRef]
  43. Klingels, H. Reducing contrails during operation of aircraft. German Patent DE 10 2018 203 159 A1, 2 March 2018. [Google Scholar]
  44. Pouzolz, R.; Schmitz, O.; Klingels, H. Evaluation of the Climate Impact Reduction Potential of the Water-Enhanced Turbofan (WET) Concept. Aerospace 2021, 8, 59. [Google Scholar] [CrossRef]
  45. Schmitz, O.; Kaiser, S.; Klingels, H.; Kufner, P.; Obermüller, M.; Henke, M.; Zanger, J.; Grimm, F.; Schuldt, S.; Marcellan, A.; et al. Aero Engine Concepts Beyond 2030: Part 3—Experimental Demonstration of Technological Feasibility. J. Eng. Gas Turbines Power 2021, 143, 4678. [Google Scholar] [CrossRef]
  46. Schoenenborn, H.; Ebert, E.; Simon, B.; Storm, P. Thermomechanical Design of a Heat Exchanger for a Recuperative Aeroengine. J. Eng. Gas Turbines Power 2006, 128, 736–744. [Google Scholar] [CrossRef]
  47. Wilfert, G. CLEAN—Validation of a High Efficient Low NOx core, a High Speed Turbine and an Integration of a Recuperator in an Environmantal Friendly Engine Concept. Aeronautics Days. In Proceedings of the 41st AIAA/ASME/SAE/ASEE Joint Propulsion Conference & Exhibit, Vienna, Austria, 20 June 2006. [Google Scholar]
  48. Misirlis, D.; Vlahostergios, Z.; Flouros, M.; Salpingidou, C.; Donnerhack, S.; Goulas, A.; Yakinthos, K. Optimization of Heat Exchangers for Intercooled Recuperated Aero Engines. Aerospace 2017, 4, 14. [Google Scholar] [CrossRef] [Green Version]
  49. Vlahostergios, Z.; Misirlis, D.; Flouros, M.; Donnerhack, S.; Yakinthos, K. Efforts to improve aero engine performance through the optimal design of heat recuperation systems targeting fuel consumption and pollutant emissions reduction. In Proceedings of the 12th European Conference on Turbomachinery Fluid Dynamics and Thermodynamics, European Turbomachinery Society, Stockholm, Sweden, 3–7 April 2017. [Google Scholar]
  50. Grönstedt, T.; Xisto, C.; Sethi, V.; Rolt, A.; Roas, N.G.; Seitz, A.; Misirlis, D.; Whurr, J.; Tantot, N.; Dietz, M.; et al. Conceptual design of ultra-efficient cores for mid-century aircraft turbine engines. In Proceedings of the 24th ISABE Conference, Canberra, Australia, 22–27 September 2019. ISABE-2019-24335. [Google Scholar]
  51. Zhao, X.; Tokarev, M.; Adi Hartono, E.; Chernoray, V.; Grönstedt, T. Experimental Validation of the Aerodynamic Characteristics of an Aero-engine Intercooler. J. Eng. Gas Turbines Power 2017, 139, 11701. [Google Scholar] [CrossRef]
  52. NEWAC. NEWAC Publishable Final Activity Report; NEWAC-ART-DEL-FAR-R1.0; Grant agreement ID: 30876; NEWAC Consortium; European Commission Directorate-General for Research and Innovation: Brussels, Belgium, 8 September 2011; Available online: http://trimis.ec.europa.eu/sites/default/files/project/documents/20121029_130736_70767_Publishable_Final_Activity_Report.pdf (accessed on 16 December 2021).
  53. Evans, K. Thermal Management Technologies to Unlock Zero Emission Aviation. In Proceedings of the RAeS Alternative Propulsion Systems Conference, Virtual Event, 1–2 December 2021. [Google Scholar]
  54. Kellermann, H.; Lüdemann, M.; Pohl, M.; Hornung, M. Design and Optimization of Ram Air–Based Thermal Management Systems for Hybrid-Electric Aircraft. Aerospace 2021, 8, 3. [Google Scholar] [CrossRef]
  55. Kellermann, H.; Fuhrmann, S.; Hornung, M. Design of a Battery Cooling System for Hybrid Electric Aircraft. In Proceedings of the AIAA Aviation 2021 Forum, American Institute of Aeronautics and Astronautics, Virtual Event, 2–6 August 2021; ISBN 978-1-62410-610-1. [Google Scholar]
  56. Grönstedt, T. Opportunities for heat management in hydrogen fueled aircraft. In Proceedings of the UTIAS 7th International Workshop on Aviation and Climate Change, University of Toronto Institute for Aerospace Studies, Virtual Event, 20 May 2021. [Google Scholar]
  57. Xisto, C.; Abedi, H.; Jonsson, I.; Grönstedt, T. Integration of cryogenic hydrogen and propulsion system for commercial aviation. In Proceedings of the 9th EASN Conference on Innovation in Aviation and Space, Athens, Greece, 3–6 September 2019. [Google Scholar]
  58. Kays, W.M.; London, A.L. Compact Heat Exchangers, 3rd ed.; Krieger: Malabar, FL, USA, 1998; ISBN 9781575240602. [Google Scholar]
  59. Grieb, H. Projektierung von Turboflugtriebwerken; Birkhäuser Verlag: Berlin, Germany, 2004; ISBN 978-3-0348-7938-5. [Google Scholar]
  60. Fernandes, M.D.; De Andrade, S.P.; Bistritzki, V.N.; Fonseca, R.M.; Zacarias, L.G.; Gonçalves, H.N.C.; De Castro, A.F.; Domingues, R.Z.; Matencio, T. SOFC-APU systems for aircraft: A review. Int. J. Hydrog. Energy 2018, 43, 16311–16333. [Google Scholar] [CrossRef]
  61. Tornabene, R.; Wang, X.-y.; Steffen, C.J.; Freeh, J.E. Development of Parametric Mass and Volume Models for an Aerospace SOFC/Gas Turbine Hybrid System. 2005. Available online: https://ntrs.nasa.gov/search.jsp?R=2005020384 (accessed on 11 June 2019).
  62. Whyatt, G.A.; Chick, L.A. Electrical Generation for More-Electric Aircraft Using Solid Oxide Fuel Cells; PNNL-21382; Pacific Northwest National Lab. (PNNL): Richland, WA, USA, 2012.
  63. McLarty, D.; Brouwer, J.; Samuelsen, S. Fuel cell–gas turbine hybrid system design part II: Dynamics and control. J. Power Sources 2014, 254, 126–136. [Google Scholar] [CrossRef] [Green Version]
  64. Azizi, M.A.; Brouwer, J. Progress in solid oxide fuel cell-gas turbine hybrid power systems: System design and analysis, transient operation, controls and optimization. Appl. Energy 2018, 215, 237–289. [Google Scholar] [CrossRef]
  65. Azizi, M.A. Solid Oxide Fuel Cell-Gas Turbine Hybrid Power Systems: Energy Analysis, Control Assessments, Fluid Dynamics Analysis and Dynamic Modeling for Stationary and Transportation Applications. Ph.D. Thesis, University of California, Irvine, Irvine, CA, USA, 2018. [Google Scholar]
  66. Hayashi, M.; Saito, H. Explosion-proof equipment of fuel supply section. Japanese Patent JP 2001338660 A, 31 May 2000. [Google Scholar]
  67. Hoffjann, C.; Heinrich, H.-J. Process for the recovery and distribution of water generated on board an aircraft, land based vehicle and/or watercraft. European Patent EP 1354856 B1, 9 April 2003. [Google Scholar]
  68. Metzler, D. System for water reclamation from an exhaust gas flow of a fuel cell of an aircraft. US Patent US 20060029849 A1, 18 July 2005. [Google Scholar]
  69. Huber, J.M.; Lindstrom, J.D.; Daggett, D.L.; Friend, M.G. Solid oxide fuel cell as auxiliary power source installation in transport aircraft. US Patent US 6641084 B1, 4 November 2002. [Google Scholar]
  70. El Hacin Sennoun, M. Hybrid Propulsion System for a Gas Turbine Engine Including a Fuel Cell. US Patent US 10774741 B2, 15 September 2020. [Google Scholar]
  71. Nickl, M.; Seitz, A.; Troeltsch, F. Energieumwandlungsvorrichtung, Fahrzeug und Verfahren zum Betrieb einer Energieumwandlungsvorrichtung. German Patent Application DE 10 2020 107 905 A1, 23 March 2020. [Google Scholar]
  72. Summary of Key Messages Delivered at the Technical Workshop “Hydrogen-Powered Aviation Research and Innovation”, Clean Sky 2 Joint Undertaking (CS 2 JU) and Fuel Cells and Hydrogen 2 Joint Undertaking (FCH 2 JU), Brussels, Belgium, 6 May 2021. Available online: https://www.fch.europa.eu/sites/default/files/20210526_CA-CH_Workshop_key_messages.pdf (accessed on 16 December 2021).
  73. Collins, J.M.; McLarty, D. All-electric commercial aviation with solid oxide fuel cell-gas turbine-battery hybrids. Appl. Energy 2020, 265, 114787. [Google Scholar] [CrossRef]
  74. Yi, Y.; Rao, A.D.; Brouwer, J.; Samuelsen, G.S. Analysis and optimization of a solid oxide fuel cell and intercooled gas turbine (SOFC–ICGT) hybrid cycle. J. Power Sources 2004, 132, 77–85. [Google Scholar] [CrossRef] [Green Version]
  75. Freeh, J.E.; Pratt, J.W.; Brouwer, J. Development of a Solid-Oxide Fuel Cell/ Gas Turbine Hybrid System Model for Aerospace Applications. In Proceedings of the ASME Turbo Expo 2004 Power for Land, Sea, Air, American Society of Mechanical Engineers, Vienna, Austria, 14–17 July 2004. GT2004–53616. [Google Scholar]
  76. Jensen, S.H.; Graves, C.; Chen, M.; Hansen, J.B.; Sun, X. Characterization of a Planar Solid Oxide Cell Stack Operated at Elevated Pressure. J. Electrochem. Soc. 2016, 163, F1596–F1604. [Google Scholar] [CrossRef] [Green Version]
  77. Jensen, S.H.; Sun, X.; Ebbesen, S.D.; Chen, M. Pressurized Operation of a Planar Solid Oxide Cell Stack. Fuel Cells 2016, 16, 205–218. [Google Scholar] [CrossRef] [Green Version]
  78. Seitz, A.; Schmitz, O.; Isikveren, A.T.; Hornung, M. Electrically Powered Propulsion: Comparison and Contrast to Gas Turbines. In Proceedings of the 61. Deutscher Luft- und Raumfahrtkongress (DLRK), Deutsche Gesellschaft für Luft- und Raumfahrt. Berlin, Germany, 10–12 September 2012. [Google Scholar]
  79. Seitz, A.; Habermann, A.L.; Van Sluis, M. Optimality Considerations for Propulsive Fuselage Power Savings. Proc. Inst. Mech. Eng. Part. G J. Aerosp. Eng. 2021, 235, 22–39. [Google Scholar] [CrossRef] [Green Version]
  80. Gašparović, N. Das Zweistromtriebwerk bei optimaler und nicht-optimaler Auslegung. Ing.-Wes. 1976, 42, 157–168. [Google Scholar] [CrossRef]
  81. Trout, A.M.; Hall, E.W. Method for Determining Optimum Division of Power between Jet and Propeller for Maximum Thrust Power of a Turbine-Propeller Engine. NASA Technical Note No. 2178; 1950. Available online: https://ntrs.nasa.gov/citations/19930082829 (accessed on 16 December 2021).
  82. Gordon, S.; Mcbride, B.J. Computer Program for Calculation of Complex Chemical Equilibrium Compositions and Applications. Part 1: Analysis. NASA Reference Publication 1995-0013764; 1995. Available online: https://ntrs.nasa.gov/citations/19950013764 (accessed on 16 December 2021).
  83. Wagner, W.; Cooper, J.R.; Dittmann, A.; Kijima, J.; Kretzschmar, H.-J.; Kruse, A.; Mareš, R.; Oguchi, K.; Sato, H.; Stöcker, I.; et al. The IAPWS Industrial Formulation 1997 for the Thermodynamic Properties of Water and Steam. J. Eng. Gas. Turbines Power 2000, 122, 150–184. [Google Scholar] [CrossRef]
  84. Kaiser, S.; Seitz, A.; Donnerhack, S.; Lundbladh, A. Composite Cycle Engine Concept with Hectopressure Ratio. J. Propuls. Power 2016, 32, 1413–1421. [Google Scholar] [CrossRef]
  85. Bijewitz, J.; Seitz, A.; Hornung, M. Power Plant Pre-Design Exploration for a Turbo-Electric Propulsive Fuselage Concept. In Proceedings of the Joint Propulsion Conference, Cincinnati, OH, USA, 9–11 July 2018; ISBN 978-1-62410-570-8. [Google Scholar]
  86. Seitz, A.; Nickl, M.; Stroh, A.; Vratny, P.C. Conceptual study of a mechanically integrated parallel hybrid electric turbofan. Proc. Inst. Mech. Eng. Part. G J. Aerosp. Eng. 2018, 232, 2688–2712. [Google Scholar] [CrossRef]
  87. Fichtner, J.; Watzele, S.; Garlyyev, B.; Kluge, R.M.; Haimerl, F.; El-Sayed, H.A.; Li, W.-J.; Maillard, F.M.; Dubau, L.; Chattot, R.; et al. Tailoring the Oxygen Reduction Activity of Pt Nanoparticles through Surface Defects: A Simple Top-Down Approach. ACS Catal. 2020, 10, 3131–3142. [Google Scholar] [CrossRef]
  88. Luo, F.; Zhang, Q.; Yang, Z.; Guo, L.; Yu, X.; Qu, K.; Ling, Y.; Yang, J.; Cai, W. Fabrication of Stable and Well-connected Proton Path in Catalyst Layer for High Temperature Polymer Electrolyte Fuel Cells. ChemCatChem 2018, 10, 5314–5322. [Google Scholar] [CrossRef]
  89. An, H.; Lee, H.-W.; Kim, B.-K.; Son, J.-W.; Yoon, K.J.; Kim, H.; Shin, D.; Ji, H.-I.; Lee, J.-H. A 5 × 5 cm2 protonic ceramic fuel cell with a power density of 1.3 W cm–2 at 600 °C. Nat. Energy 2018, 3, 870–875. [Google Scholar] [CrossRef]
  90. Choi, S.; Kucharczyk, C.J.; Liang, Y.; Zhang, X.; Takeuchi, I.; Ji, H.-I.; Haile, S.M. Exceptional power density and stability at intermediate temperatures in protonic ceramic fuel cells. Nat. Energy 2018, 3, 202–210. [Google Scholar] [CrossRef] [Green Version]
  91. Hypoint. Technical White Paper. 2021. Available online: https://docsend.com/view/t9aw2mk (accessed on 15 December 2021).
  92. Seitz, A. Advanced Methods for Propulsion System Integration in Aircraft Conceptual Design. Ph.D. Thesis, Technische Universität München, Munich, Germany, 2012. [Google Scholar]
  93. Seitz, A.; Engelmann, M. D1.03—Multi-Disciplinary Evaluation of the Optimized Propulsive Fuselage Aircraft; Public Project Deliverable D1.03, Grant Agreement No. 723242; CENTRELINE Consortium; European Commission Directorate-General for Research and Innovation: Brussels, Belgium, 2020. [Google Scholar]
  94. Torenbeek, E. Synthesis of Subsonic Airplane Design: An Introduction to the Preliminary Design of Subsonic General Aviation and Transport Aircraft, with Emphasis on Layout, Aerodynamic Design, Propulsion and Performance; Springer: Dordrecht, The Netherlands, 1982; ISBN 9789048182732. [Google Scholar]
  95. McCormick, B.W. Aerodynamics, Aeronautics, and Flight Mechanics, 2nd ed.; Wiley: Hoboken, NJ, USA, 1995; ISBN 0471110876. [Google Scholar]
  96. Winnefeld, C.; Kadyk, T.; Bensmann, B.; Krewer, U.; Hanke-Rauschenbach, R. Modelling and Designing Cryogenic Hydrogen Tanks for Future Aircraft Applications. Energies 2018, 11, 105. [Google Scholar] [CrossRef] [Green Version]
  97. Arbeitskreis Masseanalyse (MA); Luftfahrttechnisches Handbuch; LTH-Koordinierungsstelle (IABG mbH): Ottobrunn, Germany, 2015.
  98. Raymer, D. Aircraft Design: A Conceptual Approach, 6th ed.; American Institute of Aeronautics and Astronautics, Inc.: Washington, DC, USA, 2018; ISBN 978-1-62410-490-9. [Google Scholar]
  99. Roskam, J. Airplain Design Part. I: Preliminary Sizing of Airplanes, 4th ed.; DARcorporation: Lawrence, KS, USA, 1997; ISBN 9781884885426. [Google Scholar]
  100. Howe, D. Aircraft Conceptual Design Synthesis; Professional Engineering Publishing: London, UK, 2010; ISBN 1860583016. [Google Scholar]
  101. Pratt, J.W.; Klebanoff, L.E.; Munoz-Ramos, K.; Akhil, A.A.; Curgus, D.B.; Schenkman, B.L. Proton exchange membrane fuel cells for electrical power generation on-board commercial airplanes. Appl. Energy 2013, 101, 776–796. [Google Scholar] [CrossRef] [Green Version]
  102. Kellermann, H.; Habermann, A.L.; Vratny, P.C.; Hornung, M. Assessment of fuel as alternative heat sink for future aircraft. Appl. Therm. Eng. 2020, 170, 114985. [Google Scholar] [CrossRef]
  103. Kellermann, H.; Habermann, A.L.; Hornung, M. Assessment of Aircraft Surface Heat Exchanger Potential. Aerospace 2020, 7, 1. [Google Scholar] [CrossRef] [Green Version]
  104. Kaiser, S.; Kellermann, H.; Nickl, M.; Seitz, A. A Composite Cycle Engine Concept for Year 2050. In Proceedings of the 31st Congress of the International Council of the Aeronautical Sciences, Belo Horizonte, MG, Brazil, 9–14 September 2018; ISBN 9783932182884. [Google Scholar]
  105. Kaiser, S. Multidisciplinary Design of Aeronautical Composite Cycle Engines. Ph.D. Thesis, Technische Universität München, Munich, Germany, 2020. [Google Scholar]
  106. Nickl, M.; Winter, F.; Gümmer, V. Piston Engine Modelling for Hydrogen Fueled Composite Cycle Engines. IOP Conf. Ser. Mater. Sci. Eng. 2022. accepted for publication. [Google Scholar]
  107. Seitz, A.; Habermann, A.; Peter, F.; Troeltsch, F.; Castillo Pardo, A.; Della Corte, B.; Van Sluis, M.; Goraj, S.; Kowalski, M.; Zhao, X.; et al. Proof of Concept Study for Fuselage Boundary Layer Ingesting Propulsion. Aerosp. J. 2020, 10, 16. [Google Scholar] [CrossRef]
  108. Freudenberg. Fuel Cell Components/Gas Diffusion Layers. Available online: https://fuelcellcomponents.freudenberg-pm.com/Products/gas-diffusion-layers (accessed on 8 April 2021).
  109. Song, Y.; Zhang, C.; Ling, C.-Y.; Han, M.; Yong, R.-Y.; Sun, D.; Chen, J. Review on current research of materials, fabrication and application for bipolar plate in proton exchange membrane fuel cell. Int. J. Hydrog. Energy 2020, 45, 29832–29847. [Google Scholar] [CrossRef]
  110. fuelcellmaterials. Available online: https://fuelcellmaterials.com/ (accessed on 16 July 2021).
  111. Haydn, M.; Ortner, K.; Franco, T.; Uhlenbruck, S.; Menzler, N.H.; Stöver, D.; Bräuer, G.; Venskutonis, A.; Sigl, L.S.; Buchkremer, H.-P.; et al. Multi-layer thin-film electrolytes for metal supported solid oxide fuel cells. Mater. Today 2014, 256, 52–60. [Google Scholar] [CrossRef]
Figure 1. Basic functional schematic of studied FC–GT hybrid propulsion concept.
Aerospace 09 00068 g001
Figure 2. Schematic representation of the FC types considered herein in order of increasing operating temperature: (a) PEFC, (b) HT-PEFC, (c) PCFC, (d) SOFC.
Aerospace 09 00068 g002
Figure 3. Product water mass flow obtainable from hydrogen FC.
Aerospace 09 00068 g003
Figure 4. Schematic representation of FC stack including surrounding auxiliary control volume for thermal balance mapping.
Aerospace 09 00068 g004
Figure 5. Temperature-entropy diagram for water with annotation of the water treatment processes for typical PEMFC and SOFC options.
Aerospace 09 00068 g005
Figure 6. Impact of steam injection in GT combustion chamber on (a) the specific heat capacity of turbine working fluid and (b) the compressor mass flow rate.
Aerospace 09 00068 g006
Figure 7. Semi-empirical derivation of heuristic correlation for GT effective core efficiency improvement versus water-to-air ratio due to burner steam injection.
Aerospace 09 00068 g007
Figure 8. Performance characteristics of selected lab-scale PEMFC and SOFC technology concepts, calculated based on the assumptions specified in Appendix A.2, Appendix A.3 and Appendix A.4.
Aerospace 09 00068 g008
Figure 9. Effective core efficiency and propulsion system mass breakdown results of initial power system design study.
Aerospace 09 00068 g009
Figure 10. Design block fuel results of initial aircraft-integrated sizing study: (a) sensitivity to FC system efficiency, (b) sensitivity to FC system specific power.
Aerospace 09 00068 g010
Figure 11. Design block fuel and GT water-to-air ratio trends for selected aircraft design study scenario.
Aerospace 09 00068 g011
Figure 12. Aircraft design block fuel trends for selected PEMFC and SOFC technology cases versus design cruise power split.
Aerospace 09 00068 g012
Table 1. Summary of key assumptions taken for the initial estimation of HEX properties within the water treatment process.
HEXPropertyValue
CondenserPressure Ratio (cold side)0.95
Pressure Ratio (hot side)0.96
Pinch Point Temperature Distance40 K
VaporizerPressure Ratio (cold side)0.9 *
Pressure Ratio (hot side)f(WAR)
Superheating LimitationT5 − 50K
* compensated by water pump with very low effort due to incompressibility.
Table 2. Synopsis of FC system balance of plant additive mass factors PEMFC and SOFC technology cases.
Additive Mass Factors Relative to StackPEFCSOFC
Thermal management ( f m , B o P , T M S )1.61 *0.39
Air compression system ( f m , B o P , A i r c o m p )0.120.11
Other ( f m , B o P , R e s )0.16 *0.21 **
* Based on HyPoint “Technical White Paper” [91]. ** Based on Tornabene et al. [61].
Table 3. Summary of power system performance and mass properties for selected design cases.
PropertyUnitPSdes = 0PSdes = 0.45 1PSdes = 0.56 2
η c o , e f f [-]0.5150.5690.571
η c o , e f f , G T [-]0.5150.5540.550
η c o , e f f , F C [-]0.5880.5880.588
η S t a c k [-]0.6670.6670.667
P S t a c k , e l [kW]051006300
Q ˙ S t a c k , p r o d [kW]025503150
Q ˙ F C , c o o l [kW]020422522
P s h t , e M o t [kW]044995557
m ˙ S t a c k , H 2 O [kg/s]0.0000.5690.703
Q ˙ C o n d [kW]018842327
η H E X . C o n d [-]0.5810.5810.581
P P u m p [kW]0.08.510.5
Q ˙ V a p (both engines)[kW]010931270
η H E X , V a p [-]0.8710.8820.889
P c o , e f f , G T (per engine)[MW]5.0002.7512.221
m ˙ S t e a m [kg/s]0.0000.5400.668
W A R [%]0.08.013.3
f η , c o , e f f , W A R [-]1.0001.2571.338
η c o , e f f , r e f [-]0.5150.4410.411
GT mass 3 (both engines)[kg]586332282607
Electric propulsor mass[kg]013301643
FC system mass[kg]022952835
Condenser mass[kg]0529654
Water transmission system mass[kg]0208257
Vaporiser mass (both engines)[kg]0650716
Overall propulsion system mass[kg]586382408711
1 ηco,eff,GT = maximum; 2 ηco,eff = maximum; 3 including propulsive devices.
Table 4. Key characteristics of baseline aircraft for aircraft-integrated concept assessment studies.
PropertyValue
Design Range3000 nmi
Fuel TypeLH2
Cruise ConditionISA, M0.78, FL350
Lift/Drag18.0
Fuel Heating Value120.9 MJ/kg (LHV)
TSFC *4.83 g/kN/s
ηco,eff53%
ηpd,eff75%
OEW49,000 kg
Payload18,000 kg
Design Loaded Fuel6300 kg
MTOW73,300 kg
MTOW/Sref,Wing650 kg/m2
* Corresponds to 13.5 g/kN/s based on FHV 43 MJ/kg.
Table 5. Summary of key characteristics for block optimum aircraft from Figure 11.
PropertyValue [%]
Design cruise power split PSdes,cr41.5
GT WAR5.72
Change in ηco,eff *12.8
Change in aircraft c D 0 due to system waste heat rejection *2.26
Change in propulsion system mass *35.0
Change in aircraft OEW *6.40
Change in aircraft MTOW *3.78
Change in design block fuel *−6.18
Change in GT fuel flow *−44.1
Change in NOx emissions *−61.2
* relative to baseline aircraft (PSdes,cr = 0).
Table 6. Cruise efficiency and specific power characteristics calculated for selected PEMFC and SOFC technology cases.
FC Cruise PropertyUnitPEMFC CaseSOFC Case
η S t a c k [-]0.58 *0.74 *
f η , B o P , T M S [-]0.770.97
η F C S [-]0.450.72
P / W S t a c k [kW/kg]3.94 *2.16 *
P / W F C S [kW/kg]1.031.26
* at 40% peak power, based on Figure 8.
Table 7. Summary of key characteristics of block fuel optimum aircraft design based on selected SOFC technology case.
PropertyValue [%]
Design cruise power split PSdes,cr42.8
GT WAR6.11
Change in ηco,eff *18.3
Change in GT fuel flow *−44.4
Change in propulsion system mass *64.9
Change in aircraft MTOW *8.70
Change in design block fuel *−7.07
Change in NOx emissions *−62.4
* relative to baseline aircraft (PSdes,cr = 0).
Publisher’s Note: MDPI stays neutral with regard to jurisdictional claims in published maps and institutional affiliations.

