Article

Sensitivity Analysis of Geometrical Parameters to the Flow of Pre-swirl System after Turbine Blade Fracture

1
School of Energy and Power Engineering, Beihang University, Beijing 100191, China
2
Research Institute of Aero-Engine, Beihang University, Beijing 100191, China
*
Author to whom correspondence should be addressed.
Aerospace 2022, 9(12), 783; https://doi.org/10.3390/aerospace9120783
Submission received: 10 October 2022 / Revised: 13 November 2022 / Accepted: 25 November 2022 / Published: 1 December 2022
(This article belongs to the Special Issue Aerodynamics Design)

Abstract

:
The pre-swirl stator-rotor system is a common and important structure in gas turbines, and its main function is to provide cold air to the turbine blades with a low relative total temperature. Under normal conditions, the boundaries of the system are symmetrical and there is sufficient margin for each blade. However, a fracture of turbine blades can upset this balance, resulting in potentially different cold-air conditions for each blade. Therefore, to ensure the safety of the other blades after a single-blade break, it is necessary to know the cold-air distribution law of the system after a blade fracture. In this paper, the effects of geometric parameters (including pre-swirl angle, α; the area ratio of nozzles and holes, ξ; gap ratio, G; and radius ratio of nozzle and hole, δ) of a pre-swirl stator-rotor system on the mass-flow-rate ratio, η; total-pressure-loss coefficient, Cp; discharge coefficient of holes, Cd; and adiabatic effectiveness, Θad, are investigated by numerical simulation with a single blade fractured. The results show that most of the geometric parameter changes do not increase ηhole_0. Moreover, measures to increase the influence of pre-swirl nozzles can reduce the influence of blade fracture on mass flow distribution, such as larger α, smaller ξ, and smaller δ. As for Cp, Cd, and Θad, they are more sensitive to changes in α and ξ. For the pre-swirl system, to avoid more serious safety problems caused by individual blade fracture, the designer should make every effort to reduce the unevenness of the cold-air distribution. Increasing the effect of the nozzle could serve the aim, but it may increase the volatility of the flow. The pre-swirl nozzle of the leaf grille type is a good option to address flow fluctuations.

1. Introduction

Pre-swirl systems are generally used in the internal air systems of gas turbines, such as the direct-transfer pre-swirl supply system that supplies cold air to turbine blades. Its function is to reduce the relative total temperature of the cold air and improve the turbine cooling efficiency. Therefore, it plays a crucial role in turbine cooling.
In terms of pre-swirl system design, many recommendations are given in the papers. Lee et al. [1] investigated the influence of edge shape, inclined angle, area ratio, and the number of receiver holes on the discharge coefficient, adiabatic effectiveness, and pressure drop. Their study showed that the pre-swirl system performance increased as the area ratio increased, and under the fixed area ratio, a large number of small-diameter receiver holes showed better performance. The receiver hole edge fillet was the most influential shape parameter in pre-swirl performance. Zhang et al. [2,3,4] conducted investigations on the flow and heat-transfer characteristics in a radial pre-swirl system with different fillet radiuses, pre-swirl-nozzle angles, and length-to-diameter ratios of nozzles. Zhao et al. [5] also investigated the effect of the pre-swirl angle of the nozzles on an axial pre-swirl system. Paper [6,7,8,9] studied the effect of the radial position of the pre-swirl nozzle on the pre-swirl cooling system, which suggested that a high-radius ratio of pre-swirl nozzle to receiver hole is a benefit to the discharge coefficient and adiabatic effectiveness.
Under normal conditions, the back pressure at the outlet of the pre-swirl system is the same. The cold air from the compressor enters the stator-rotor system through the nozzle, and most of them enter the turbine blades through the receiver hole to control the blade temperature, except for a small portion for sealing. However, when blades fracture in actual work, the channel inside the broken blades is exposed to the low-pressure mainstream, which results in discrepant pressure at the outlet of the receiver holes. Because of the discrepant pressure, a large volume of cold air will rush to the broken blades, reducing the cold air acquired by the normal blades, assuming that the total volume of cold air is constant. A normal blade may potentially fail, due to over-limiting the thermal stress, because the amount of cold air obtained by the normal blade is less than needed. The distribution of cold air will become increasingly uneven as it continues to develop, and may cause a cascade of blades to break. In addition, the probability of blade fracture is around 10−5 times per flight hour [10,11,12], which is above the probability of hazardous occurrences [13] required by FAA AC 33.75. Therefore, the influence of blade fracture on gas turbines must be demonstrated.
Some studies have been conducted for flow with asymmetric boundary conditions. Bein et al. [14,15] explored a lubricating-oil sealing problem in a narrow rotor-stator cavity. At the outlet of the cavity, there is a high-pressure zone and a low-pressure zone, and at a certain pressure lubricating oil is provided at the disk center. Another class of problems is the flow of magnetic fluids in a microchannel under electromagnetic force and pressure coupling [16]. The asymmetric boundary is caused by electromagnetic force. In addition, there is a class of Couette–Poiseuille flow under asymmetric boundaries [17]. The common feature of the above three types of flows is that viscous forces are not negligible and even dominant. However, for the pre-swirl stator-rotor system, the viscous force is not important and inertial force is not negligible in the rotating core. With this problem, Zhao et al. [18] studied the effect of asymmetric outlet boundaries on a simple stator-rotor system employing numerical simulation, but the effect of geometric parameters was neglected.
To fill the research gap in this topic, and also to provide some ideas and basis for the passive safety design of the pre-swirl system, this paper takes a direct-transfer pre-swirl supply system as the object to study the influence of the geometric parameters of the system on the flow dynamic after a single-blade fracture. In particular, the second part describes in detail the computational setup, including the boundary conditions, verification of the mesh and turbulence models, geometric model information, and definition of key parameters. The third part discussed in detail the effects of the geometric parameters (including the pre-swirl angle, α; area ratio of nozzles and holes, ξ; gap ratio, G; and radius ratio of nozzle and hole, δ) of a pre-swirl stator-rotor system on the mass-flow-rate ratio, η; total-pressure-loss coefficient, Cp; discharge coefficient of holes, Cd; and adiabatic effectiveness, Θad, of a pre-swirl system with a single blade fractured.

2. Computational Method

2.1. Computational Model

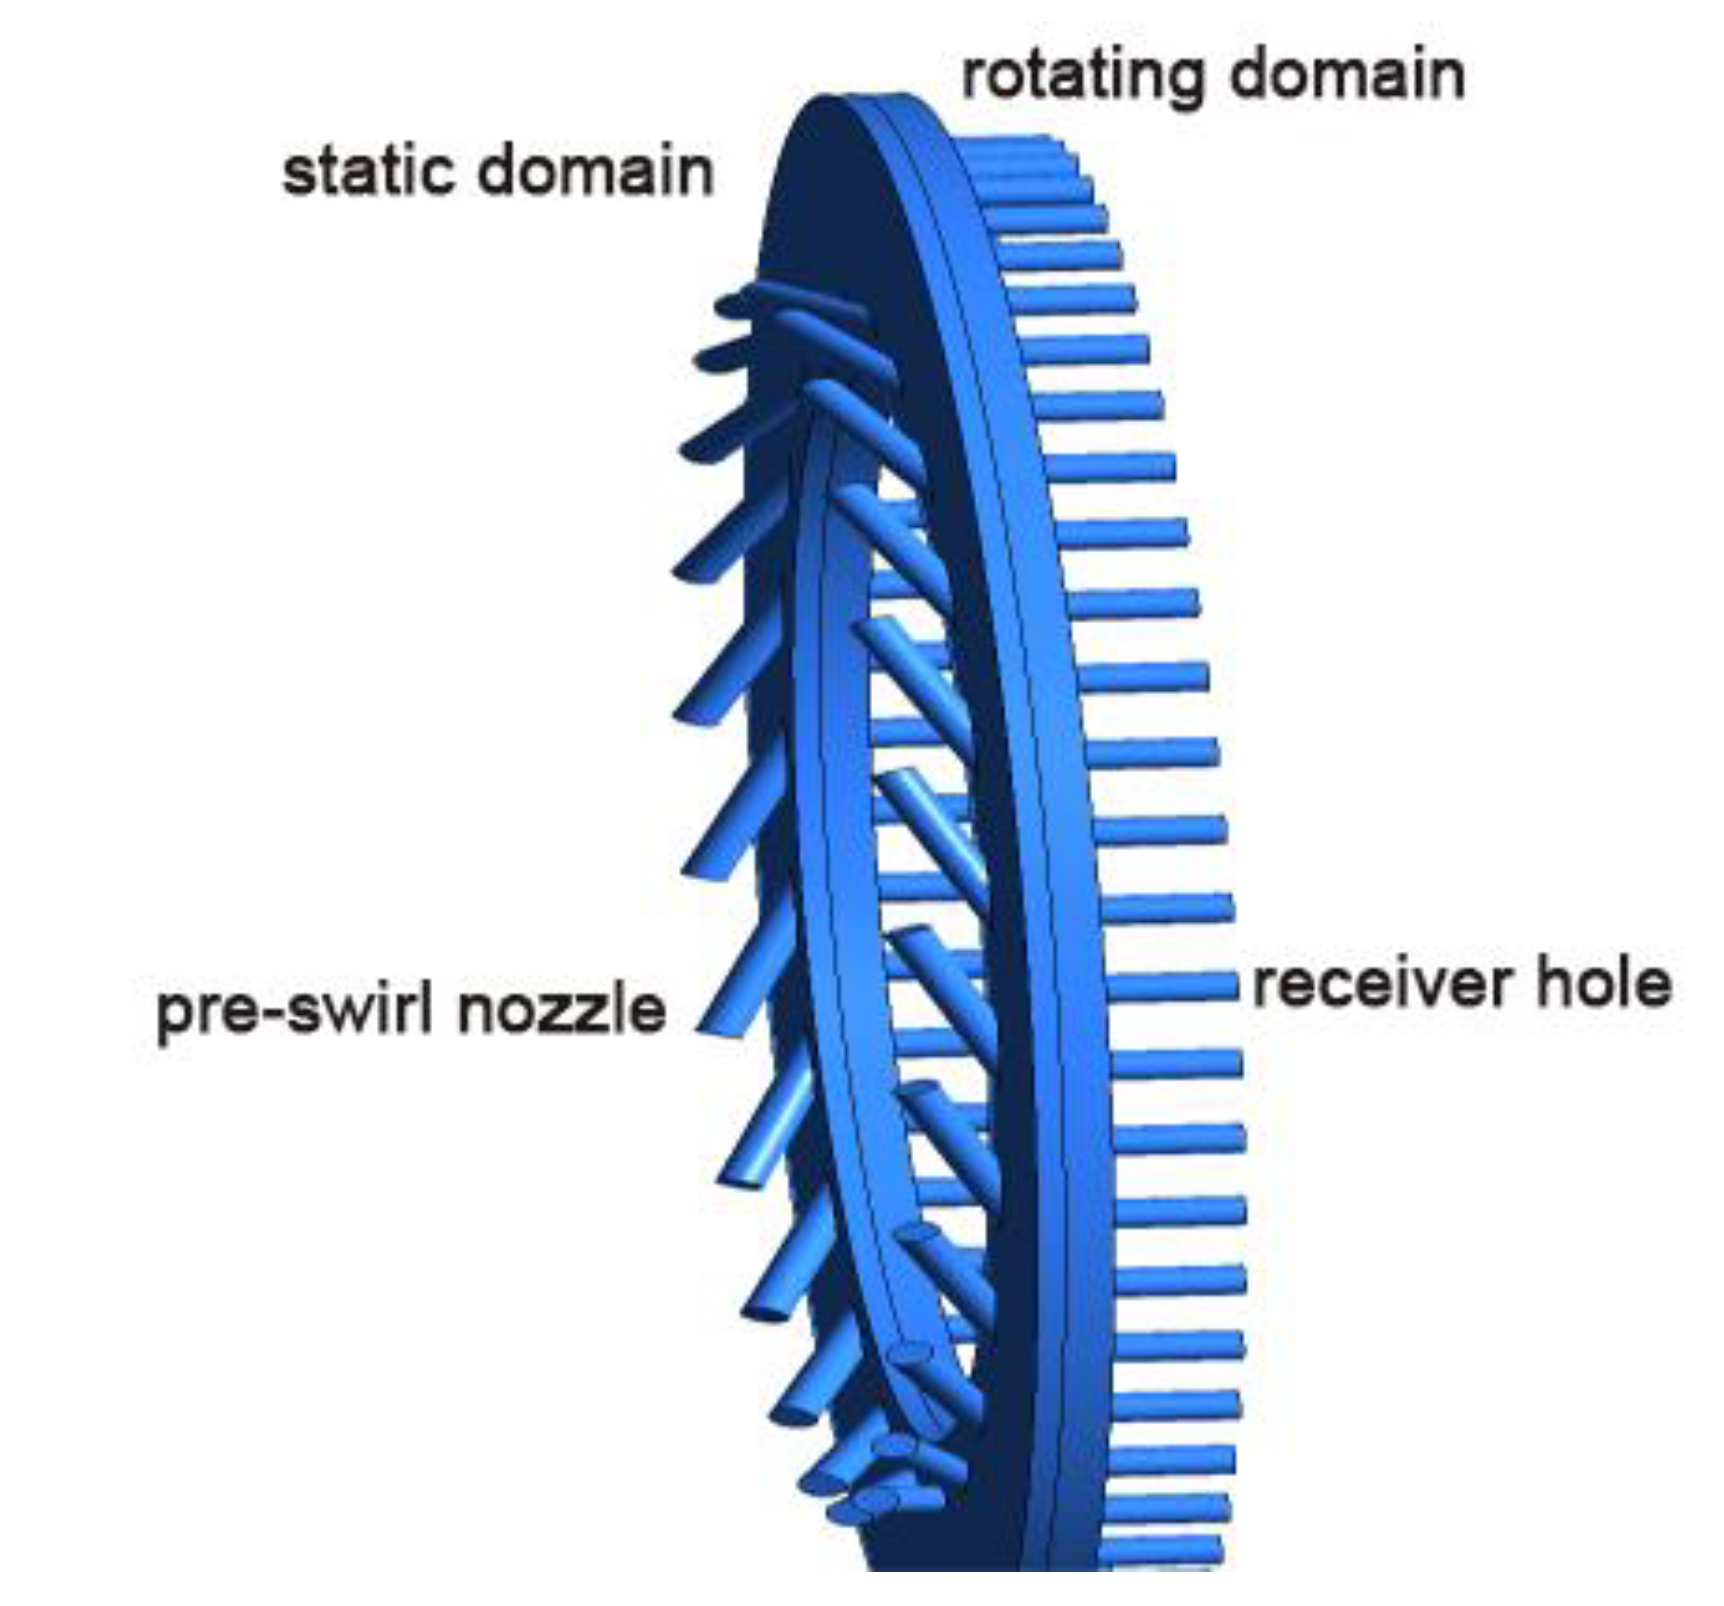
The computational model used in this paper (shown in Figure 1) is simplified from an actual gas turbine, for which a rich experimental study has been carried out at the University of Bath. The experimental conditions cover typical βp and λT in real engines, and the flow structures studied are typical [19]. Please refer to the papers [7,20,21,22,23] for detailed experimental settings and measurements, as only key information is described here.
As shown in Figure 1, the air enters the cavity from the discrete nozzles at a low radius, then flows radially outward influenced by centrifugal force, and finally exits through the receiver hole. Both shroud and hub have a sealing gap of 1 mm in width, which is ignored in the calculation. The geometric parameters of the experimental apparatus are shown in Table 1. This paper focuses on the effect of the geometric parameters on the flow dynamics of the pre-swirl system after a blade fracture. Therefore, based on the original experimental configuration, this paper plans to separately change the pre-swirl angle, area of nozzle, cavity gap, and radial position of the nozzles to investigate the effects of α, ξ, G, and δ on η, Cp, Cd, and Θad. Where ξ = Anozzle/Ahole, G = s/b, δ = rp/rh. For a representative study, the range of variation is shown in Table 2.
The 3D CFD model used for the calculation is divided into two computational domains: a stationary one and a rotational one. The two domains are connected by an interface, which is parallel to the disk (as shown in Figure 2). The medium is a compressible ideal gas and is calculated using the commercial software CFX19 with a physical time step of 2.5 × 10⁻⁵ and a convergence criterion of RSM < 10−5. There are two steady-state methods for handling interfaces in CFX, namely Stage and Frozen Rotor [24]. What we study in this paper is an asymmetric boundary condition, and the Frozen Rotor method is more appropriate. The boundary conditions for the calculation are shown in Table 3: the outlet_0 corresponds to the broken blade, so its outlet pressure is lower than that of the other receiver holes. In this paper, the boundary conditions of the pre-swirl system after turbine blade fracture are simulated by the different pressure of the receiver holes. When the outlet pressures of all receiver holes are equal, it means that the turbine blades are not fractured.
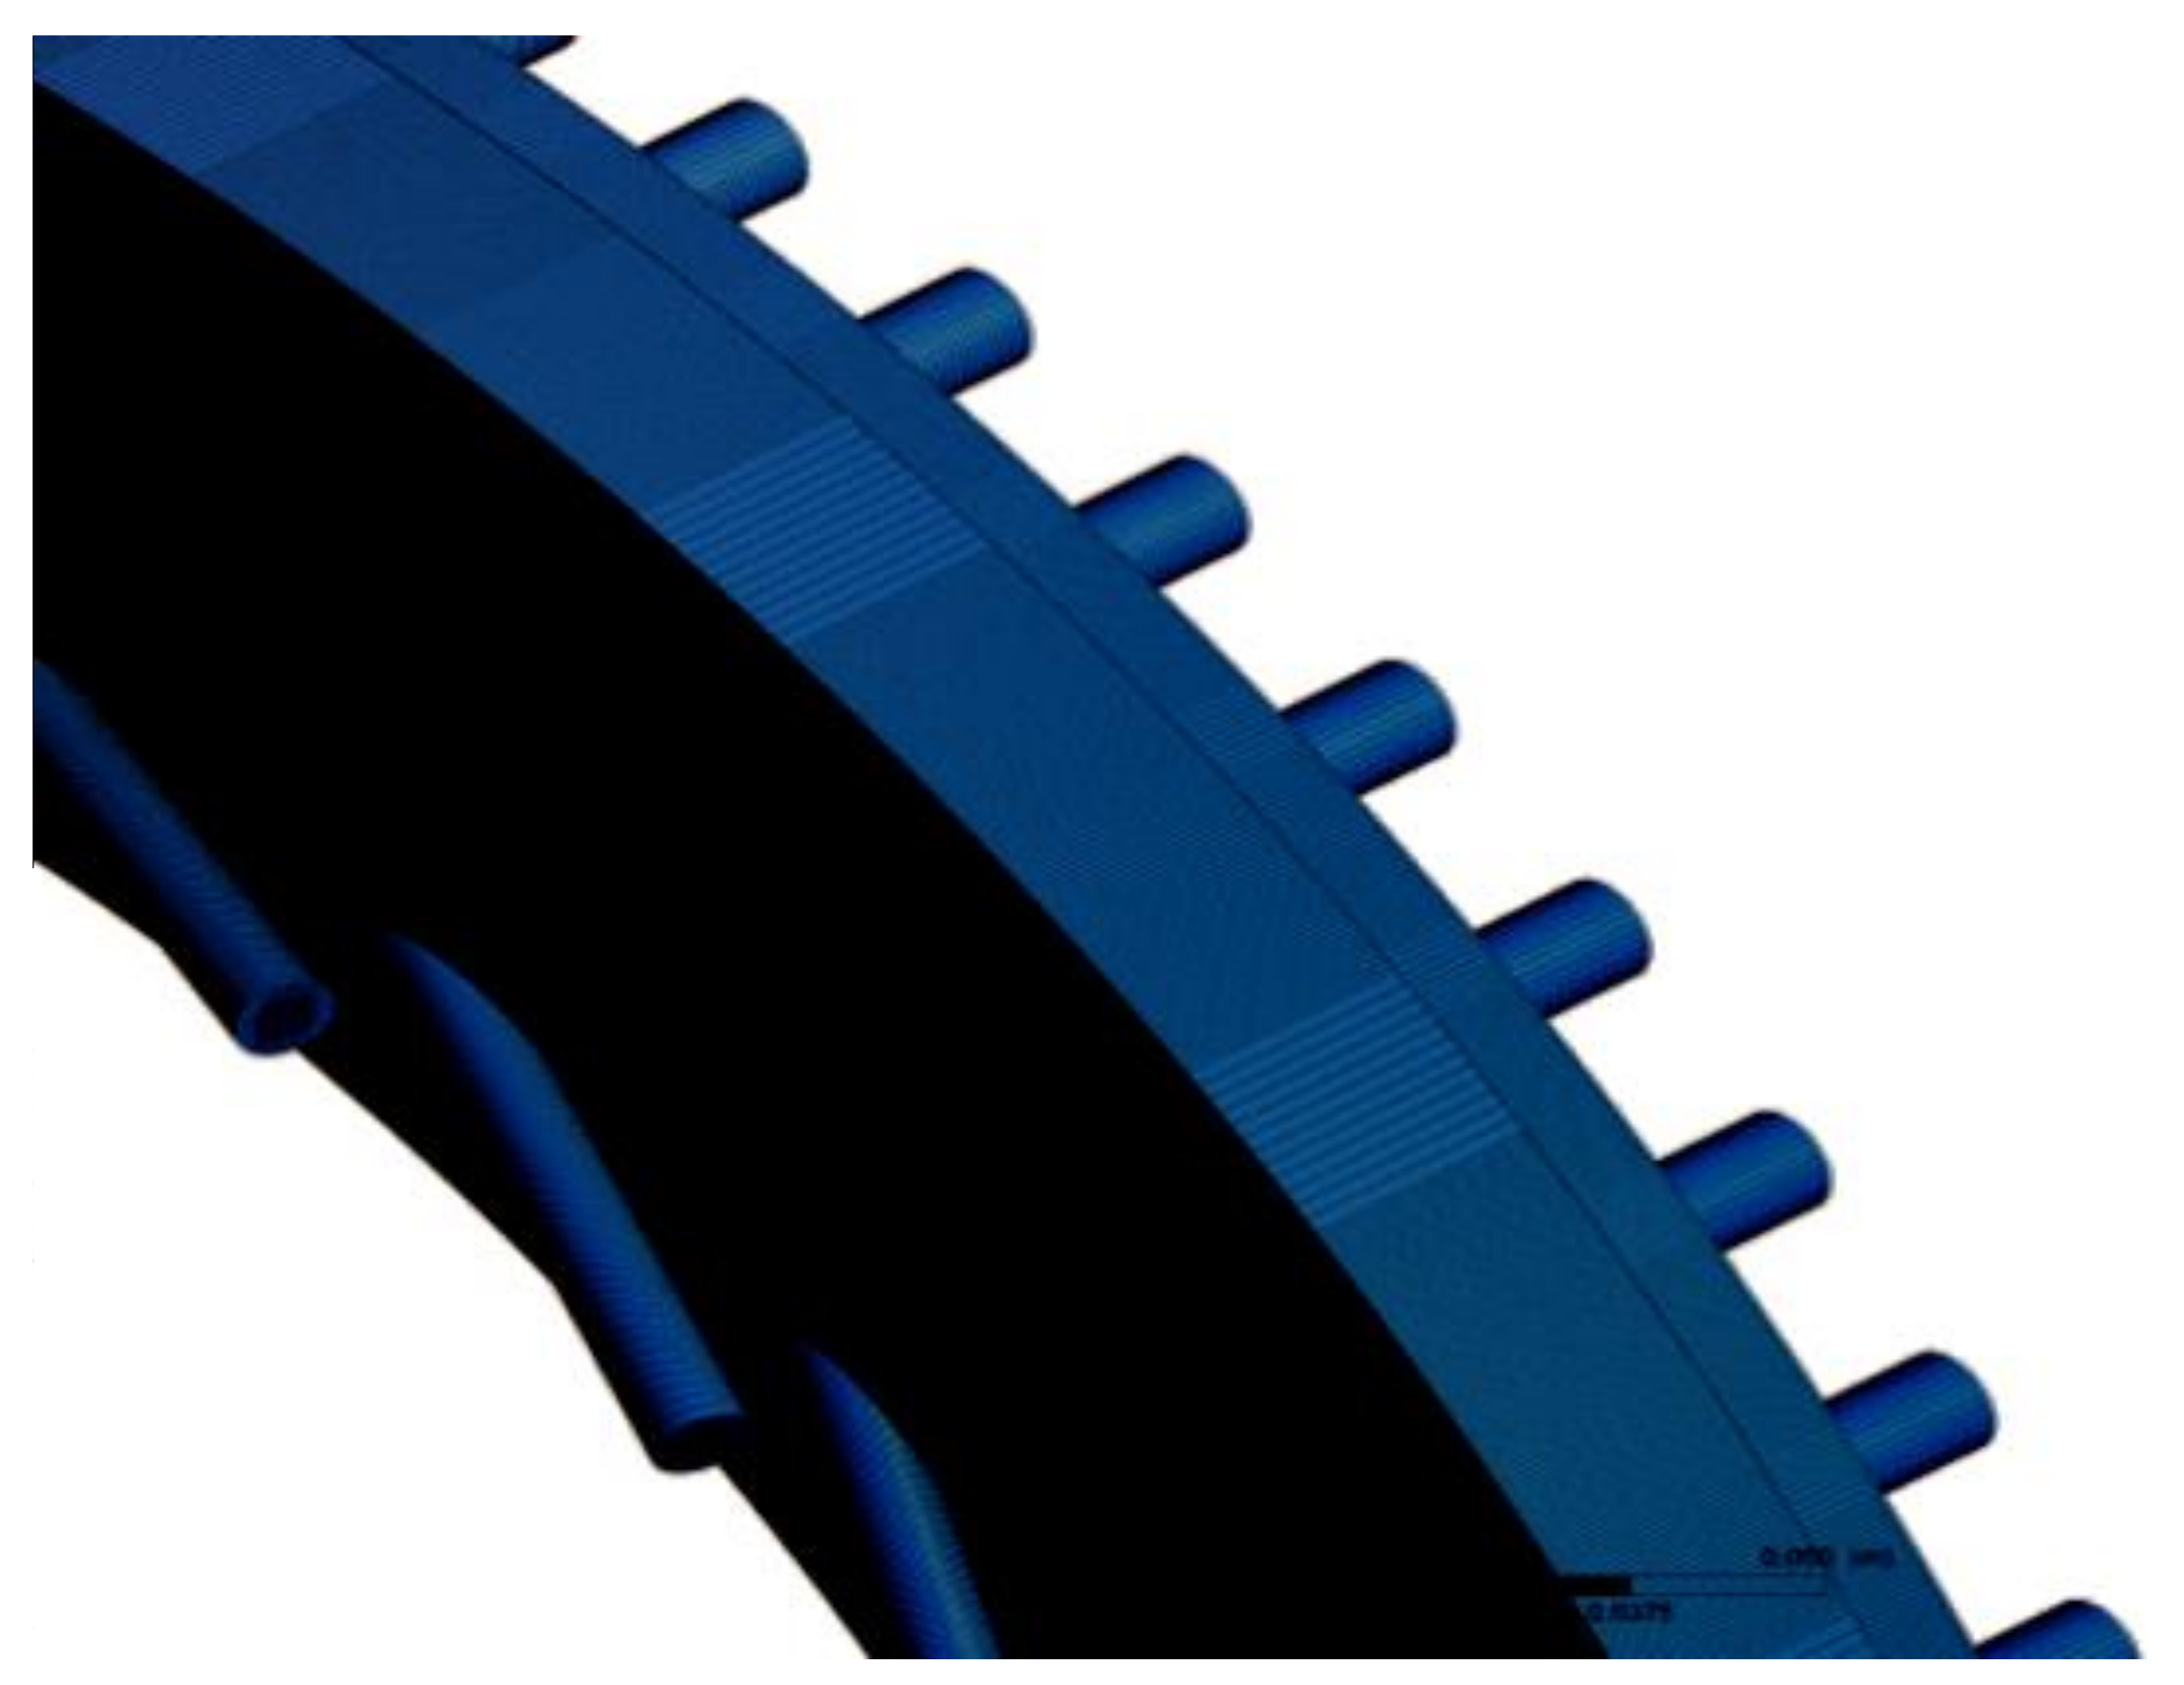
The meshes of the static and rotating domains are all hexahedral, meshed by ICEM. Figure 3 shows the local mesh of the domains. To exclude the influence of mesh, the mesh is periodic. In other words, the static domain is meshed by rotating and coping a 15° mesh 23 times, while the rotating domain is constructed by rotating and coping a 6° mesh 59 times. Therefore, the mesh is axisymmetrical. The thickness of the first layer of the wall boundary layer is 0.002 mm, the growth rate is 1.1, and the Y+ at the wall surface is less than 1, which only exceeds 1 in a small range near the pre-swirl nozzle and outlets. There are more than 4.5 × 10⁷ grids in total.

2.2. Computational Validation

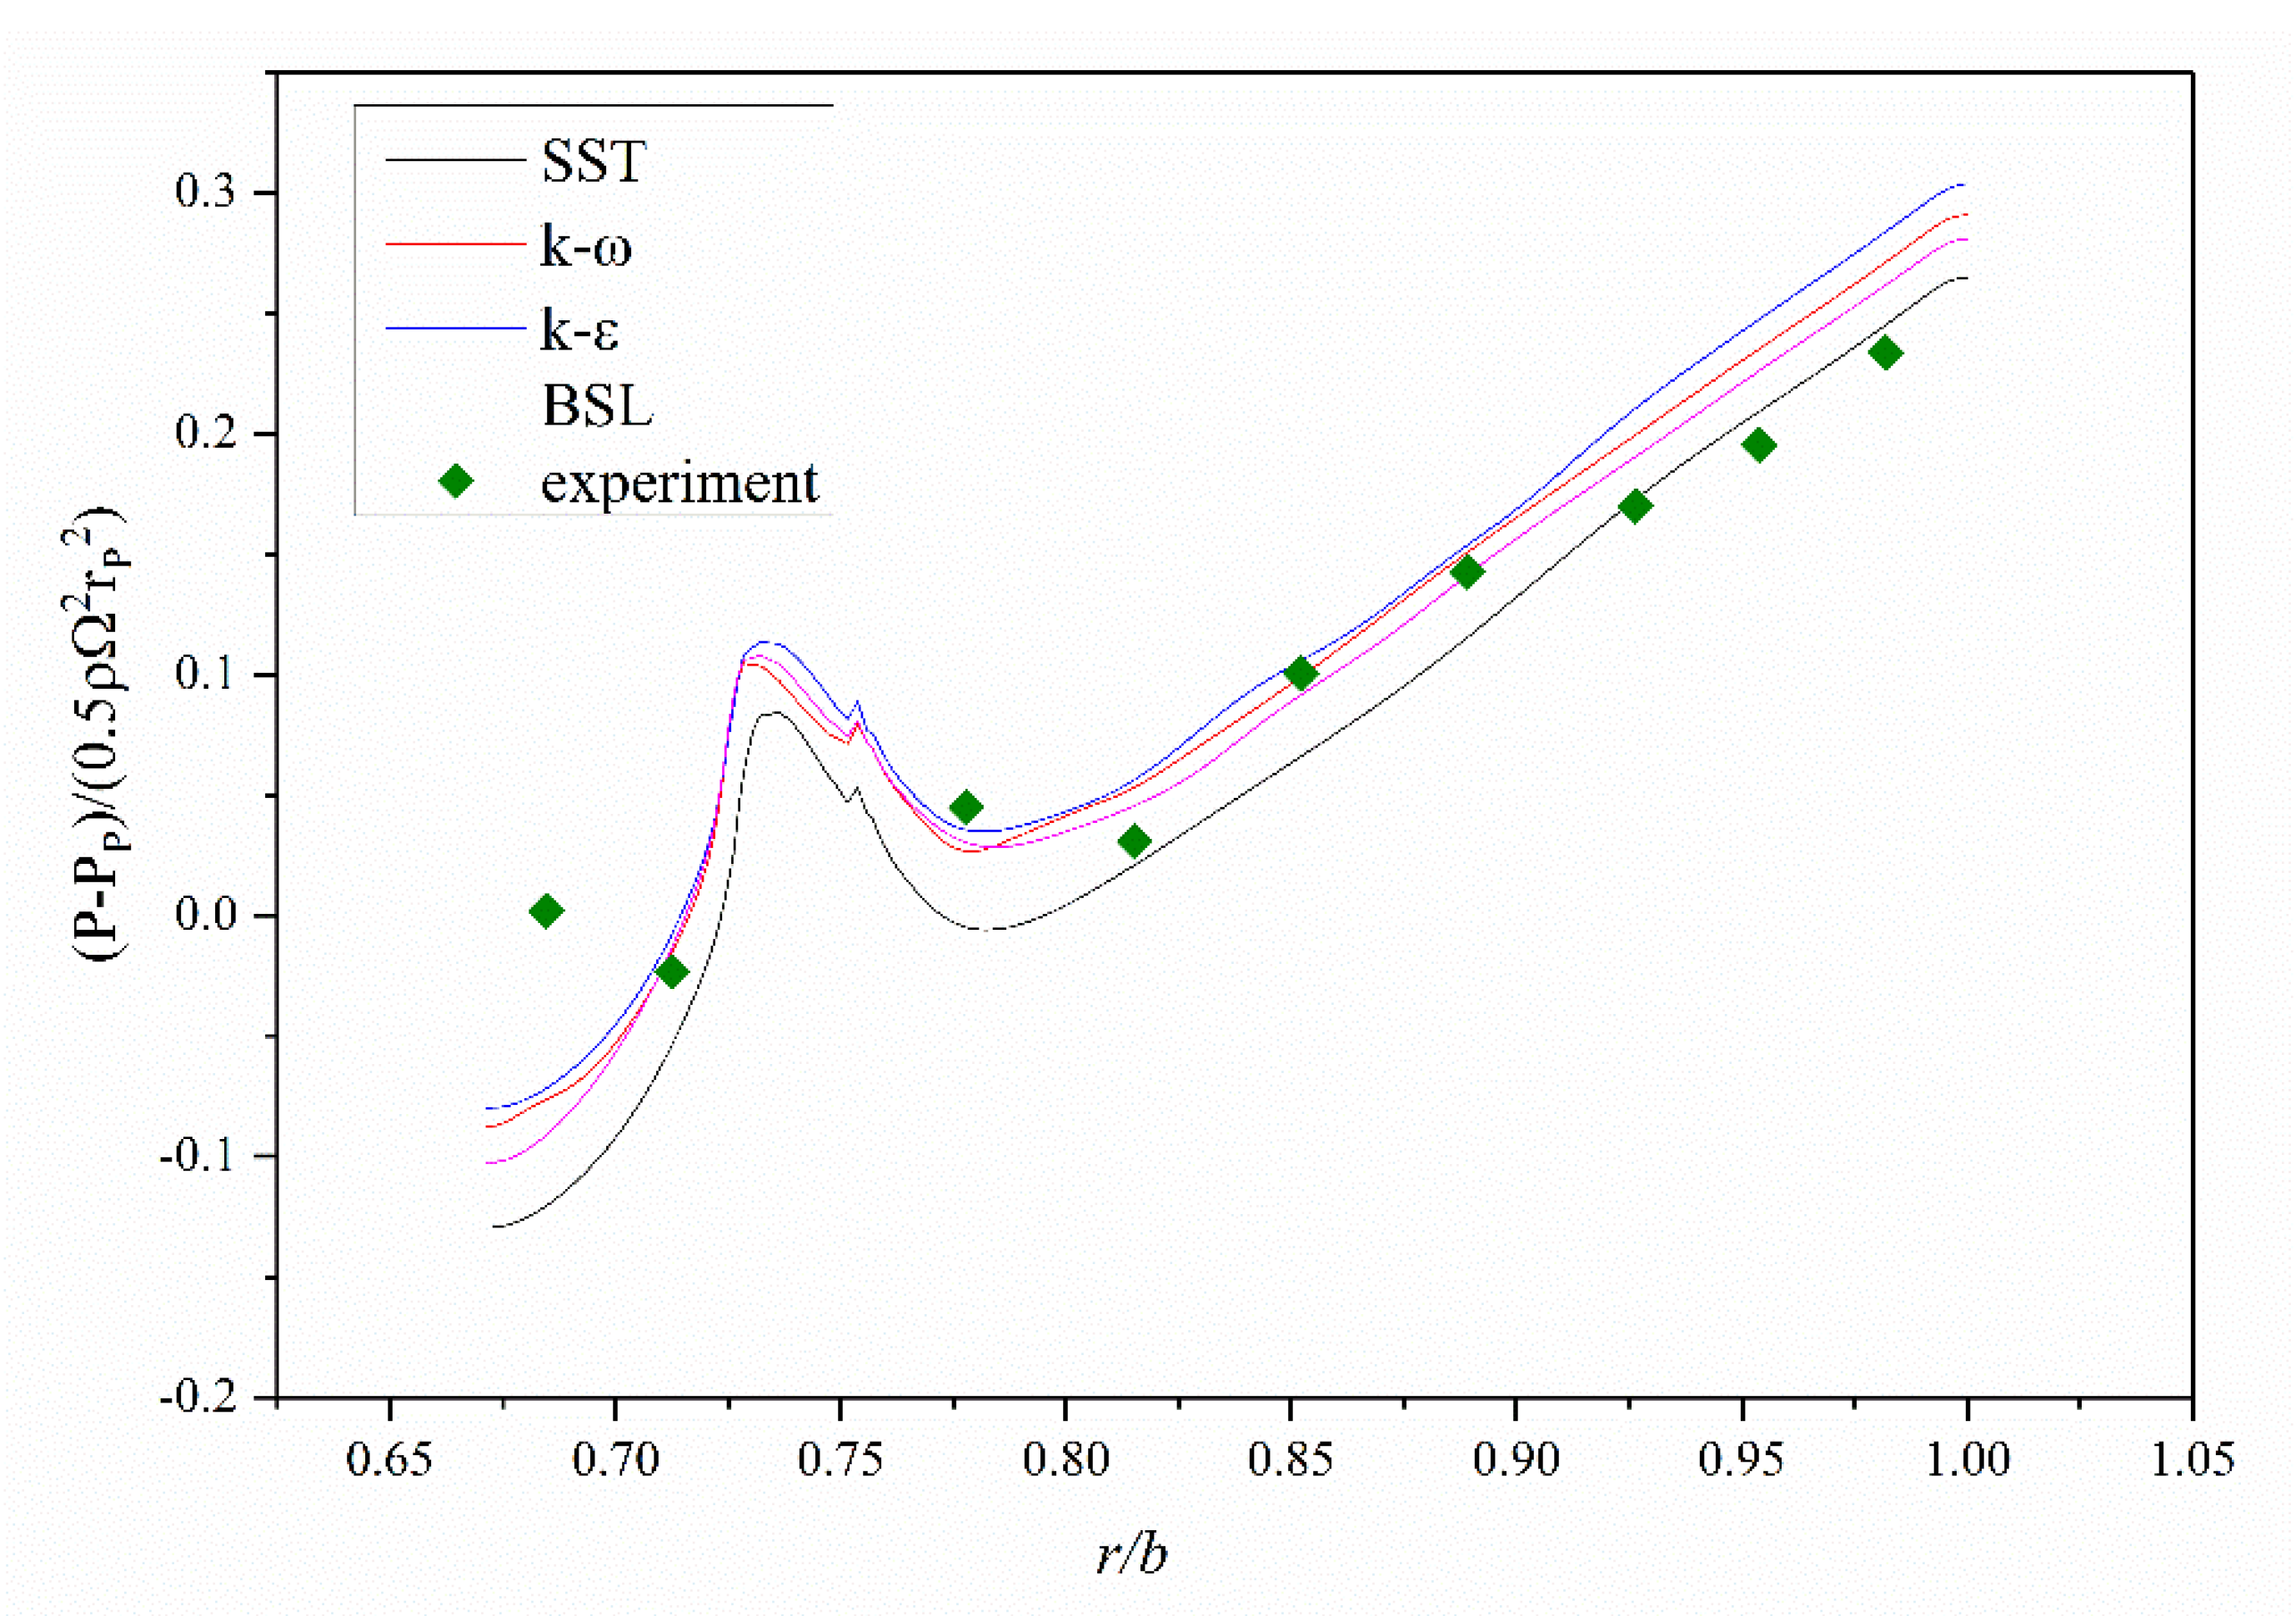
There are many turbulence models available in the commercial software CFX. In this paper, four widely used turbulence models are selected for comparison with experiments to obtain the most suitable one for this problem. To save the computational effort, the computational model used in this section is shown in Figure 4. The domain includes a static domain and a rotating domain. The static domain is a sector of 15° with a pre-swirl nozzle, and the rotating domain is 12° with two receiver holes. Figure 5 shows the comparison of static pressure in the static disk between the four turbulence models and the experimental results. It can be seen from the figure that the SST model performs better than the other turbulence models in high-radius regions. Combined with the research of other authors [4,24,25], all the following cases employ the SST turbulence model.
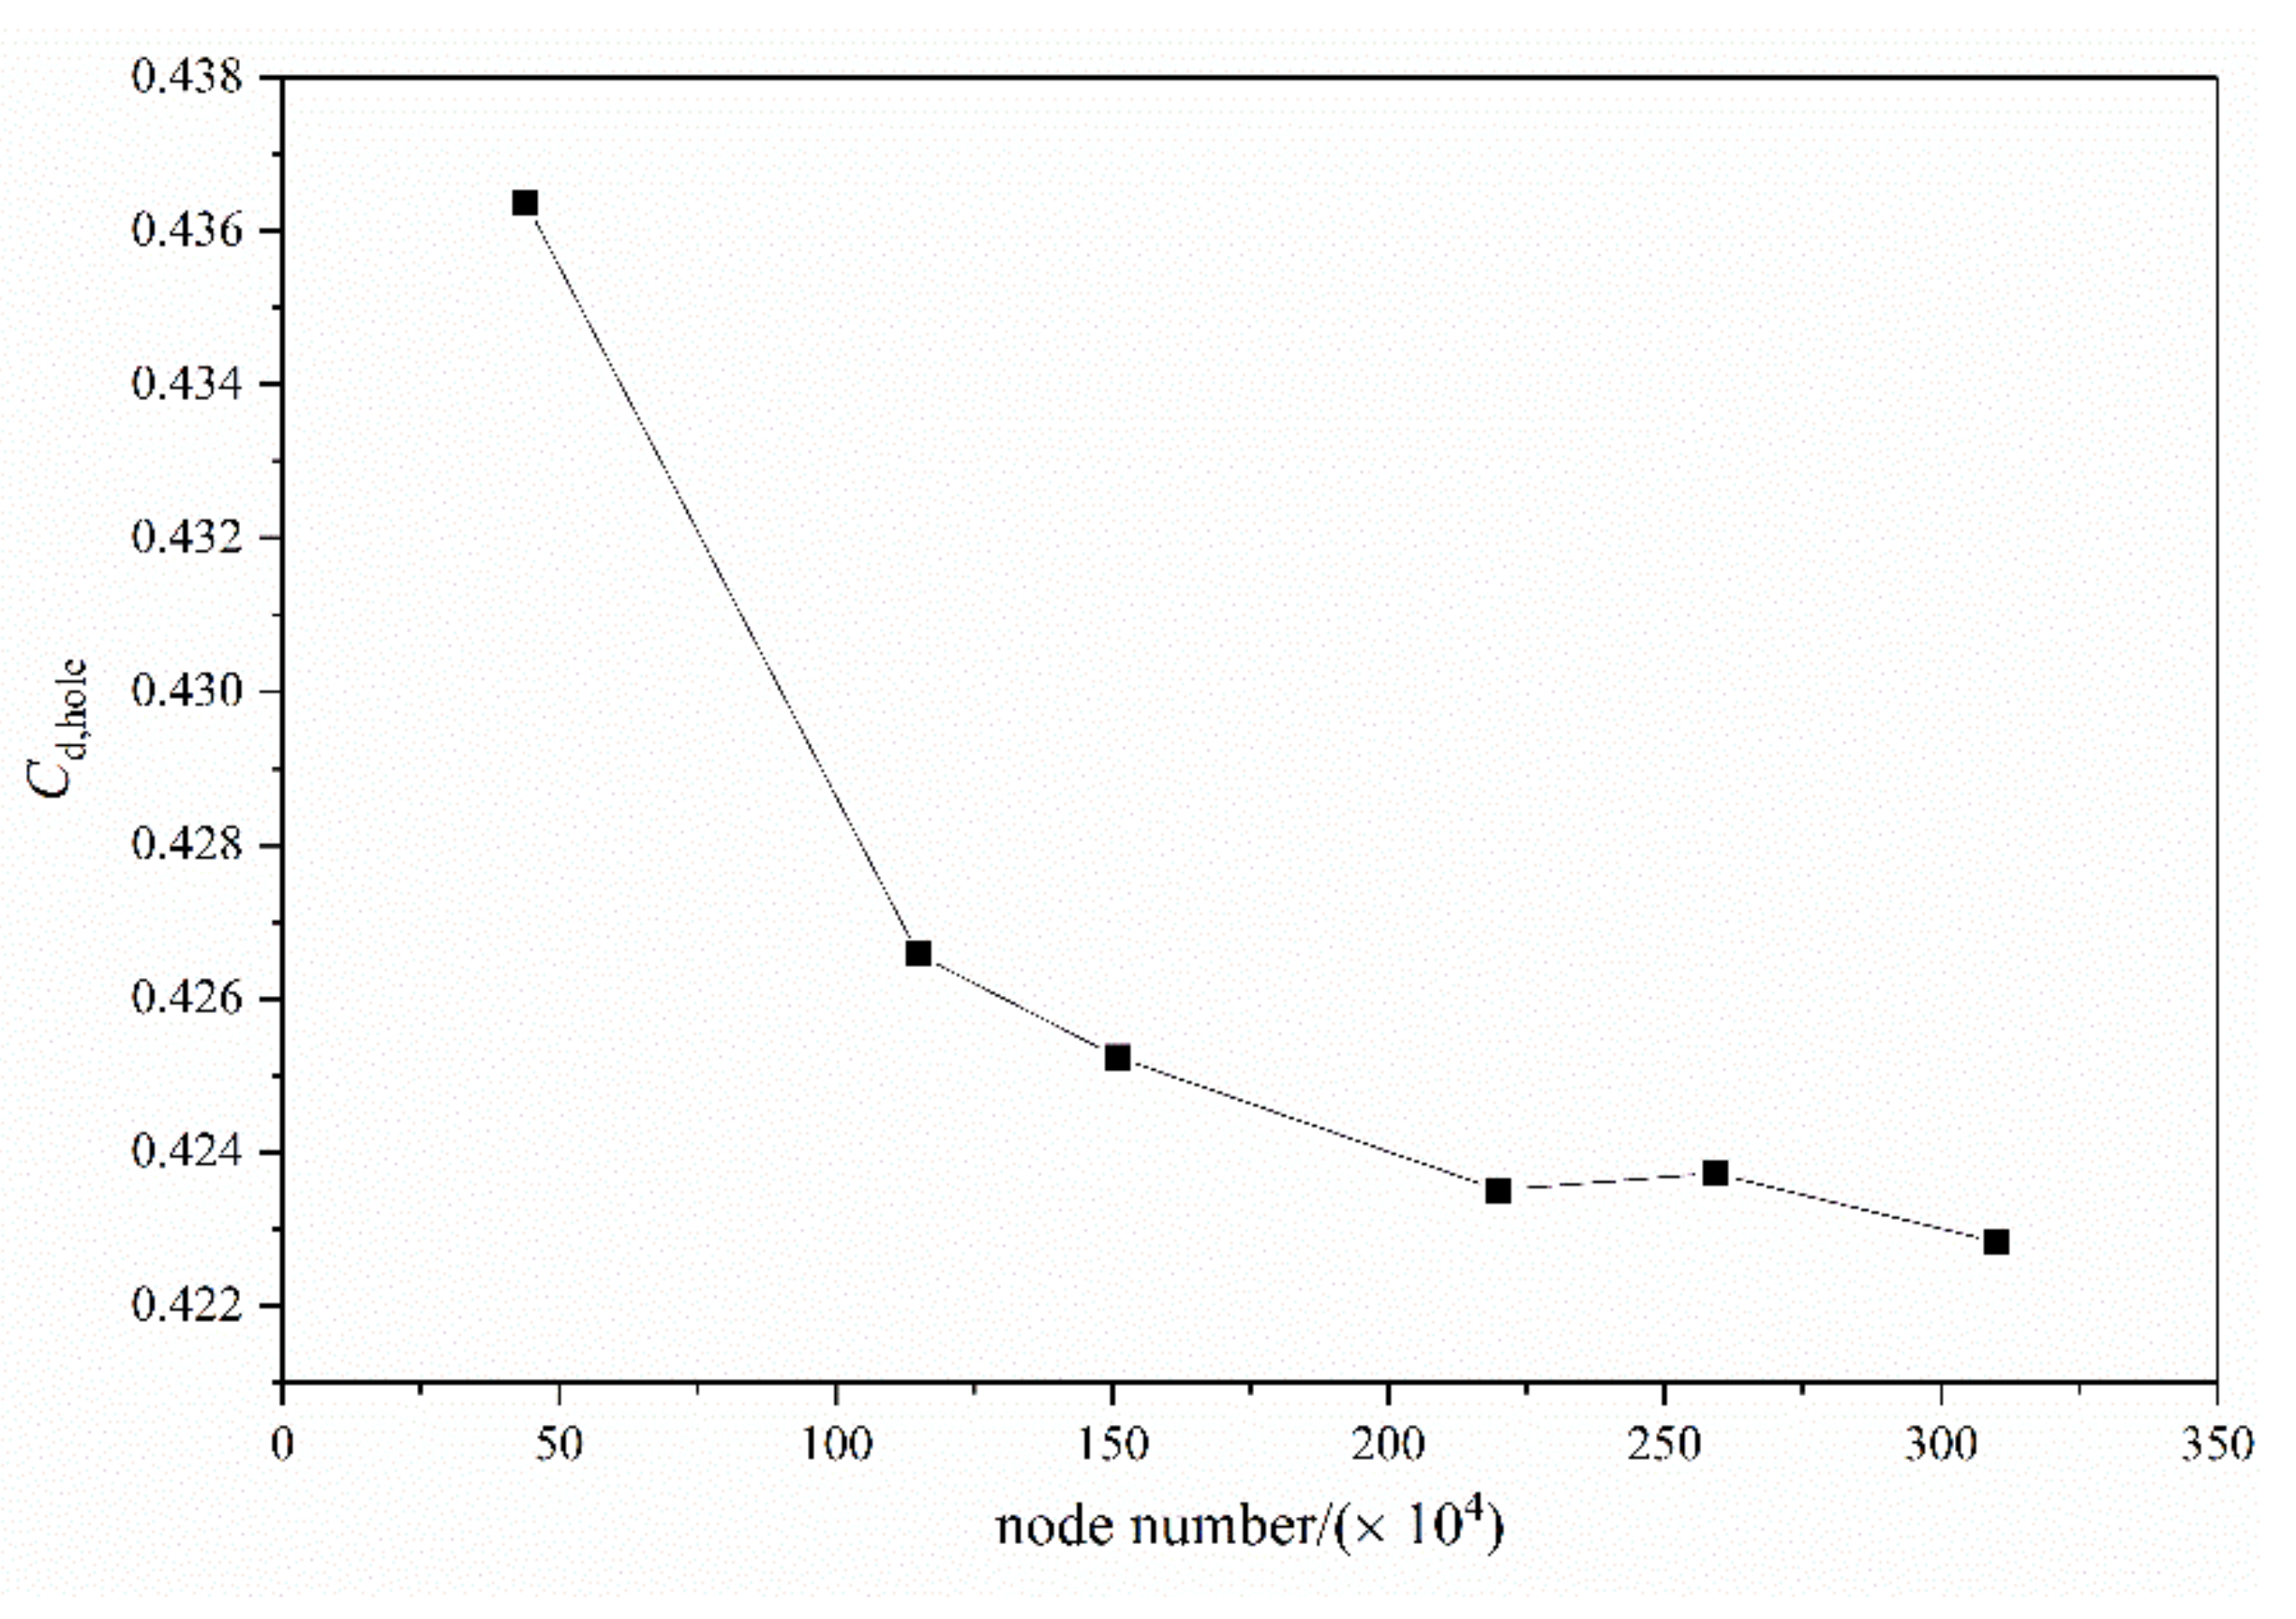
To obtain grid-independent solutions, this paper created 5 sets of structured mesh through the commercial software ICEM. The boundary-layer settings of each mesh are the same, and only the mesh size outside the boundary layer is changed. Figure 6 shows the effect of the node number on the discharge coefficient of the receiver holes. It can be seen from the figure that, when the number of the grid is more than 2.2 × 10⁶, the discharge coefficient of the receiver hole hardly changes. Therefore, the numerical results are no longer affected by the grid number when the number is more than 2.2 × 10⁶. The number of the grid used in the following is 2.2 × 10⁶.
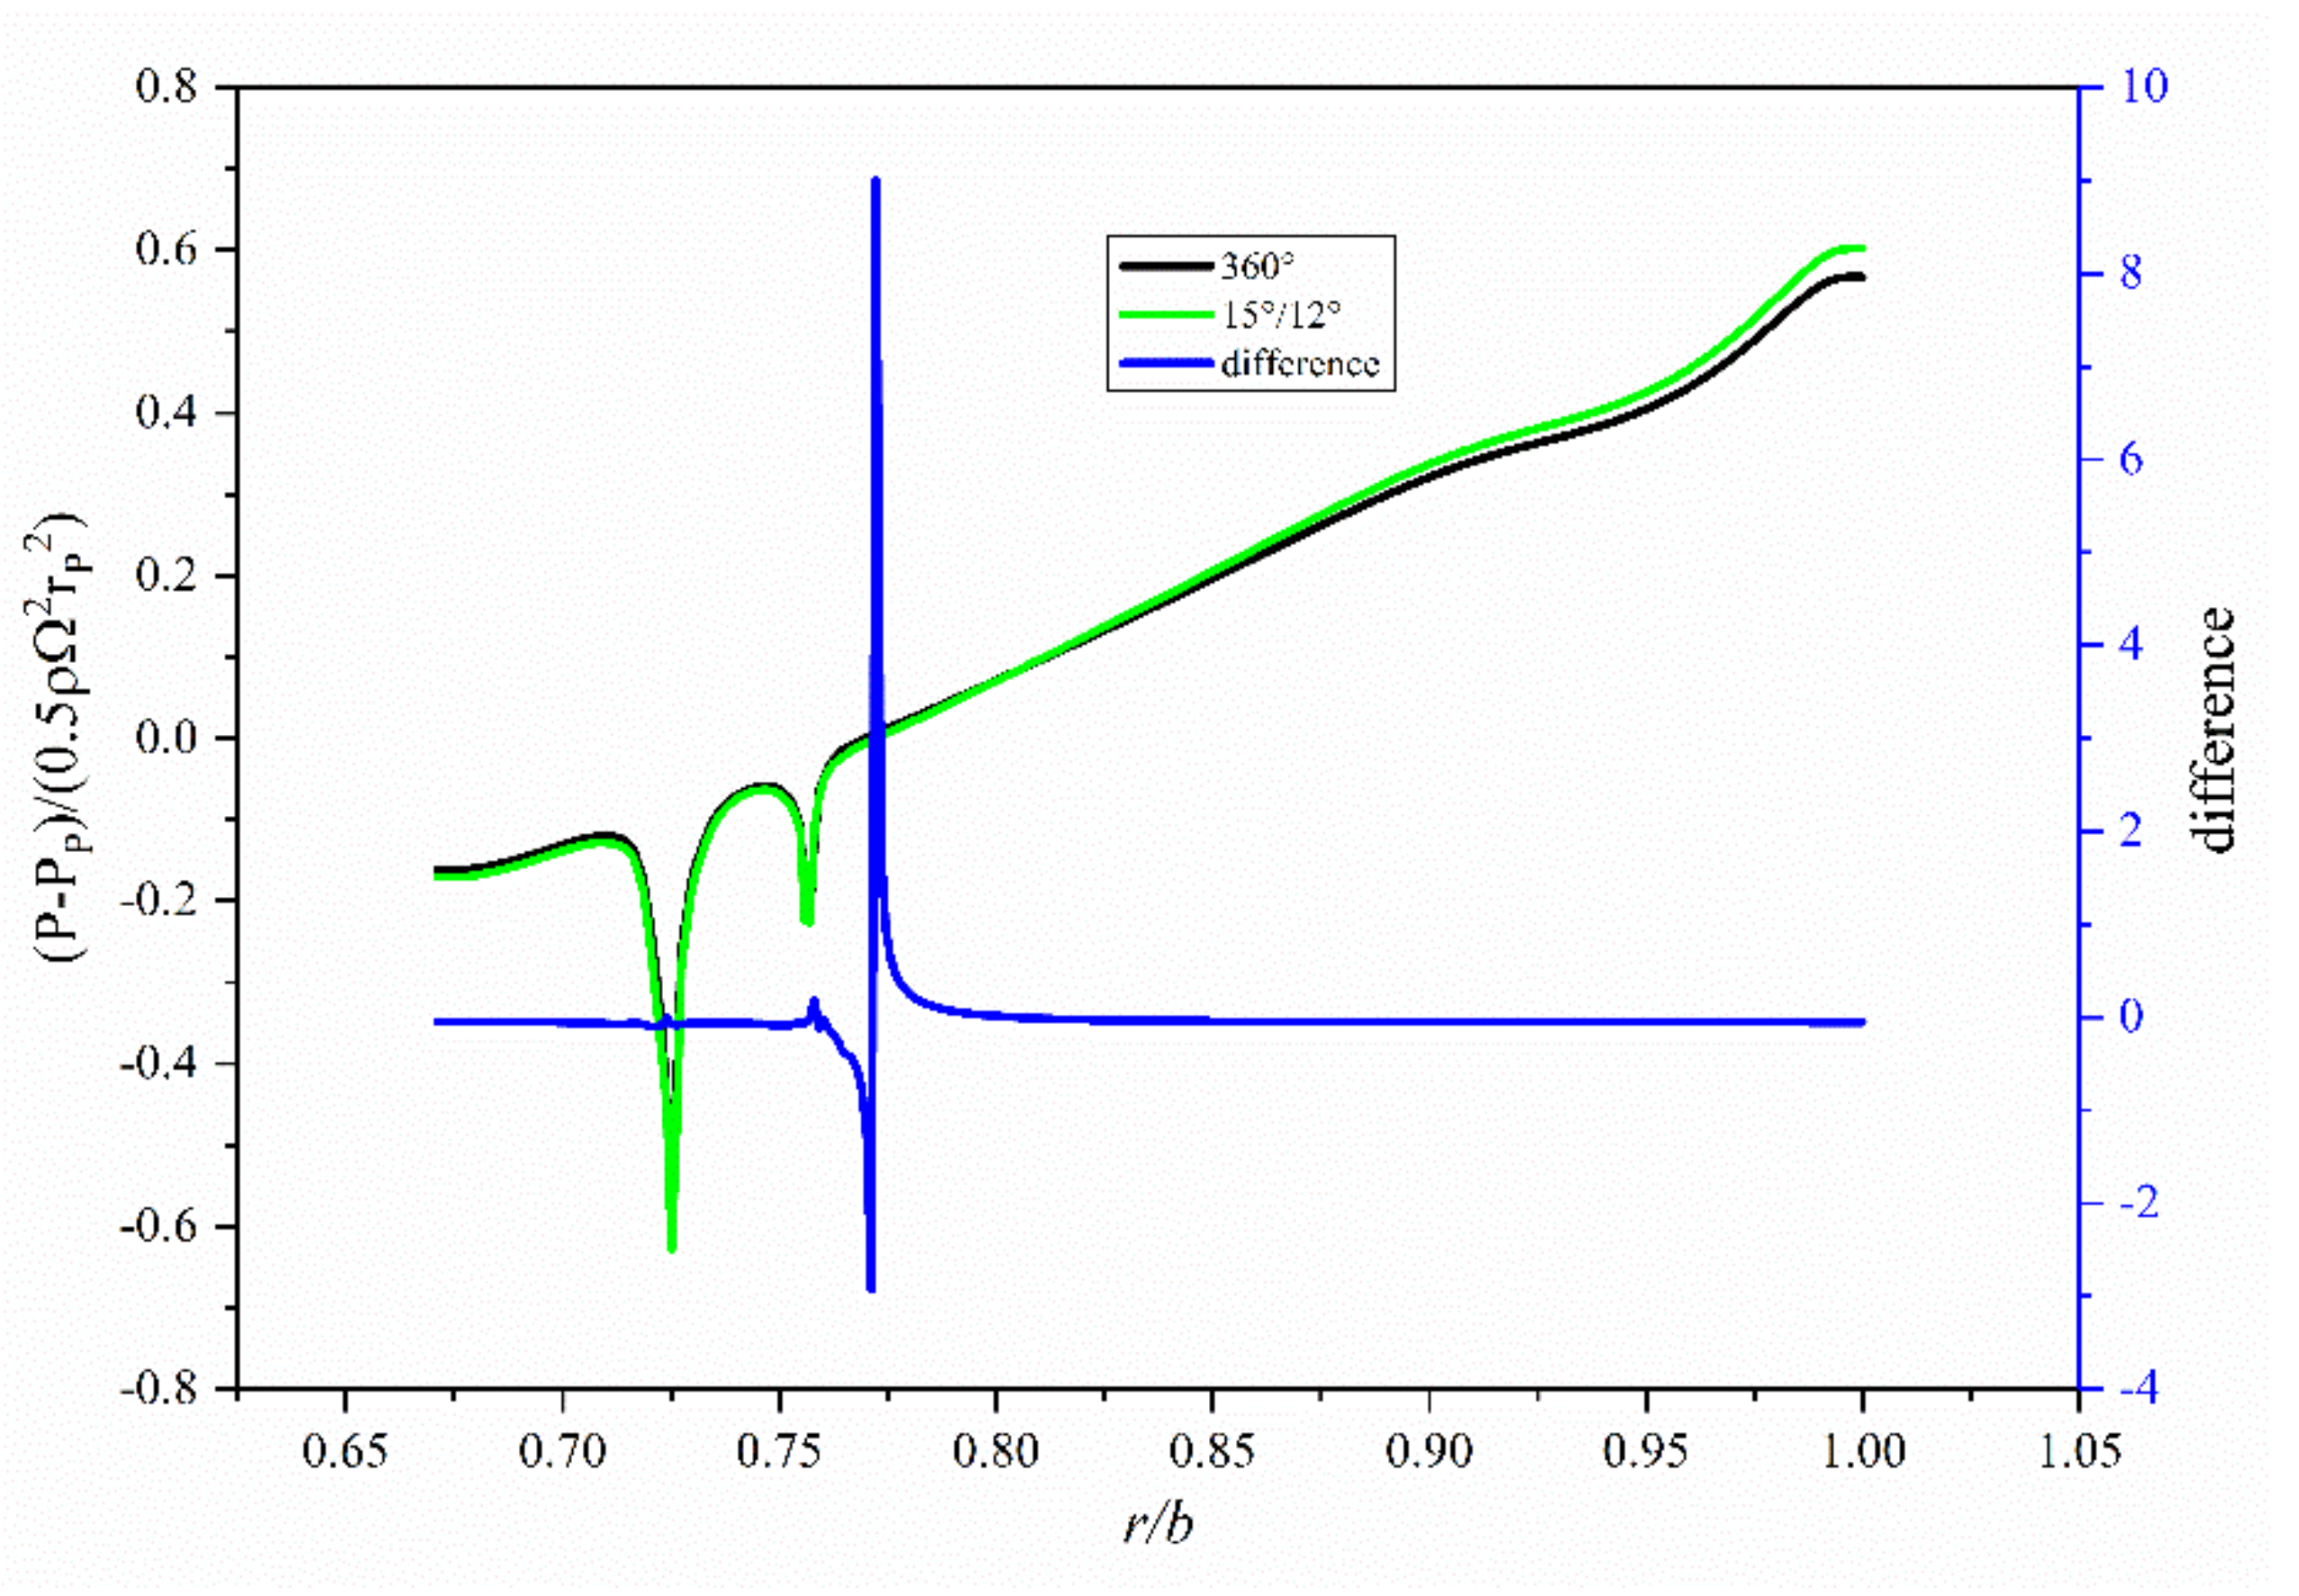
As mentioned above, the turbulence model and mesh validation in this section were performed with the sector model (shown in Figure 4), while the full-loop model (shown in Figure 2) is used in the next section. So, it is necessary to confirm that the validated turbulence model and mesh setup parameters are also appropriate in the full-loop model. To verify the consistency of computation between the 360° domain and the 15°/12° domain, it is necessary to prove that the difference between the two kinds of domain is little. Figure 7 shows the distribution of the dimensionless static pressure near the stator along the radial direction calculated by the two models, which indicates that the deviation between the two domains is below 5% in most areas except the areas where the pressure is equal to that of the nozzles. Therefore, the validation of the turbulence model and mesh setting verified by the 15°/12° domain is also applicable to the 360° domain.

2.3. Definition of Parameters

This paper is mainly concerned with four dimensionless parameters, the definitions of which are specified below.
Mass flow ratio:
η h o l e i = m h o l e i m n o z z l e / N h o l e
where mhole_i is the mass flow rate of hole_i (hole_0 is the receiver hole that corresponds to the fractured blade, and the other receiver holes are numbered as hole_i (i ≠ 0), with the direction of increasing i in the rotating direction.), mnozzle is the inlet mass flow rate of the nozzles, and Nhole is the number of receiver holes. ηhole_i is used to describe the change in the mass flow rate of hole_i after blade fracture compared to the average mass flow rate.
Total-pressure-loss efficiency:
C p , h o l e _ i = P n o z z l e , i n , s t n * + 1 2 ρ Ω r h o l e 2 V φ , n o z z l e 2 P h o l e _ i , o u t , s t n * P n o z z l e , i n , s t n * P h o l e _ i , o u t
where P*nozzle,in,stn is the total pressure of the nozzle inlet in the static frame, P*hole_i,out,stn is the total pressure of the hole outlet in the static frame, and Phole_i,out is the static pressure of the hole outlet. Vφ,nozzle is the tangential velocity of the nozzle outlet, and Vφ,nozzle = mnozzlecosα/ρAnozzle. The definition of Cp,hole_i refers to the work of the literature [26], which describes the pressure loss of the air as it travels from the nozzle to the hole_i.
Discharge coefficient [2]:
C d , h o l e _ i = m h o l e _ i A h o l e P h o l e _ i , i n , r e l * R T h o l e _ i , i n , r e l * 2 k k 1 P h o l e _ i , o u t P h o l e _ i , i n , r e l * 2 / k P h o l e _ i , o u t P h o l e _ i , i n , r e l * 1 + 1 / k
The definition of Cd,hole_i refers to the work of the literature [2], which describes the discharge coefficient of hole_i. Where Ahole is the total area of the receiver holes, P*hole_i,in,rel is the total pressure of the inlet of hole_i in the relative frame, T*hole_i,in,rel is the total temperature of the inlet of hole_i in the relative frame, R is the ideal gas constant, and κ is the ratio of the specific heat of ideal gas.
Adiabatic effectiveness [2]:
Θ a d , h o l e _ i = C P T n o z z l e , i n , s t n * T h o l e _ i , o u t , r e l * 0.5 Ω 2 r h 2
Θad,hole_i describes the adiabatic efficiency of the air as it travels from the nozzle to hole_i. The larger the value of Θad, the lower the relative total temperature of the cold air entering the turbine blades, which means that the pre-swirl system has a better performance.

3. Results and Discussion

3.1. Influence of Pre-swirl Angle α

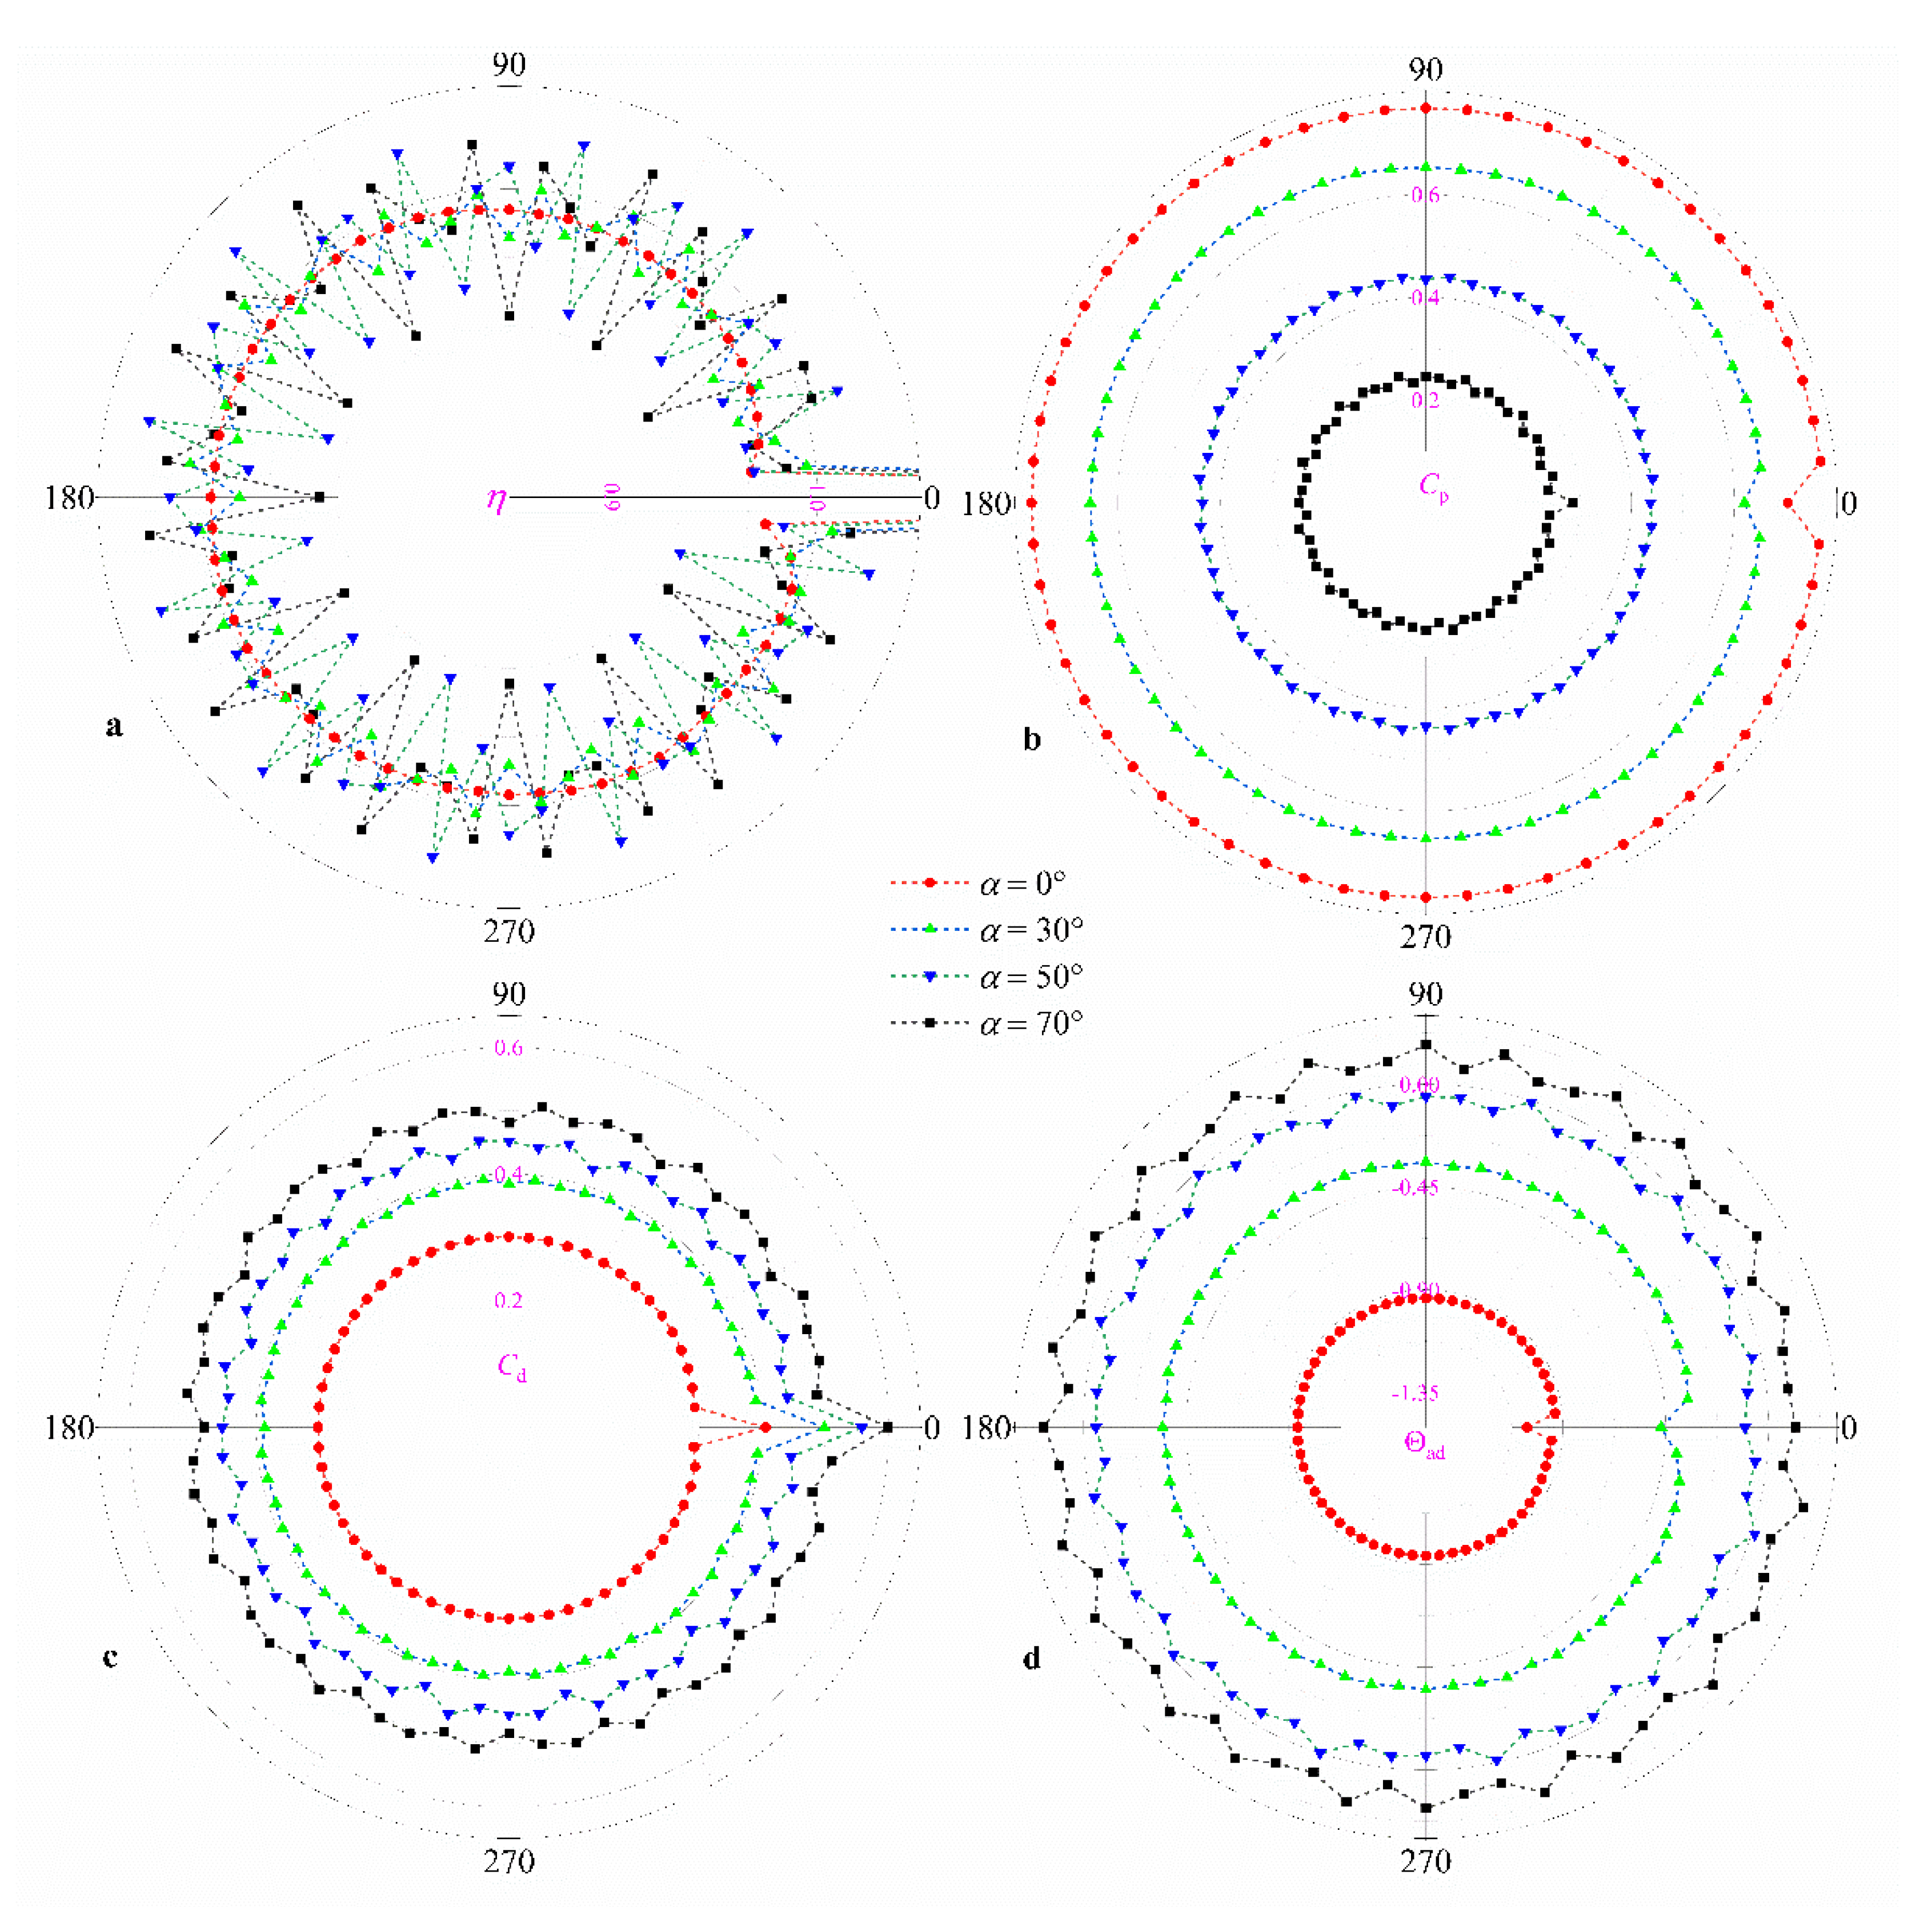
The distributions of η, Cp, Cd, and Θad in the circumferential direction are shown in Figure 8, respectively, for different α. These curves all consist of 60 data points, each corresponding to a receiver hole. Hole_0, corresponding to the fractured blade, is located at 0° of the polar coordinate system, and hole_1 is located at 6°. The θ increases in the same direction as the rotation of the rotor (thus, hole_1 is located downstream of hole_0, whereas hole_59 is located upstream of it). This is also the same for the curves below and will not be repeated.
The distribution of mass flow is critical to the cooling of blades; so first, look at the distribution of η. Figure 8a shows the distribution of η for each receiver hole except hole_0. From the figure, it can be seen that the receiver holes around hole_0 are affected more by the fractured blade, while it has little influence on those holes far from hole_0. In addition, it is obvious from the figure that the amplitude of fluctuations gradually increases with the increase in α and shows a periodic character. It is important to note that the fluctuations in η are not due to the asymmetry of the boundary (blade fractured). As shown in Figure 9, even though the boundary conditions are symmetric (blade not fractured), the η of holes are still not equal. This indicates that the turbine blade fracture does not affect the area away from the fractured blade. This is supposed to be attributed to the method of Frozen Rotor and the reasons that will be described below. When α = 0°, the air is ejected from the nozzle and impacts the rotor vertically, and flows towards the high-radius region driven by the rotor. By the high-radius position, the flow tends to be uniform (as shown in Figure 10a, the vector is uniform near the receiver holes), and therefore η changes more smoothly. As α increases, the effect of the rotor on the air is reduced, resulting in the uneven flow caused by the discrete nozzles affecting the flow near the receiver hole (as shown in Figure 10a, the vector near the receiver holes is influenced by the nozzles). This is ultimately reflected in the fluctuations of η, so the period of the fluctuation is closely related to the number of nozzles.
As for hole_0, ηhole_0 is 1.530, 1.527, 1.559, and 1.536 when α is 0°, 30°, 50°, and 70°, respectively. Considering the fluctuation in the mass flow rate between the holes, α has little effect on ηhole_0. Therefore, it can be understood that ηhole_0 is larger at α = 50° than at other values of α. That is because, when α = 50°, hole_0 is just near the crest of the fluctuation period. Of course, ηhole_0 is also affected by fluctuations when α equals other values.
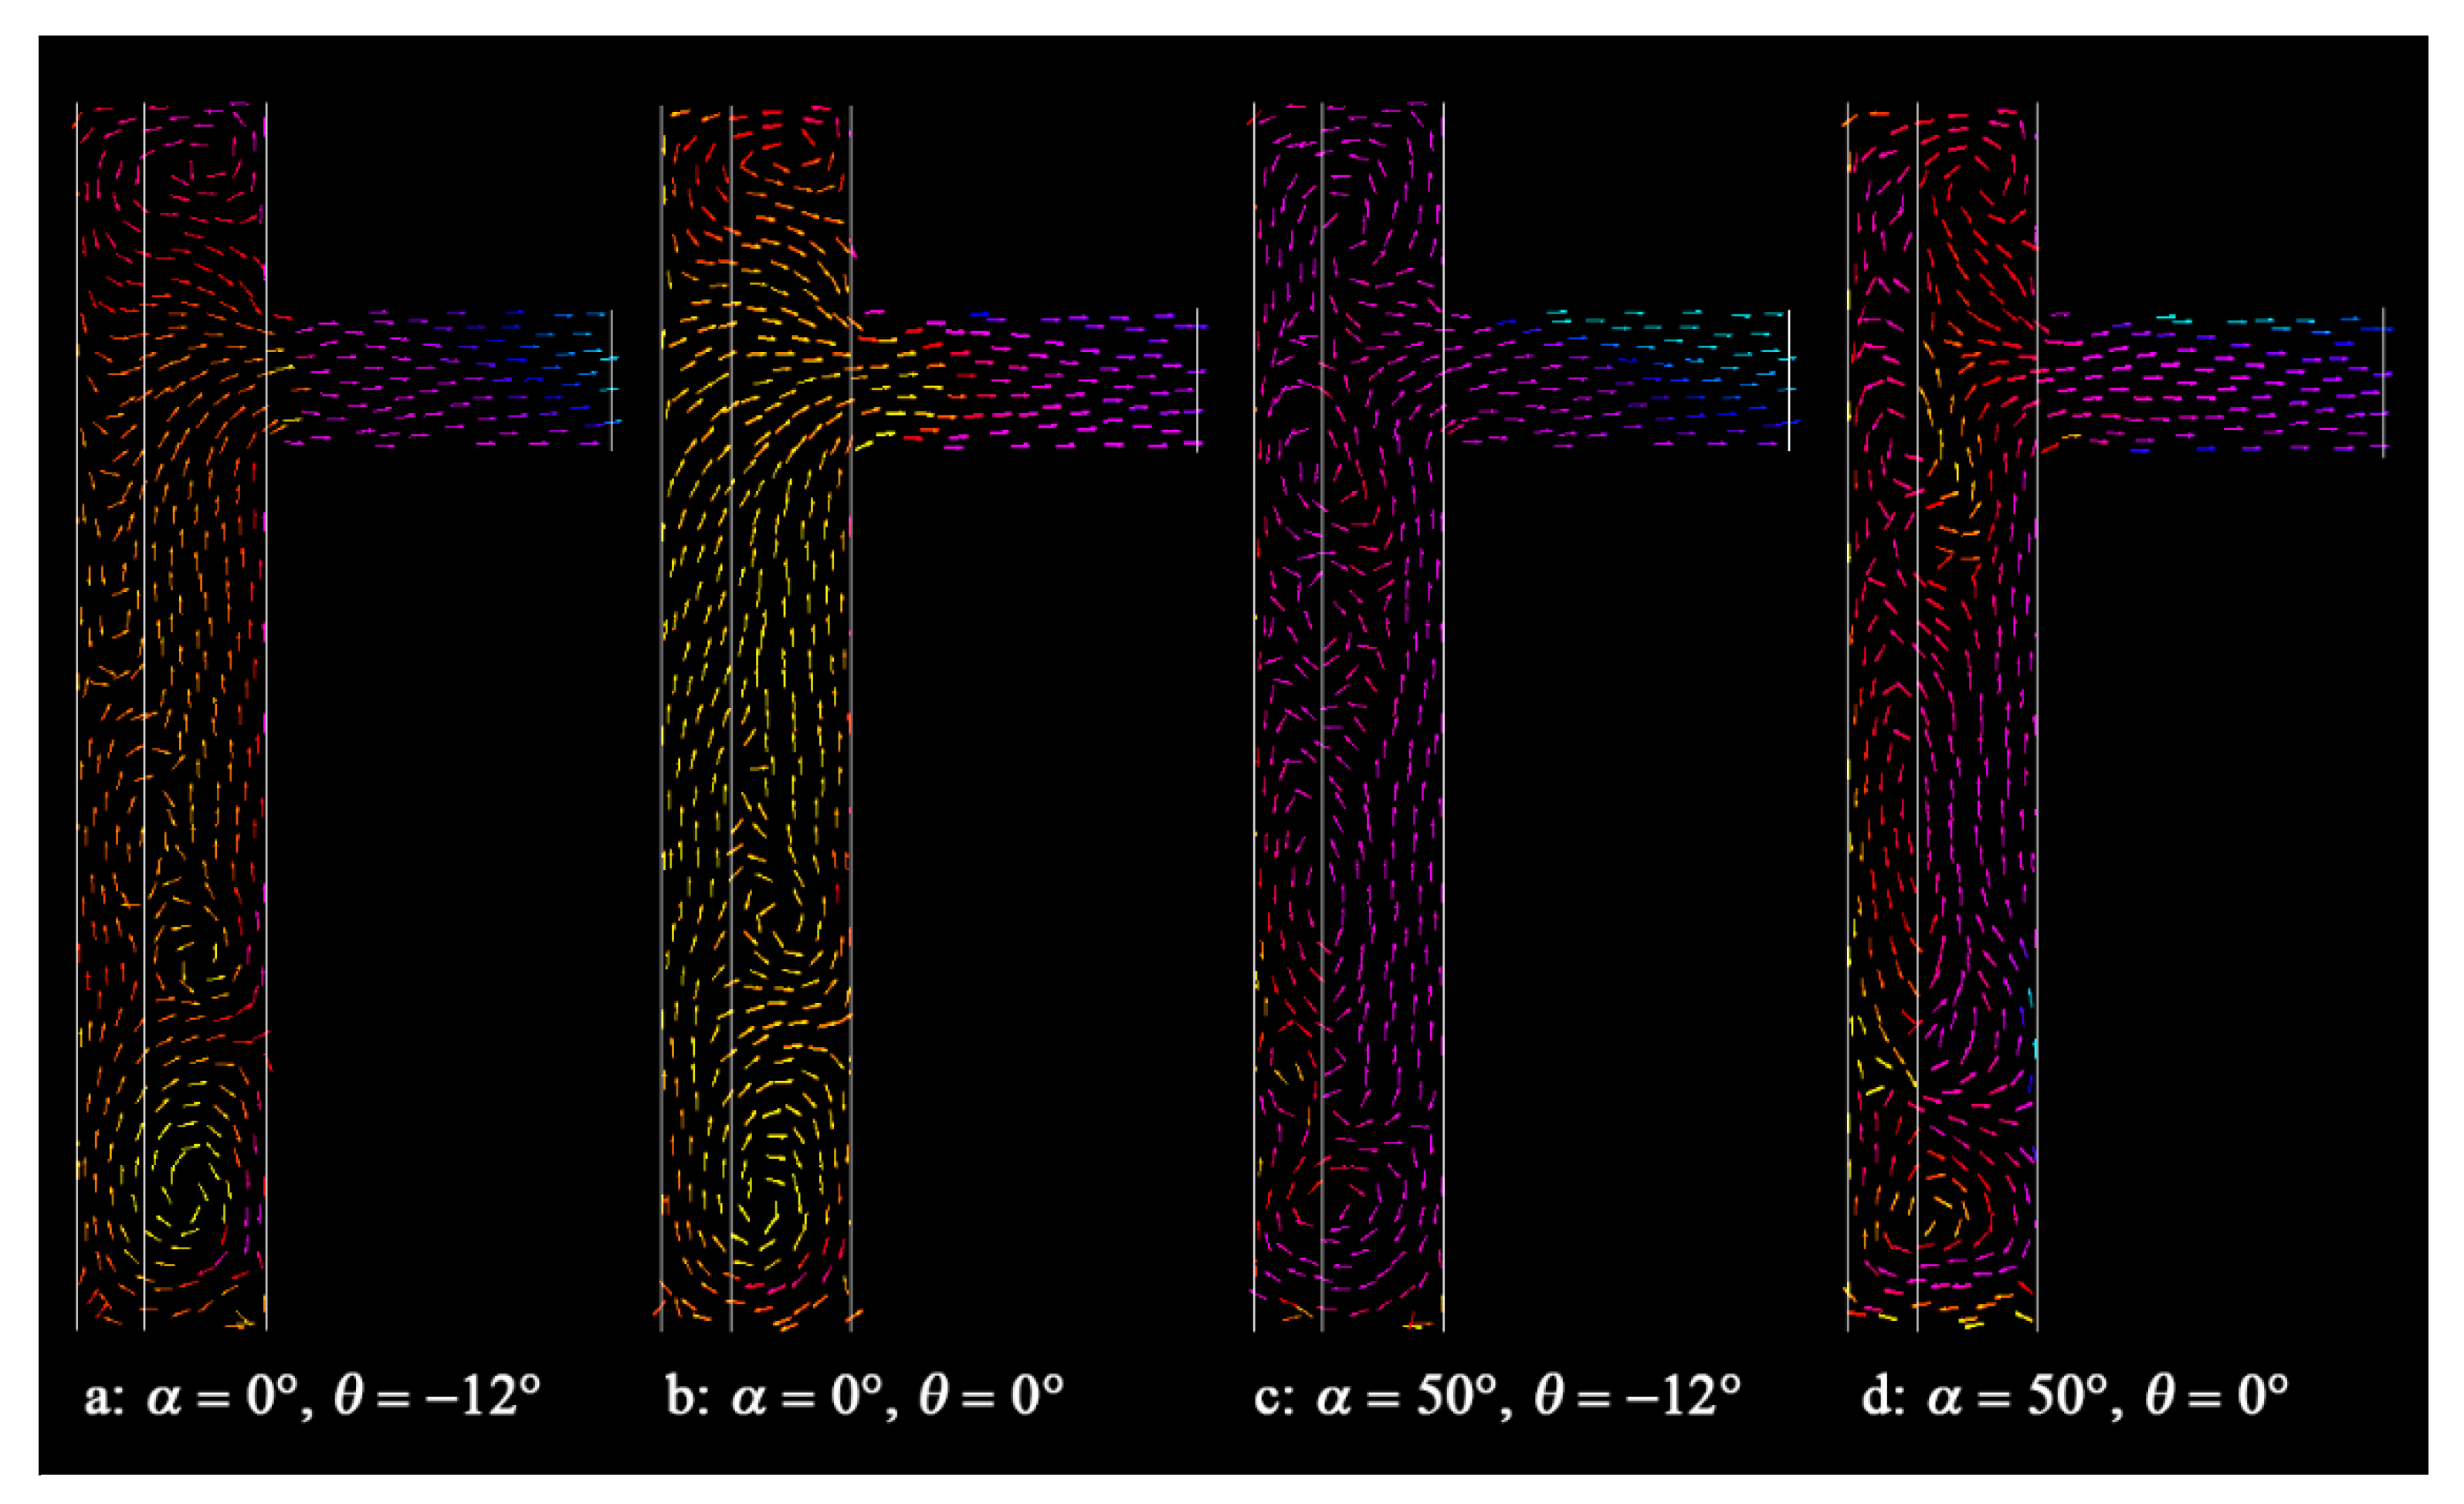
Figure 8b shows the distribution of Cp for each receiver hole. It is also clear from the figure that, when α is small, Cp is distributed relatively uniformly; as α increases, Cp gradually shows an obvious periodicity. The same law as the fluctuation in η, when α is small, the flow is only affected by the discrete nozzle in the low-radius region, while the high-radius region is homogenized by centrifugal force, so Cp,hole_i (i ≠ 0) is equal except Cp,hole_0; as α increases, the effect of the discrete nozzle gradually penetrates the high-radius region, so Cp gradually appears to fluctuate and shows a periodic pattern. Moreover, Cp decreases significantly with the increase in α. When α = 0°, the air flows outward radially near the stator in the low-radius region, while it is the radial inward flow near the stator in the high-radius region (as shown in Figure 11a). The mixing of these two parts of the air can cause large pressure losses. As α increases, the air impacts the rotor less and the mixing effect is also reduced (as shown in Figure 11c), so the pressure loss decreases.
As for hole_0, Cp,hole_0 is smaller than Cp,hole_i (i ≠ 0). Moreover, as α increases, the reduction rate of Cp,hole_0 compared with Cp,hole_i (i ≠ 0) decreases gradually. When increasing α to 70°, Cp,hole_0 even exceeds Cp,hole_i (i ≠ 0). When α = 0°, because the back pressure of hole_0 is lower than hole_i (i ≠ 0), more air flows into hole_0, resulting in the mixing area near the stator almost disappearing (as shown in Figure 11b), so Cp,hole_0 is smaller than Cp,hole_i (i ≠ 0) instead. However, as α increases, the air enters the receiver hole through the rotor boundary layer and the inviscid core, but not through the stator boundary layer. Therefore, hole_0 does not affect the flow structure (as shown in Figure 11d) although its mass flow rate is higher, and the effect on the pressure loss is limited. Continuing to increase α, Cp,hole_0 instead exceeds Cp,hole_i (i ≠ 0); please refer to the next subsection for the reason.
Figure 8c shows the distribution of Cd of each receiver hole for different α. From the figure, it is obvious that Cd increases with increases in α. In general, the closer the β near the receiver hole is to 1, the larger the Cd of the receiver hole is [21]. As α increases, the β near the receiver hole also increases and gradually approaches 1, so Cd increases. Of course, the fluctuation in Cd increases with the increase in α for the same reason as η. Moreover, Cd,hole_0 is larger than Cd,hole_i (i ≠ 0) apparently, because the air inside hole_0 is more compressible. It is worth noting that, as α increases, the increase rate of Cd,hole_0 compared to Cd,hole_i (i ≠ 0) gradually decreases. The Cd,hole_0 is 34.7%, 27.7%, 24.5%, and 20.1% greater than the average of Cd,hole_i (i ≠ 0), when α is 0°, 30°, 50°, and 70°, respectively. This is mainly because the effect of the nozzles increases as α increases, while the effect of receiver holes relatively decreases.
Figure 8d shows the distribution of Θad for different α. From the figure, it can be seen that Θad increases significantly with the increase in α, while the fluctuation in Θad also increases. According to Mahmood [27], Θad is related to the βp as well as the moment of stator:
Θ a d = 2 β p r n o z z l e r h o l e 2 1 M s 0.5 m n o z z l e Ω r h o l e 2
As α increases, βp increases significantly, while the moment of stator does not change much, so the Θad increases. In addition, the Θad,hole_0 is smaller compared to Θad,hole_i (i ≠ 0). According to Equation (13) of the reference [27], the β near hole_0 is larger than that of the other receiver holes, thus leading to its smaller adiabatic efficiency. Meanwhile, it can be seen from the above that, when α is small (e.g., α = 0°), the influence of the receiver hole on the flow is strong, leading to a large difference of Θad between hole_0 and hole_i (i ≠ 0); whereas, when α is large (e.g., α = 50°/70°), the influence of the hole is relatively small, so the Θad,hole_0 is not much different from Θad,hole_i (i ≠ 0).

3.2. Influence of Area Ratio of Nozzles to Holes ξ

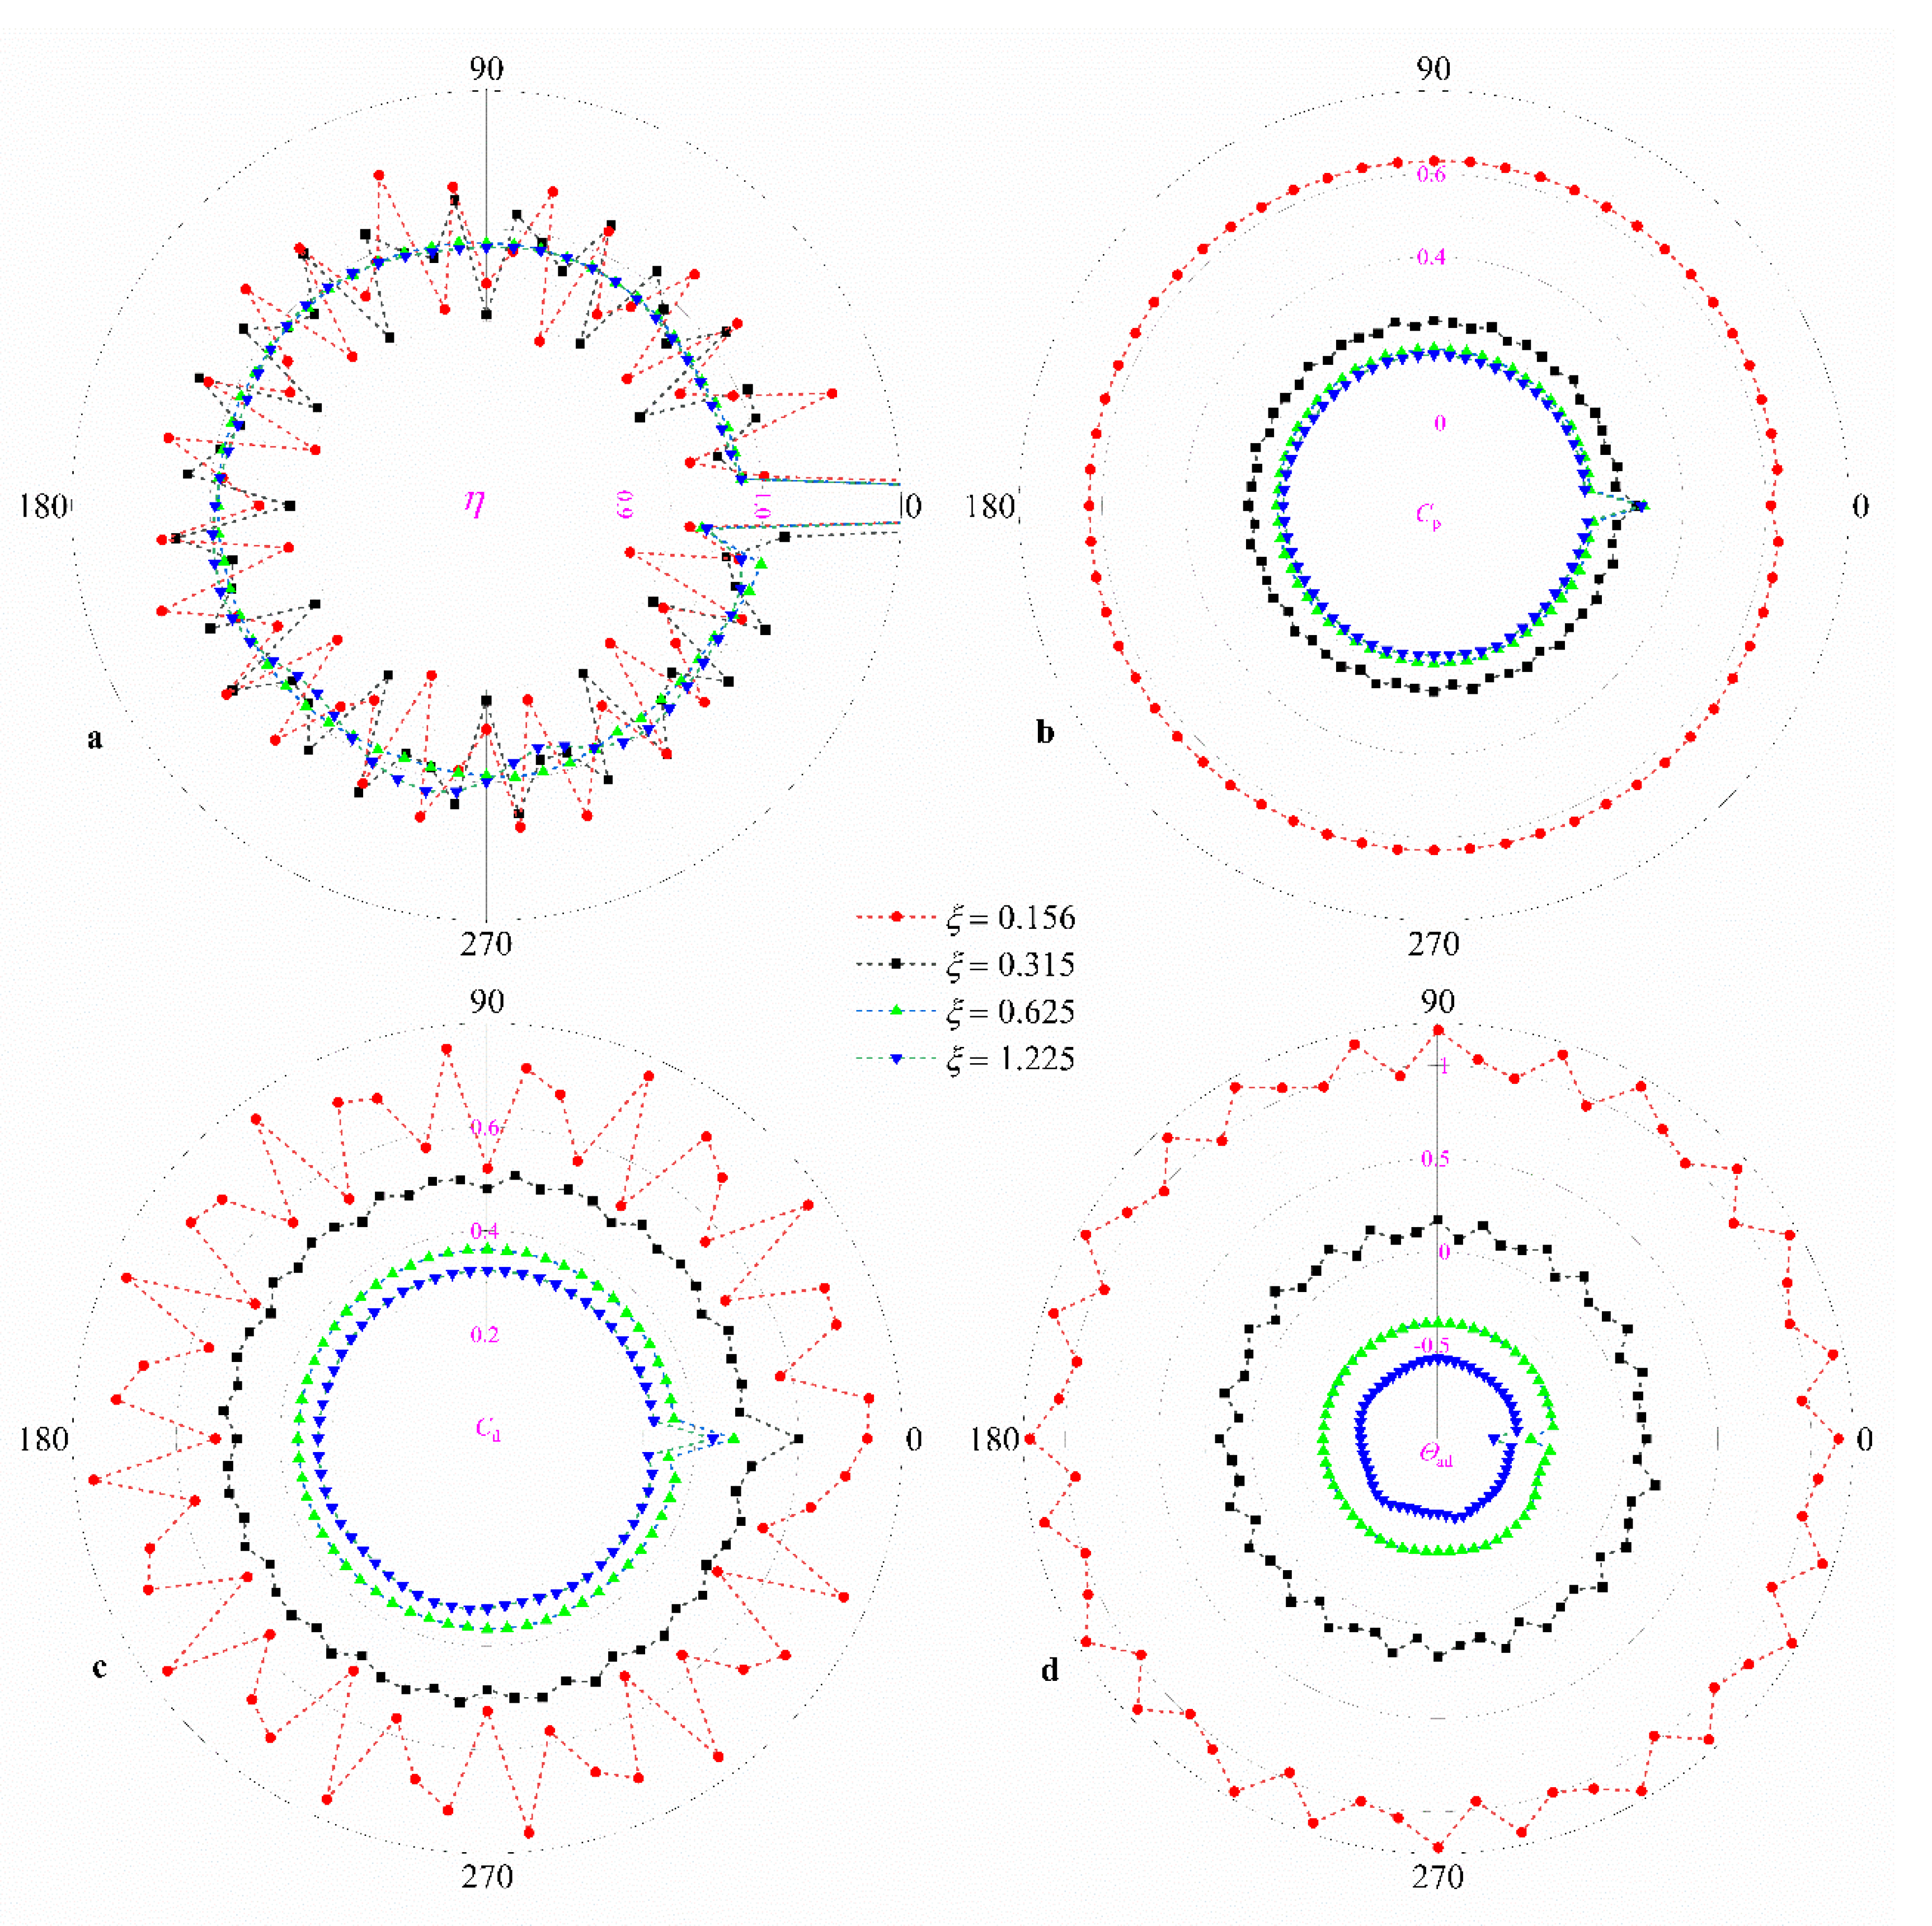
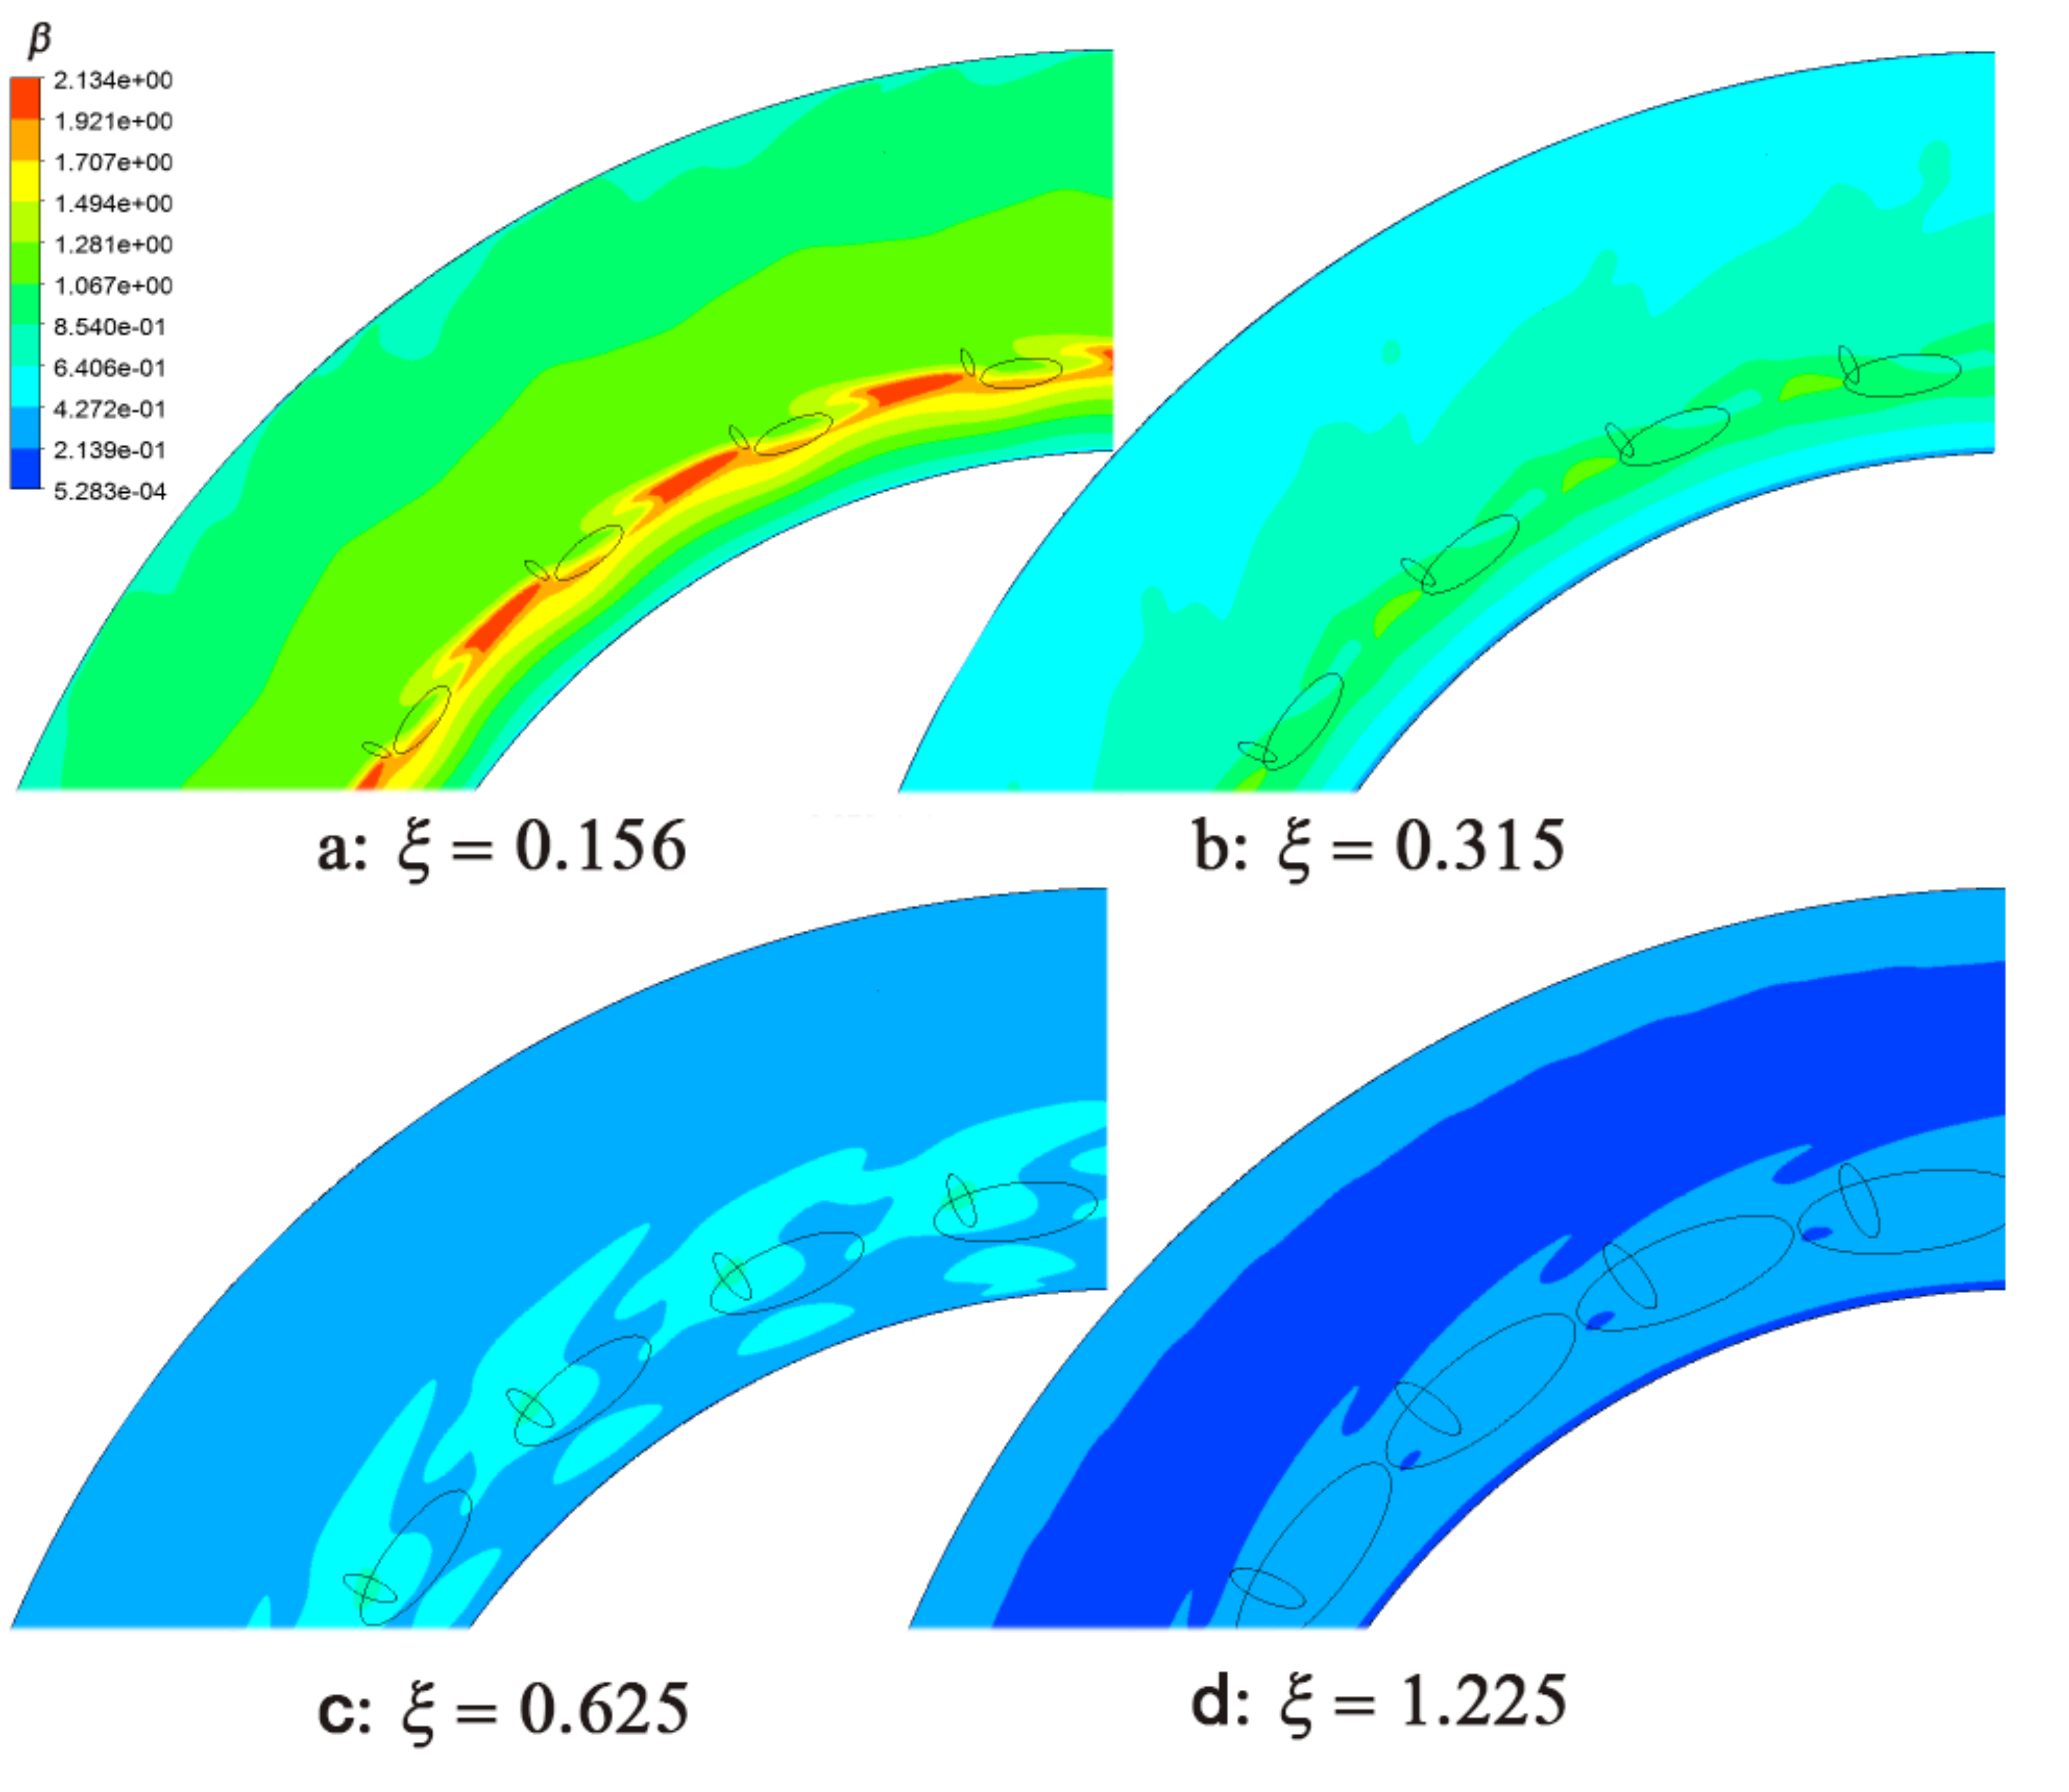
Figure 12a shows the distribution of η for each receiver hole (except hole_0) with different ξ. From the figure, it can be seen that as ξ increases from 0.156 to 0.625, the fluctuation amplitude of η gradually decreases or even disappears, and of course, the fluctuation shows a periodic pattern related to the nozzles. Continuing to increase ξ to 1.225, the η again shows some fluctuations, but mainly in the upstream of hole_0. When ξ is small, the βp is larger, and thus the fluence of discrete nozzles is greater. Therefore, the distribution of η shows a clear periodic fluctuation closely related to the number of nozzles, and the fluctuation decreases as ξ increases. The unevenness caused by the nozzles diminishes, so the distribution tends to level off when ξ increases. Continuing to increase ξ to 1.225, the effect of the receiver holes becomes apparent, and the fluctuations in η in the upstream are due to fluctuations in Cd (shown in Figure 12c) and Coriolis force [18]. As for hole_0, ηhole_0 is 1.711, 1.536, 1.532, and 1.543, when ξ is 0.156, 0.315, 0.625, and 1.225, respectively. Therefore, the effect of ξ on ηhole_0 is minor considering the fluctuations.
Figure 12b shows the distribution of Cp for each receiver hole with different ξ. From the figure, it can be seen that Cp decreases rapidly as ξ increases from 0.156 to 0.315; continuing to increase ξ, Cp still decreases, but the rate of decrease becomes slower. In general, pressure loss always occurs at the throat position. When ξ = 0.156, the pressure loss occurs mainly at the nozzle outlet. Moreover, at this time, the βp is also very large (as shown in Figure 13a), resulting in work performed by the air to the rotor. Therefore, when ξ = 0.156, the Cp is large. When ξ increases from 0.156 to 0.315, the pressure loss of the nozzle decreases, and the work performed by the air on the rotor also changes to work performed by the rotor on the air, so Cp decreases rapidly. When ξ continues to increase, the pressure loss of the nozzle outlet continues to decrease, while the pressure loss in the cavity and receiver hole does not change much. Therefore, as ξ increases, Cp also decreases, but the rate of reduction slows down significantly.
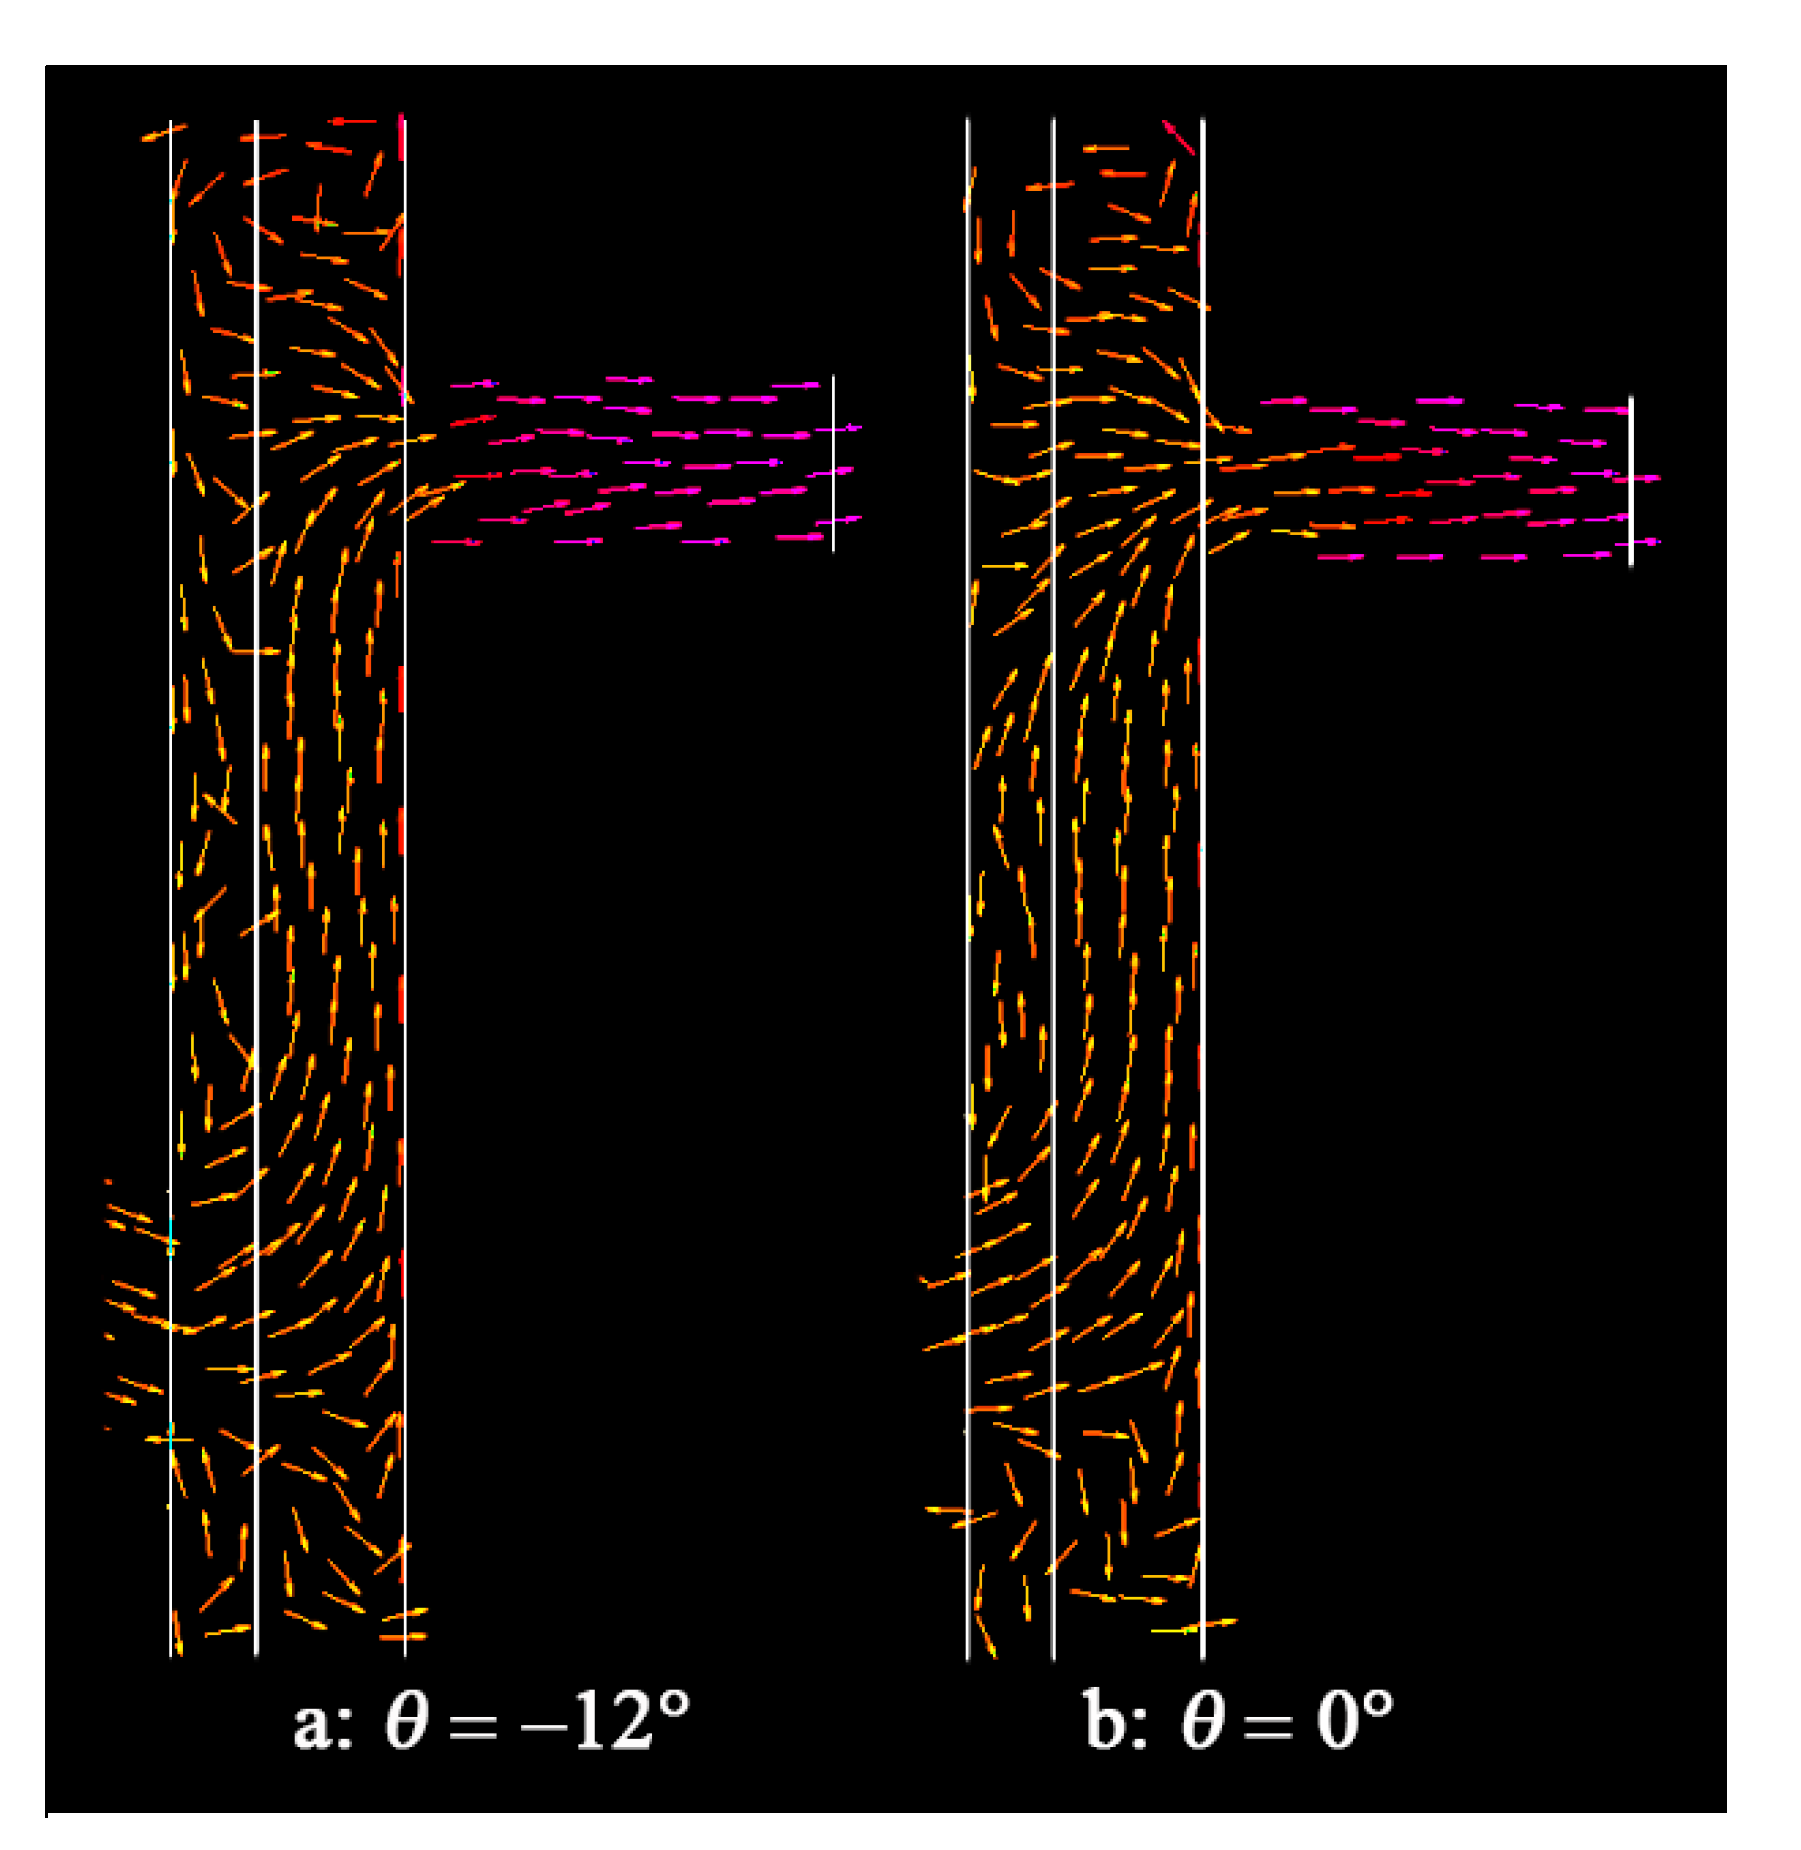
Regarding hole_0, it is obvious from the figure that the Cp,hole_0 decreases and then increases with increasing ξ compared to Cp,hole_i (i ≠ 0), and the increase rate increases with increasing ξ. When ξ = 0.156, the β of the air is large, even exceeding the rotor. Due to the lower outlet pressure of hole_0, the air flows to hole_0 are smoother than hole_i (i ≠ 0), and therefore Cp,hole_0 is lower than Cp,hole_i (i ≠ 0). When ξ is increased, the impact of air on the rotor is weakened, while the effect of the receiver hole becomes more and more significant. For example, when ξ = 1.225 (as shown in Figure 14), the mass flow rate of hole_0 increases more than the other receiver holes, which causes the radial velocity in some areas near the stator to become radially outward, and therefore the air mixing is stronger, so Cp,hole_0 is larger than Cp,hole_i (i ≠ 0), and the increase rate also increases with ξ.
Figure 12c,d shows the distribution of Cd and Θad of each receiver hole with different ξ. It can be seen from the figure that, when ξ is small, the distribution of both has a more obvious periodic fluctuation pattern; as ξ increases, the receiver holes except hole_0 do not differ much, and the distribution of Cd and Θad are both more uniform. This is obviously due to the opposite effect of the nozzle and the receiver hole in different cases. Furthermore, as ξ increases, Cd and Θad decrease. As for hole_0, the variation in Cd and Θad relative to the other receiver holes increases with increasing ξ. This is because the influence of the nozzle decreases while the influence of the receiver hole increases.

3.3. Influence of Gap Ratio G

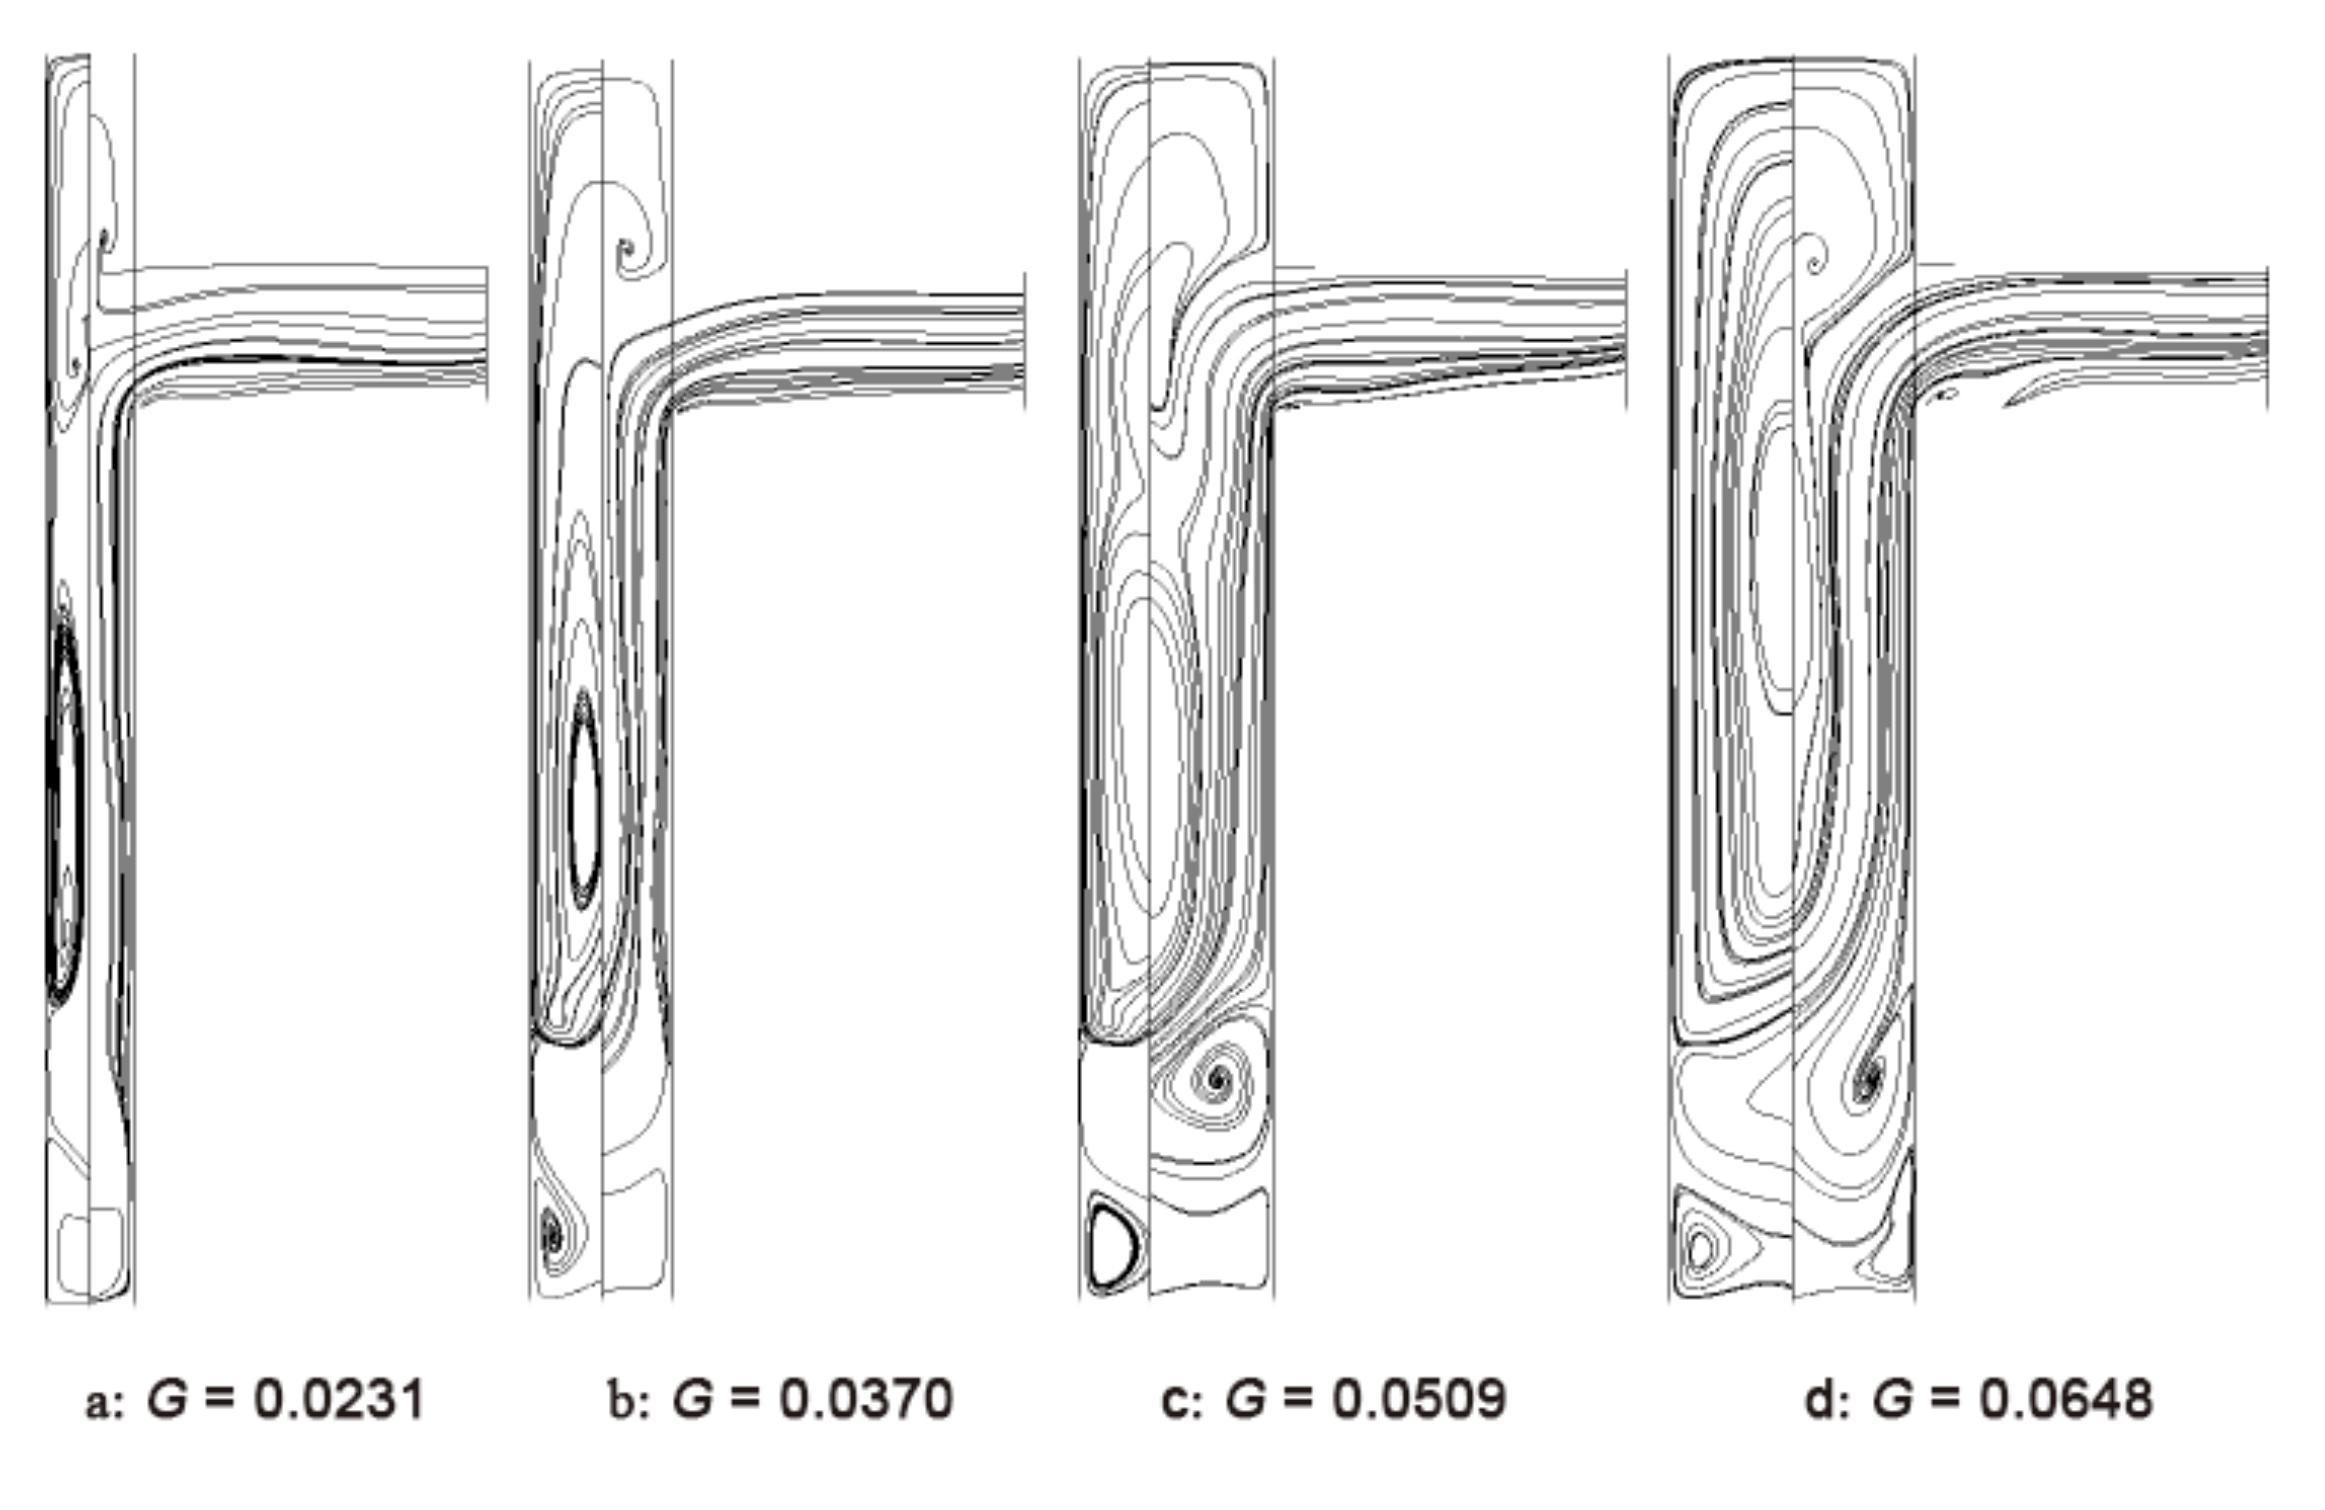
Figure 15a shows the distribution of η for each receiver hole (except hole_0) with different G. From the figure, it can be seen that the distribution of η shows a periodic pattern except for hole_0. Especially when G = 0.0509, the fluctuation amplitude is the largest. When G is small or larger, there are two vortexes in low and high radius, and the flow structures are relatively stable (shown in Figure 16a,d, whose flow structures are not changed with θ). Only when G is of moderate size (e.g., G = 0.0509) does the transition area of the two vortexes becomes unstable, and the relative position of the nozzle to the hole can affect its flow structure. For example, for G = 0.0509, the flow structures at the three tangential positions of θ = −24° (shown in Figure 17a), θ = −18° (shown in Figure 17b), and θ = −12° (shown in Figure 16c) are not the same, which shows the instability of the flow structure. This results in large fluctuations in η. As for hole_0, ηhole_0 is 1.545, 1.563, 1.536, and 1.556, when G is 0.0231, 0.0370, 0.0509, and 0.0648, respectively. The effect of G on ηhole_0 is almost negligible.
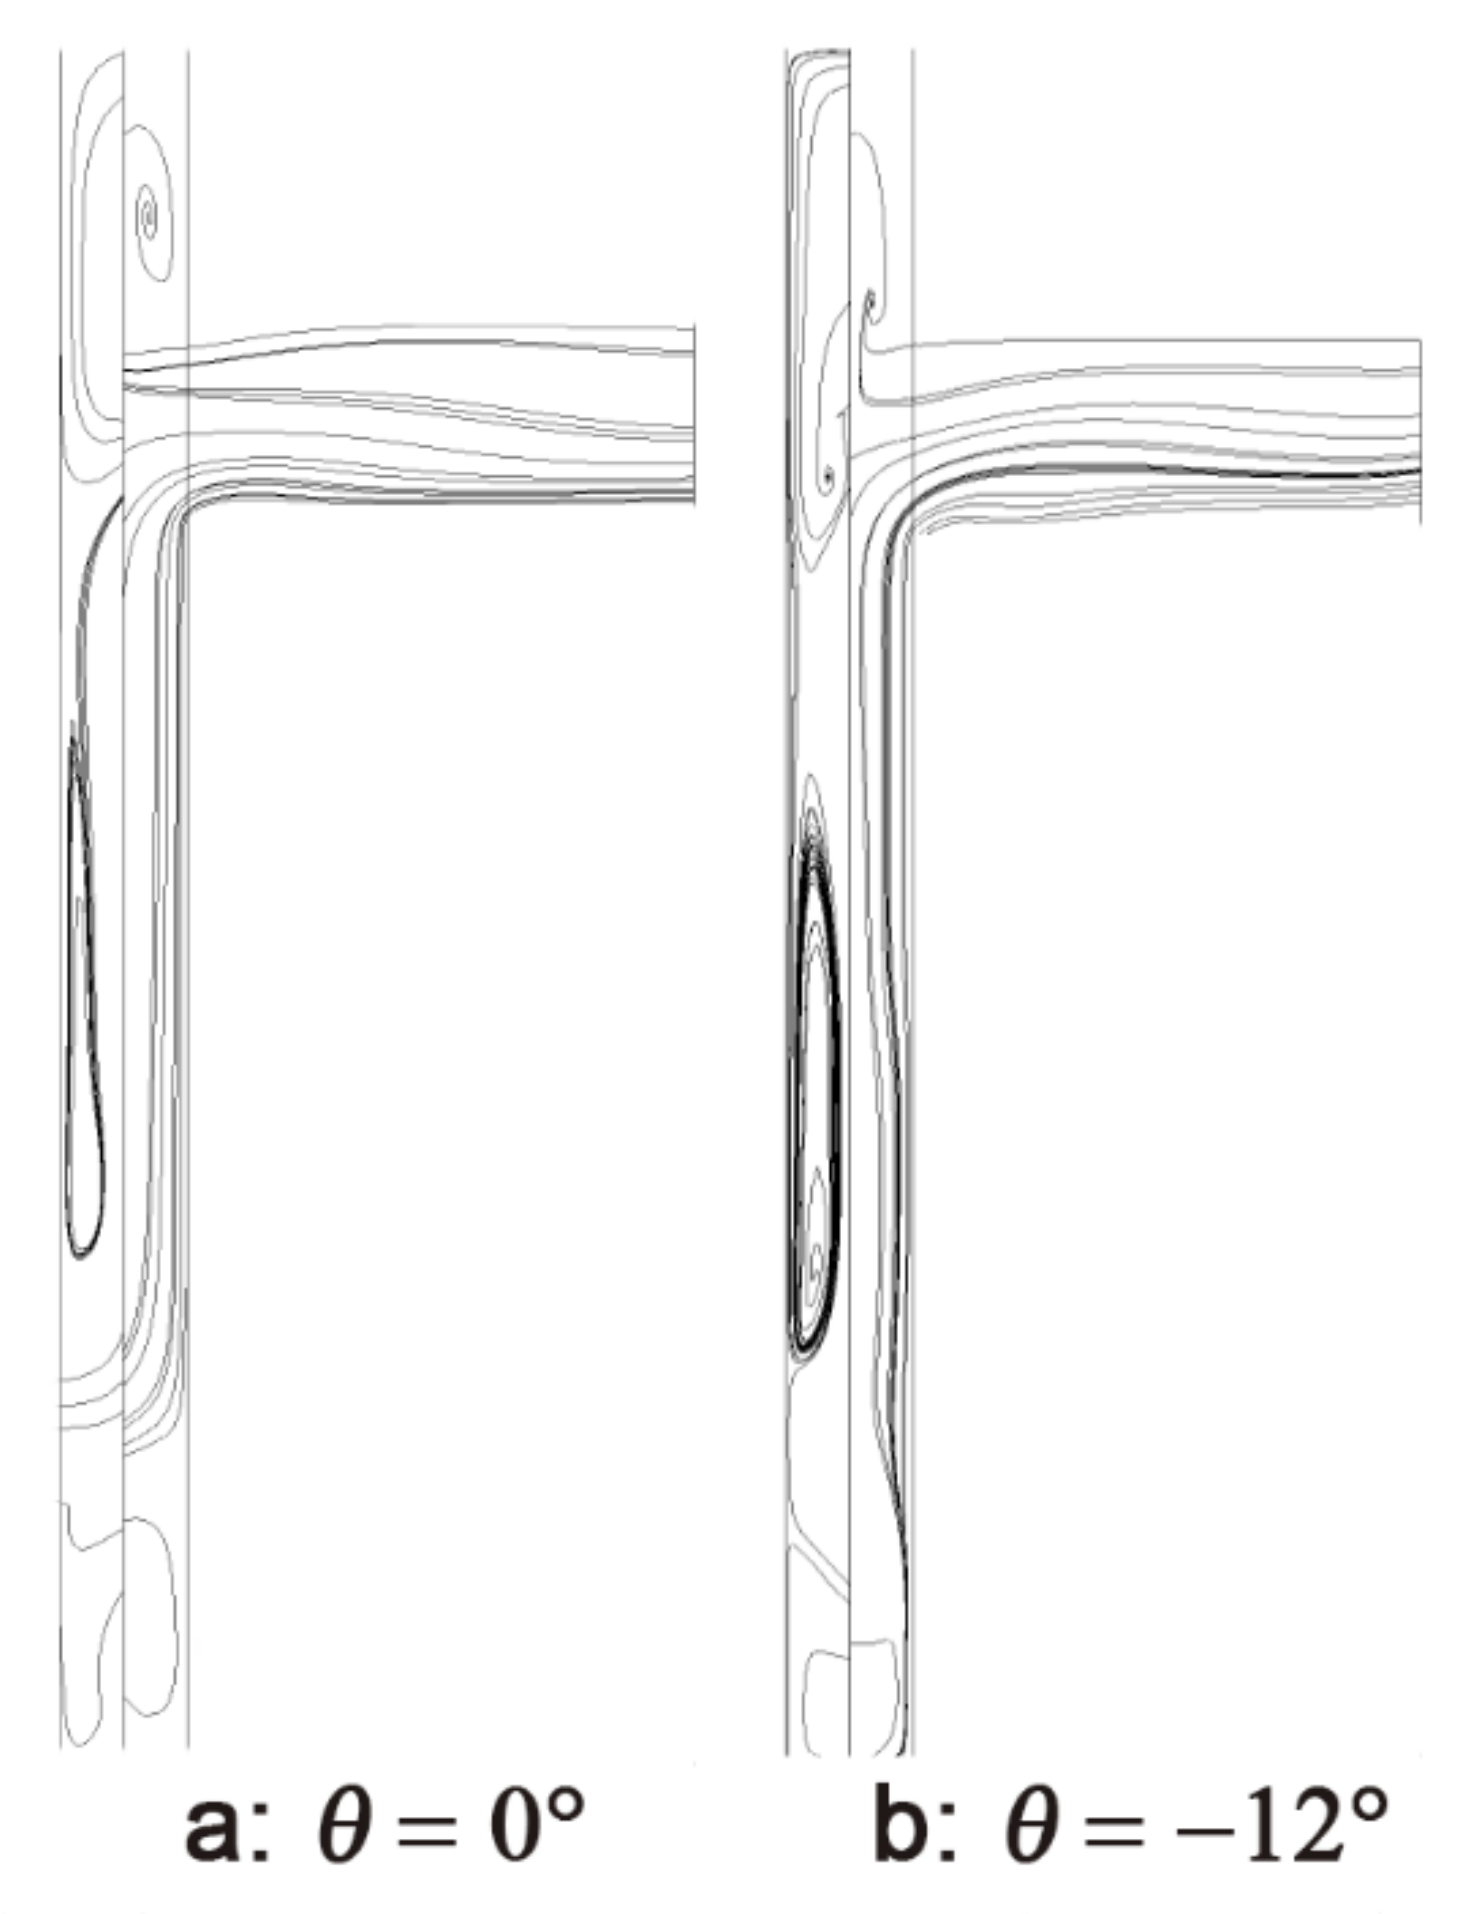
Figure 15b shows the distribution of Cp for each receiver hole with different G. It is obvious from the figure that Cp decreases as G increases. When G is small, the air impacts the rotor, and the fluid in the cavity is strongly mixed, resulting in a large pressure loss. With the increase in G, the impact decreases and the pressure loss decreases. As for hole_0, Cp,hole_0 is larger than Cp,hole_i (i ≠ 0). Specifically, Cp,hole_0 is 21.7%, 19.4%, 17.9%, and 17.1% larger than the average values of Cp,hole_i (i ≠ 0), when G is 0.0231, 0.0370, 0.0509, and 0.0648, respectively. It can be seen that the increase rate of Cp,hole_0 decreases slightly with increases in G. When G = 0.0231, the distance between rotor and stator is smaller. As more air flows to hole_0, it squeezes the space of the vortex in the cavity (as shown in Figure 18a), which causes some air to flow radially outward near the stator as well. This leads to more intense mixing near the stator, resulting in greater pressure loss. This phenomenon diminishes a lot as G increases, so the increase rate of Cp,hole_0 decreases. When G continues to increase, the increase rate of Cp,hole_0 seems to be gradually stabilized.
Figure 15c shows the distribution of Cd of each receiver hole with different G. As can be seen from the figure, Cd decreases as G increases. From Figure 19, it can be seen that as G increases, the β decreases, and therefore Cd decreases. In addition, Cd,hole_0 is significantly larger than Cd,hole_i (i ≠ 0), and the increase rate of Cd,hole_0 compared to Cd,hole_i (i ≠ 0) decreases with increases in G. Specifically, Cd,hole_0 increases by 27.5%, 23.2%, 20.1%, and 23.8%, respectively, compared to the average of Cd,hole_i (i ≠ 0) when G is 0.0231, 0.0370, 0.0509, and 0.0648. It can also be seen from Figure 19 that, for larger G, the difference of β between hole_0 and hole_i (i ≠ 0) is small, and therefore the increase rate of Cd,hole_0 is relatively small. Another point worth noting is that Cd fluctuates with a middle G (G = 0.037/0.0509), while it is evenly distributed when G is small or large. This is the same law as the fluctuation in η. When G is in the middle position, the flow structure is relatively unstable, thus causing the fluctuation in Cd to show periodicity.
Figure 15d shows the distribution of Θad for each receiver hole with different G. As can be seen from the figure, Θad increases with increases in G. The change in G hardly affects the βp but affects the moment of the stator. When G is small, the velocity gradient of the boundary layer is larger, and therefore the frictional moment is relatively large. The effect of this friction reduces the Θad, making the Θad decrease. Θad,hole_0 is smaller than Θad,hole_i (i ≠ 0), but the reduction rate is significantly influenced by the distribution pattern of the Θad.

3.4. Influence of Radius Ratio of Nozzles to Holes δ

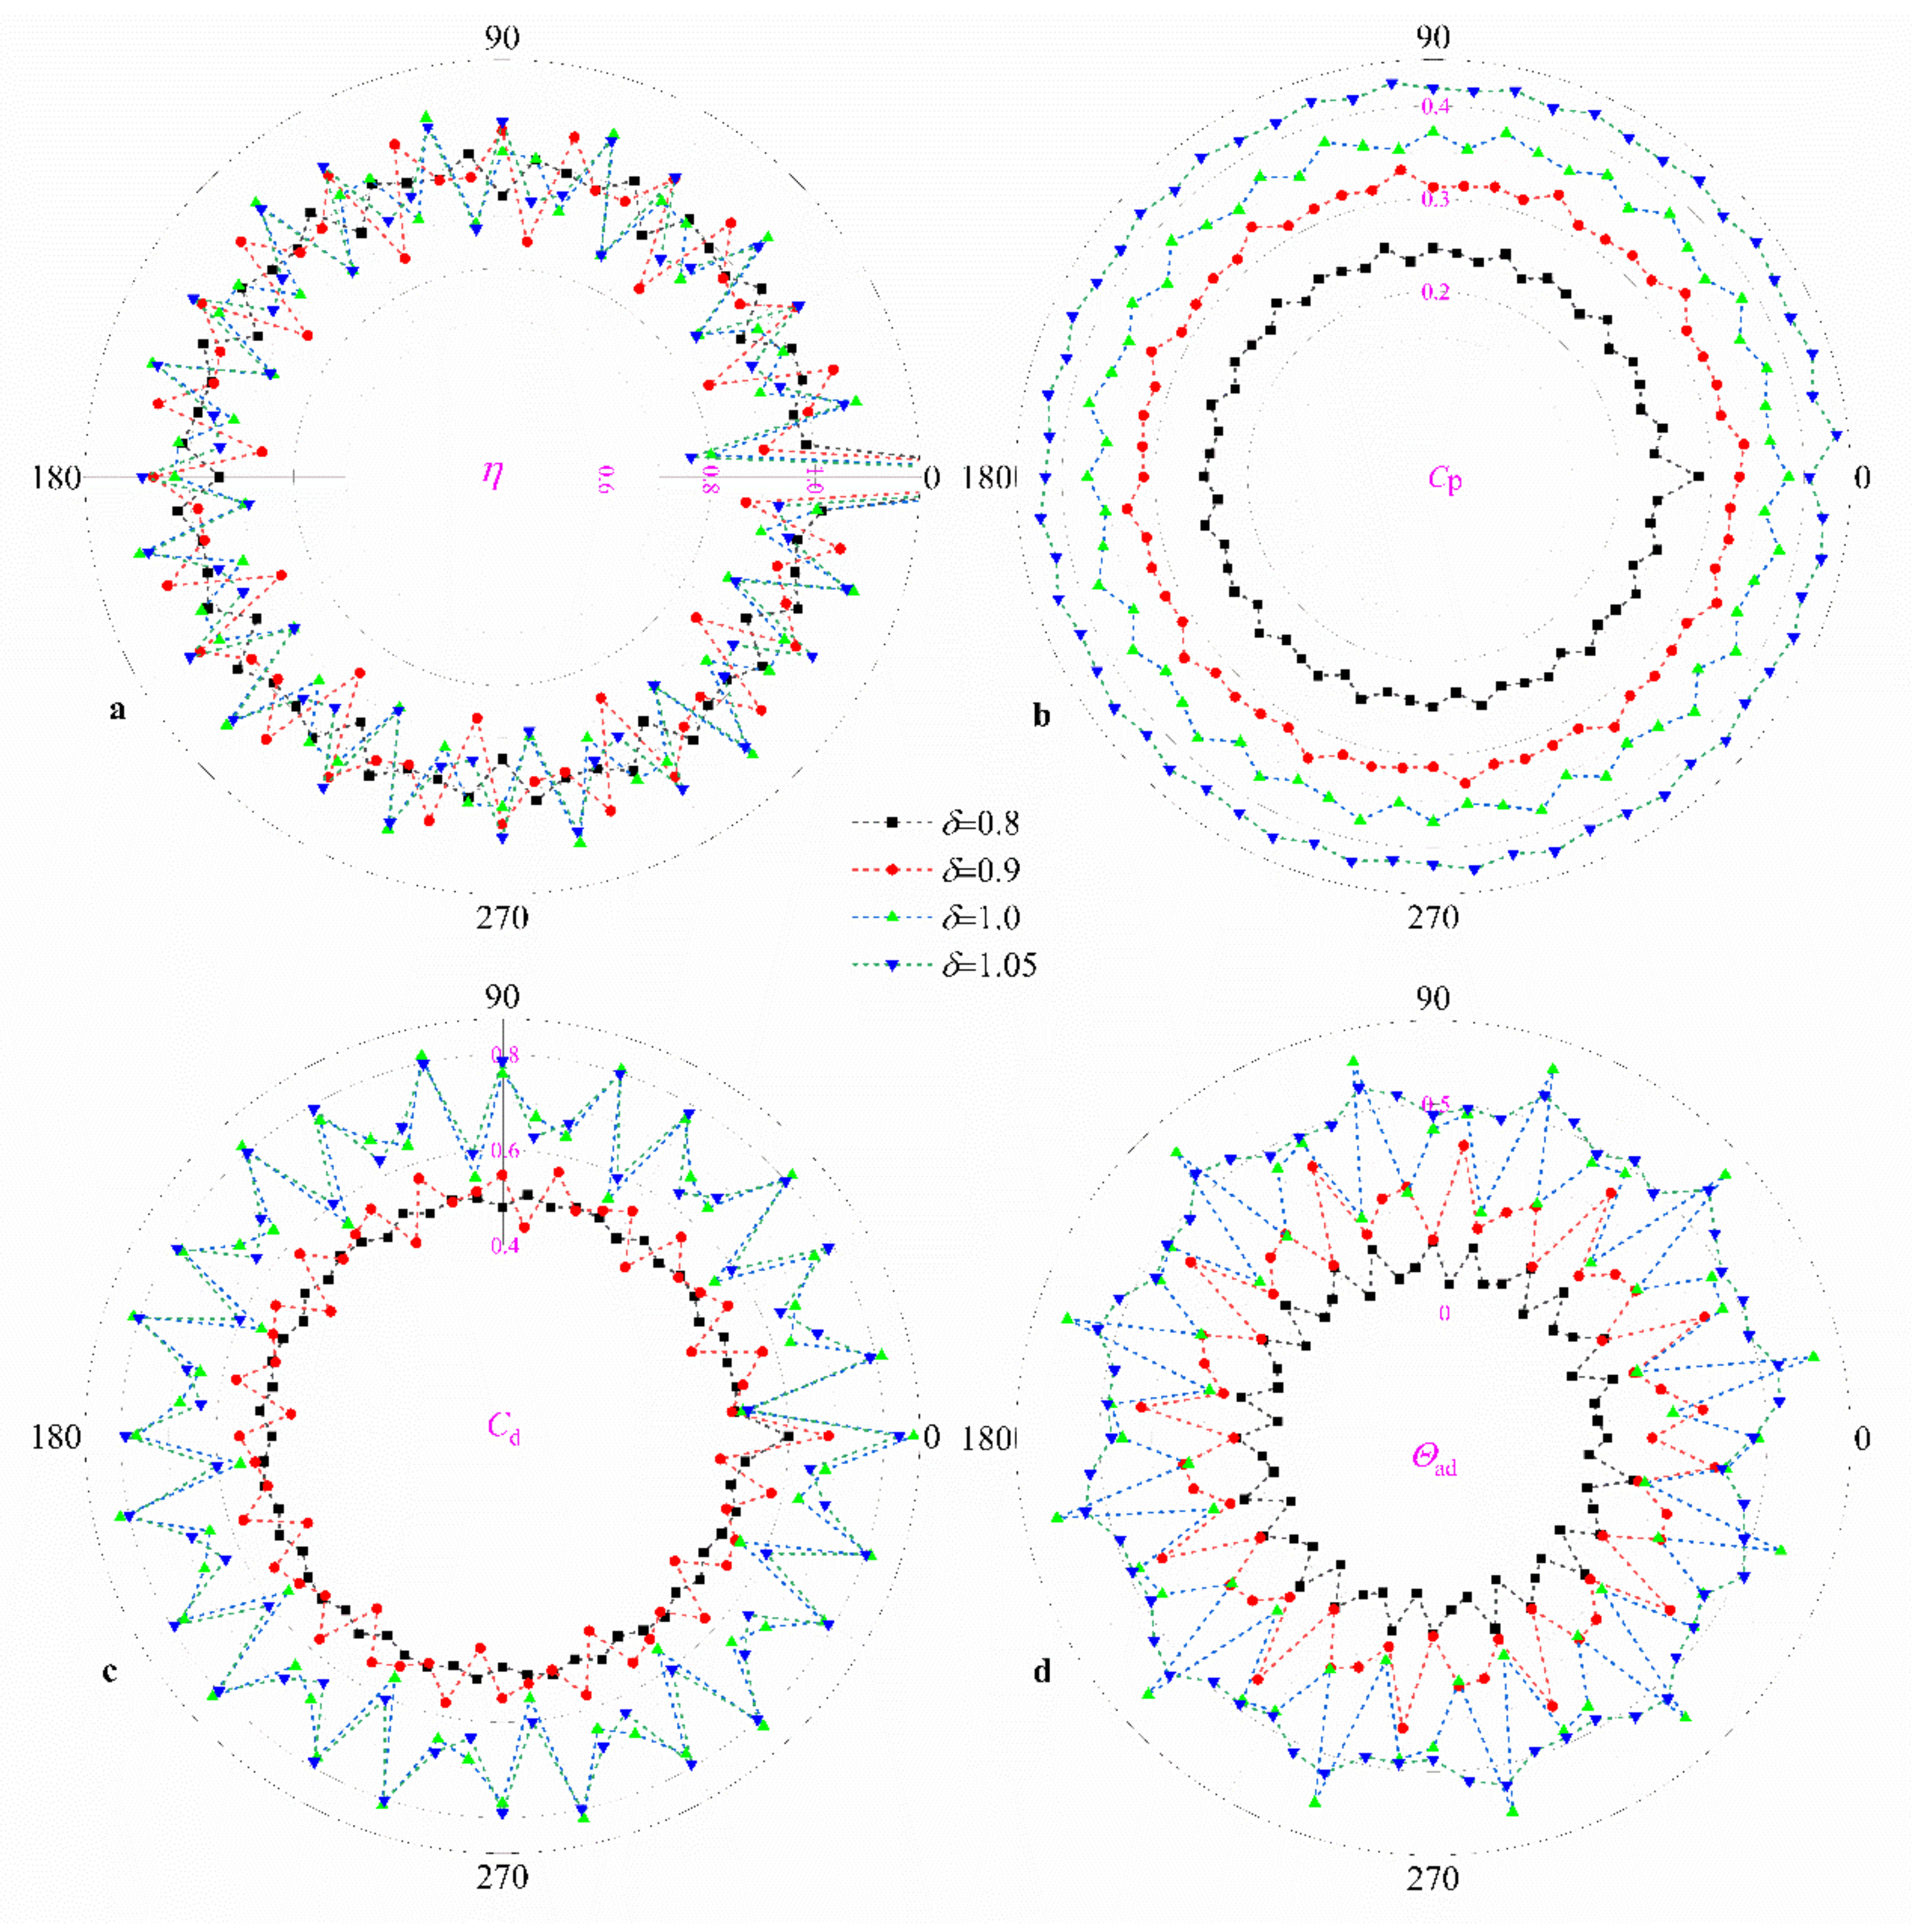
Figure 20a shows the distribution of η for each receiver hole (except hole_0) for different δ. As can be seen from the figure, there are larger fluctuations when δ is closer to 1. This is because, when the difference in radial position between the nozzle and hole is large, the air flows along with the rotor to receiver holes, and the nozzle also has less influence. However, when the radial positions are closed, the air can be injected directly into the receiver holes. It is, therefore, more susceptible to discrete nozzles and exhibits greater fluctuations. The ηhole_0 is 1.536, 1.695, 1.698, and 1.739 when δ is 0.8, 0.9, 1.0, and 1.05, respectively. It can be seen that the increase rate of ηhole_0 compared to ηhole_i (i ≠ 0) increases with increases in δ. Figure 21 shows the streamlines on a cylindrical surface of r* = 0.926, from which it can be seen that, as δ increases, the air can flow directly into hole_0 (this is also supported by the study of Lewis et al. [6]), leading to a greater increase in ηhole_0.
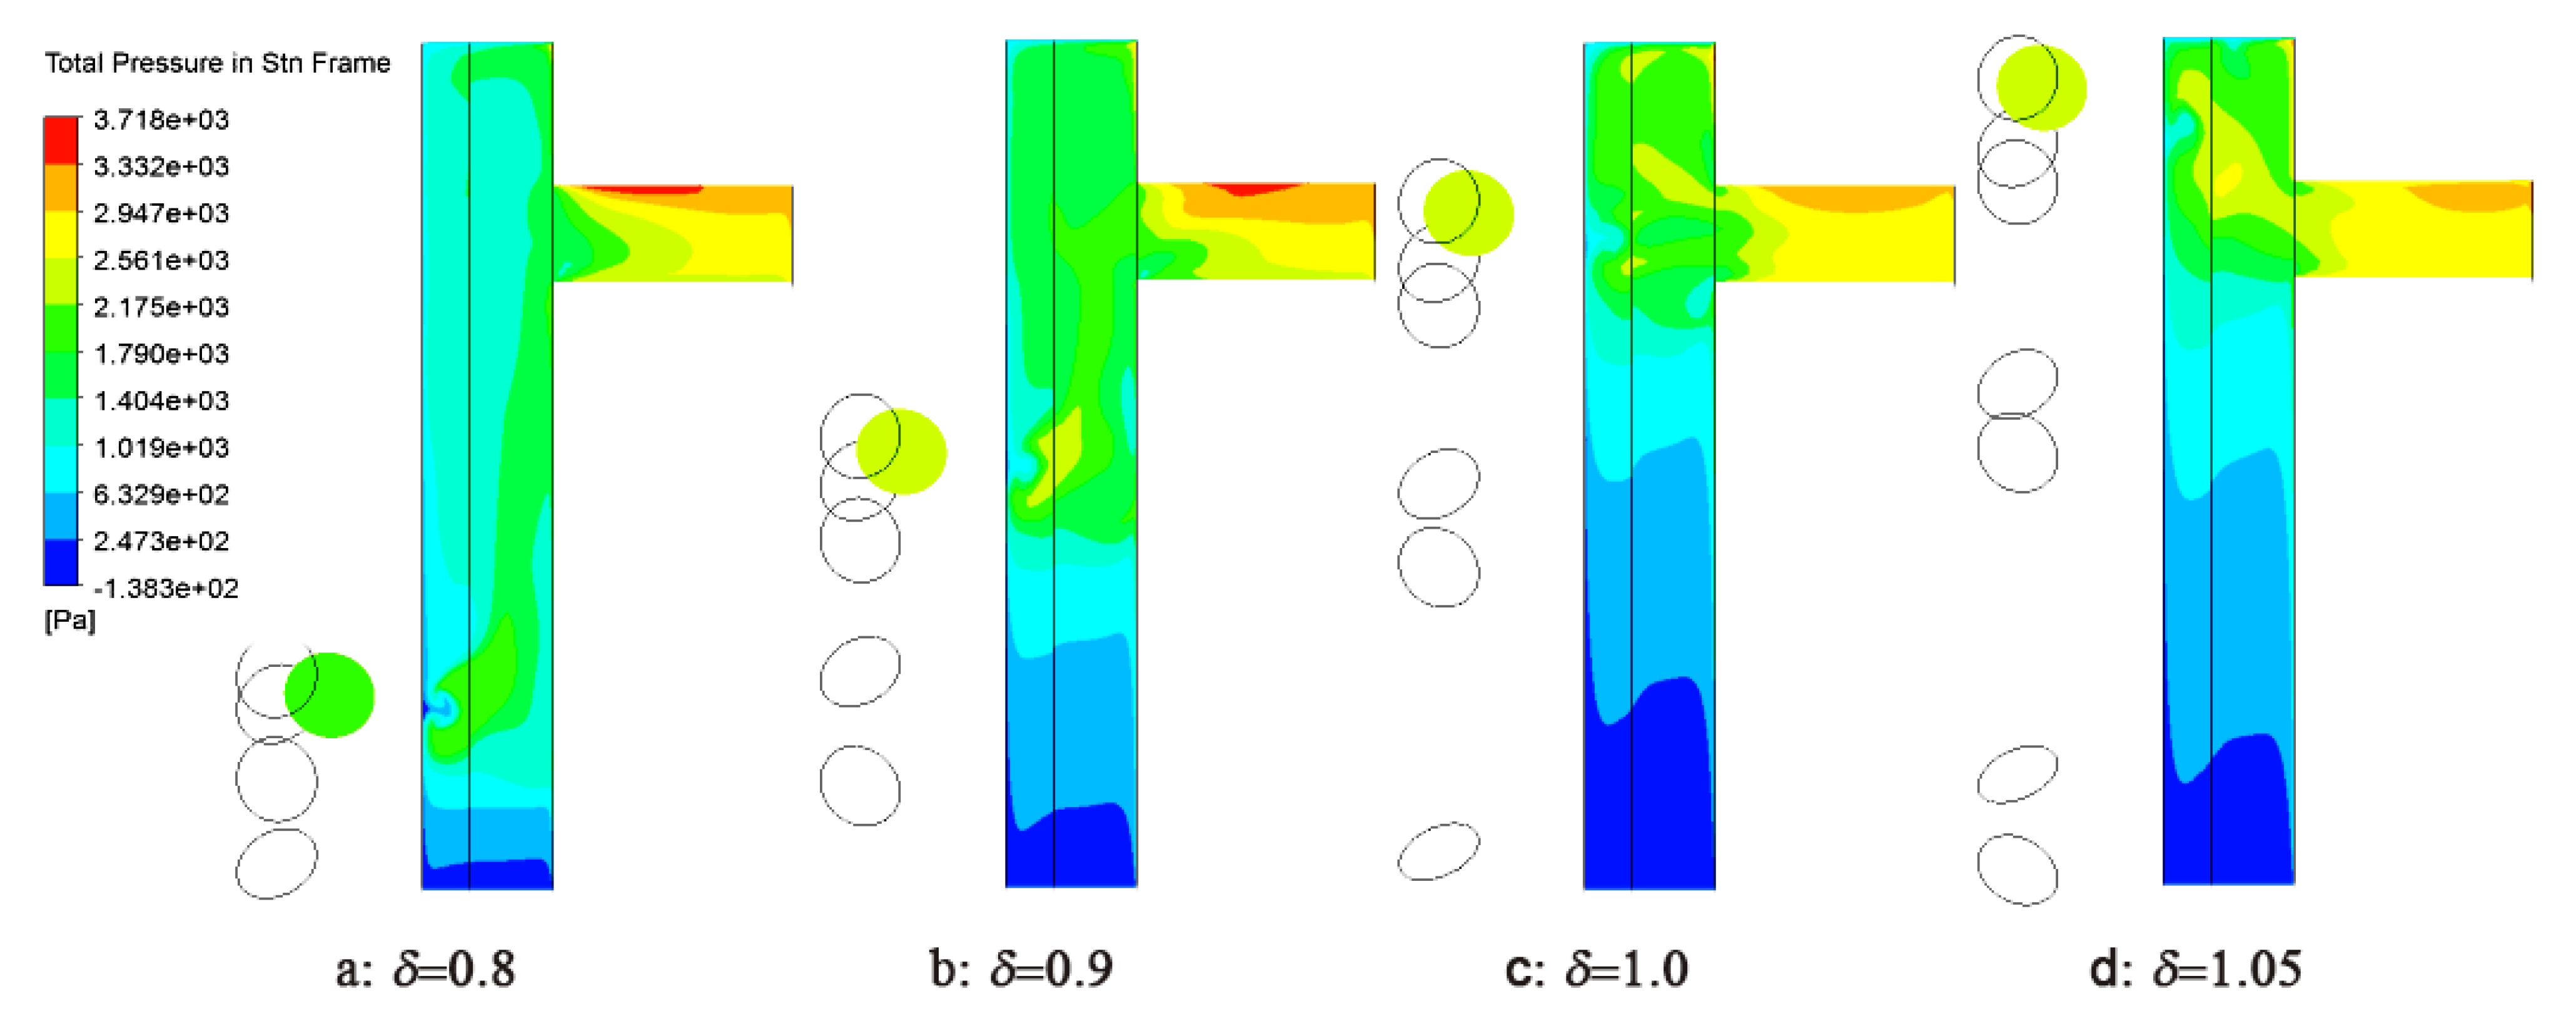
Figure 20b shows the distribution of Cp of each receiver hole for different δ. From the figure, it can be seen that Cp increases with increases in δ. For the stator-rotor system with centrifugal through-flow, the pressure in the cavity is higher at the high-radius position than that at the low-radius position. Therefore, as δ increases, the total pressure of the nozzle inlet must increase (as shown in Figure 22). Moreover, the pressure at the outlet of the receiver hole is the same. Therefore, as δ increases, the Cp must also increase. As for hole_0, the increase in Cp,hole_0 compared to Cp,hole_i (i ≠ 0) decreases gradually with increases inδ. From the analysis above, it is clear that Cp,hole_0 is larger than Cp,hole_i (i ≠ 0) when δ is small. When is increased, the pressure loss of the nozzles also increases, while the pressure loss of the receiver hole does not change much, so Cp,hole_0 gradually equals Cp,hole_i (i ≠ 0). When δ is increased further (e.g., for δ = 1.05), the flow separation at the inlet of hole_0 decreases significantly (as shown in Figure 21d), and therefore the Cp,hole_0 is smaller than Cp,hole_i (i ≠ 0).
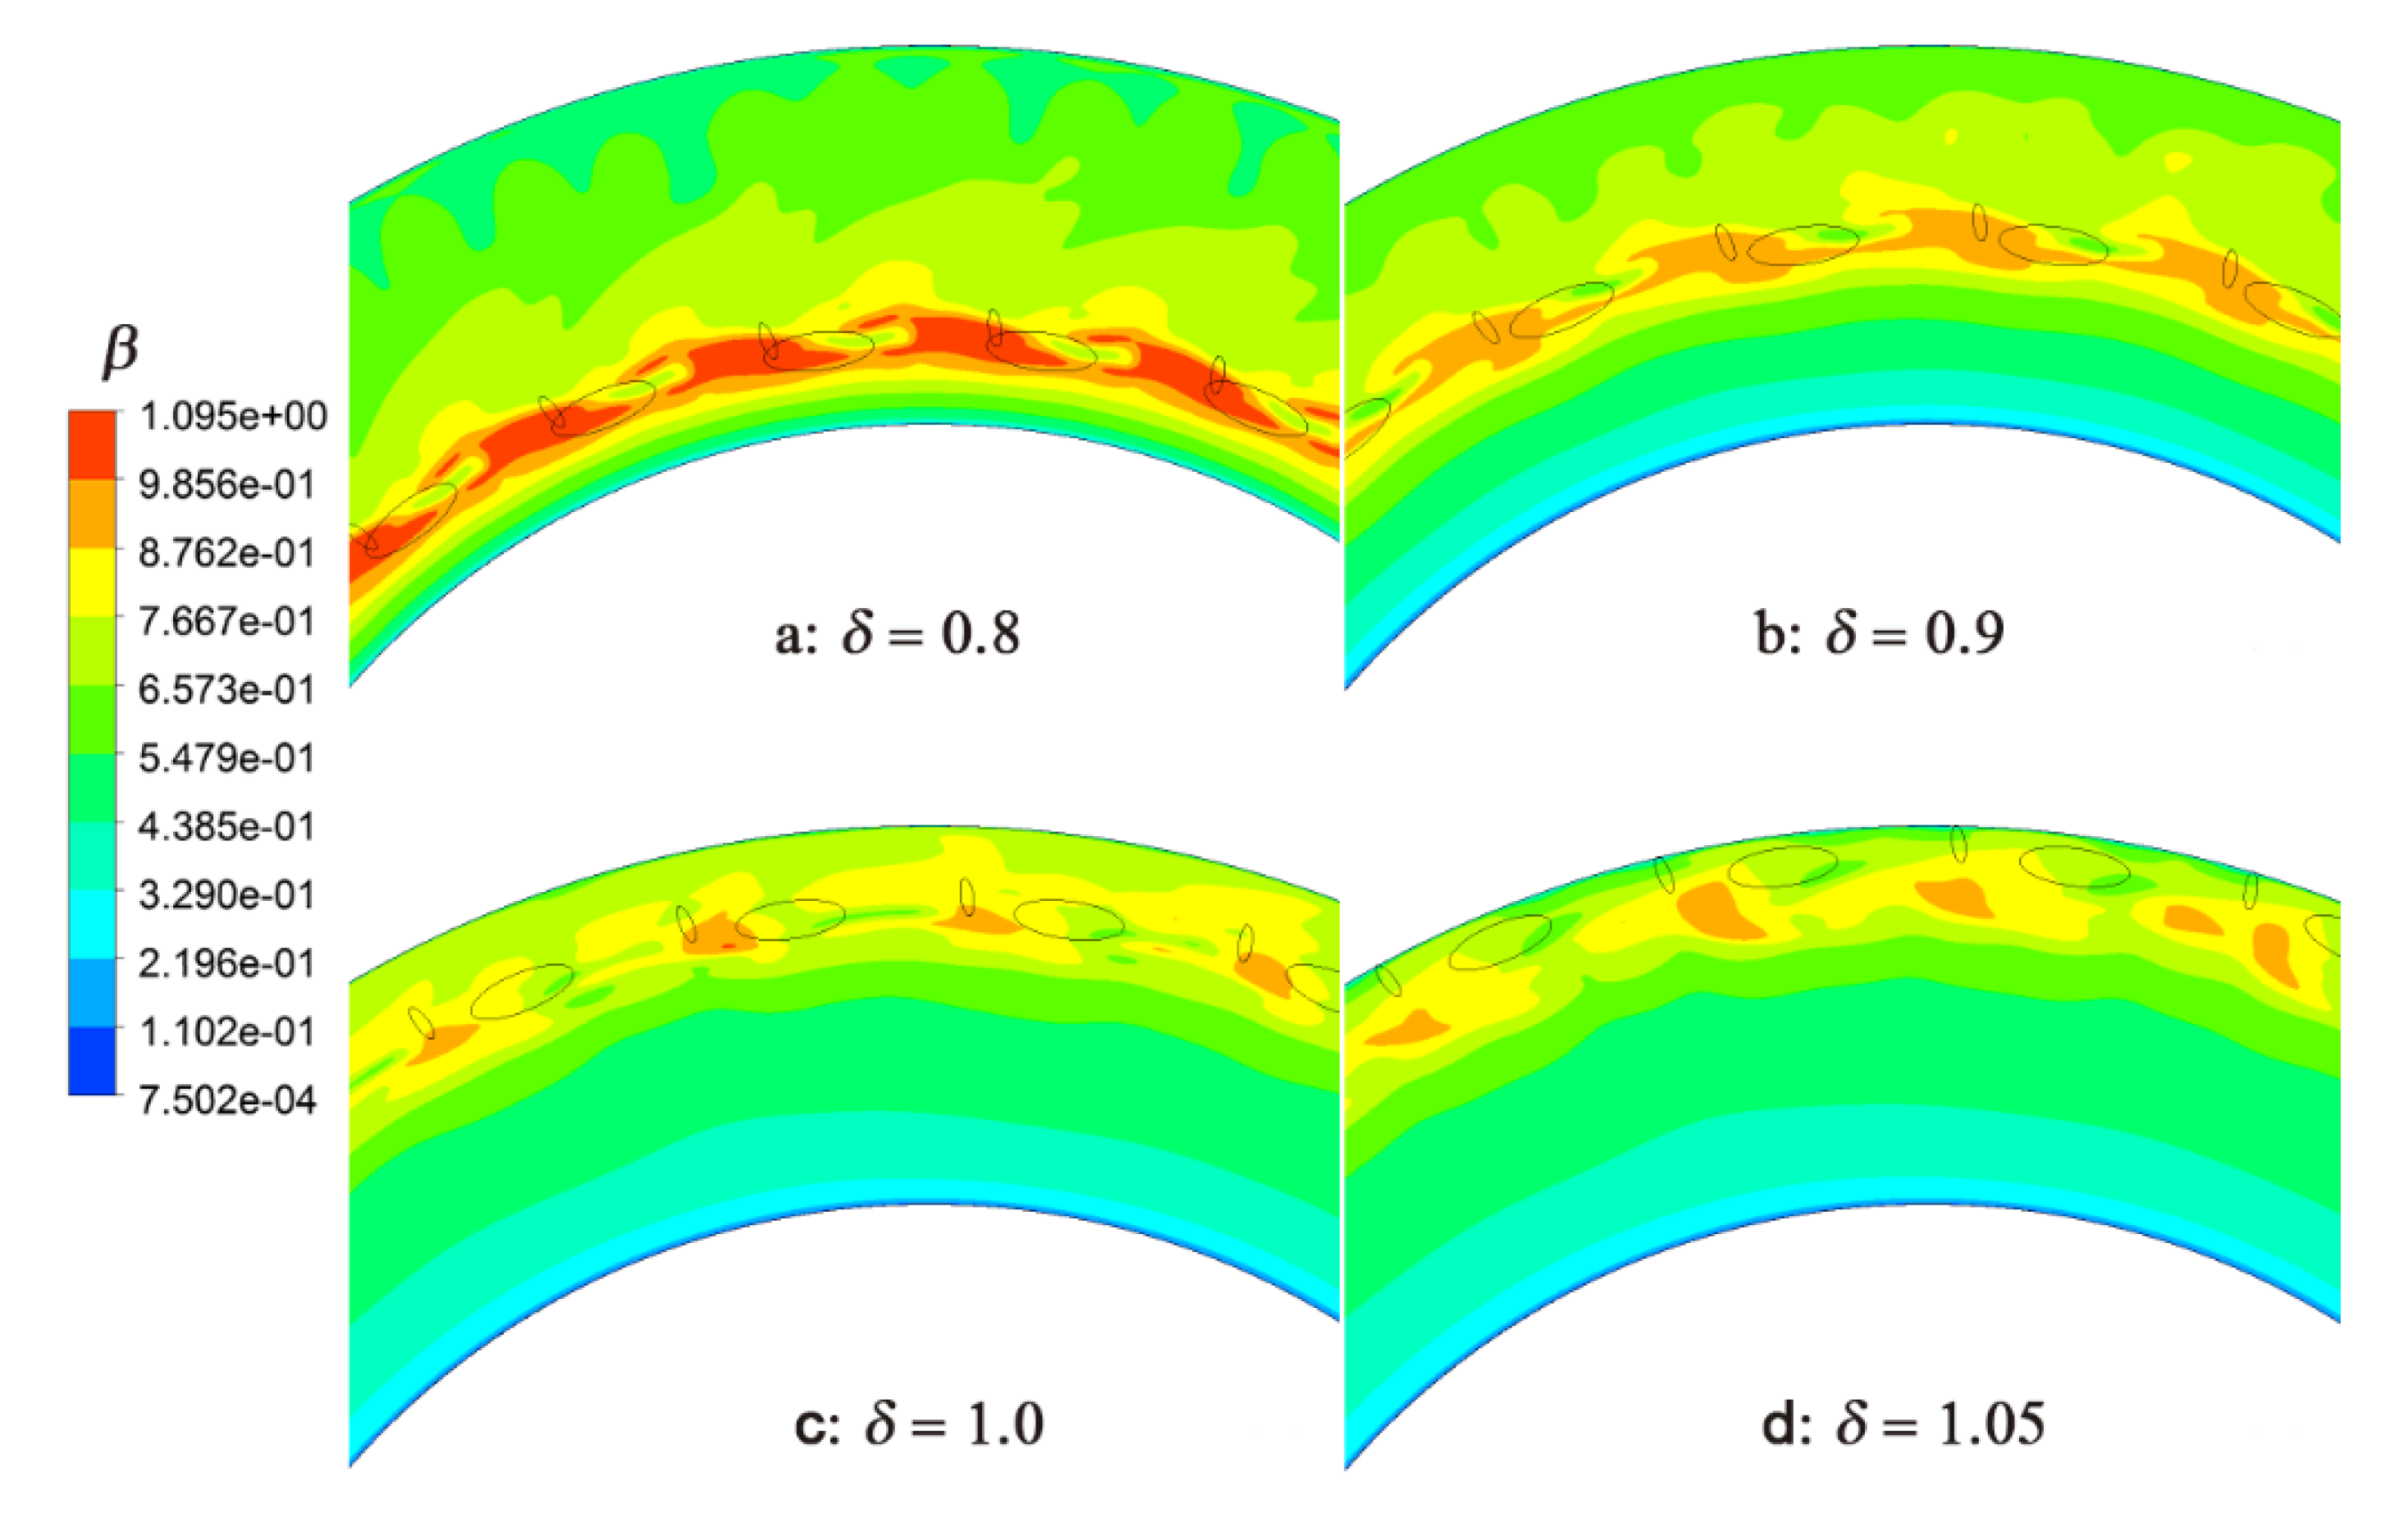
Figure 20c shows the distribution of Cd of each receiver hole for different δ. It is obvious from the figure that Cd increases significantly with increases in δ, and the fluctuation amplitude also increases significantly. From Figure 23, it can be seen that the reason for the increase in Cd is that the β has increased with the increase in δ. The increase in the fluctuation amplitude is because, when δ is larger, the air can be transmitted more directly to the receiver orifice, increasing the fluctuation amplitude. Of course, Cd,hole_0 is larger than Cd,hole_i (i ≠ 0).
Figure 20d shows the distribution of Θad of each receiver hole for different δ. It is obvious from the figure that Θad increases with increases in δ. The change in the radius position of the nozzle does not affect the velocity of the nozzle outlet, so the tangential velocity of the nozzle outlet is the same. According to the theory of Mahmood [27], the value of the first term of Equation (5) increases with increases in δ, but the moment of stator does not change much. Therefore, as δ increases, Θad increases. Of course, when δ = 1.0, the fluctuation amplitude of Θad is the highest. It is because at this time the distance between the nozzle and the receiver hole is the closest, and the nozzle has the greatest impact on Θad.

4. Conclusions

The effect of blade fracture on the pre-swirl system is an issue that must be studied because it may affect the safety of the engine. Therefore, this paper investigates the effects of the pre-swirl angle, α; area ratio of nozzles and holes, ξ; gap ratio, G; and radius ratio of nozzle and hole, δ, of a pre-swirl stator-rotor system on the mass-flow-rate ratio, η; total-pressure-loss coefficient, Cp; discharge coefficient of holes, Cd; and adiabatic effectiveness, Θad, which are investigated by numerical simulation with a single blade fractured. Through the above work, this paper attempts to answer which geometric parameter changes have a minor impact on the flow of a pre-swirl system after turbine blade fracture and to provide the basis and ideas for the passive safety design of the system. Within the scope of this paper’s study, the following conclusions can be drawn from the above analysis:
(1)
As far as the distribution of η, the η of hole_0 (hole_0 is the receiver hole that corresponds to the fractured blade), ηhole_0, will be larger than that of hole_i (i ≠ 0), ηhole_i. Furthermore, most of the geometric parameter changes do not increase ηhole_0. However, measures to increase the influence of the pre-swirl nozzles can reduce the influence of the blade fracture on mass flow distribution, such as larger α, smaller ξ, and larger δ.
(2)
As for Cp, Cd, and Θad, α and ξ have a greater impact on it. For example, the Cd of receiver holes far from hole_0 decreases by over 70% when α increases from 0° to 70°. Of course, similar to η, increasing the influence of the pre-swirl nozzles can reduce the difference of Cp, Cd, and Θad between receiver holes. Moreover, taking α for an example, the Cd,hole_0 is 34.7%, 27.7%, 24.5%, and 20.1% greater than the average of Cd,hole_i (i ≠ 0), when α is 0°, 30°, 50°, and 70°, respectively.
(3)
For the pre-swirl system, the structure that minimizes the change in cold-air conditions (it is better to include all four parameters) for different receiver holes when the turbine blades fracture is the best design. From this perspective, increasing the influence of the pre-swirl nozzle seems to be a better design, for example, by increasing α, or decreasing ξ. However, although increasing the effect of the nozzle serves the purpose, it increases the volatility of the flow. From the investigation of other researchers, the pre-swirl nozzle of the leaf grille type should be able to mitigate the fluctuation in the flow.

Author Contributions

Funding acquisition, T.Q. and P.L.; writing—original draft, G.Z. All authors have read and agreed to the published version of the manuscript.

Funding

This research was funded by the Project of National Science Foundation of China, grant number 61890923. The APC was funded by the Project of National Science Foundation of China No. 61890923.

Data Availability Statement

Not applicable.

Acknowledgments

The authors express their sincere gratitude to the support of the National Fund.

Conflicts of Interest

The authors declare no conflict of interest.

Abbreviations

Alphabet
ainlet radius, m
Aarea, m2
bradius of rotor and stator, m
Cptotal-pressure-loss coefficient
Cddischarge coefficient
Cwdimensionless mass flow rate, mnozzle/μb
saxial spacing between rotor and stator, m
T*total temperature, K
EEuler number, (P2-P1)/0.5ρΩ2b2
Ggap ratio, s/b
mmass flow rate, kg/s
Nnumber of nozzles or receiver holes
Pstatic pressure, Pa
P*total pressure, Pa
r*dimensionless radius, r/b
rhradius of receiver hole, m
rpradius of pre-swirl nozzle
z*dimensionless axial location, z/a
Reφrotational Reynolds number, Ωb2/ν
Vr, Vφradial and tangential velocity, m/s
Greeks
αpre-swirl angle, degree
βswirl ratio, Vφ/Ωr
βppre-swirl ratio, Vφ,nozzle,out/Ωrp
θaxes of polar coordinates, degree
ξarea ratio of nozzles and receiver holes, Anozzle/Ahole
δradial location ratio of nozzles and receiver holes, rp/ rh
ηmass-flow ratio, mhole_i/(mnozzle/Nhole)
Ωrotating velocity of the rotor, rad/s
νkinematic viscosity, m2/s
ρdensity, kg/m3
λTturbulent flow parameter, Cw/ Reφ0.8
Θadadiabatic effectiveness
Subscript
r, z, φradial, axial, and tangential coordinates
nozzlepre-swirl nozzle
holereceiver hole
stnin the frame of static
relin the frame of relative
hole_ireceiver hole numbered i
ppre-swirl nozzle
hreceiver hole

References

  1. Lee, J.; Lee, H.; Kim, D.; Cho, J. The effect of rotating receiver hole shape on a gas turbine pre-swirl system. J. Mech. Sci. Technol. 2020, 34, 2179–2187. [Google Scholar] [CrossRef]
  2. Zhang, F.; Wang, X.J.; Li, J. Numerical investigation of flow and heat transfer characteristics in radial pre-swirl system with different pre-swirl nozzle angles. Int. J. Heat Mass Tran. 2016, 95, 984–995. [Google Scholar] [CrossRef]
  3. Zhang, F.; Wang, X.J.; Li, J. Numerical investigation on the flow and heat transfer characteristics in radial pre-swirl system with different fillet radius at the junction of inlet cavity and nozzle. Appl. Therm. Eng. 2016, 106, 1165–1175. [Google Scholar] [CrossRef]
  4. Zhang, F.; Wang, X.; Liao, G.; Li, J. Computational fluid dynamics analysis for effect of length to diameter ratio of nozzles on performance of pre-swirl systems. Proc. Inst. Mech. Eng. Part A J. Power Energy 2015, 229, 381–392. [Google Scholar] [CrossRef]
  5. Zhao, G.; Ding, S.; Qiu, T.; Zhang, S. Numerical Investigation of the Effect of an Axial Pre-Swirl Nozzle With a Radial Angle in a Pre-Swirl Rotor-Stator System. In Proceedings of the Turbo Expo: Power for Land, Sea, and Air, Virtual, 7–11 June 2021; p. V05BT14A016. [Google Scholar]
  6. Lewis, P.; Wilson, M.; Lock, G.D.; Owen, J.M. Effect of radial location of nozzles on performance of preswirl systems: A computational and theoretical study. Proc. Inst. Mech. Eng. Part A J. Power Energy 2009, 223, 179–190. [Google Scholar] [CrossRef]
  7. Kakade, V.U.; Lock, G.D.; Wison, M.; Owen, J.M.; Mayhew, J.E. Effect of radial location of nozzles on heat transfer in preswirl cooling systems. J. Turbomach. 2011, 133, 1051–1060. [Google Scholar] [CrossRef]
  8. Lee, H.; Lee, J.; Kim, D.; Cho, J. Optimization of pre-swirl nozzle shape and radial location to increase discharge coefficient and temperature drop. J. Mech. Sci. Technol. 2019, 33, 4855–4866. [Google Scholar] [CrossRef]
  9. Kong, X.; Huang, T.; Liu, Y.; Chen, H.; Lu, H. Effects of pre-swirl radius on cooling performance of a rotor-stator pre-swirl system in gas turbine engines. Case Stud. Therm. Eng. 2022, 37, 102250. [Google Scholar] [CrossRef]
  10. Meher-Homji, C.B. Blading vibration and failures in gas turbines: Part A—Blading dynamics and the operating environment. In Proceedings of the ASME 1995 International Gas Turbine and Aeroengine Congress and Exposition, Houston, TX, USA, 5–8 June 1995; pp. 1–11. [Google Scholar]
  11. Australian Transport Safety Bureau, Power Plant Failures in Turbofan-Powered Aircraft 2008 to 2012; AR-2013-002; Australian Transport Safety Bureau: Canberra, Australia, 19 June 2014; pp. 1–34.
  12. Australian Transport Safety Bureau, Power Plant Failures in Turbofan-Powered Aircraft 2012 to 2016; Australian Transport Safety Bureau: Canberra, Australia, 2017.
  13. Federal Aviation Administration, Airworthiness Standards: AIRCRAFT Engines: 33.75 Safety Analysis; Federal Aviation Administration: Washington, DC, USA, 2009; Volume e-CFR 14 part 33.
  14. Bein, M.; Shavit, A.; Solan, A. Nonaxisymmetric flow in the narrow gap between a rotating and a stationary disk. J. Fluids Eng. 1976, 98, 217–223. [Google Scholar] [CrossRef]
  15. Bein, M.; Shavit, A. Nonaxisymmetric Flow in the Narrow Gap Between a Rotating and a Stationary Disk with an Eccentric Source. J. Fluid Eng. 1977, 99, 418–421. [Google Scholar] [CrossRef]
  16. Mukhopadhyay, A.; Banerjee, S.; Gupta, C. Fully developed hydrodynamic and thermal transport in combined pressure and electrokinetically driven flow in a microchannel with asymmetric boundary conditions. Int. J. Heat Mass Tran. 2009, 52, 2145–2154. [Google Scholar] [CrossRef]
  17. Chan, Y.; Chen, G.; Tso, C. Effect of asymmetric boundary conditions on Couette–Poiseuille flow of power-law fluid. J. Thermophys. Heat Tr. 2015, 29, 496–503. [Google Scholar] [CrossRef]
  18. Zhao, G.; Qiu, T.; Liu, P. Influence of blade fracture on the flow of rotor-stator systems with centrifugal superposed flow. Aerospace 2022, 9, 106. [Google Scholar] [CrossRef]
  19. Owen, J.M.; Rogers, R.H. Flow and Heat Transfer in Rotating Disc Systems: Rotor-Stator Systems, 5th ed.; Research Studies Press Ltd., Ed.; Research Studies Press Ltd.: Somerset, UK, 1989; Volume 90, p. 278. [Google Scholar]
  20. Lock, G.D.; Yan, Y.Y.; Newton, P.J.; Wilson, M.; Owen, J.M. Heat transfer measurements using liquid crystals in a preswirl rotating-disk system. J. Eng. Gas Turbines. Power-Trans. Asme 2005, 127, 375–382. [Google Scholar] [CrossRef]
  21. Lock, G.D.; Wilson, M.; Owen, J.M. Influence of fluid dynamics on heat transfer in a preswirl rotating-disk system. J. Eng. Gas Turbines Power-Trans Asme 2005, 127, 791–797. [Google Scholar] [CrossRef]
  22. Kakade, V.U.; Lock, G.D.; Wilson, M.; Owen, J.M.; Mayhew, J.E. Accurate heat transfer measurements using thermochromic liquid crystal. Part 2: Application to a rotating disc. Int. J. Heat Fluid Flow 2009, 30, 950–959. [Google Scholar] [CrossRef]
  23. Yan, Y.; Gord, M.F.; Lock, G.D.; Wilson, M.; Owen, J.M. Fluid dynamics of a pre-swirl rotor-stator system. J. Turbomach. 2003, 125, 641–647. [Google Scholar] [CrossRef]
  24. Karnahl, J.; von Wolfersdorf, J.; Tham, K.M.; Wilson, M.; Lock, G. Computational fluid dynamics simulations of flow and heat transfer in a preswirl system: Influence of rotating-stationary domain interface. J. Eng. Gas Turbines Power-Trans. Asme 2012, 134, 052502. [Google Scholar] [CrossRef]
  25. Liao, G.; Wang, X.; Li, J. Numerical investigation of the pre-swirl rotor–stator system of the first stage in gas turbine. Appl. Therm. Eng. 2014, 73, 940–952. [Google Scholar] [CrossRef]
  26. Luo, X.; Han, G.; Wu, H.; Wang, L.; Xu, G. Experimental investigation of pressure loss and heat transfer in a rotor–stator cavity with two outlets. Int. J. Heat Mass Tran. 2014, 78, 311–320. [Google Scholar] [CrossRef]
  27. Farzaneh-Gord, M.; Wilson, M.; Owen, J.M. Numerical and theoretical study of flow and heat transfer in a pre-swirl rotor-stator system. In Proceedings of the ASME Turbo Expo 2005, Reno, NV, USA, 6–9 June 2005; pp. 943–949. [Google Scholar]
Figure 1. Schematic diagram of the direct-transfer pre-swirl rotor-stator system in this paper.
Aerospace 09 00783 g001
Figure 2. Computational model.
Aerospace 09 00783 g002
Figure 3. Local grid.
Aerospace 09 00783 g003
Figure 4. The computational model used in computational validation.
Aerospace 09 00783 g004
Figure 5. CFD static pressures at static disk versus experiment, λT,P = 0.236, βp = 0.96.
Aerospace 09 00783 g005
Figure 6. The grid-independent solution, λT,P = 0.236, βp = 0.96.
Aerospace 09 00783 g006
Figure 7. Profile of static pressure near stator for different models.
Aerospace 09 00783 g007
Figure 8. Distribution of (a) mass-flow-rate ratio η, (b) total-pressure-loss coefficient Cp, (c) discharge coefficient of holes Cd, and (d) adiabatic effectiveness Θad for different pre-swirl angles α.
Aerospace 09 00783 g008
Figure 9. Distribution of (a) mass-flow-rate ratio η, (b) total-pressure-loss coefficient Cp, (c) discharge coefficient of holes Cd, and (d) adiabatic effectiveness Θad for symmetric and asymmetric boundary conditions when α = 70°.
Aerospace 09 00783 g009
Figure 10. Vector at the plane z = 0.5 for different pre-swirl angles: (a) α = 0°, (b) α = 30°, (c) α = 50°, (d) α = 70°.
Aerospace 09 00783 g010
Figure 11. Vector at the r-z plane for α = 0° and α = 50°.
Aerospace 09 00783 g011
Figure 12. Distribution of (a) mass-flow-rate ratio η, (b) total-pressure-loss coefficient Cp, (c) discharge coefficient of holes Cd, and (d) adiabatic effectiveness Θad for different area ratios of nozzles to holes ξ.
Aerospace 09 00783 g012
Figure 13. Contour of swirl ratio β at plane z = 0.5 for different area ratios of nozzles to holes: (a) ξ = 0.156, (b) ξ = 0.315, (c) ξ = 0.625, (d) ξ = 1.225.
Aerospace 09 00783 g013
Figure 14. Streamlines at the r-z plane for ξ = 1.225: (a) θ = −12°, (b) θ = −0°.
Aerospace 09 00783 g014
Figure 15. Distribution of (a) mass-flow-rate ratio η, (b) total-pressure-loss coefficient Cp, (c) discharge coefficient of holes Cd, and (d) adiabatic effectiveness Θad for different gap ratios G.
Aerospace 09 00783 g015
Figure 16. Streamline at plane θ = −12° for different gap ratios: (a) G = 0.0231, (b) G = 0.0370, (c) G = 0.0509, (d) G = 0.0648.
Aerospace 09 00783 g016
Figure 17. Streamlines at the z-r plane for G = 0.0509: (a) θ = −24°, (b) θ = −18°.
Aerospace 09 00783 g017
Figure 18. Streamlines at the z-r plane for G = 0.0231: (a) θ = 0°, (b) θ = −12°.
Aerospace 09 00783 g018
Figure 19. Contour of swirl ratio β at the plane z = 0.5 for different gap ratios: (a) G = 0.0231, (b) G = 0.0370, (c) G = 0.0509, (d) G = 0.0648.
Aerospace 09 00783 g019
Figure 20. Distribution of (a) mass-flow-rate ratio η, (b) total-pressure-loss coefficient Cp, (c) discharge coefficient of holes Cd, and (d) adiabatic effectiveness Θad for different radius ratios of nozzles to holes δ.
Aerospace 09 00783 g020
Figure 21. Streamlines at the cylindrical surface r* = 0.926 for different radius ratios of nozzles to holes: (a) δ = 0.8, (b) δ = 0.9, (c) δ = 1.0, (d) δ = 1.05.
Aerospace 09 00783 g021
Figure 22. Contour of total pressure in the static frame at plane θ = −12° for different radius ratios of nozzles to holes: (a) δ = 0.8, (b) δ = 0.9, (c) δ = 1.0, (d) δ = 1.05.
Aerospace 09 00783 g022
Figure 23. Contour of swirl ratio β at the plane z = 0.5 for different radius ratios of nozzles to holes: (a) δ = 0.8, (b) δ = 0.9, (c) δ = 1.0, (d) δ = 1.05.
Aerospace 09 00783 g023
Table 1. Experimental geometry and operating conditions.
ParametersValues
Outer disk radius b0.216 m
Inner radius a0.145 m
Cavity width s0.011 m
Pre-swirl-nozzle radius, rp0.160 m
Sealing-slot width0.001 m
Receiver-hole radius, rh0.200 m
Receiver-hole diameter0.008 m
Nozzle diameter0.0071 m
Pre-swirl angle, α70°
Table 2. The range of variables.
ParametersValues
Pre-swirl-nozzle angle, α0°~70°
The area ratio of nozzles and holes, ξ0.156~1.225
Gap ratio, G0.0231~0.0648
Radial location ratio of nozzles and holes, δ0.8~1.05
Table 3. Boundary conditions.
ParametersValues
Inlet total temperature, T*nozzle,in,stn65.06 °C
Inlet mass flow, mnozzle0.06 kg/s
Outlet static pressure of hole_0, Phole_0,out−571 Pa
Outlet static pressure of hole_i (i ≠ 0), Phole_i,out0 Pa
Reference pressure101,325 Pa
Rotation speed, Ω350 rad/s
Cw13164
Reω7.7 × 10⁵
λT0.26
E [14,18]0.2
Publisher’s Note: MDPI stays neutral with regard to jurisdictional claims in published maps and institutional affiliations.