
Multi-Objective Optimization for Improving Weight and Fault Characteristics of a DC HTS Cable in Cryo-Electric Aircraft


Abstract
1. Introduction
2. Modelling Procedure
3. Multi-Objective: NSGA II
4. Results and Discussions
4.1. Objective Function for the DC HTS Cable
4.2. Cable and Test System Specifications
4.3. Multi-Objective Optimization Results
4.4. Thermoelectric Characteristic of Optimized Cable
5. Conclusions
- ⮚
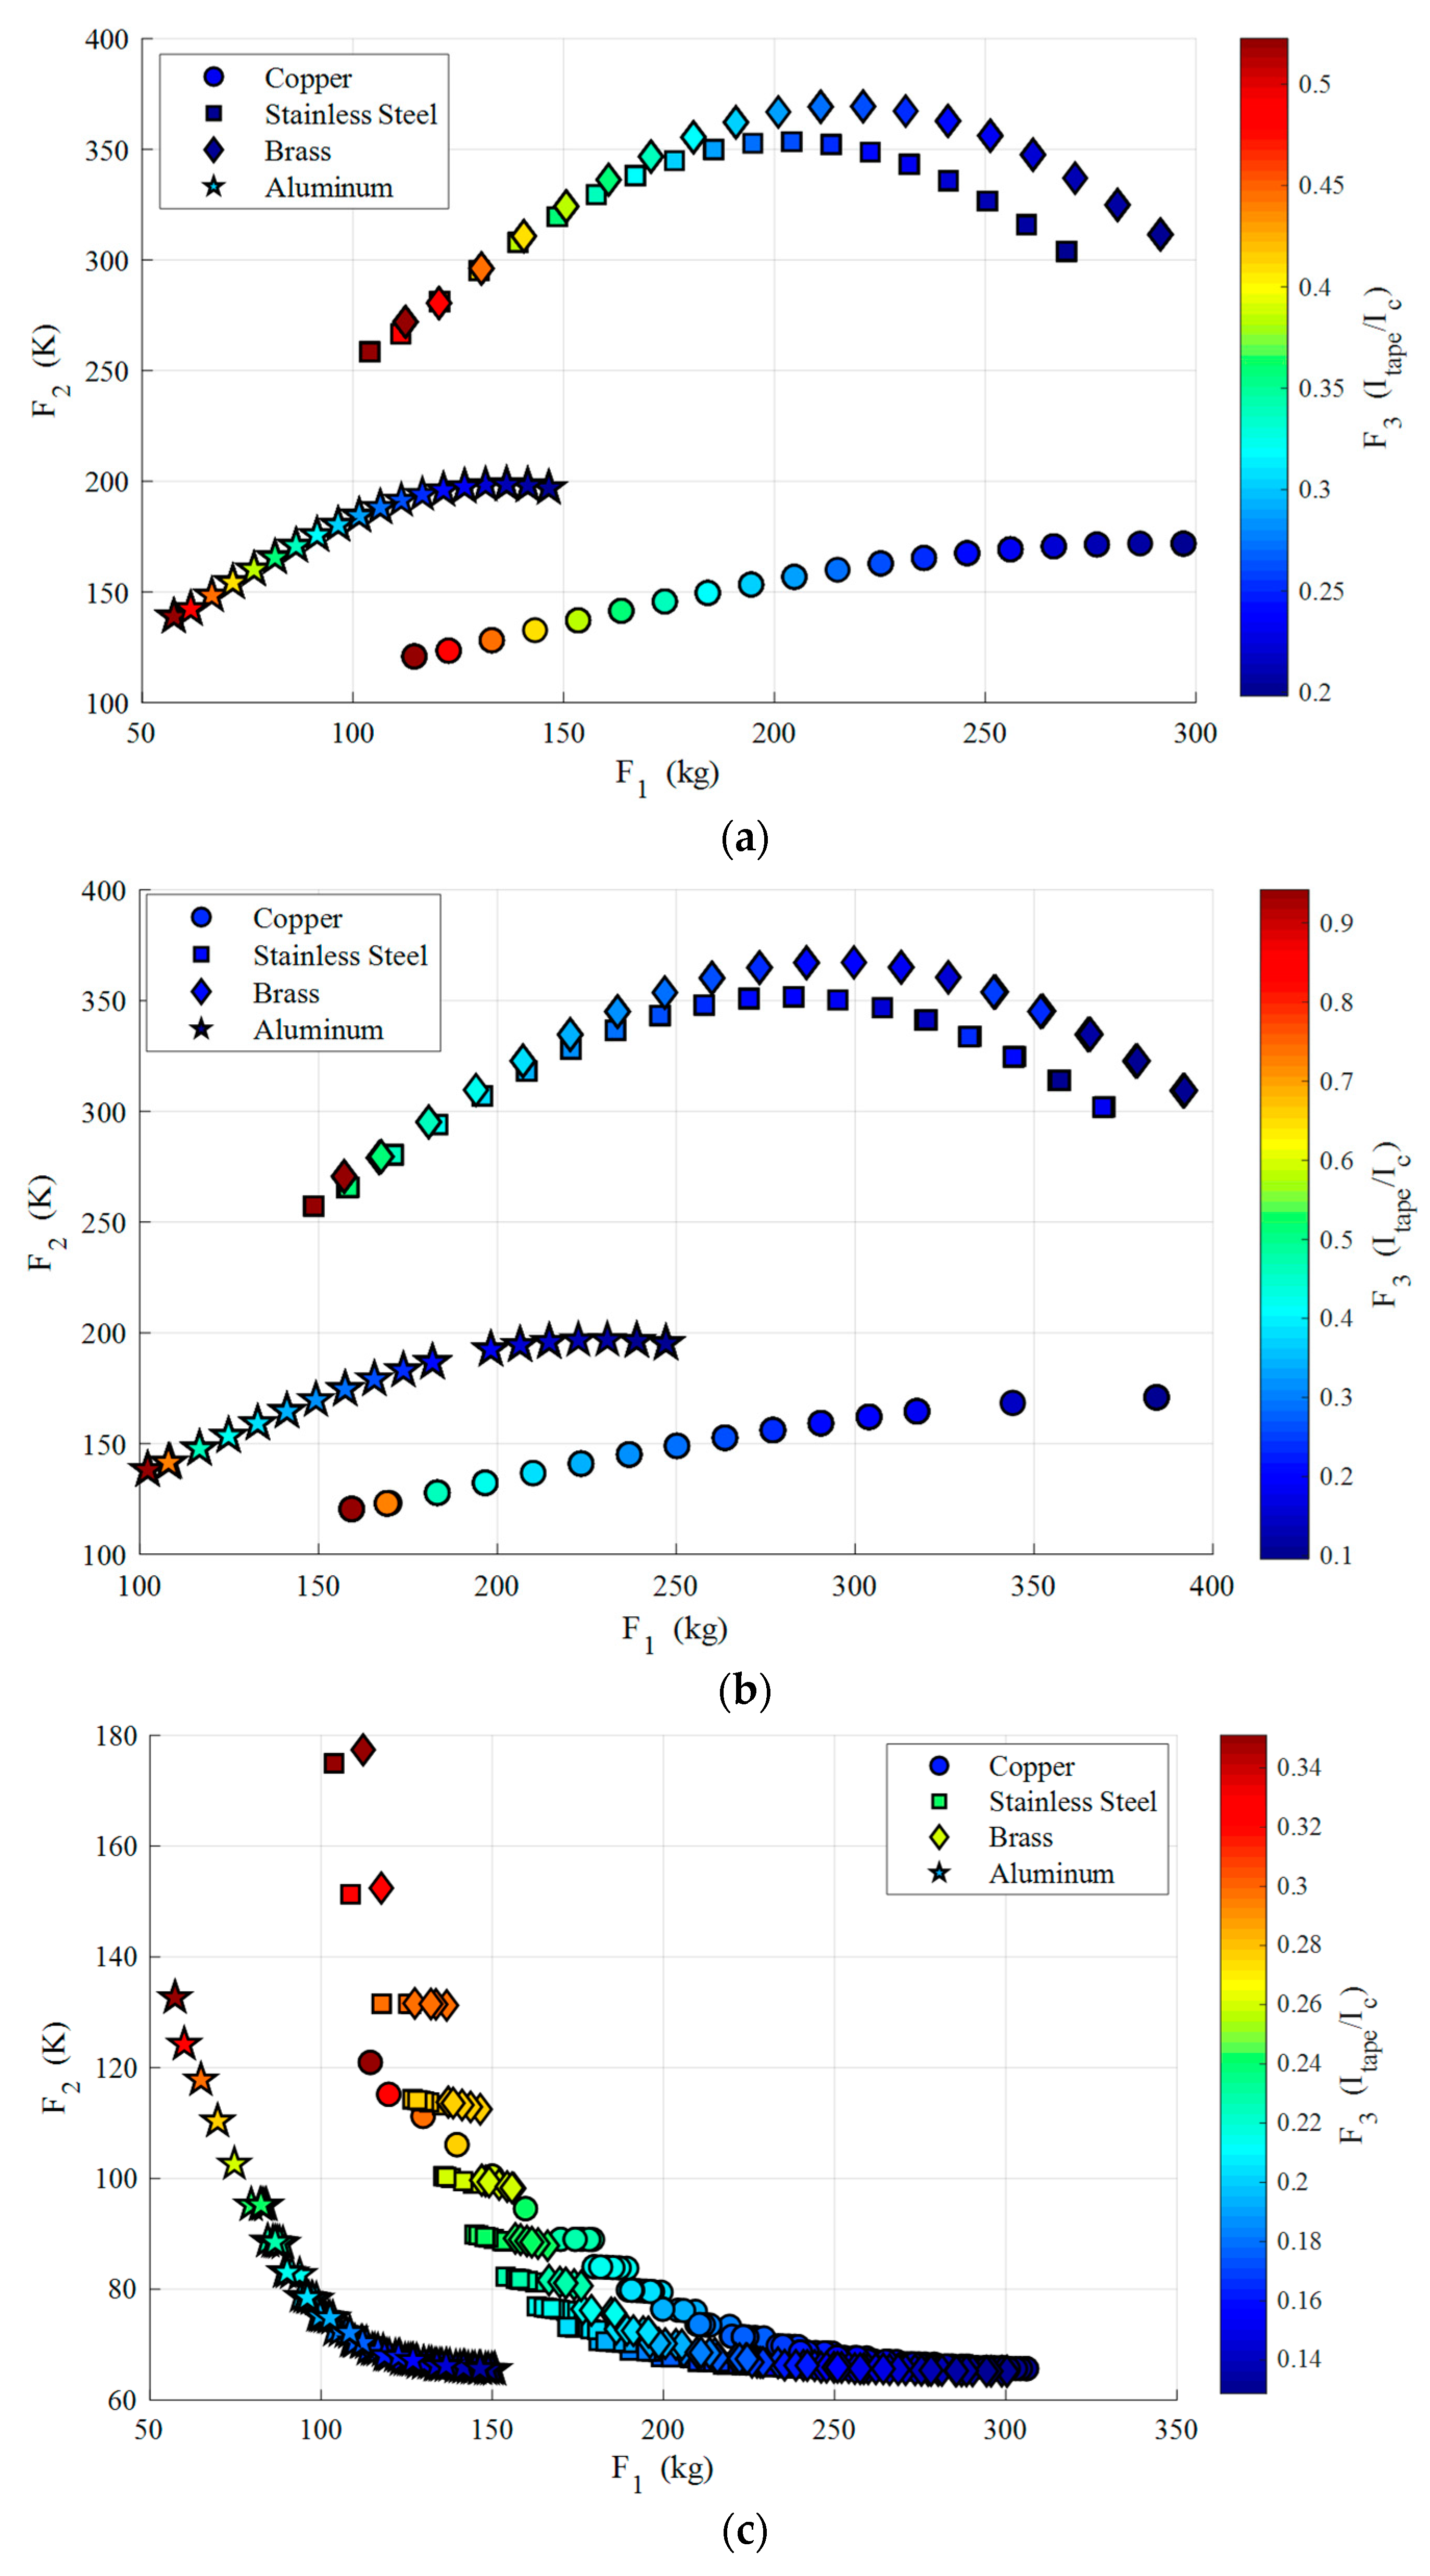
- The cables with aluminum former have the lowest weight among all other cables with copper, brass, and stainless steel formers.
- ⮚
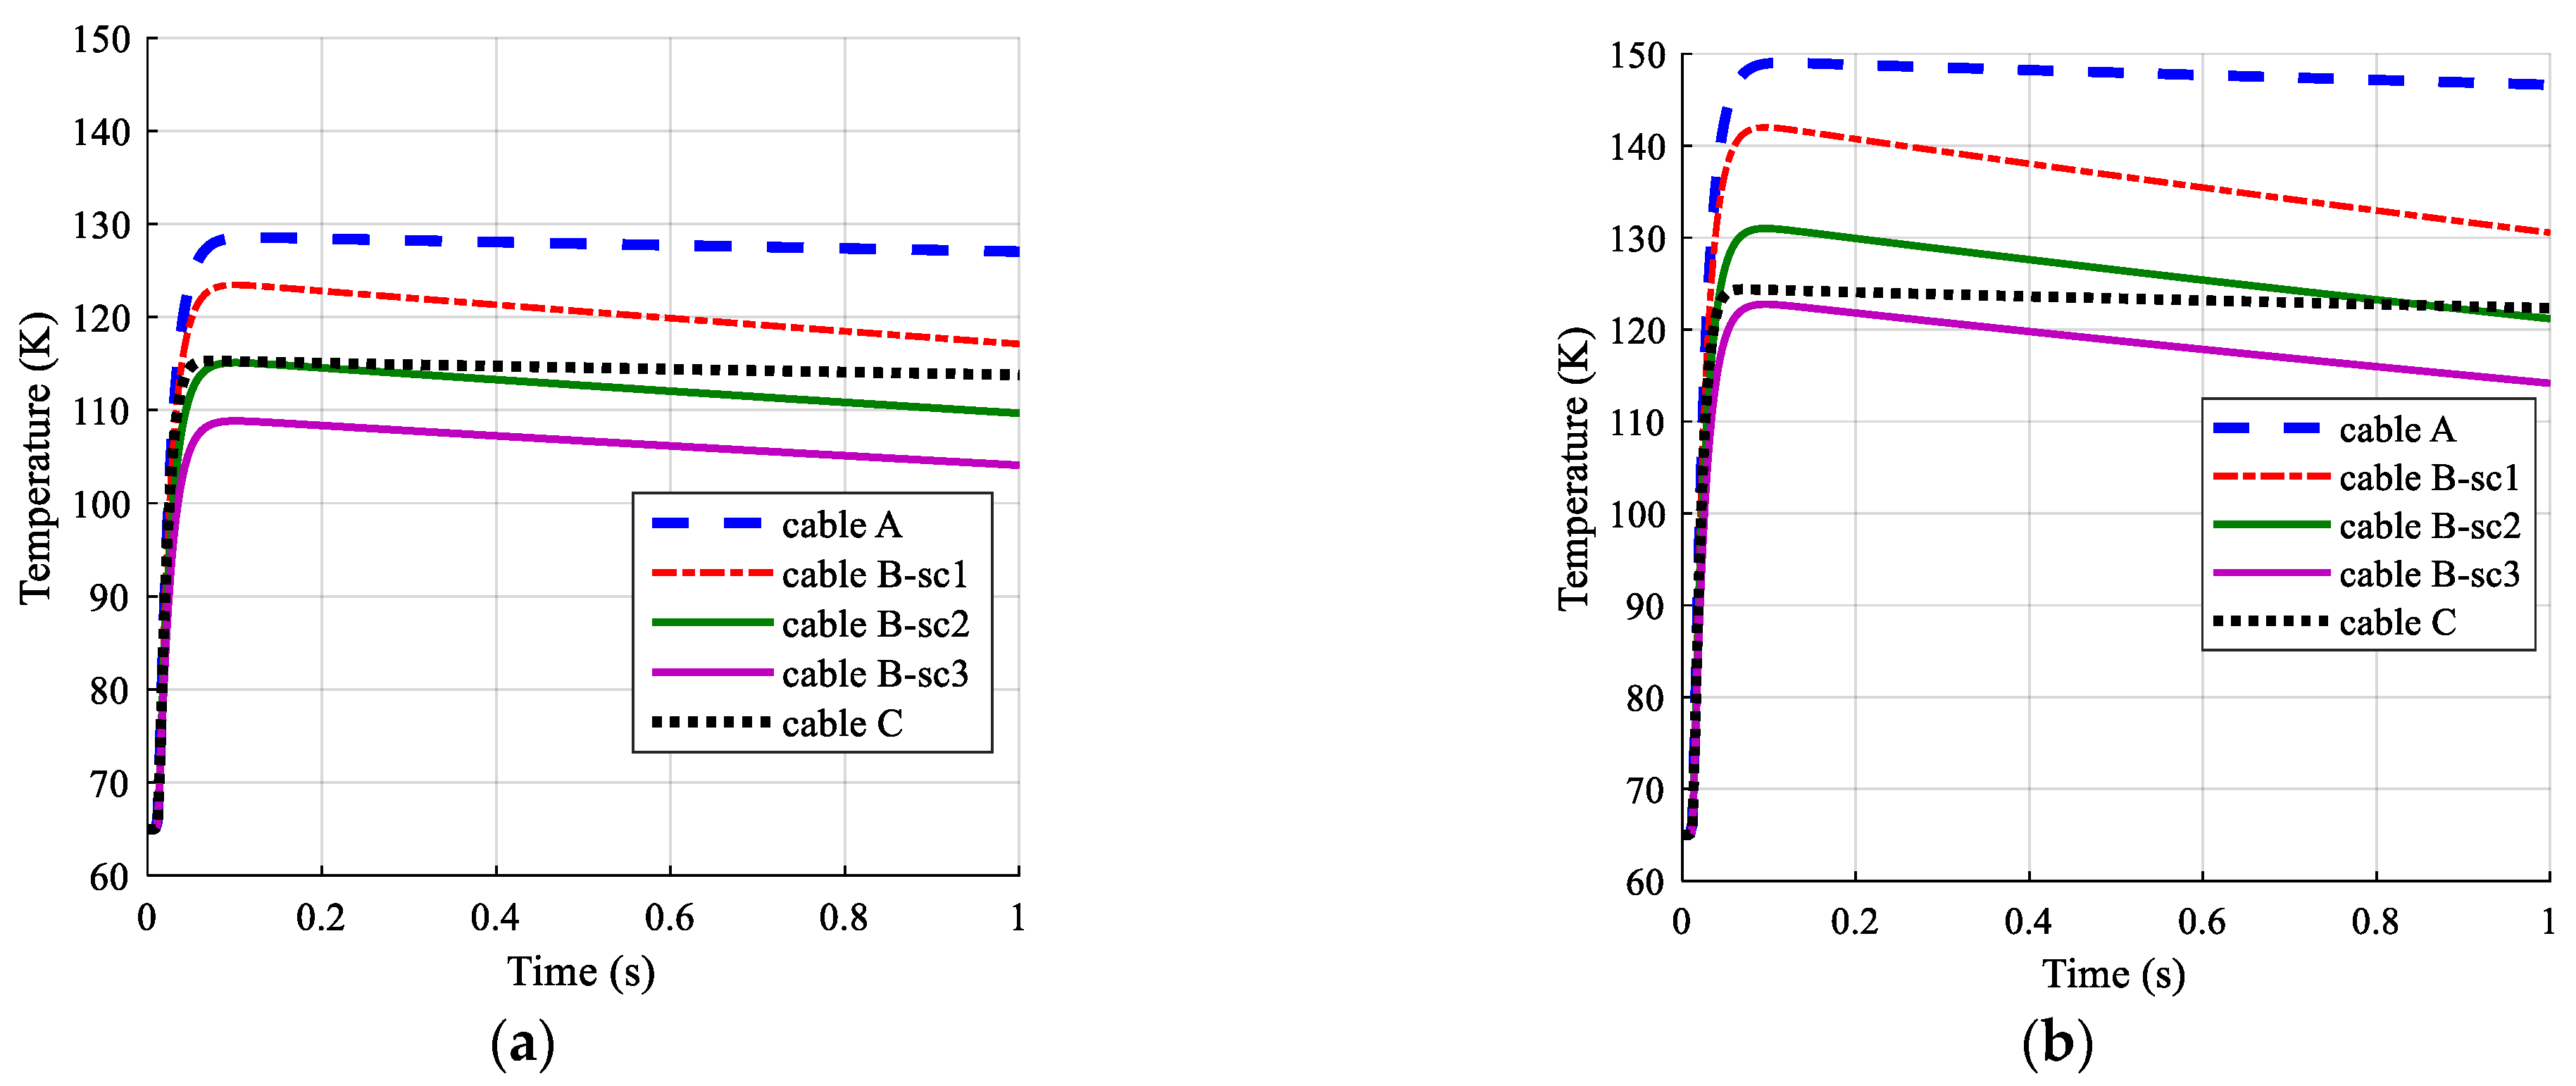
- The temperature of cables with copper former is about 10% to 50% lower than cables with other materials in their former.
- ⮚
- The specific mass of all understudied cables lay in the range of 4.9 to 7.3 kg/m, which provides us with a clear index to select the optimum structure and cable type for aviation applications
- ⮚
- The highest power density among all understudied HTS cables belongs to 4.5 kV/2000 A/9 MW DC cable with aluminum former that has 12%–35% higher power density in comparison to other structures and types
- ⮚
- Aluminum former-based cables present an acceptable temperature rise during faults, and the peak temperature of YBCO tapes in such cables is way lower than the burnout limitation of HTS cables.
- ⮚
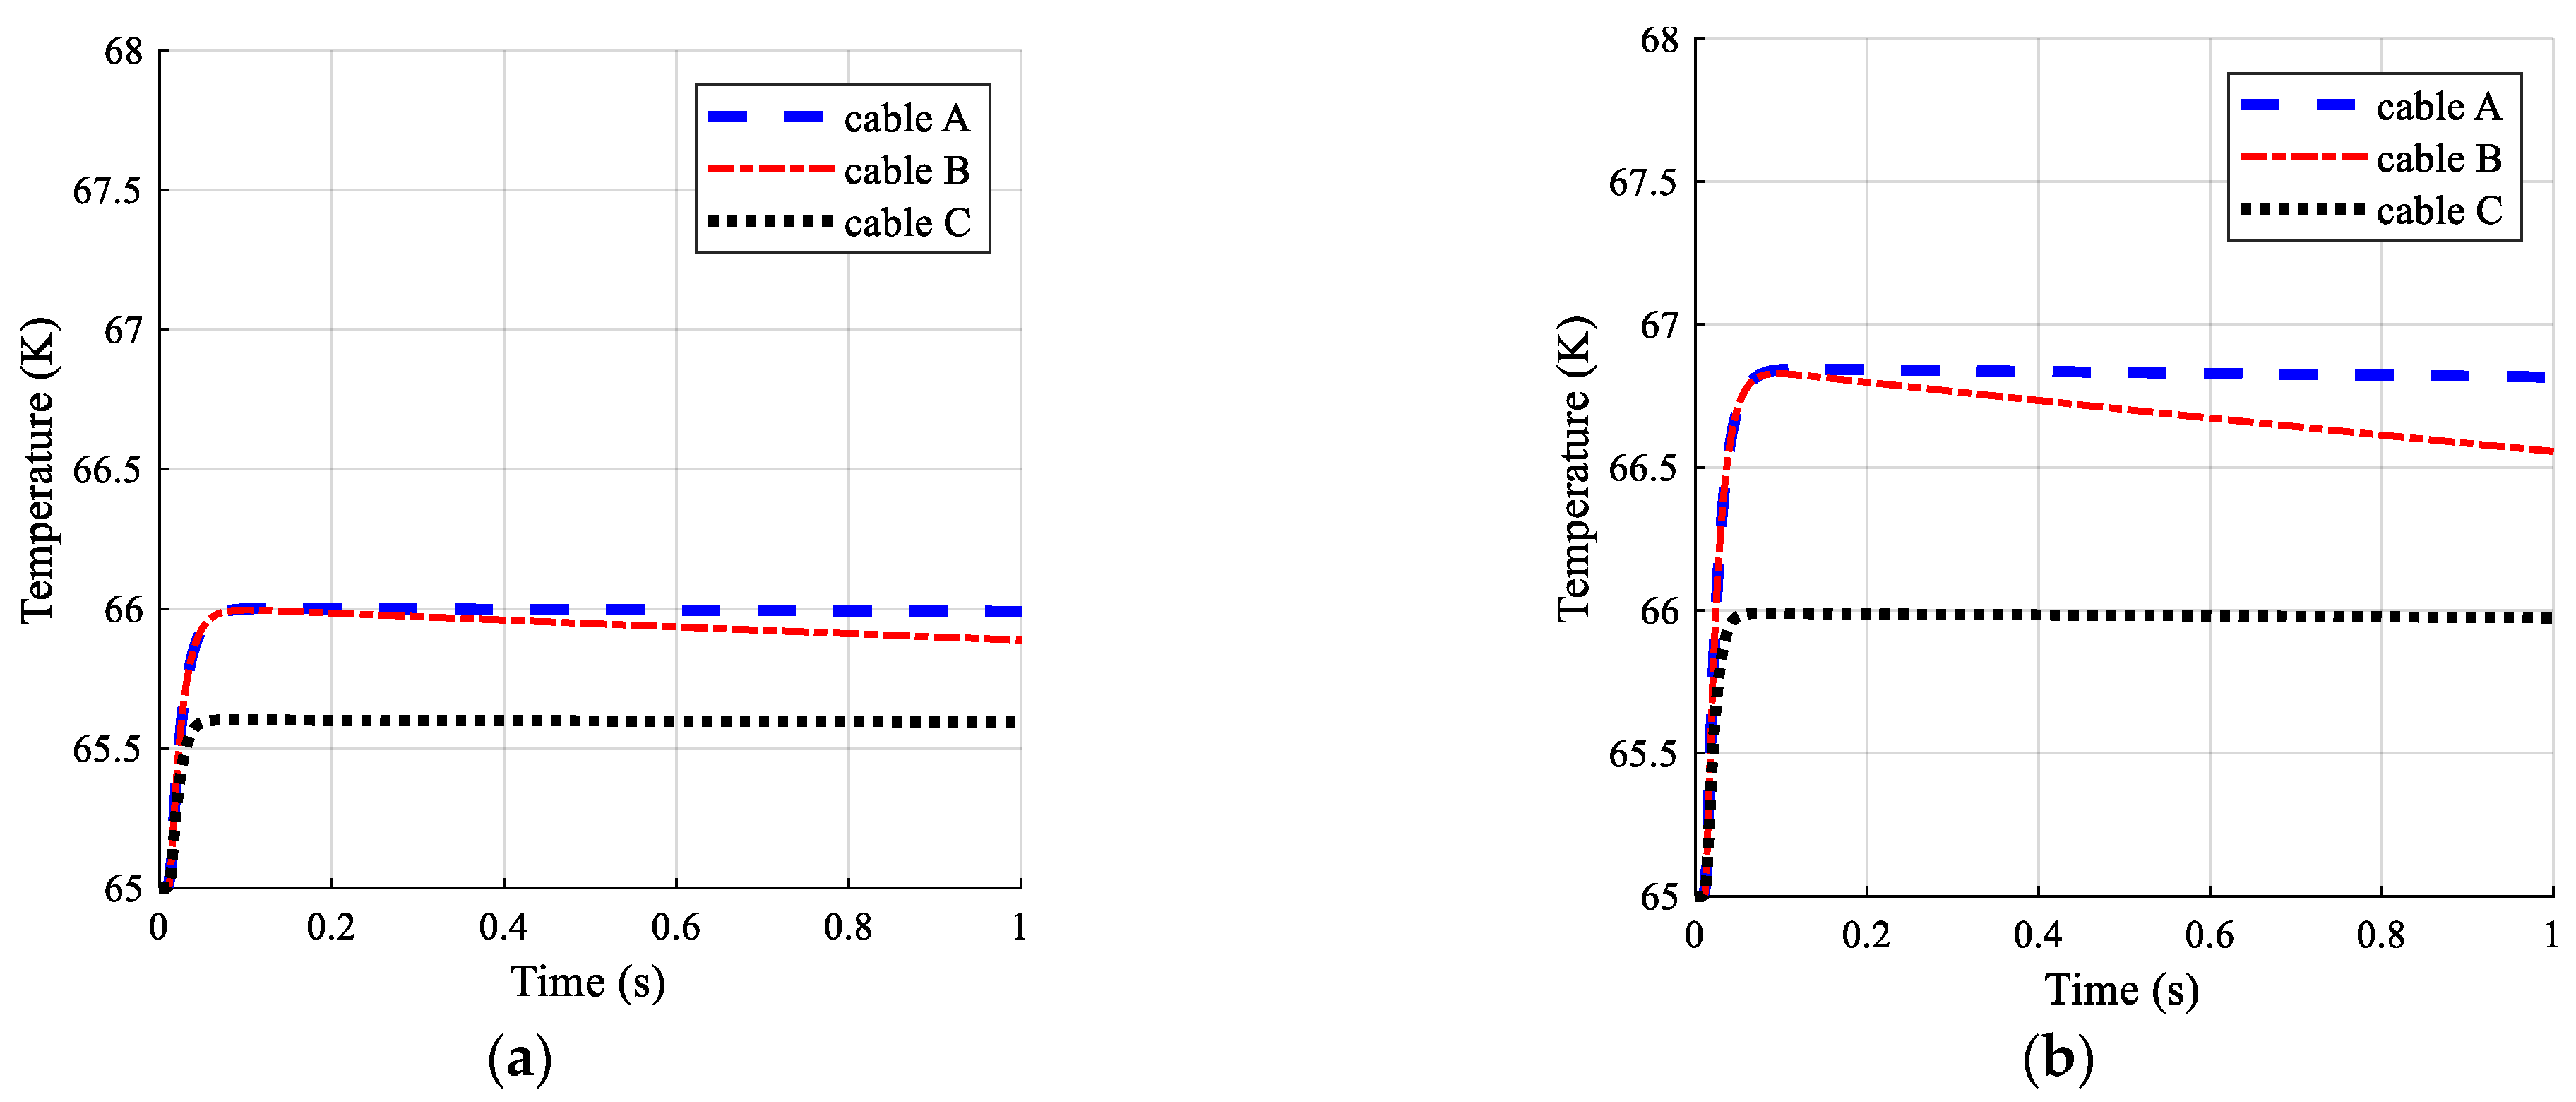
- The temperature of dielectric and former layers in the understudied cables is lower than the temperature of HTS tapes, which is due to their higher thermal mass.
Author Contributions
Funding
Data Availability Statement
Acknowledgments
Conflicts of Interest
References
- Ciliberti, D.; Vecchia, P.D.; Memmolo, V.; Nicolosi, F.; Wortmann, G.; Ricci, F. The Enabling Technologies for a Quasi-Zero Emissions Commuter Aircraft. Aerospace 2022, 9, 319. [Google Scholar] [CrossRef]
- Sahoo, S.; Zhao, X.; Kyprianidis, K. A Review of Concepts, Benefits, and Challenges for Future Electrical Propulsion-Based Aircraft. Aerospace 2020, 7, 44. [Google Scholar] [CrossRef]
- Darecki, M.; Edelstenne, C.; Enders, T.; Fernandez, E.; Hartman, P.; Herteman, J.P.; Kerkloh, M.; King, I.; Ky, P.; Mathieu, M. Flightpath 2050 Europe’s Vision for Aviation: Maintaining Global Leadership and Serving Society’s Needs; Publications Office of the European Union: Luxembourg, 2011. [Google Scholar]
- Filipenko, M.; Biser, S.; Boll, M.; Corduan, M.; Noe, M.; Rostek, P. Comparative Analysis and Optimization of Technical and Weight Parameters of Turbo-Electric Propulsion Systems. Aerospace 2020, 7, 107. [Google Scholar] [CrossRef]
- Rao, A.G.; Yin, F.; Werij, H.G.C. Energy Transition in Aviation: The Role of Cryogenic Fuels. Aerospace 2020, 7, 181. [Google Scholar] [CrossRef]
- Yazdani-Asrami, M.; Zhang, M.; Yuan, W. Challenges for Developing High Temperature Superconducting Ring Magnets for Rotating Electric Machine Applications in Future Electric Aircrafts. J. Magn. Magn. Mater. 2021, 522, 167543. [Google Scholar] [CrossRef]
- Yazdani-Asrami, M.; Seyyedbarzegar, S.M.; Sadeghi, A.; de Sousa, W.T.B.; Kottonau, D. High Temperature Superconducting Cables and Their Performance against Short Circuit Faults: Current Development, Challenges, Solutions, and Future Trends. Supercond. Sci. Technol. 2022, 35, 083002. [Google Scholar] [CrossRef]
- Sadeghi, A.; Seyyedbarzegar, S.; Yazdani-Asrami, M. Investigation on the Electrothermal Performance of a High-Temperature Superconducting Cable in an Offshore Wind Farm Integrated Power System: Fault and Islanding Conditions. IEEE Trans. Appl. Supercond. 2022, 32, 5401011. [Google Scholar] [CrossRef]
- Xi, J.; Pei, X.; Song, W.; Xiang, B.; Liu, Z.; Zeng, X. Experimental Tests of DC SFCL under Low Impedance and High Impedance Fault Conditions. IEEE Trans. Appl. Supercond. 2021, 31, 5601205. [Google Scholar] [CrossRef]
- Yazdani Asrami, M.; Sadeghi, A.; Atrey, M. Selecting a Cryogenic Cooling System for Superconducting Machines: General Considerations for Electric Machine Designers and Engineers. Int. J. Refrig. 2022, 140, 70–81. [Google Scholar] [CrossRef]
- Yazdani-Asrami, M.; Sadeghi, A.; Seyyedbarzegar, S.; Song, W. Role of Insulation Materials and Cryogenic Coolants on Fault Performance of MW-Scale Fault-Tolerant Current-Limiting Superconducting Transformers. IEEE Trans. Appl. Supercond. 2022, 33, 1–15. [Google Scholar] [CrossRef]
- Yazdani-Asrami, M.; Sadeghi, A.; Song, W.; Madureira, A.; Pina, J.M.; Morandi, A.; Parizh, M. Artificial Intelligence Methods for Applied Superconductivity: Material, Design, Manufacturing, Testing, Operation, and Condition Monitoring. Supercond. Sci. Technol. 2022, 35, 54. [Google Scholar] [CrossRef]
- Nolan, S.; Jones, C.E.; Norman, P.J.; Burt, G.M. Sizing of Superconducting Cables for Turbo- Electric Distributed Propulsion Aircraft Using a Particle Swarm Optimization Approach. IEEE Trans. Transp. Electrif. 2022, 8, 4789–4798. [Google Scholar] [CrossRef]
- Yazdani-Asrami, M.; Sadeghi, A.; Seyyedbarzegar, S.; Song, W. DC Electro-Magneto-Mechanical Characterization of 2G HTS Tapes for Superconducting Cable in Magnet System Using Artificial Neural Networks. IEEE Trans. Appl. Supercond. 2022, 32, 4605810. [Google Scholar] [CrossRef]
- Sadeghi, A.; Seyyedbarzegar, S.M.; Yazdani-Asrami, M. Transient Analysis of a 22.9 KV/2 KA HTS Cable under Short Circuit Using Equivalent Circuit Model Considering Different Fault Parameters. Phys. C Supercond. Appl. 2021, 589, 1353935. [Google Scholar] [CrossRef]
- Hu, N.; Toda, M.; Ozcivan, A.N.; Yagai, T.; Tsuda, M.; Hamajima, T. Fault Current Analysis in a Tri-Axial HTS Cable. IEEE Trans. Appl. Supercond. 2010, 20, 1288–1291. [Google Scholar] [CrossRef]
- Nolan, S.; Jones, C.E.; Alzola, R.P.; Norman, P.J.; Burt, G.; Miller, P.; Husband, M. Voltage Based Current Compensation Converter Control for Power Electronic Interfaced Distribution Networks in Future Aircraft. IEEE Trans. Transp. Electrif. 2020, 6, 1819–1829. [Google Scholar] [CrossRef]
- Morandi, A. HTS Dc Transmission and Distribution: Concepts, Applications and Benefits. Supercond. Sci. Technol. 2015, 28, 123001. [Google Scholar] [CrossRef]
- Duron, J.; Grilli, F.; Antognazza, L.; Decroux, M.; Dutoit, B.; Fischer, Ø. Finite-Element Modelling of YBCO Fault Current Limiter with Temperature Dependent Parameters. Supercond. Sci. Technol. 2007, 20, 338. [Google Scholar] [CrossRef]
- Deb, K.; Pratap, A.; Agarwal, S.; Meyarivan, T. A Fast and Elitist Multiobjective Genetic Algorithm: NSGA-II. IEEE Trans. Evol. Comput. 2002, 6, 182–197. [Google Scholar] [CrossRef]
- Verma, S.; Pant, M.; Snasel, V. A Comprehensive Review on NSGA-II for Multi-Objective Combinatorial Optimization Problems. IEEE Access 2021, 9, 57757–57791. [Google Scholar] [CrossRef]
- Palaparthi, A.; Riede, T.; Titze, I.R. Combining Multiobjective Optimization and Cluster Analysis to Study Vocal Fold Functional Morphology. IEEE Trans. Biomed. Eng. 2014, 61, 2199–2208. [Google Scholar] [CrossRef] [PubMed]
- Barth, C.; Mondonico, G.; Senatore, C. Electro-Mechanical Properties of REBCO Coated Conductors from Various Industrial Manufacturers at 77K, Self-Field and 4.2K, 19T. Supercond. Sci. Technol. 2015, 28, 045011. [Google Scholar] [CrossRef]
- Robinson HTS Wire Critical Current Data Base. Available online: https://htsdb.wimbush.eu/ (accessed on 1 June 2022).
- Yazdani-Asrami, M.; Staines, M.; Sidorov, G.; Davies, M.; Bailey, J.; Allpress, N.; Glasson, N.; Gholamian, S.A. Fault Current Limiting HTS Transformer with Extended Fault Withstand Time. Supercond. Sci. Technol. 2019, 32, 035006. [Google Scholar] [CrossRef]
- Kasman, M.B. 6–36 kV Medium Voltage Underground Power Cables XLPE Insulated Cables; Nexans: Paris, France, 2016. [Google Scholar]
- De Sousa, W.T.B.; Shabagin, E.; Kottonau, D.; Noe, M. An Open-Source 2D Finite Difference Based Transient Electro-Thermal Simulation Model for Three-Phase Concentric Superconducting Power Cables. Supercond. Sci. Technol. 2020, 34, 015014. [Google Scholar] [CrossRef]
- Aigner, B.; Nollmann, M.; Stumpf, E. Design of a Hybrid Electric Propulsion System within a Preliminary Aircraft Design Software Environment; Deutsche Gesellschaft für Luft-und Raumfahrt-Lilienthal-Oberth eV: Germany, 2018. [Google Scholar]


| Parameter | Value |
|---|---|
| Maximum Number of Iterations | 100 |
| Crossover Percentage | 0.7 |
| Population Size | 500 |
| Mutation Percentage | 0.4 |
| Mutation Rate | 0.02 |
| Properties | Cable A | Cable B | Cable C |
|---|---|---|---|
| Voltage (kV) | 4.5 | 4.5 | 4.5 |
| Current (A) | 560 | 2000 | 2000 |
| Length (m) | 100 | 100 | 100 |
| Power (MW) | 2.25 | 9 | 9 |
| Operational temperature (K) | 65 | 65 | 65 |
| Type of superconducting tape | SC1 | SC1 | SC2 |
| Number of superconducting layer | 1 | 3 | 1 |
| Properties | SC1 | SC2 |
|---|---|---|
| Critical current (@ 65 K) (A) | 77 | 518 |
| Index value (@ 65 K) | 31.6 | 42.5 |
| Ec | 0.1 | 0.1 |
| Thickness (µm) | 153 | 170 |
| Width (mm) | 4.10 | 4 |
| Substrate thickness (µm) | 100 | 105 |
| Stabilizer thickness (µm) | 2 15 | 2 15 |
| Substrate material | Stainless Steel | Stainless Steel |
| Stabilizer material | Copper | Copper |
| Former Material | ||||
|---|---|---|---|---|
| Copper | 17 | 390 | 8960 | 0.004041 |
| Stainless Steel | 720 | 500 | 7800 | 0.00300 |
| Brass | 70 | 400 | 8730 | 0.00010 |
| Aluminum | 26 | 920 | 2700 | 0.004308 |
| Objective | f1 (kg) | f2 (K) | f3 | ||||||
|---|---|---|---|---|---|---|---|---|---|
| Function | Cable A | Cable B | Cable C | Cable A | Cable B | Cable C | Cable A | Cable B | Cable C |
| Copper | 122.7 | 169.8 | 119.7 | 128.5 | 123.2 | 115.2 | 0.47 | 0.48 | 0.32 |
| Stainless Steel | 111.3 | 158.4 | 108.6 | 266.6 | 265.8 | 151.2 | 0.47 | 0.47 | 0.32 |
| Brass | 120.4 | 167.5 | 117.6 | 280.5 | 279.5 | 152.4 | 0.47 | 0.48 | 0.32 |
| Aluminum | 61.5 | 108.5 | 60.1 | 149.3 | 141.6 | 124.2 | 0.47 | 0.47 | 0.32 |
| Cable Type | Former Material | Core Weight (kg) | Cryostat Weight (kg) | Fluid Weight (kg) | Total Weight (kg) | Specific Mass (kg/m) | Power Density (kW/kg) |
|---|---|---|---|---|---|---|---|
| Cable A | Copper | 122.7 | 183 | 266 | 571.7 | 5.7 | 3.9 |
| Cable A | Aluminum | 61.5 | 183 | 266 | 510.5 | 5.1 | 4.4 |
| Cable B | Copper | 169.8 | 210 | 350 | 729.8 | 7.3 | 12.3 |
| Cable B | Aluminum | 108.5 | 210 | 350 | 668.5 | 6.7 | 13.5 |
| Cable C | Copper | 119.7 | 179 | 256 | 554.7 | 5.5 | 16.2 |
| Cable C | Aluminum | 60.1 | 179 | 256 | 495.1 | 4.9 | 18.2 |
Publisher’s Note: MDPI stays neutral with regard to jurisdictional claims in published maps and institutional affiliations. |
© 2022 by the authors. Licensee MDPI, Basel, Switzerland. This article is an open access article distributed under the terms and conditions of the Creative Commons Attribution (CC BY) license (https://creativecommons.org/licenses/by/4.0/).
Share and Cite
Sadeghi, A.; Yazdani-Asrami, M. Multi-Objective Optimization for Improving Weight and Fault Characteristics of a DC HTS Cable in Cryo-Electric Aircraft. Aerospace 2022, 9, 753. https://doi.org/10.3390/aerospace9120753
Sadeghi A, Yazdani-Asrami M. Multi-Objective Optimization for Improving Weight and Fault Characteristics of a DC HTS Cable in Cryo-Electric Aircraft. Aerospace. 2022; 9(12):753. https://doi.org/10.3390/aerospace9120753
Chicago/Turabian StyleSadeghi, Alireza, and Mohammad Yazdani-Asrami. 2022. "Multi-Objective Optimization for Improving Weight and Fault Characteristics of a DC HTS Cable in Cryo-Electric Aircraft" Aerospace 9, no. 12: 753. https://doi.org/10.3390/aerospace9120753
APA StyleSadeghi, A., & Yazdani-Asrami, M. (2022). Multi-Objective Optimization for Improving Weight and Fault Characteristics of a DC HTS Cable in Cryo-Electric Aircraft. Aerospace, 9(12), 753. https://doi.org/10.3390/aerospace9120753