Article

Study of the Mechanical Properties of Near-Space Airship Envelope Material Based on an Optimization Method

1
School of Aeronautics and Astronautics, Shanghai Jiao Tong University, Shanghai 200240, China
2
Aerospace System Engineering Shanghai, Shanghai 201108, China
3
School of Aerospace Engineering and Applied Mechanics, Tongji University, Shanghai 200092, China
*
Author to whom correspondence should be addressed.
Aerospace 2022, 9(11), 655; https://doi.org/10.3390/aerospace9110655
Submission received: 9 August 2022 / Revised: 17 October 2022 / Accepted: 24 October 2022 / Published: 26 October 2022

Abstract

:
An optimal calculation method for the mechanical properties of near-space capsule materials was proposed. First, biaxial tensile tests under low tensile ratios were carried out on the envelope materials of a near-space airship. The experimental results showed that the values of the elastic modulus and Poisson’s ratio, which are significantly affected by the warp and weft stresses, were not constant. Second, the elastic modulus and Poisson’s ratio of the near-space airship were obtained by using the traditional calculation method, and the limitations of this method were discussed. Third, an optimal calculation model for the elastic modulus and Poisson’s ratio of airship envelopes was proposed. The strain calculated by the proposed optimization model could be effectively correlated to the strain measured by the experiment. Then, through the user-defined subroutine of the finite element method and the elastic modulus and Poisson’s ratio calculated by the proposed optimization, the strain of the finite element simulation was obtained. The average error between the simulation results and the experimental values was approximately 8.21% (warp) and 8.41% (weft). The proposed method can consider the nonlinear changes of the elastic modulus and Poisson’s ratio of membrane material under different stress ratios and predict the force and deformation of the airship’s capsule more accurately, which is adaptable to engineering applications.

1. Introduction

A near-space airship is a cost-effective alternative to Earth-orbiting satellites for sightseeing, aerial photography, communication, and weapon transport, and has become a strategic platform for many countries, which is operating at an altitude of 20–100 km [1,2,3,4,5]. The envelope, which is located outside the ballonet, is an essential structure of the near-space airship; it creates the aircraft’s external shape and provides differential pressure balance [6,7,8,9]. According to the different main structural materials of envelope materials, the structure of aerosols envelope material can be roughly divided into two categories: fabric material and polymer flexible film material. Fabric materials are also called textile composites. Compared with traditional composites, textile composites have uniform mechanical properties, and higher strength and modulus. Compared with polymer flexible film materials, its strength is also more suitable for the special environment of stratospheric airships. Fabric materials used on airships are generally divided into the thermal bonding layer, structural layer, and helium barrier layer. Therefore, the airship envelope is a kind of high-performance material, and its mechanical properties directly affect the appearance and safety of near-space airships. A plain-woven composite is the most common envelope material used for near-space airships due to its low density, high strength, good sealing performance, and strong corrosion resistance [10]. These characteristics are critical, as the material bears almost all the weight of the envelope. Therefore, when designing the envelope, it is vital to study the stress–strain characteristics. Generally, the mechanical properties of envelope material can be regarded as elastic, nonlinear-elastic [11], viscoelastic [12], or viscoplastic [13] in analysis models. The choice of models is determined by the type of coated fabric, but it is always open to question. In 1997, Nayfed proposed a nonlinear constitutive model for plain woven fabrics based on the meso-mechanical behavior of representative elements [14]. In 2007, B. Nedjar proposed a fully three-dimensional constitutive model for anisotropic viscoelastic suitable for the macroscopic description of fiber-reinforced composites that experience finite strains [15]. In 2017, Meng Junhui obtained several parameters reflecting the material properties of the capsule based on the invariant theory [16].
Envelope materials with different stress ratios for the warp and weft directions create a complex force condition. To date, the biaxial tensile test has been the preferred method to study the mechanical properties of plain-weave fabrics. The MSAJ standard [17,18] is a widely accepted standard for the biaxial testing of woven fabrics and is recommended by American Standard ASCE1852 (1996) [19]. The MSAJ standard recommends the minimum strain residual method, the minimum stress residual method, and the best approximation method to calculate the mechanical property parameters of plain weaves. All three approaches lead to the same result. The standard’s principle is based on the least square method to find mechanical properties’ parameters. Bridgens explained and demonstrated the methodologies used in the MSAJ standard using sets of anonymous test data. Dinh defined the material parameters of orthotropic elasticity using the least square method mentioned in the standard MSAJ/M-02-1995 [20]. Three methods are recommended by the MSAJ standard to calculate property parameters, namely, the minimum strain residual method, the minimum stress residual method, and the best approximation method. However, these methods can only be used as a simple assessment of the overall mechanical properties of the test material but are not suitable for describing the nonlinear stress–strain relationship. For example, although the mechanical elastic constants can be obtained by the minimum strain residual method, the precise mechanical properties of the material in a certain tensile state cannot be derived, and while the elastic modulus constants for envelope material can be estimated, they cause changes based on tensile stress.
Compared with the minimum strain residual method, the approximate method can reflect the stress–strain relationship more accurately and directly. Bridgens used spline functions to define the response surfaces of coated woven fabrics [21]. Chen used elastic parameter response surfaces to reveal the mechanical behaviors of URETEK3216LV plain-weave fabrics [22]. For nonlinear models, a curved surface enables a better presentation of the experimental materials’ characteristics [23]. Bai established a constitutive equation for envelope material, considering temperature by combining the normal and temperature stresses, including two-, six-, and ten-parameter nonlinear and integral viscoelastic constitutive equations [24]. Xie described the experiment and an approximate model method using UN-5100 materials, however, it cannot solve the calculation problem of elastic modulus variation [25]. The response surface approximation model can reflect the stress–strain relationship of envelope material well in biaxial tension, but the elastic modulus and Poisson’s ratio are more suitable for engineering applications. In general, the mechanical properties of plain weaves are orthotropic elastic materials. Therefore, the stress–strain relationship of plain-weave fabrics can be approximated using the orthotropic plane model. And elastic parameters are not stable, which cannot be calculated using the experimental data in the orthotropic plane model.
In summary, the elastic modulus and Poisson’s ratio are affected by the warp and weft stress, thus, their values are not constant. The general definition of “elastic modulus” is the stress in a unidirectional stress state divided by the strain in that direction. Elastic modulus is a physical quantity describing the elasticity of a material, which is a general term. In this test, the elastic modulus is constantly changing, consistent with nonlinear results. However, if in a very short period of time, the relationship between stress and strain can be regarded as linear, which satisfies the general definition of elastic modulus. The traditional calculation method cannot effectively obtain the elastic modulus and Poisson’s ratio under different stress conditions. Therefore, it is necessary to use a calculation method that can better reflect the nonlinear variation characteristics of the elastic modulus and Poisson’s ratio of envelope materials. The framework of this paper is as follows. First, the methods for analyzing the mechanical properties of near-space airship envelope materials are summarized, including the traditional calculation model, the optimization calculation model proposed in this work, the genetic algorithm, and the overall analysis process of this study. Second, the biaxial tensile test of UN-5100 plain-weave fabric is presented. Third, using the experimental data, the results of the traditional calculation model and the optimized calculation model are compared and analyzed. Then, the finite element method using VFABRIC to simulate the stress and strain on UN-5100 plain-weave fabric under a low-stress ratio is presented, and the validity of the optimization model is verified. Finally, some main conclusions are drawn.

2. Methodology

2.1. Optimization Calculation Model

As introduced above, as the plain weave is very thin, it is generally considered that the mechanical properties of plain weave are orthotropic elastic materials. The stress–strain relationship of plain weave fabrics for orthotropic plane models can be approximated.
The stress–strain relationship of plain weave is:
ε x ε y = 1 E x ν y x E y ν x y E x 1 E y σ x σ y
where ε = strain, σ = stress, E = elastic modulus, ν = Poisson’s ratio, and the subscripts x and y denote the warp and weft directions, respectively. The above formula is the constitutive formula of the material in this paper, and the optimization calculation method below is based on this formula. According to the stress–strain curve of the biaxial tensile test, a univariate quadratic polynomial can be used to fit the curve:
σ = α 1 ε 2 + α 2 ε + α 3
The elastic modulus [26] at any moment can be obtained by deriving 𝜀 in the above equation of warp and weft directions. However, the elastic modulus obtained by this method only considers the effect of the stress in one direction. In fact, the stress in warp and weft directions will both affect the elastic modulus of the material. Therefore, the elastic modulus can be assumed to be the initial 𝐸𝑥0 and 𝐸𝑦0, and the below bivariate quadratic polynomial can be obtained:
E x 0 = λ 00 + λ 01 σ x + λ 02 σ x 2 + λ 03 σ y + λ 04 σ y 2 + λ 05 σ x σ y
E y 0 = κ 00 + κ 01 σ x + κ 02 σ x 2 + κ 03 σ y + κ 04 σ y 2 + κ 05 σ x σ y
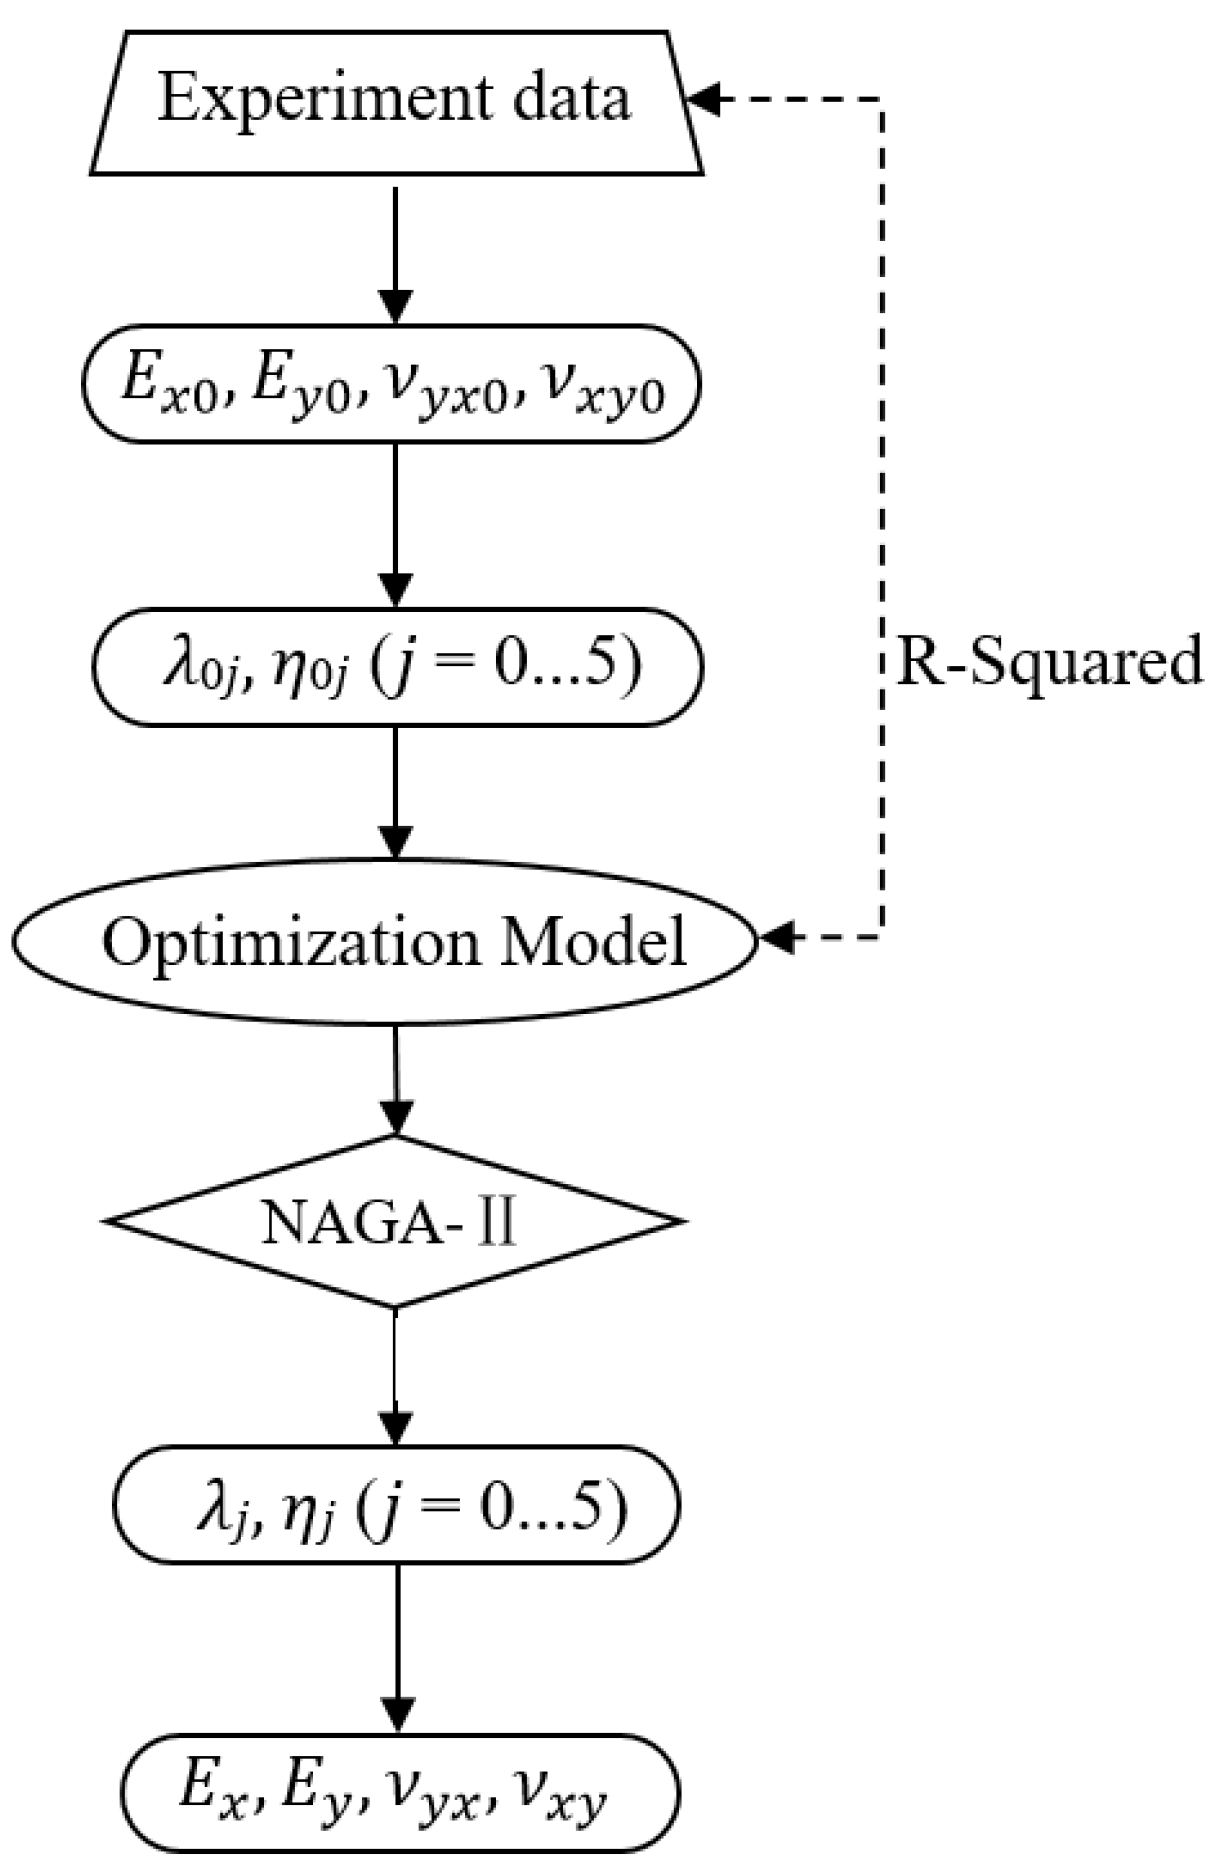
where 𝜆0𝑗, 𝜅0𝑗 𝑎𝑛𝑑 𝜂0𝑗 (𝑗 = 0...5) are the initial optimization variables. The significance of each monomial term in the above bivariate quadratic polynomial is shown in Figure 1. ’𝜆05′ and ’𝜅05′ in the above bivariate quadratic polynomial evaluate the effect of both 𝜎𝑥 and 𝜎𝑦 on the elastic modulus 𝐸𝑥0 and 𝐸𝑦0.
According to Equation (1) and Equations (3) and (4), the initial Poisson’s ratio 𝜈𝑦𝑥0 and 𝜈𝑥𝑦0 can be calculated using the following formula:
ν y x 0 = σ x E x 0 ε x E y 0 σ y
ν x y 0 = E x 0 E y 0 ν y x 0
The above initial Poisson’s ratio can be fitted using the bivariate quadratic polynomial:
ν y x 0 = η 00 + η 01 σ x + η 02 σ x 2 + η 03 σ y + η 04 σ y 2 + η 05 σ x σ y
After filling in the data of the initial elastic modulus and the initial Poisson’s ratio, the initial optimization variables 𝜆0𝑗, 𝜅0𝑗 𝑎𝑛𝑑 𝜂0𝑗 (𝑗 = 0...5) can be obtained.
Thus, the optimization model can be established as follows:
O b j : max   R - Square x max   R - Square y
s . t . ν x i ( 0 , 1 2 ) ν y i ( 0 , 1 2 ) R - Square x 0.9 , 1 R - Square y 0.9 , 1
v a r s : λ j λ 0 j λ 0 j 2 , λ 0 j + λ 0 j 2 , j = 1 5 . κ j κ 0 j κ 0 j 2 , κ 0 j + κ 0 j 2 , j = 1 5 . η j η 0 j η 0 j 2 , η 0 j + η 0 j 2 , j = 1 5 .
where Obj is the optimization objective, s.t. is the constraint condition, vars are the optimization variables, and the subscripts x and y denote the warp and weft directions. According to the performance of the membrane material under uniaxial tension, in the constraint conditions, the Poisson’s ratio is set between 0∼0.5 [27], which means that the material will contract in the weft direction and elongate in the warp direction when under uniaxial tension in the weft direction. R-Squared can be calculated using the following equation:
R - Square x = 1 i = 1 N ε x i ε x i 2 i = 1 N ε x i ε ¯ x i 2
R - Square y = 1 i = 1 N ε y i ε y i 2 i = 1 N ε y i ε ¯ y i 2
where N is the sample number, ε are the real values, and ε ¯ is the average value of ε i . 𝜀 is the interpolation value, which can be calculated using the following equations:
ε x = σ x E x ν x y σ y E y
ε y = σ y E y ν y x σ x E x
The elastic modulus 𝐸 and Poisson’s ratio 𝜈 can be obtained by:
E x = λ 0 + λ 1 σ x + λ 2 σ x 2 + λ 3 σ y + λ 4 σ y 2 + λ 5 σ x σ y
E y = κ 0 + κ 1 σ x + κ 2 σ x 2 + κ 3 σ y + κ 4 σ y 2 + κ 5 σ x σ y
ν y x = η 0 + η 1 σ x + η 2 σ x 2 + η 3 σ y + η 4 σ y 2 + η 5 σ x σ y
ν x y = E y E x ν y x
Through the optimization model, the variables 𝜆𝑗, 𝜅𝑗, 𝜂𝑗 (𝑗 = 0...5), 𝜈𝑦𝑥 and 𝜈𝑥𝑦, and the elastic modulus considering both the warp and weft stresses can be obtained.
The analysis process of this optimal calculation method is shown in Figure 2. First, a specimen of UN-5100 plain-weave fabric was tested by a biaxial tensile testing machine, and the experimental data, such as warp and weft stresses and strains, were obtained. On the one hand, the experimental data were substituted into the traditional model to calculate the corresponding elastic modulus and Poisson’s ratio. On the other hand, the parameters in the fitting equation of the elastic modulus and Poisson’s ratio can be obtained using the optimization model based on the NSGA-II optimization algorithm [1]. By using these parameters, the elastic modulus and Poisson’s ratio can be calculated and compared with those obtained by the traditional model. In addition, with the help of VFABRIC and Abaqus, the finite element simulation model was obtained and verified with the original experimental data to prove the effectiveness of the proposed optimization method in this study.

2.2. Optimization Algorithm Method

Generally, optimization methods can be divided into single objective optimization and multi-objective optimization. For the former, the optimization process is driven by a single objective function to find the optimal solution for the optimization parameters. In the second case, multiple objective function-driven processes ultimately achieve trade-offs among them.
Optimization algorithms can be used to find the optimal solution for a particular problem or a group of optimal solutions for a specific design space, and they are widely used in many fields. Many optimization algorithms based on different numerical methods or logic strategies for specific problems have been developed. These methods can be generally divided into numerical optimization algorithms and global optimization algorithms. Numerical optimization algorithms, such as the feasible direction method [28,29,30] and the nonlinear conjugate gradient method [31], are generally much faster than intelligent optimization algorithms. However, the results of numerical optimization algorithms are highly dependent on the initial value, which may lead to local optimization if the initial search point is not appropriate. A global optimization algorithm can realize global optimization without calculating the local gradient and has no strict requirements regarding the initial search point. Typical global optimization algorithms include the simulated annealing (SA) [32] algorithm, the genetic algorithm (GA) [33,34], and the particle swarm optimization (PSO) [35] algorithm.
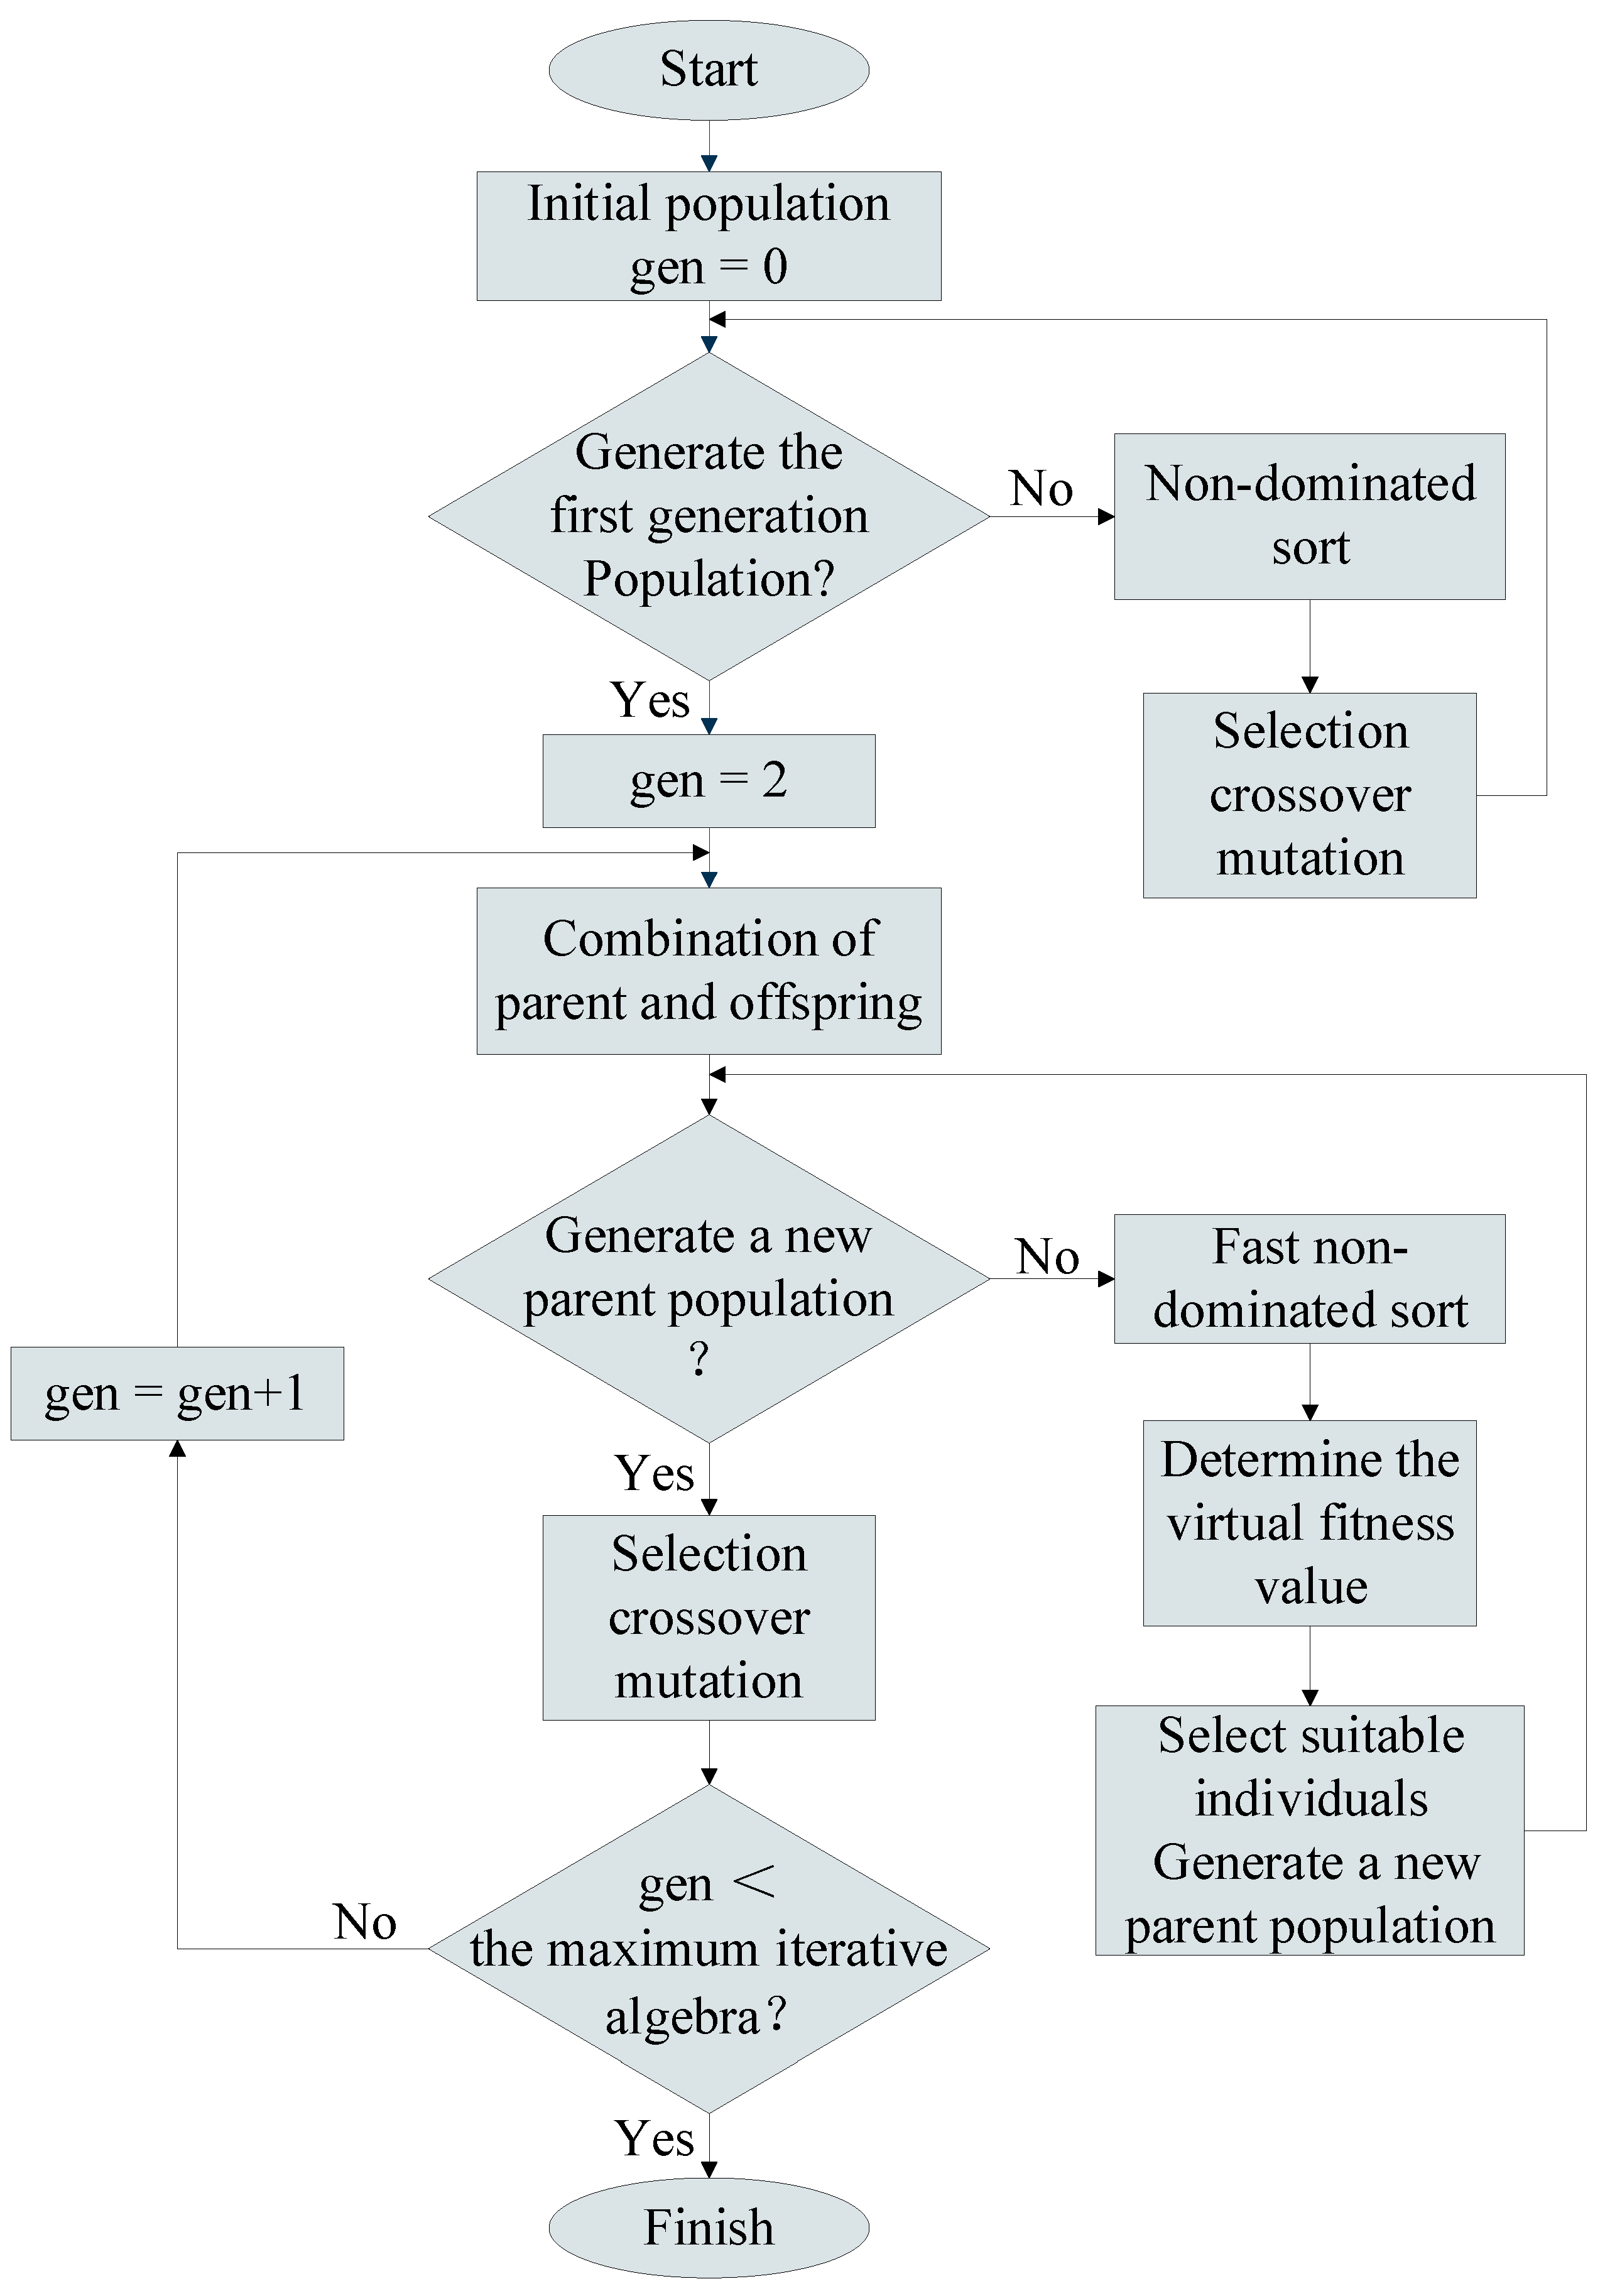
A non-dominated sorting genetic algorithm with elite strategy (NSGA-II [36]) was proposed by Deb et al. It is founded on a non-dominated sorting genetic algorithm based on the Pareto optimal concept (NSGA [37]) that overcomes the defect of the high operation complexity of the NSGA and greatly improves the performance of the algorithm. The basic flow chart of the NSGA-II is shown in Figure 3.
In the Pareto optimal frontier, the NSGA-II takes the crowding calculation and elite strategy into account at the same time and adopts a crowding comparison operator to reduce the computational complexity of the algorithm and avoid local convergence in the optimization process. Based on the Pareto optimal solution concept, the weight of each objective function does not need to be assigned artificially, and the result is a non-inferior solution set. Individuals in the Pareto optimal frontier can evenly expand to the whole solution space, which ensures diversity of the population, high efficiency, and great robustness. The optimal design parameter combination can be selected according to the actual situation.

3. Experiments

3.1. Experimental Material and Equipment

The UN-5100 material is a type of plain-weave material that has a low density (100 g/m2), low air permeability, strong environmental corrosion resistance, and high strength, and it can be used in near-space airships. The fiber in UN-5100 is Vectran [38,39], 40 fibers per yarn, and its linear density, fiber elastic modulus, and Poisson’s ratio are 22.2 tex, 75 Gpa, and 0.283, respectively. Polyethene terephthalate (PET) was used for thermal bonding and helium barrier layers. Information provided by the manufacturer shows that the UN-5100 material’s uniaxial tensile strengths are 568 and 540 N/cm (room temperature) in the warp and weft directions, respectively. Its micromorphology is shown in Figure 4.
A specimen and the testing machine are shown in Figure 5.
The self-developed biaxial tensile testing machine (SJTU-I) was adopted for this biaxial test. The strain measurement range of the biaxial tensile testing machine is −10∼20%, the standard tensile rate of the fixture is 2∼4 mm/min, and the real-time control is 1∼5 microseconds. A precision servo-hydraulic cylinder is used as the power device. The flow rate is accurately controlled by proportional and overflow valves. The closed-loop feedback of the force sensor and the PID controller is used for real-time control. The accurate tracking of the arbitrary load spectrum can be realized.
The dimensions of the biaxial tensile specimen were obtained with reference to the standard ISO1421-1998, as shown in Figure 6. Four PE rods were fixed to the tensile testing machine, and the slits in the arms in each direction of the specimen ensured uniform stress at the center of the specimen. In this test, digital image correlation (DIC) technology was used instead of an extensometer to obtain higher precision strains. DIC technology is a non-contact, full-field measurement method that has the advantages of a broad strain range, high precision, simple equipment, minimal requirements for a test environment, and smooth operation.

3.2. Test Procedure

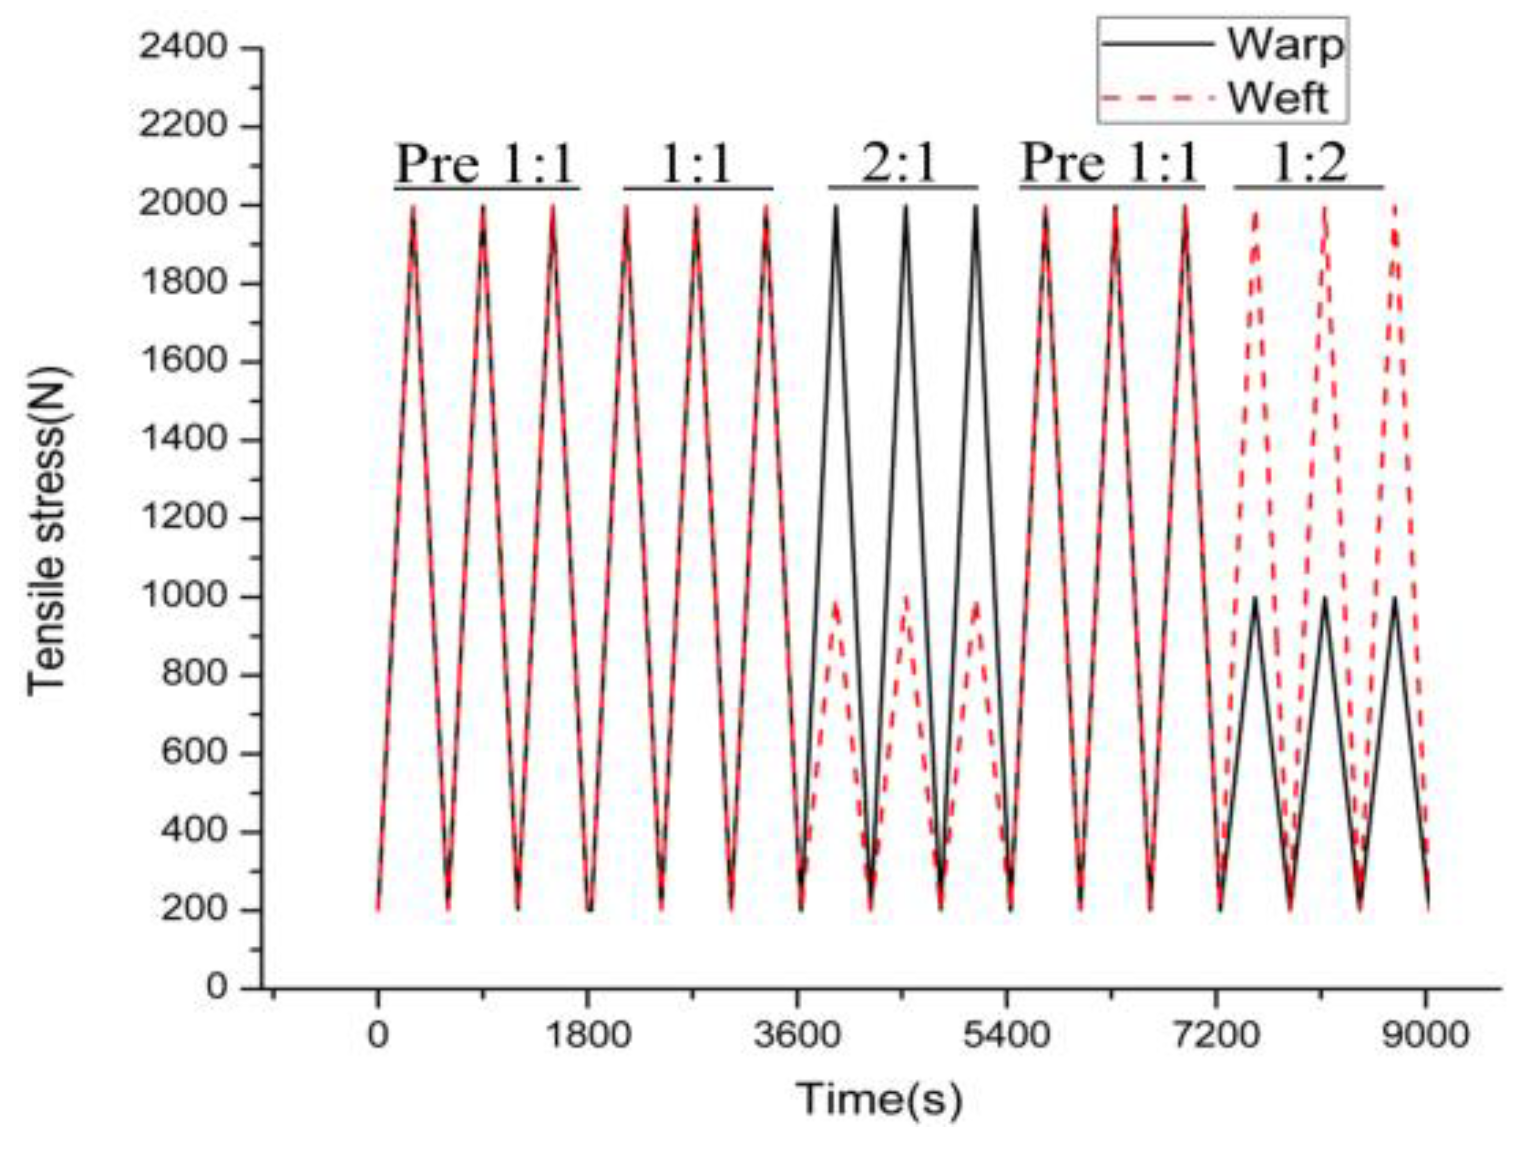
The described experiments were conducted, followed by the stress protocol shown in Figure 7. The tensile test was carried out on the specimen with the tensile ratios of 1:1, 2:1, and 1:2 because the airship envelope is commonly under a low-stress ratio. In addition, according to the maximum uniaxial tensile strength of the material provided by the manufacturer, a quarter of the maximum value was taken as the maximum value of the biaxial tension. The test environment provided a humidity of 60 ± 4.0% and a temperature of 23 ± 2.0 °C. To avoid initial latitudinal and high latitudinal stresses, residual stresses of 200 N were applied. This method also had the advantage of preventing the specimen from loosening in the initial state.

4. Results and Discussions

4.1. Analysis of Experimental Data

Three loading ratios (1:1, 2:1, and 1:2) were tested, and each ratio was cycled three times. Figure 8 shows the stress–strain curves of the specimen at the different ratios, where the strain is the machine’s record of the entire specimen. It can be observed that in the third cycle, the stress–strain curve tends to be stable. Accordingly, the subsequent analysis was based on the results of the third cycle. It needs to be emphasized that for the stress of the airship membrane material, the unit is generally kN/m [39].
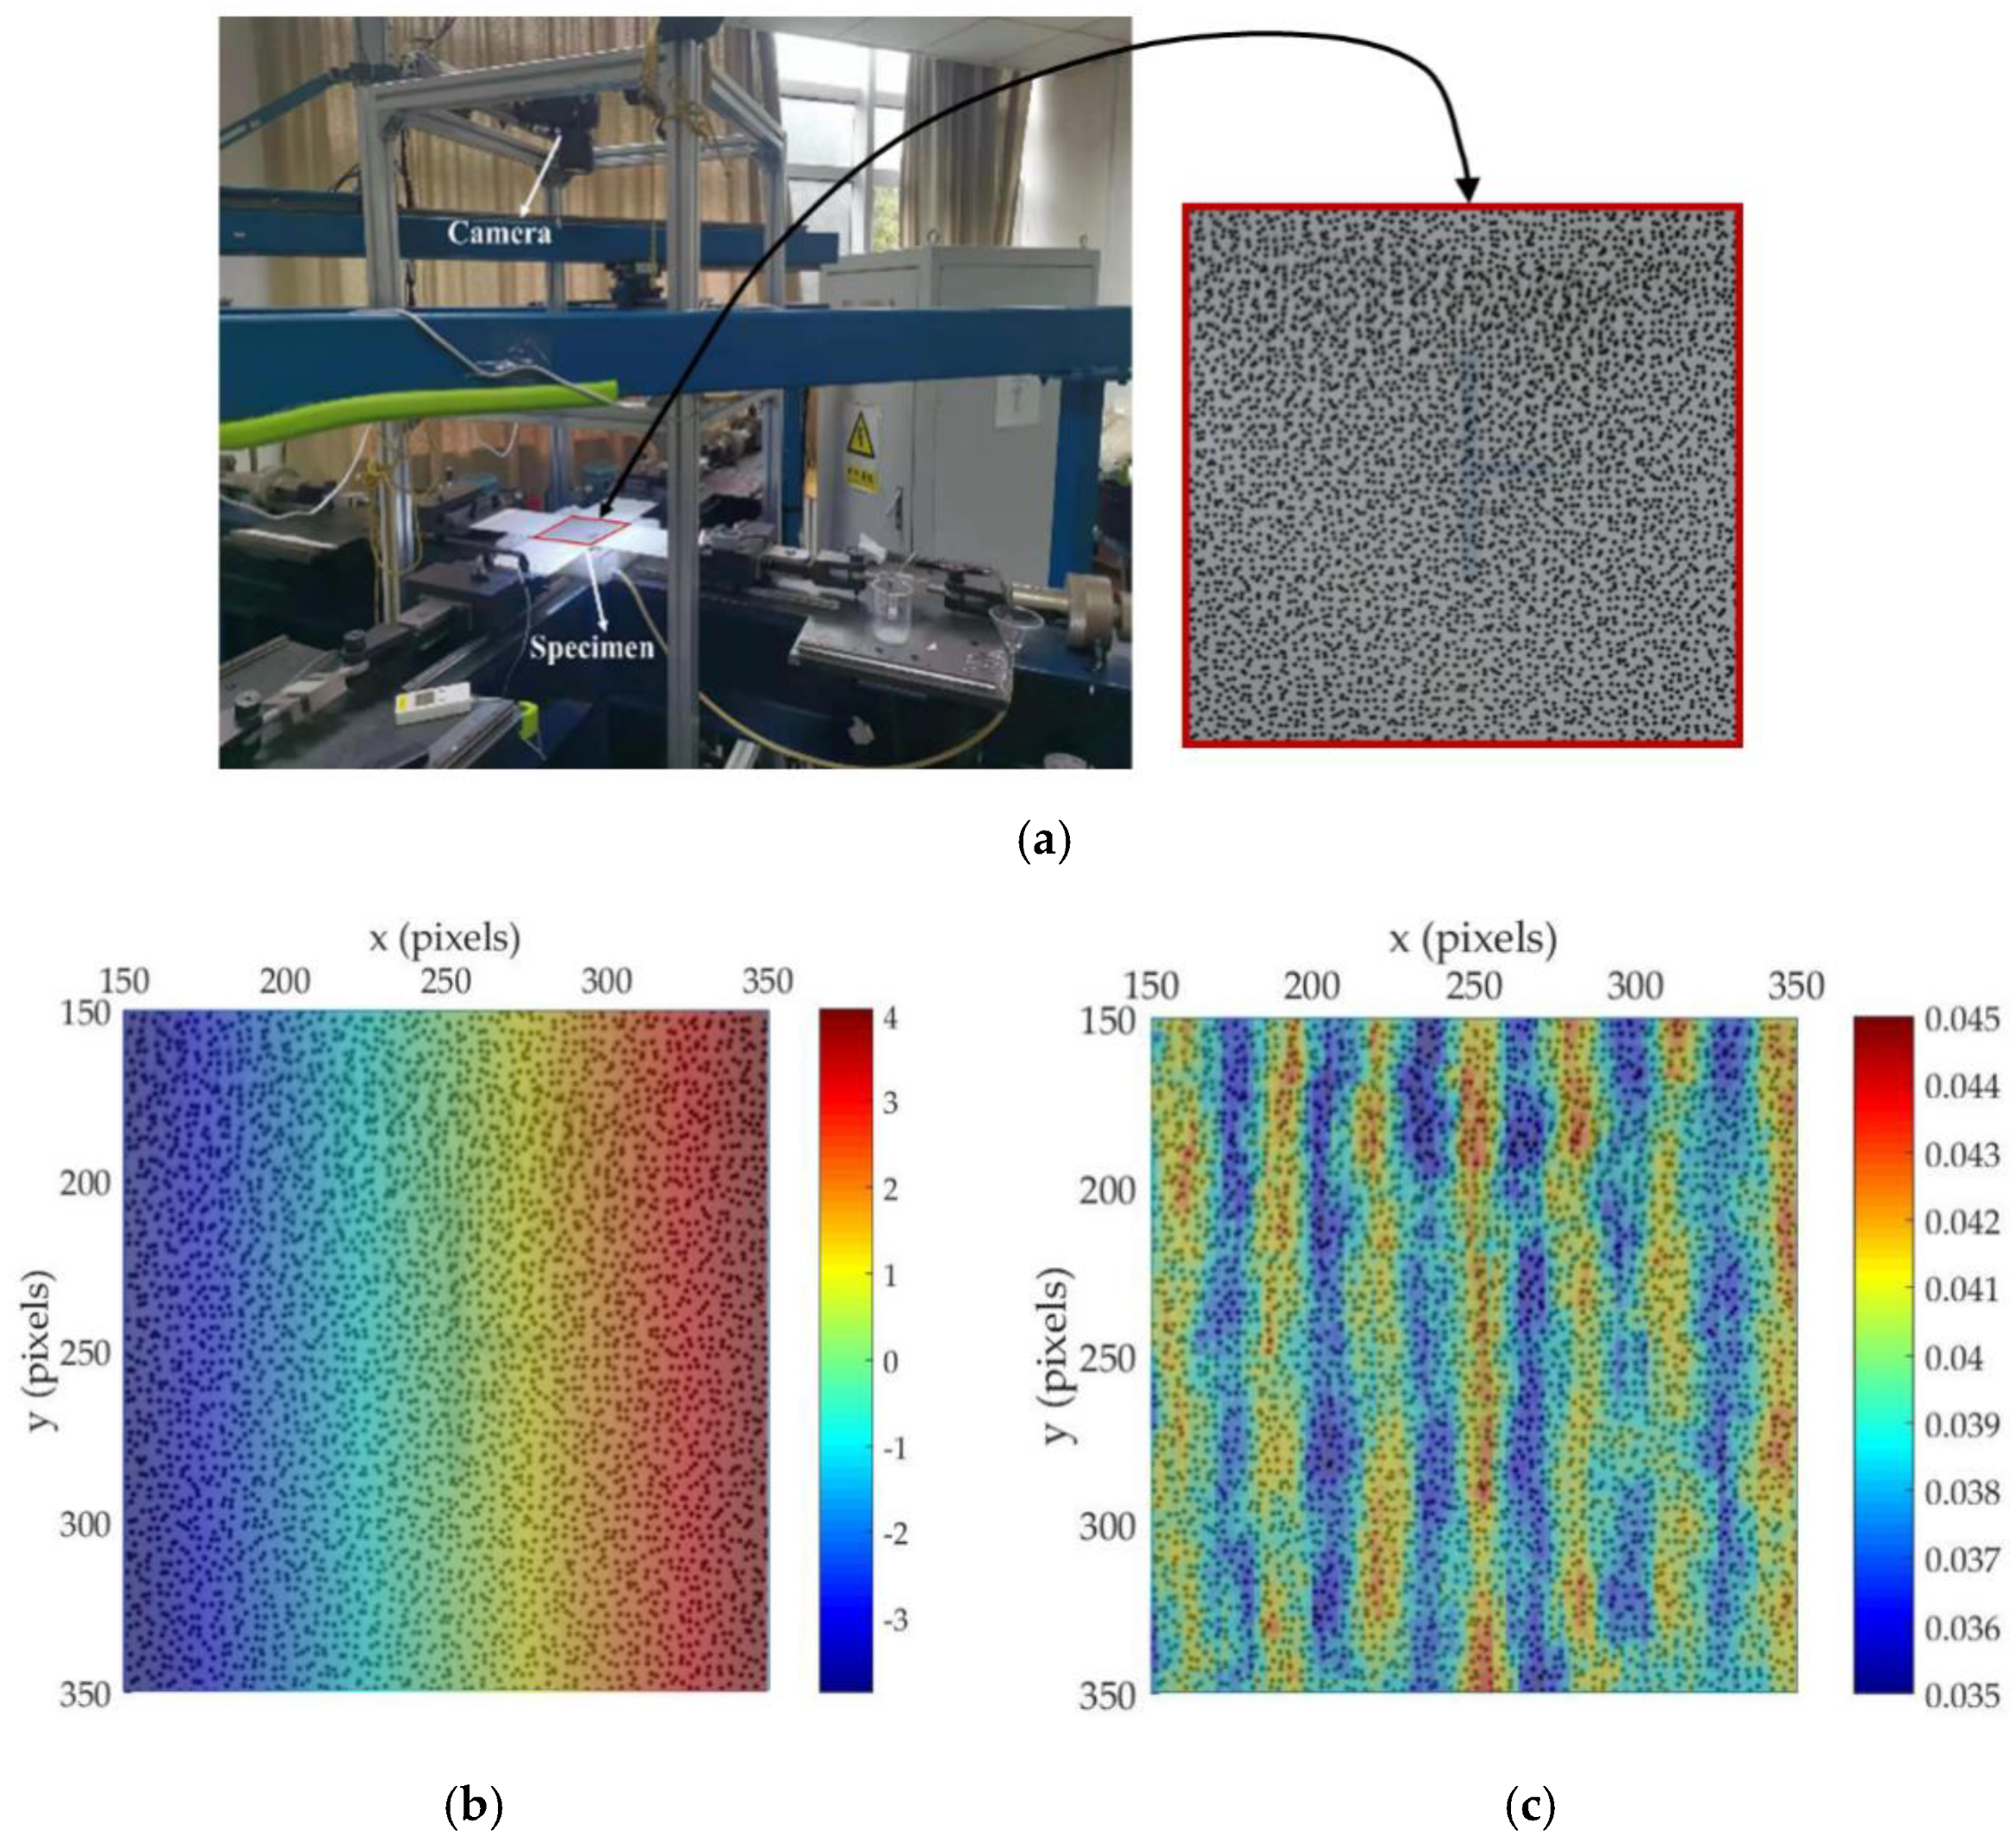
As the strain calculation of the biaxial tensile machine is based on the whole specimen, and this paper actually needs to consider the strain value of the central part of the specimen, it is best to accurately reflect the strain distribution of the flash spot region in the center of the specimen. Therefore, flash spot region images were recorded with a camera during the test, the deformation of the flash spot region at each time was calculated and analyzed by DIC technology, and the corresponding displacement and strain of the flash spot region were obtained. The camera is equipped with a new 24.2-megapixel CMOS sensor and EXPEED 3 digital image processor, the camera is set to take a picture of the flash spot region every 10 s.
Figure 9 is the displacement and strain nephogram of the specimen’s flash spot region in x direction at a certain time.
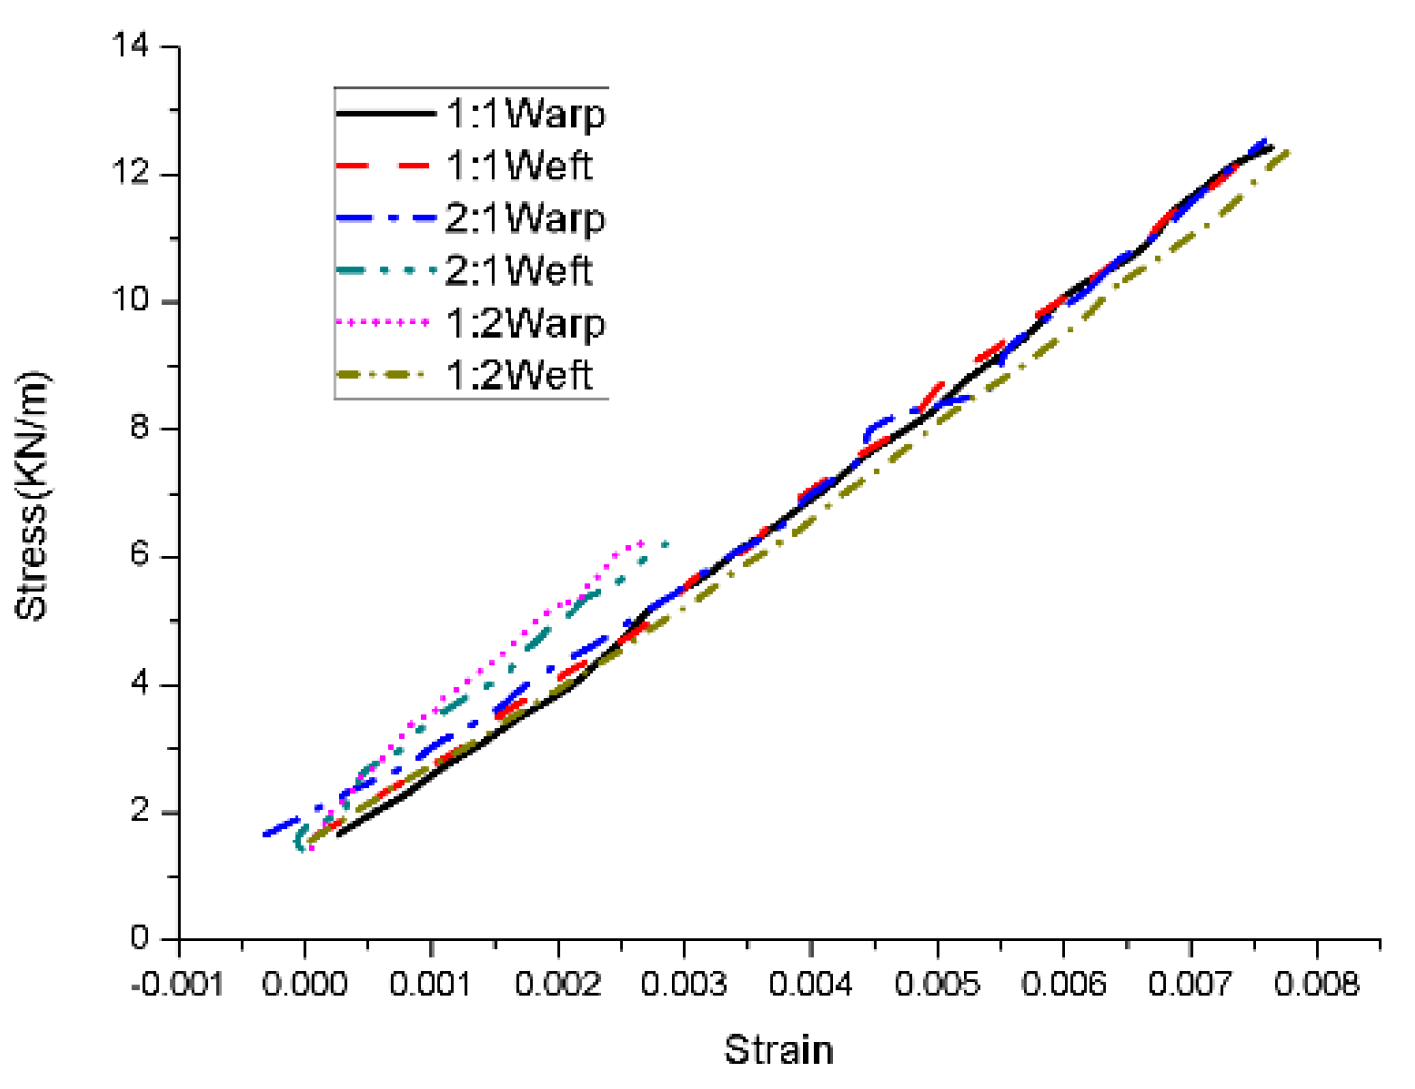
As can be seen in Figure 9c, the strain nephogram at the center of the specimen is strip-shaped, which is mainly caused by the special structure of the membrane material under the action of tensile force. The method of this research was to take the mean value of the strain at the center of the flash spot region. Figure 10 shows the relationship between the strain and the stress in the third cycle, where the strains were obtained using DIC technology.
From the results of the stress–strain curves, the relationship between stress and strain is nonlinear, and the slope of each curve changes continuously. Table 1 shows the slope range of each curve; the change in the slopes indicates the change in the elastic modulus. When the stress ratio = 2:1, the 𝐸𝑥 increased, and the 𝐸𝑦 decreased along with the stress increase, which is opposite to when the stress ratio = 1:2. Therefore, during the finite element simulation of the envelope materials, ignoring the change in the elastic modulus cannot accurately and effectively predict the mechanical properties of membrane materials and structural characteristics of a near-space airship.
Following the least square method presented previously, the elastic modulus and Poisson’s ratio of the specimen have been calculated, as shown in Table 2.
As evident in Table 2, the elastic modulus and Poisson’s ratio of the plain-weave airship material calculated by the traditional method are the comprehensive evaluation of the overall mechanical properties of the material, which cannot meet the precise prediction of the mechanical properties of the membrane.

4.2. Analysis of Optimization Results

Through the optimization model and the NSGA-II (population size = 96, number of generations = 200, and crossover probability = 0.95), the results of the optimizations under each stress ratio are obtained and shown in Table 3. The R-squared of both stress ratios is greater than 0.9, indicating that the results are accurate.
Based on the above parameters, the values of the elastic modulus and Poisson’s ratio at any low-stress ratio can be calculated, and their ranges are shown in Table 4.
The elastic modulus obtained by the optimization model is quite different from Table 1, which is only considering uniaxial stress. Similarly, it is also different from the values in Table 2, which were calculated by the traditional model. The elastic modulus and Poisson’s ratio in Table 2 are the overall evaluation of the mechanical properties of the UN-5100 material. The values in Table 4, which were obtained through the optimization model and optimization algorithm, can more precisely describe the mechanical properties of the UN-5100 at any low-stress ratio.

4.3. Validation

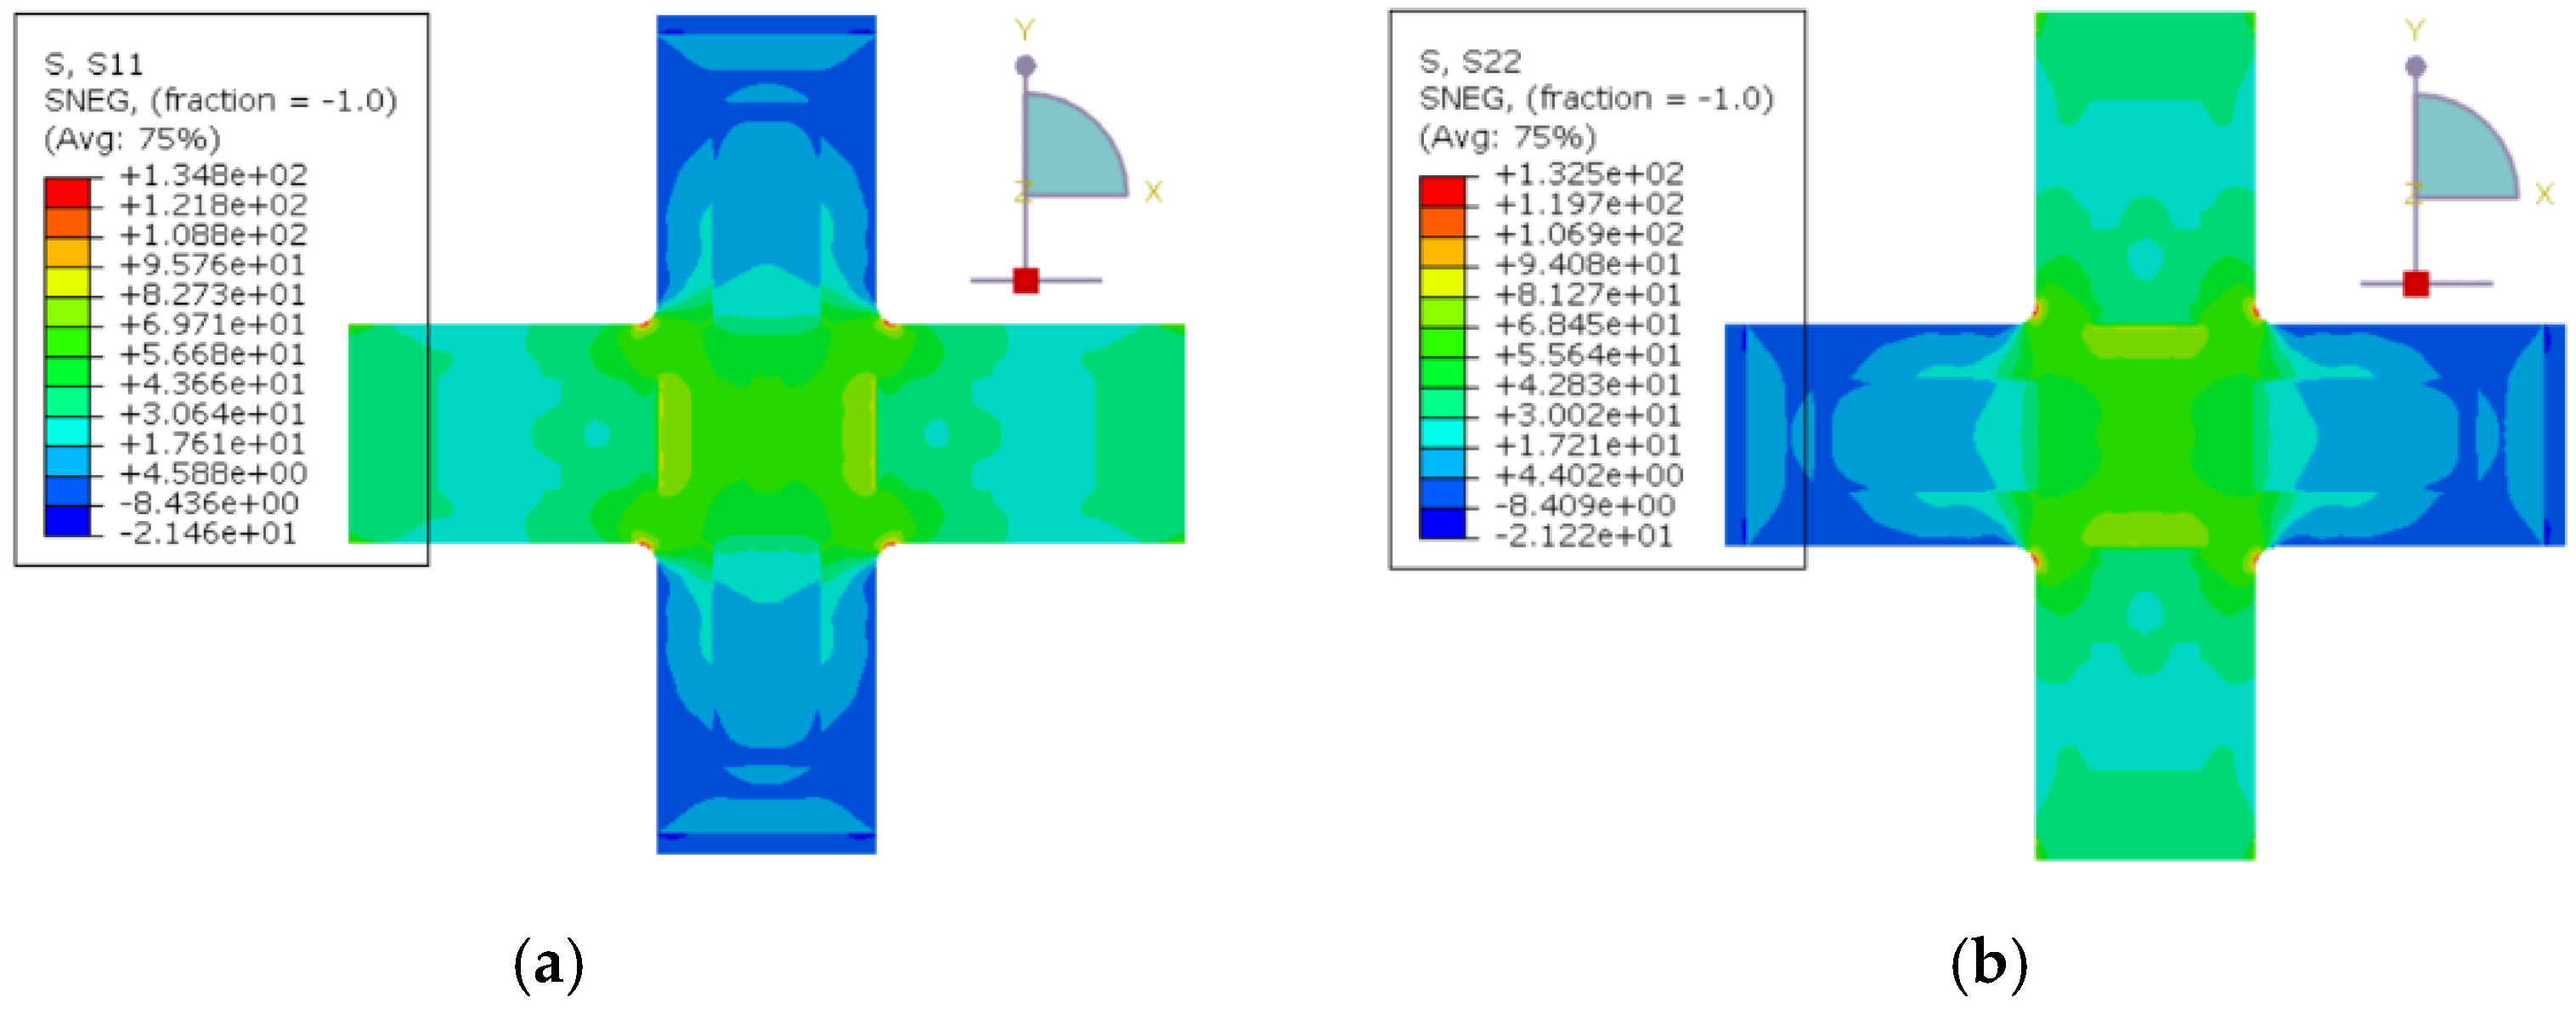
According to the shape and size of the specimen in the biaxial tensile experiment, a finite element model of the biaxial tensile specimen was established in Abaqus software, as shown in Figure 11. The finite element model was composed of 54,010 M3D4R grids. As the membrane element was selected, tension cannot be converted into pressure on the boundary section. If concentrated force is applied to the nodes of the boundary element, extreme deformation of elements at the boundary will be caused. In this research, reference points were set at the periphery of each boundary of the specimen, each edge was coupled with the reference points of the boundary, and tension was applied to the reference points. The loading condition was 900 N force applied at each reference point. The mechanical parameters of the material in the finite element model indicated the compiled VFABRIC user subroutine.
Figure 12 shows the warp and weft stress distribution of the finite element model. It can be seen from the strain diagram that the stress distribution is progressive. The warp and weft stresses in the central region of the sample range from 60 MPa to 65 MPa.
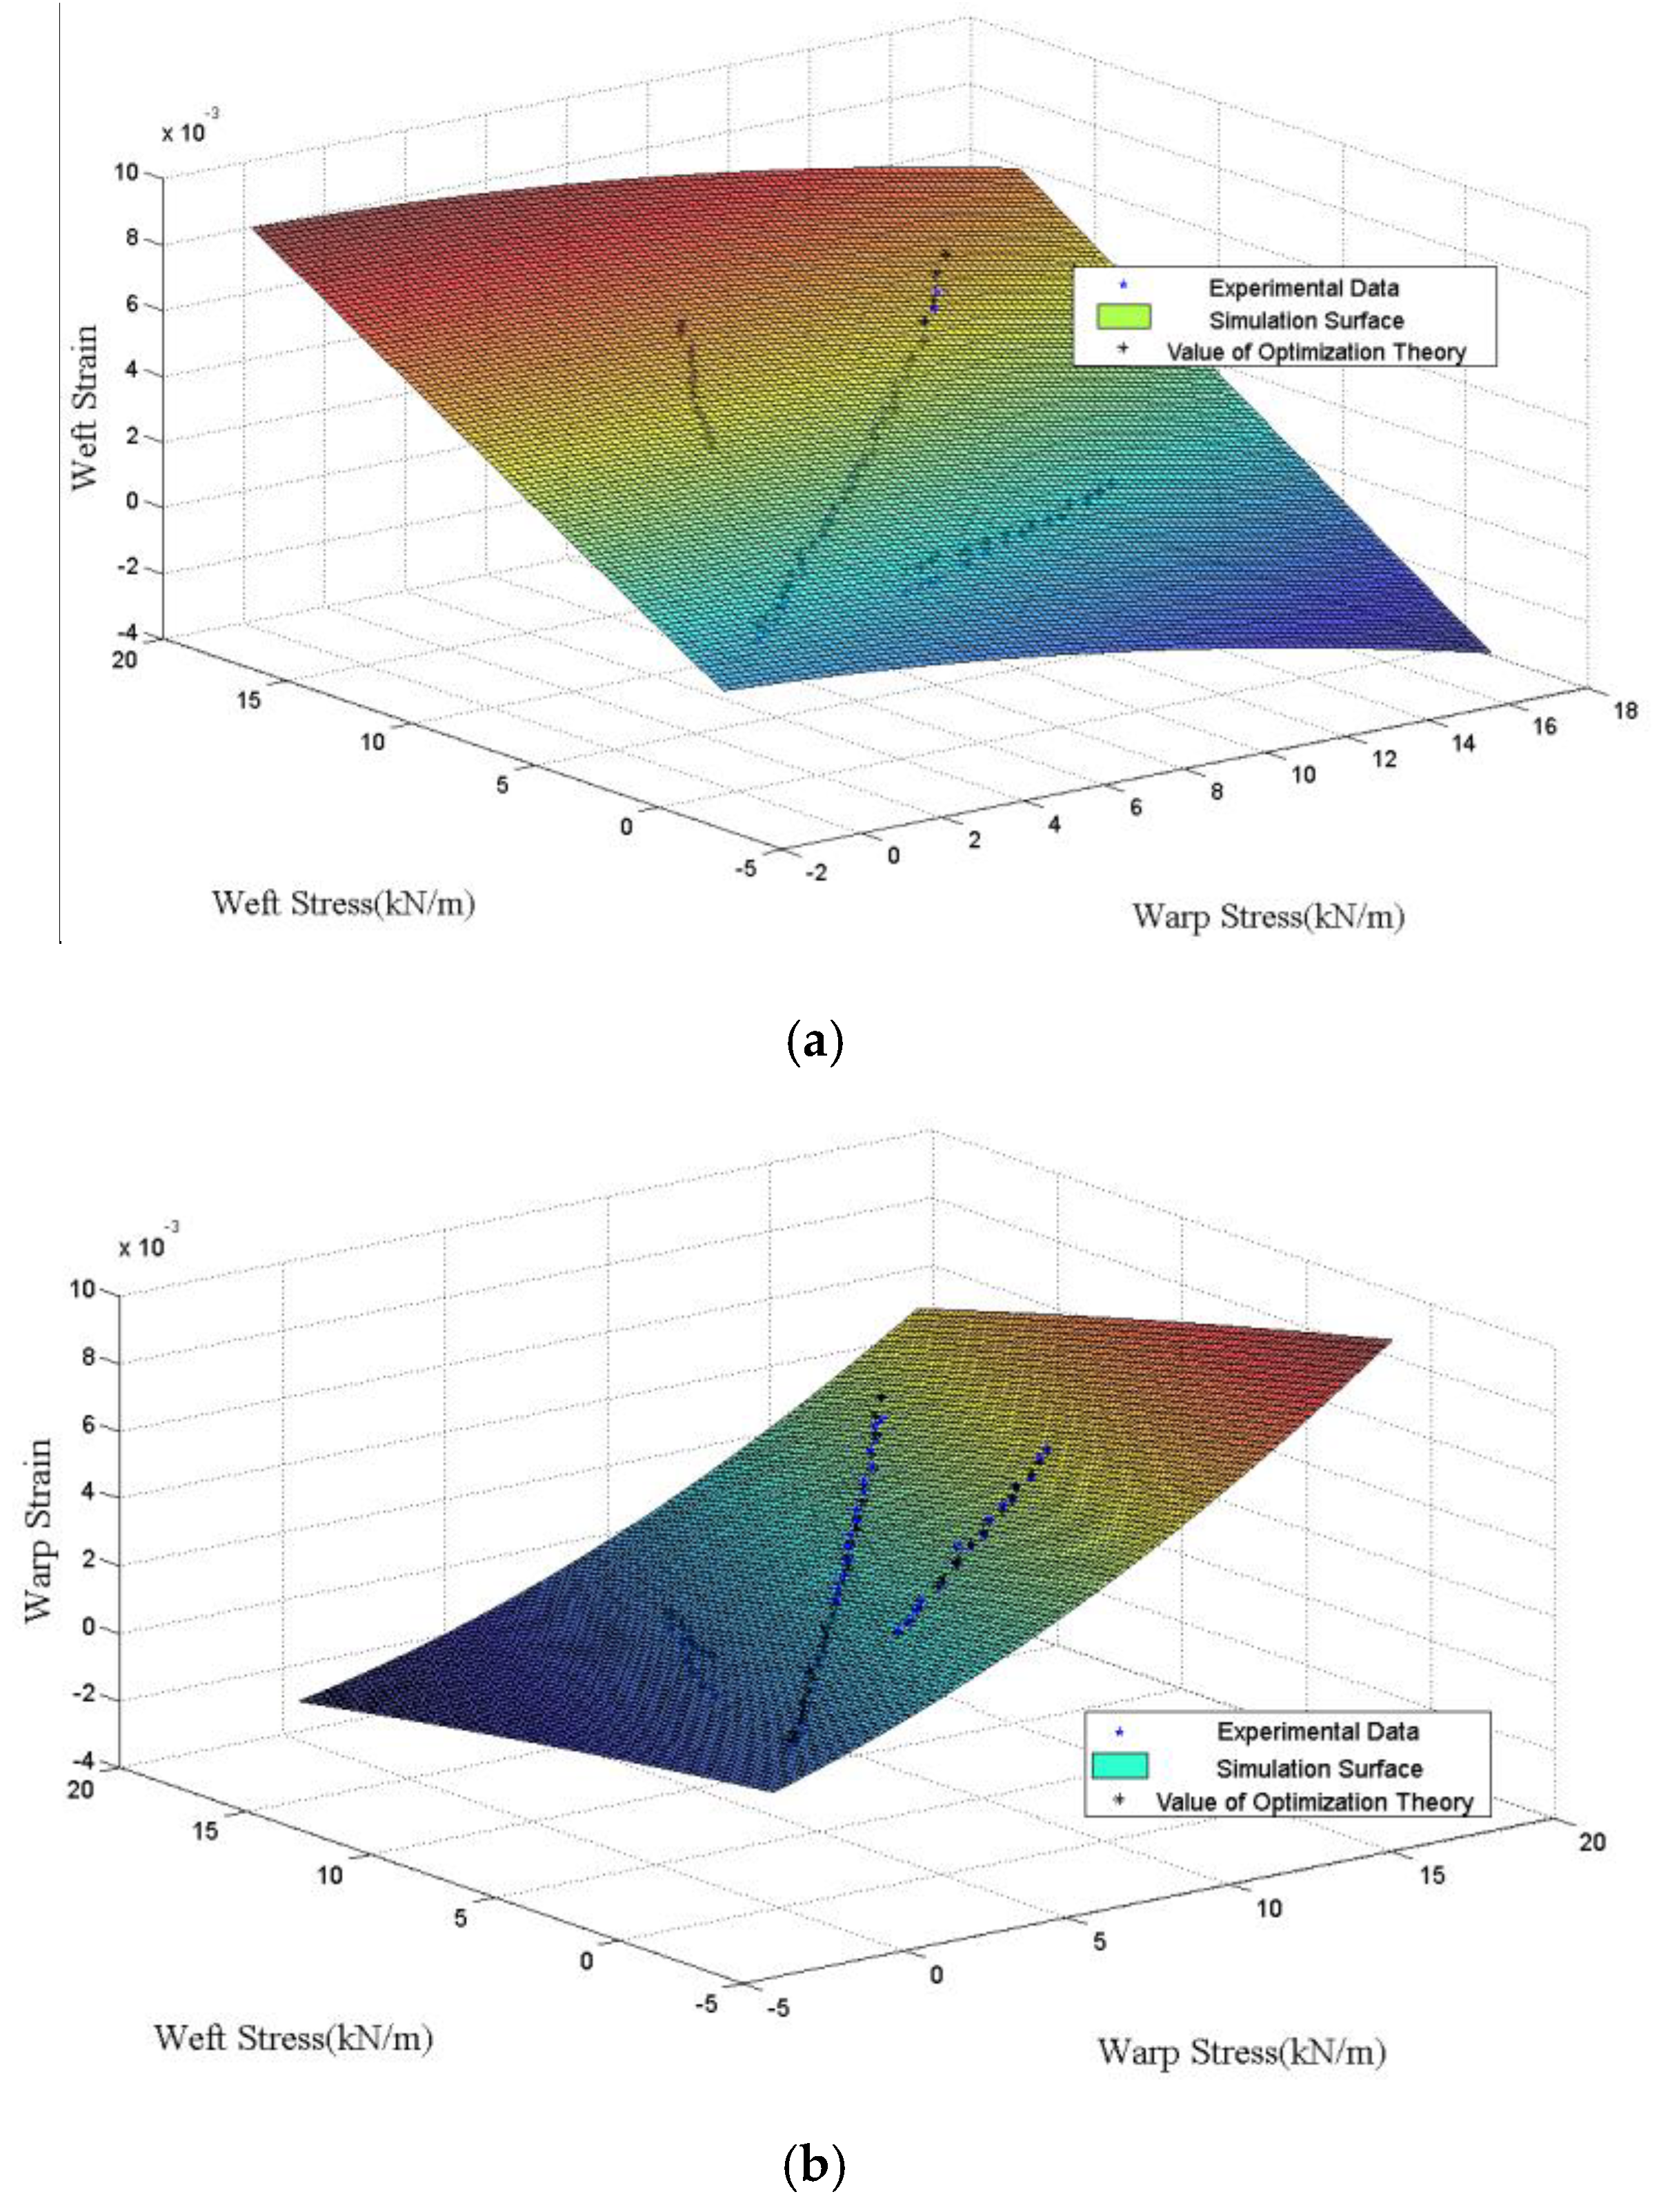
The stress and strain at the center point under different tensile forces were collected and drawn onto a three-dimensional curved surface, which was compared with the experimental data and the optimized theoretical value, as shown in Figure 13. The experimental data refers to the data obtained by the biaxial tensile test. Simulation surface refers to the surface which was simulated by parameters obtained by the calculation method proposed in this study and the finite element software. The value of optimization theory refers to values obtained using experimental data and the calculation method proposed in this study.
The results show that the changing trend of the simulation data is consistent with the experimental data and optimization theoretical values and that the simulation values are slightly lower than the experimental and optimization theoretical values. In general, the presented method can obtain results that reflect the influence of the change of the warp and weft stresses on the elastic modulus and Poisson’s ratio. The average error between the simulation results and the experimental values is about 8.21% (warp) and 8.41% (weft). However, the traditional method of using the average elastic modulus and Poisson’s ratio to evaluate the strain on membrane material will lead to an error of 23.6–30.4%. Compared with the traditional method, the optimization calculation method proposed in this study can greatly improve the accuracy of the simulation.

5. Conclusions

An optimization method to calculate the elastic modulus and Poisson’s ratio considering the influence of warp and weft stresses under low tensile ratios (1:1, 2:1, and 1:2) was proposed. Compared with the results from the traditional method and experimental data, the proposed method can well consider the nonlinear changes of the elastic modulus and Poisson’s ratio caused by warp and weft stress changes. Under the same stress condition, the R-Squared of the strain calculated by the optimized model compared with the experimental value is 0.975 (warp) and 0.970 (weft), respectively. In addition, to apply this method to the analysis of a simulation, a finite element simulation model was established through the user-defined subroutine method, and the mechanical properties (the elastic modulus and Poisson’s ratio) were calculated by using the proposed optimization. The results show that the average errors of the simulated strain and the experimental strain under the same stress condition are 8.21% (warp) and 8.41% (weft), which indicates that the proposed method is efficient and suitable for accurate deformation simulations of near-space airship envelope material.

Author Contributions

Conceptualization, X.W. and J.T.; methodology, W.X.; software, W.X.; validation, J.T., X.W. and Y.C.; formal analysis, Y.C.; investigation, W.X.; resources, J.T.; data curation, X.W.; writing—original draft preparation, W.X.; writing—review and editing, J.W.; visualization, W.X.; supervision, J.T.; project administration, J.T.; funding acquisition, X.W. All authors have read and agreed to the published version of the manuscript.

Funding

This work is sponsored by the National Natural Science Foundation of China under Grant No. 61733017 and Grant No. 51906141, the Shanghai Science Foundation of China (Grant No. 18ZR1419000), and the Program of Shanghai Academic/Technology Research Leader (Project No. 20XD1430400).

Conflicts of Interest

The authors declare no conflict of interest.

References

  1. Tang, J.; Duan, D.; Xie, W. Shape Exploration and Multidisciplinary Optimization Method of Semirigid Nearing Space Airships. J. Aircr. 2021, 59. [Google Scholar] [CrossRef]
  2. Adak, B.; Joshi, M. Coated or Laminated Textiles for Aerostat and Stratospheric Airship. In Advanced Textile Engineering Materials; Wiley: Hoboken, NJ, USA, 2018; pp. 257–288. [Google Scholar]
  3. Smith, M.S.; Rainwater, E.L. Applications of Scientific Ballooning Technology to High Altitude Airships. In Proceedings of the AIAA’s 3rd Annual Aviation Technology, Integration, and Operations (ATIO) Forum, Denver, CO, USA, 17–19 November 2003. [Google Scholar]
  4. Wang, X.-L. Effect of Ballonet Sloshing on the Stability Characteristics of an Airship. AIAA J. 2016, 5, 360–363. [Google Scholar] [CrossRef]
  5. Tang, J.; Wang, X.; Duan, D.; Xie, W. Optimisation and Analysis of Efficiency for Contra-Rotating Propellers for High-Altitude Airships. Aeronaut. J. 2019, 123, 706–726. [Google Scholar] [CrossRef]
  6. Stockbridge, C.; Ceruti, A.; Marzocca, P. Airship Research and Development in the Areas of Design, Structures, Dynamics and Energy Systems. Int. J. Aeronaut. Space Sci. 2012, 13, 170–187. [Google Scholar] [CrossRef] [Green Version]
  7. Tang, J.; Xie, W.; Wang, X.; Chen, C. Simulation and Analysis of Fluid–Solid–Thermal Unidirectional Coupling of Near-Space Airship. Aerospace 2022, 9, 439. [Google Scholar] [CrossRef]
  8. Tang, J.; Pu, S.; Yu, P.; Xie, W.; Li, Y.; Hu, B. Research on Trajectory Prediction of a High-Altitude Zero-Pressure Balloon System to Assist Rapid Recovery. Aerospace 2022, 9, 622. [Google Scholar] [CrossRef]
  9. Xie, W.-C.; Wang, X.-L.; Duan, D.-P.; Tang, J.-W. Optimization Analysis of Stratospheric Airship Suspended Curtains. J. Mech. 2020, 36, 763–772. [Google Scholar] [CrossRef]
  10. Xie, W.-C.; Wang, X.-L.; Duan, D.-P.; Tang, J.-W. Finite Element Simulation of the Microstructure of Stratospheric Airship Envelopes. AIAA J. 2020, 58, 3690–3699. [Google Scholar] [CrossRef]
  11. Ambroziak, A. Analysis of Non-Linear Elastic Material Properties of PVC-Coated Panama Fabric. Task Q. 2005, 9, 167–178. [Google Scholar]
  12. Argyris, J.; Doltsinis, I.S.; Silva, V.D.D. Constitutive Modeling and Computation of Non-Linear Viscoelastic Solids. Part I: Rheological Models and Numerical Integration Techniques. Comput. Methods Appl. Mech. Eng. 1991, 88, 135–163. [Google Scholar] [CrossRef]
  13. Klosowski, P.; Zagubien, A.; Woznica, K. Investigation on Rheological Properties of Technical Fabric “Panama”. Arch. Appl. Mech. 2004, 73, 661–681. [Google Scholar] [CrossRef]
  14. Nayfeh, A.; Kress, G. Non-Linear Constitutive Model for Plain-Weave Composites. Compos. Part B Eng. 1997, 28, 627–634. [Google Scholar] [CrossRef]
  15. Nedjar, B. An Anisotropic Viscoelastic Fibrematrix Model at Finite Strains: Continuum Formulation and Computational Aspects. Comput. Methods Appl. Mech. Eng. 2007, 196, 1745–1756. [Google Scholar] [CrossRef] [Green Version]
  16. Meng, J.; Lv, M. The Constitutive Relation of a Fabric Membrane Composite for a Stratospheric Airship Envelope based on Invariant Theory. Comput. Mater. Contin. 2017, 53, 73–89. [Google Scholar]
  17. Bridgens, B.; Gosling, P. Interpretation of Results from the MSAJ Testing Method for Elastic Constants of Membrane Materials. In Proceedings of the TensiNet Symposium, Sofia, Bulgaria, 16–18 September 2010; pp. 49–57. [Google Scholar]
  18. M-02-1995; Testing Method for Elastic Constants of Membrane Materials. Membrane Structures Association of Japan: Tokyo, Japan, 1995.
  19. ASCE-1852; Tensioned Fabric Structure—A Practical Introduction. ASCE Standards: Reston, VA, USA, 1996.
  20. Dinh, T.; Rezaei, A.; Laet, L.D.; Mollaert, M.; Hemelrijck, D.V.; Paepegem, W.V. A New Elasto-Plastic Material Model for Coated Fabric. Eng. Struct. 2014, 71, 222–233. [Google Scholar] [CrossRef]
  21. Bridgens, B.N. Direct StressStrain Representation for Coated Woven Fabrics. Comput. Struct. 2004, 82, 1913–1927. [Google Scholar] [CrossRef]
  22. Chen, J.; Chen, W.; Wang, M.; Ding, Y.; Zhou, H.; Zhao, B.; Fan, J. Mechanical Behaviors and Elastic Parameters of Laminated Fabric URETEK3216LV Subjected to Uniaxial and Biaxial Loading. Appl. Compos. Mater. 2017, 24, 1107–1136. [Google Scholar] [CrossRef]
  23. Galliot, C.; Luchsinger, R. A simple model describing the non-linear biaxial tensile behaviour of PVC-coated polyester fabrics for use in finite element analysis. Compos. Struct. 2009, 90, 438–447. [Google Scholar] [CrossRef]
  24. Bai, X. Research on the Evolution of Mechanical Properties of Airship Envelopes. Ph.D. Thesis, Harbin Institute of Technology, Harbin, China, 2009. [Google Scholar]
  25. Xie, W.; Wang, X.; Duan, D.; Tang, J.; Wei, Y. Mechanical properties of UN-5100 envelope material for stratospheric airship. Aeronaut. J. 2021, 125, 472–488. [Google Scholar] [CrossRef]
  26. Zhu, Y.; Chen, Z.; Fang, Y. Static Load Test and Finite Element Simulation of Vertical Bearing Capacity of Bored Piles. Struct. Eng. 2021, 37. [Google Scholar] [CrossRef]
  27. Xia, Y. A Discussion on the Value Field of Possions Ratio-v. J. Xian Inst. Highw. 1984, 2, 106–111. [Google Scholar]
  28. Deb, K.; Agrawal, S.; Pratap, A.; Meyarian, T. A Fast Elitist Non-Dominated Sorting Genetic Algorithm for Multi-Objective Optimization: NSGA-II. In Proceedings of the International Conference on Parallel Problem Solving from Nature; Springer: Berlin/Heidelberg, Germany, 2000. [Google Scholar]
  29. Belegundu, A.D.; Berke, L.; Patnaik, S.N. An Optimization Algorithm based on the Method of Feasible Directions. Struct. Optim. 1995, 9, 83–88. [Google Scholar] [CrossRef]
  30. Hager, W.W.; Zhang, H.C. A New Conjugate Gradient Method with Guaranteed Descent and an Efficient Line Search. SIAM J. Optim. 2005, 16, 170–192. [Google Scholar] [CrossRef]
  31. Kirkpatrick, S.; Gelatt, C.D.; Vecchi, M.P. Optimization by Simulated Annealing. Science 1983, 220, 671–680. [Google Scholar] [CrossRef]
  32. Deb, K. Multi-Objective Optimization using Evolutionary Algorithms; Wiley: New York, NY, USA, 2003; pp. 7–21. [Google Scholar]
  33. Goldberg, D.E. Genetic Algorithms in Search, Optimization and Machine Learning; Addison Wesley: New York, NY, USA, 1989; pp. 1–18. [Google Scholar]
  34. Bai, Q.H. Analysis of Particle Swarm Optimization Algorithm. Comput. Inf. Sci. 2010, 180, 184. [Google Scholar] [CrossRef] [Green Version]
  35. Deb, K.; Pratap, A.; Agarwal, S.; Meyarivan, T. A fast and elitist multiobjective genetic algorithm: NSGA-II. IEEE Trans. Evol. Comput. 2002, 6, 182–197. [Google Scholar] [CrossRef]
  36. Deb, K.; Srinivas, N. Multi-objective Function Optimization Using Nondominated Sorting Genetic Algorithms. Evol. Comput. 1995, 3, 221–248. [Google Scholar]
  37. Khoury, G.A. Airship Technology; Cambridge University Press: Cambridge, MA, USA, 2012. [Google Scholar]
  38. Zheng, L.; Yi, H.; Wang, J.; Jiao, W.; Wu, J.; Gai, S.; Wu, G. Tearing strength of Vectran Fiber anodic fabric. Shanghai Text. Sci. Technol. 2018, 46, 8–9. [Google Scholar]
  39. Gao, C. Biaxial Test Methods, Experiments and Mechanical Behavior of Fabric Membranes. Ph.D. Thesis, Shanghai Jiao Tong University, Shanghai, China, 2016. [Google Scholar]
Figure 1. Significance of each monomial term.
Aerospace 09 00655 g001
Figure 2. Optimal process.
Aerospace 09 00655 g002
Figure 3. NSGA-II basic flow chart.
Aerospace 09 00655 g003
Figure 4. UN-5100 material. (a) A specimen made of UN-5100. (b) The microstructure of the UN-5100 material.
Aerospace 09 00655 g004
Figure 5. A specimen and the testing machine. (a) A specimen with a flash spot. (b) SJTU-I biaxial tensile testing machine.
Aerospace 09 00655 g005
Figure 6. Biaxial specimen (units in millimeters).
Aerospace 09 00655 g006
Figure 7. Test protocol.
Aerospace 09 00655 g007
Figure 8. Cyclic curves of the stress and strain at each stress ratio. (a) 1:1. (b) 2:1. (c) 1:2.
Aerospace 09 00655 g008
Figure 9. Displacement and strain nephogram in x directions. (a) Flash spot region. (b) Displacement map in the x-direction. (c) Map of strain in the x-direction.
Aerospace 09 00655 g009
Figure 10. Stress-strain curves.
Aerospace 09 00655 g010
Figure 11. The finite element model.
Aerospace 09 00655 g011
Figure 12. Stresses of the finite element model. (a) S11 stresses. (b) S22 stresses.
Aerospace 09 00655 g012
Figure 13. Comparison of the three different types of data. (a) Warp Strain. (b) Weft Strain.
Aerospace 09 00655 g013
Table 1. The slope range of each curve.
Stress Ratio (Warp:Weft)Warp Slope (102 kN/m)Weft Slope (102 kN/m)
1:113.77∼16.3813.24∼16.64
2:111.40∼18.2018.86∼14.03
1:224.72∼14.0111.88∼17.06
Table 2. Elastic constants of biaxial tension based on the least square method.
Elastic   Modulus   ( 10 2   kN / m ) Poisson’s Ratio
EX E y υ y x υ x y
12.9813.350.19030.1957
Table 3. Optimization parameter values.
𝜆0𝜆1𝜆2𝜆3𝜆4𝜆5
1715.832−109.514−0.273525.2794090.5360420.127741
𝜅0𝜅1𝜅2𝜅3𝜅4𝜅5
1429.07−0.01938−43.70490.1429721.8233830.136431
𝜂0𝜂1𝜂2𝜂3𝜂4𝜂5
0.404750.02569−0.02771−0.000980.001955−0.00193
Table 4. Results of the optimizations.
Stress Ratio
(Warp:Weft)
E (102 kN/m)𝜈R-Squared
WarpWeftWarpWeftWarpWeft
1:1, 1:2, 2:112.26∼15.8112.41∼14.160.216∼0.4360.200∼0.4580.9750.970
Publisher’s Note: MDPI stays neutral with regard to jurisdictional claims in published maps and institutional affiliations.