1. Introduction
In modern subsonic aircraft design, the anti-icing system is an indispensable and safety-critical component. If ice accumulates in critical engine areas such as the intake, guide vanes, spinner, and inlet struts, it leads to deteriorated aerodynamic performance, reduced thrust, and blade damage [
1], all of which pose severe risks to aviation safety.
Investigation on aircraft anti/de-icing has grown gradually since the mid-20th century, with numerous scholars and institutions conducting extensive experimental studies on super-cooled droplet impingement, water film runback characteristics [
2], and anti/de-icing system performance [
3,
4]. In recent years, foreign research institutions, represented by NASA’s Glenn Research Center, have conducted studies on the flute-type tube anti-icing system using hot air in ice wind tunnels, investigating the impact of structural parameters and flow patterns on anti-icing effectiveness [
5,
6]. Linkai Li et al. [
7] quantified the process of icing on inlet guide vanes (IGVs) of aeroengines and explored the impact of anti/de-icing systems on the performance of the power system. Experiments were conducted in an ice wind tunnel on a hollow IGV model with U-shaped tubes used for anti-icing under different flight conditions. The results showed that effective anti-icing across the entire IGV surface could be achieved when the mass rate of the hot air was above 0.004 kg/s, and the temperature exceeded 30 °C. Ph. Planquart et al. [
8] proposed a method using quantitative infrared thermography to quantitatively measure heat transfer characteristics of a flute-type tube hot-jet anti-icing system. Incorporating stable-state infrared thermography with the foil heating technique, it is possible to pinpoint and contrast the distribution of the heat transfer coefficient across the concave inner layer of the skin, aligning impressively with the outcomes of 3D numerical simulations generated via the Computational Fluid Dynamics (CFDs) software FLUENT 2020R2. Lai Qingren et al. [
9] utilized the expansive 3 m × 2 m ice wind tunnel for validation tests on the intake components of a specific aircraft engine. Furthermore, Zhu Dongyu and colleagues [
10] performed a series of rigorous tests within the FL-61 ice wind tunnel at the Aerodynamics Research Institute of Aviation Industry, including dry and wet air anti-icing tests on a hot-air system designed to combat icing, focusing on a common aircraft anti-icing structure. Recent experimental validations further refined critical thresholds for anti-icing efficacy. Guo et al. [
11] demonstrated that under high Liquid Water Content (LWC) conditions, incomplete water droplet evaporation may occur despite elevated wall temperatures, revealing a previously underestimated risk of run-back ice formation. Liu et al. [
12] conducted full-scale nacelle tests in a large icing wind tunnel, confirming that optimized piccolo tube configurations with enhanced heat transfer structures could reduce anti-icing air consumption by 12–18% while maintaining surface temperature uniformity.
Meanwhile, in the field of numerical simulation, commercial software for anti/de-icing calculations, for instance, FENSAP-ICE [
13] and CANICE [
14], has been developed. This software can simulate the performance of hot-air anti-icing systems. Recently, some scholars have improved the anti-icing characteristics of Piccolo tube systems by using mature CFD software such as Fluent in combination with ice wind tunnel experiments [
15,
16]. M.P.C. Pellissier et al. [
17] detailed an optimization strategy for the Piccolo tube anti-icing system, employing FENSAP-ICE software 2020R2 and hot bleed air. David L. Rigby [
18] conducted numerical simulations on a Piccolo tube hot-air anti-icing device. In these simulations, the study investigated how various factors, namely hole shapes, diameters, and hot-air flow rates, influenced the device’s anti-icing performance, and it was found that a diamond-shaped hole could significantly increase the minimum heat flow rate. However, the heat flow rate was not very sensitive to the hole shape except for the diamond-shaped holes, and it was observed that the heat flux is significantly enhanced with diamond-shaped holes. Jung et al. [
19] proposed a reduced-order modeling framework integrating modal decomposition techniques with machine learning regression architectures for the performance evaluation of electrically heated ice prevention systems on engine intakes. Their research first conducted three-dimensional aerodynamic simulations around the nacelle structure through computational fluid dynamics analysis, and then specialized numerical algorithms were implemented to quantify both water droplet collections on critical surfaces. Zuojun Wei et al. [
20] established a three-dimensional numerical model using a fully coupled approach to investigate the performance of an anti-icing system on the intake of a compressor. The model allows for rapid assessment of the impact of bleed air used for anti-icing on compressor operation. Key findings indicate that higher bleed-air extraction rates induce substantial aerodynamic distortion at the interface plane and performance loss in the compressor, notably affecting surge margin. System pressure increases are associated with greater bleed-air extraction and elevated temperature levels, with extraction rates fluctuating by approximately 1% across operational parameters. Bu Xueqin et al. [
21] introduced a methodology to estimate the temperature distribution on an anti-icing surface using three-dimensional coupled heat transfer analysis based on three-dimensional enhanced heat transfer coupling calculations by combining FLUENT software with user-defined functions (UDFs). This method significantly enhanced the stability and computational efficiency of the iterative process. Yu Jia et al. [
22] developed a 3D conjugated solid-domain heat transfer approach to simulate and validate the operational characteristics of a thermal anti-icing system for aircraft engine nacelles. They also investigated the impact of engine air intake on the skin surface temperature. Qin Na et al. [
23] focused on the nacelle flute ice protection system, examining the thermal response of the inlet ice-resistant surface across various design configurations. Their study specifically analyzed and contrasted the effect of design on the icing protective characteristics of the lower surface, which serves as the primary protection zone.
Beyond conventional CFD tools, recent advances capture complex thermo-fluid interactions more efficiently. Guo et al. [
24] identified distinct heat transfer characteristics of unexpanded jets in piccolo chambers, where ambient temperature variations significantly alter local
Nusselt number distributions. Mahmoudi et al. [
25] numerically investigated the effects of the hot air flow rate, the number of anti-icing tubes, the number of nozzles, and the injection angle of the anti-icing system with compressor bleed air in the gas turbine air intake system on ice formation on the filter surfaces, and it is found that increasing the hot air flow rate, the number of nozzles, and the number of anti-icing tubes can reduce the possibility of ice formation on the filter surfaces. Building upon jet dynamics research, Liu et al. [
26] pioneered jet-induced swirling flow via tangential momentum injection, demonstrating a 4.1 K temperature rise at the leading edge through enhanced vortex convection.
While these high-fidelity CFD approaches provide detailed insights into anti-icing mechanisms, their computational efficiency becomes a critical bottleneck when exploring multi-parameter design spaces across the flight envelope. This limitation is particularly acute for identifying the most severe icing conditions, where ice accretion exhibits strong nonlinear dependencies on flight altitude, angle of attack, Mach number, ambient temperature, and
LWC [
27]. Hannat et al. [
27] employed the research method combining the dual kriging method with a sequential quadratic programming optimization tool and computational fluid dynamics simulation to conduct a construction and optimization study of the response surface model for the effects of parameters such as jet Reynolds number, H/D ratio, Mach number, jet mass flow rate, and jet inclination angle on heat transfer effectiveness in aircraft wing hot-air anti-icing systems. It was found that the dual kriging method can effectively construct response surface models, account for numerical errors, locally improve the model, and reconstruct heat transfer distributions to avoid additional CFD calculations. Zhang et al. [
28] extended this approach to flight load prediction, where gradient-enhanced Kriging achieved 99% accuracy with eight-fold acceleration in symmetric maneuver simulations. These advances demonstrate Kriging’s capacity to navigate combinatorial design spaces while maintaining fidelity to physics-based models.
This paper focuses on the anti-icing bay of the nacelle lip of a specific engine type. A numerical simulation approach was adopted to establish an anti-icing calculation model with coupled internal and external heat transfer. The study predicted the interior and exterior air flow, supercooled water droplet impacts, and icing process under varying working conditions. Based on the computational results, the Kriging optimization algorithm was used to select the most severe icing condition within the flight envelope. The icing protection effectiveness of the proposed anti-icing structure under this extreme condition was evaluated.
2. Geometric Modeling and Mesh Generation
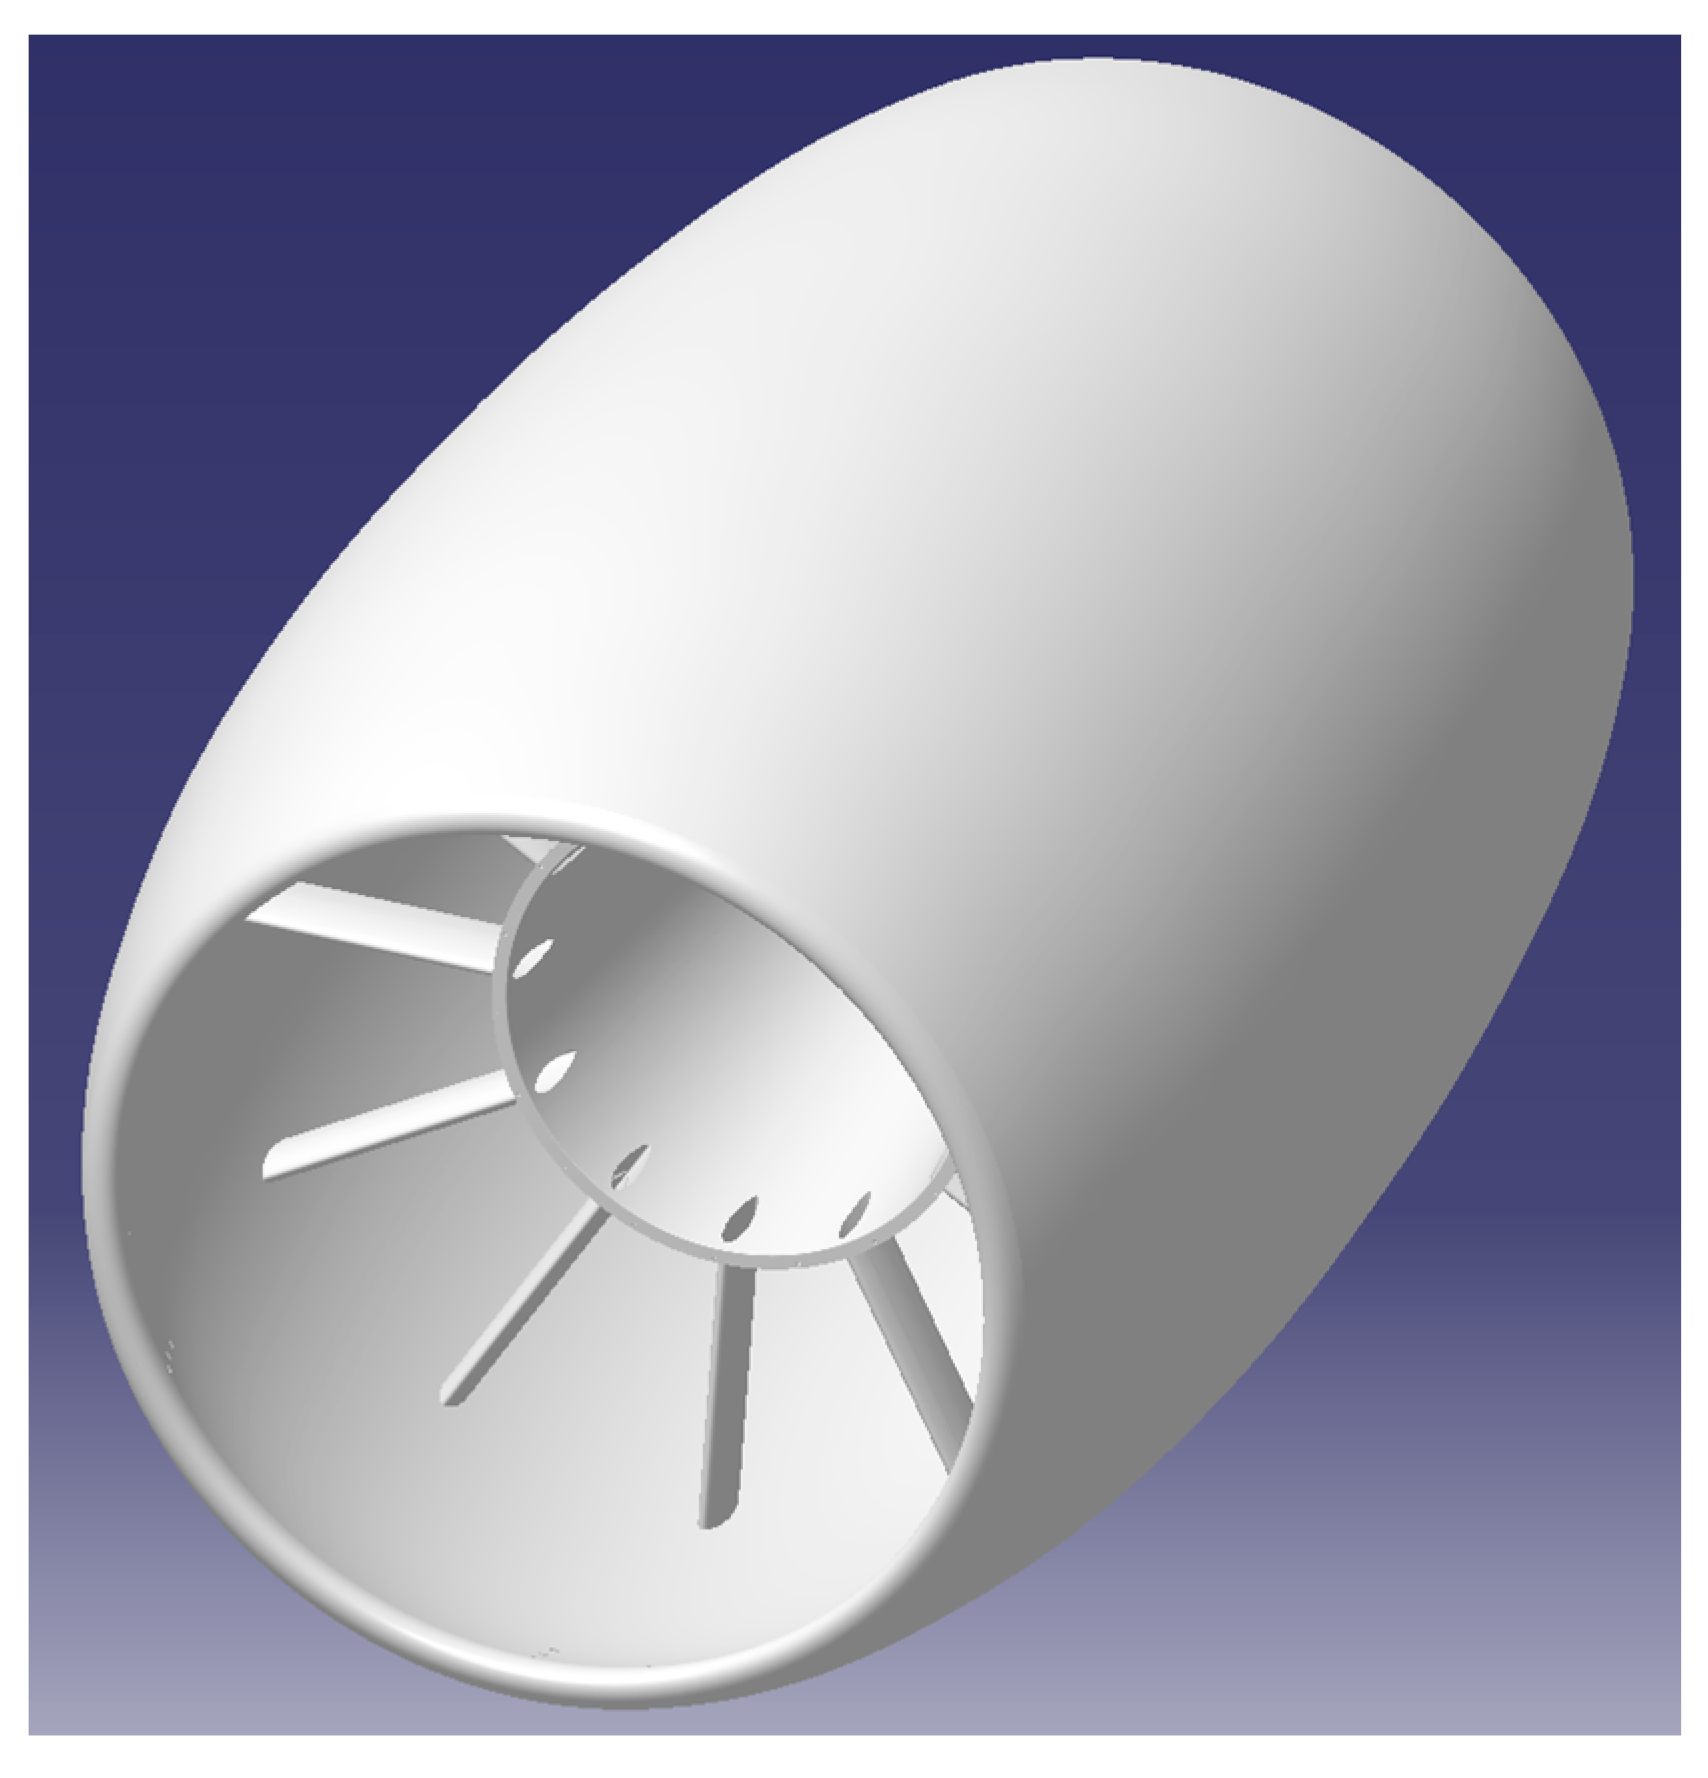
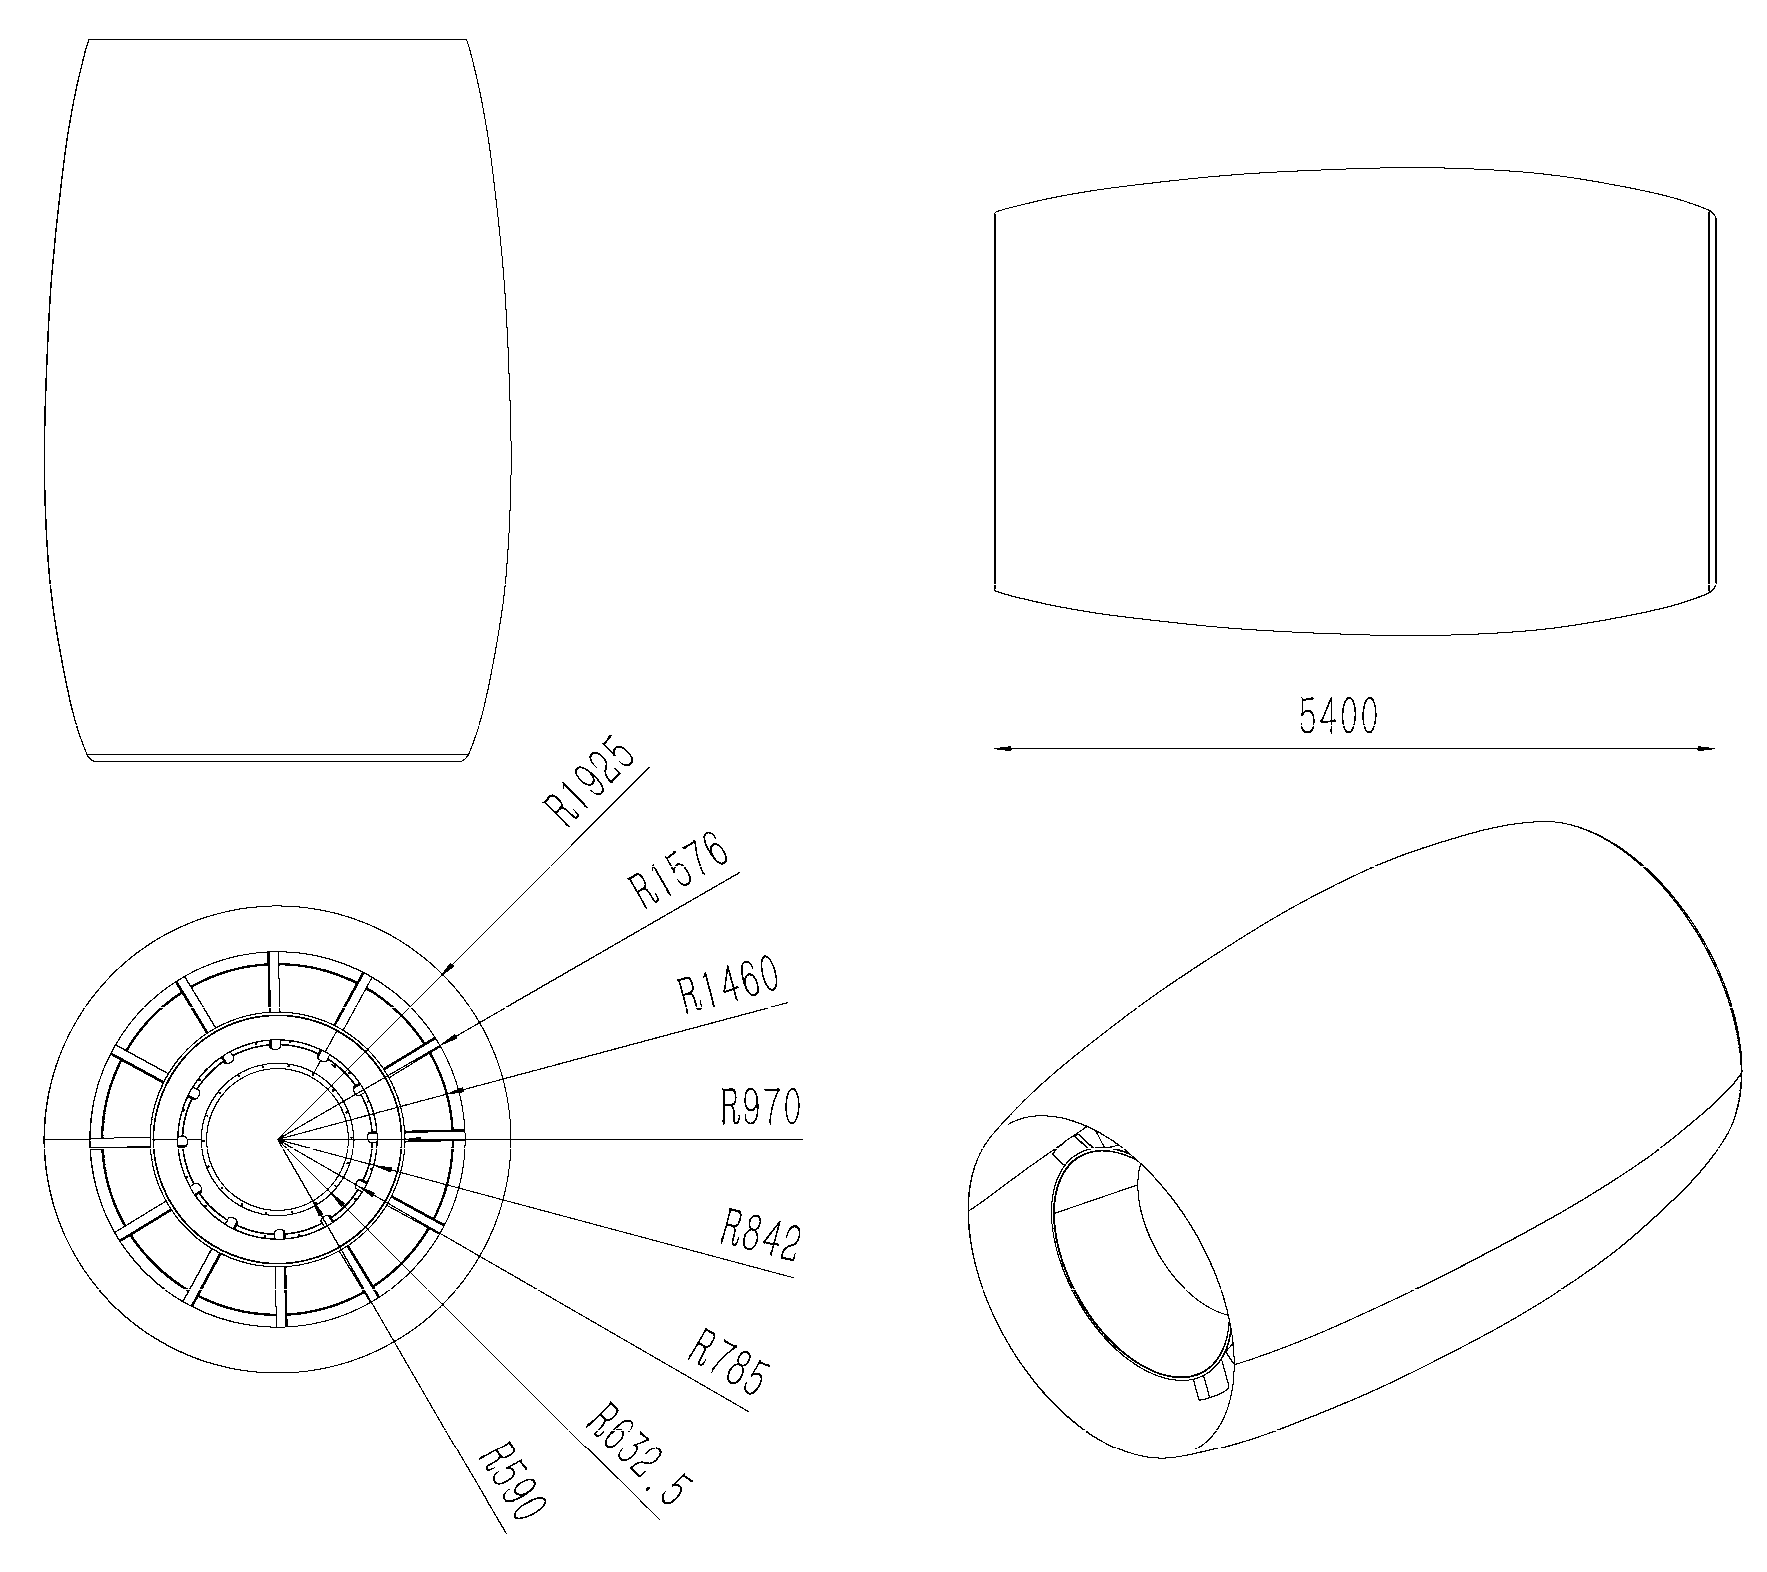
The engine nacelle’s overall computational model is depicted in
Figure 1, with corresponding
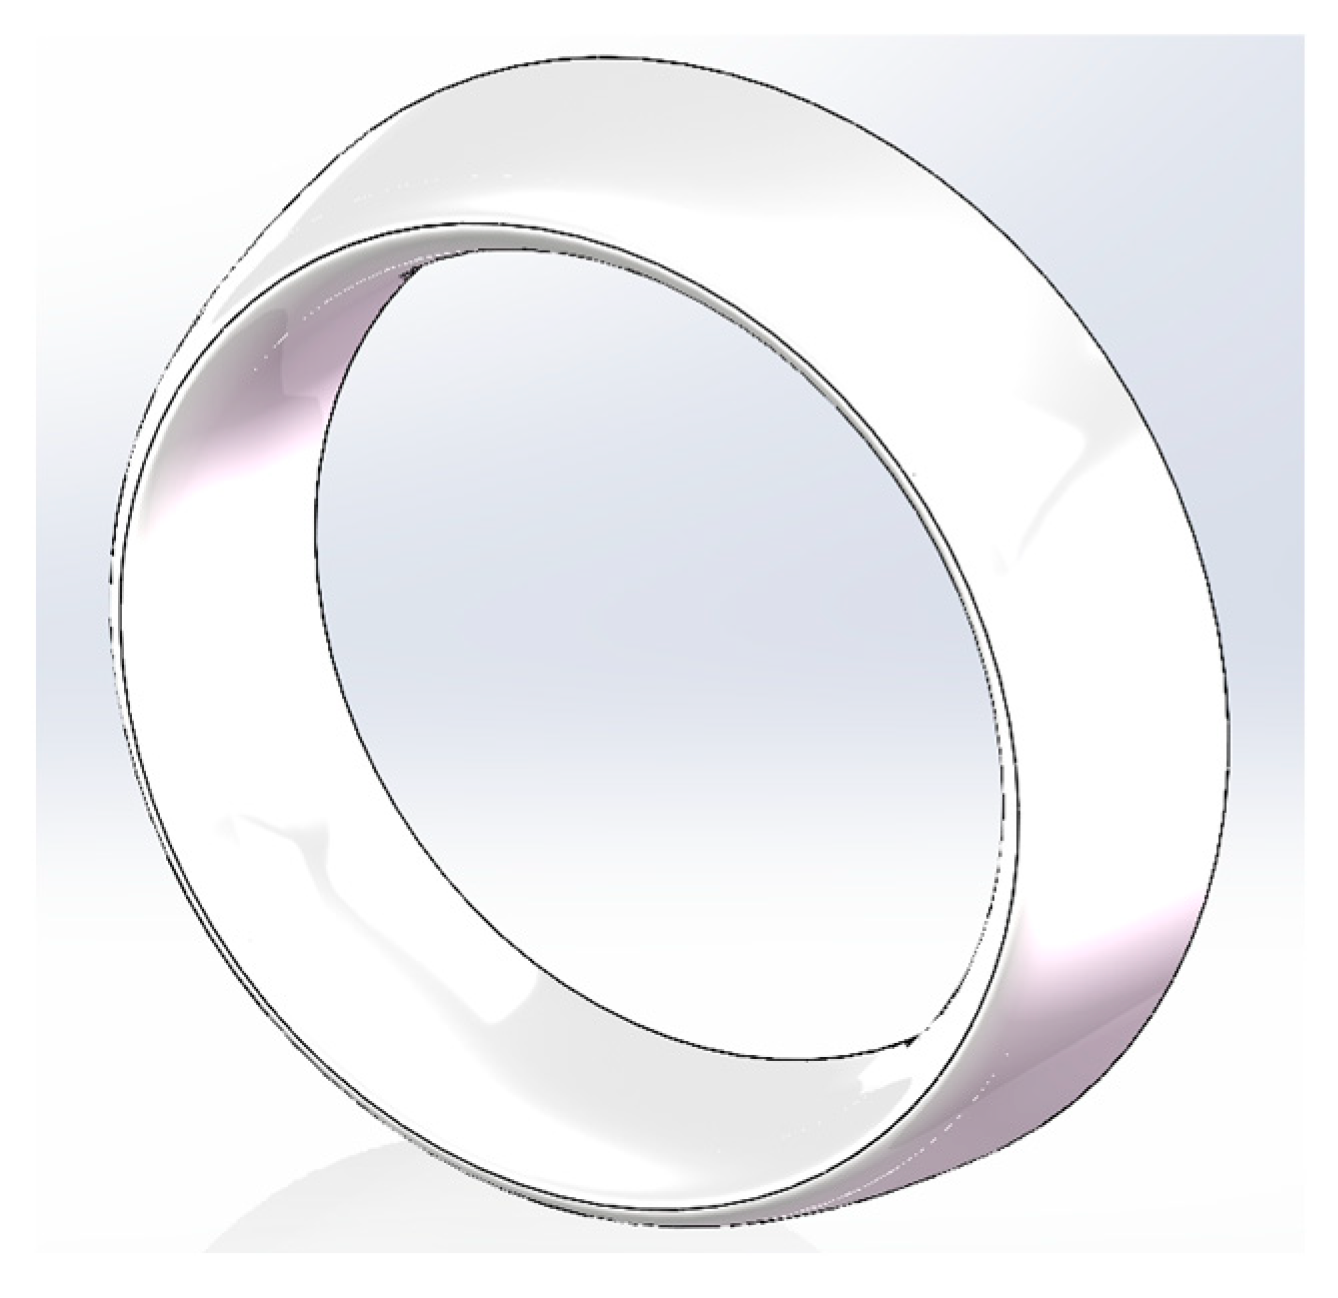
Figure 2 illustrating the lip region’s geometric profile accompanied by its critical design parameters. The model of the engine lip is shown in
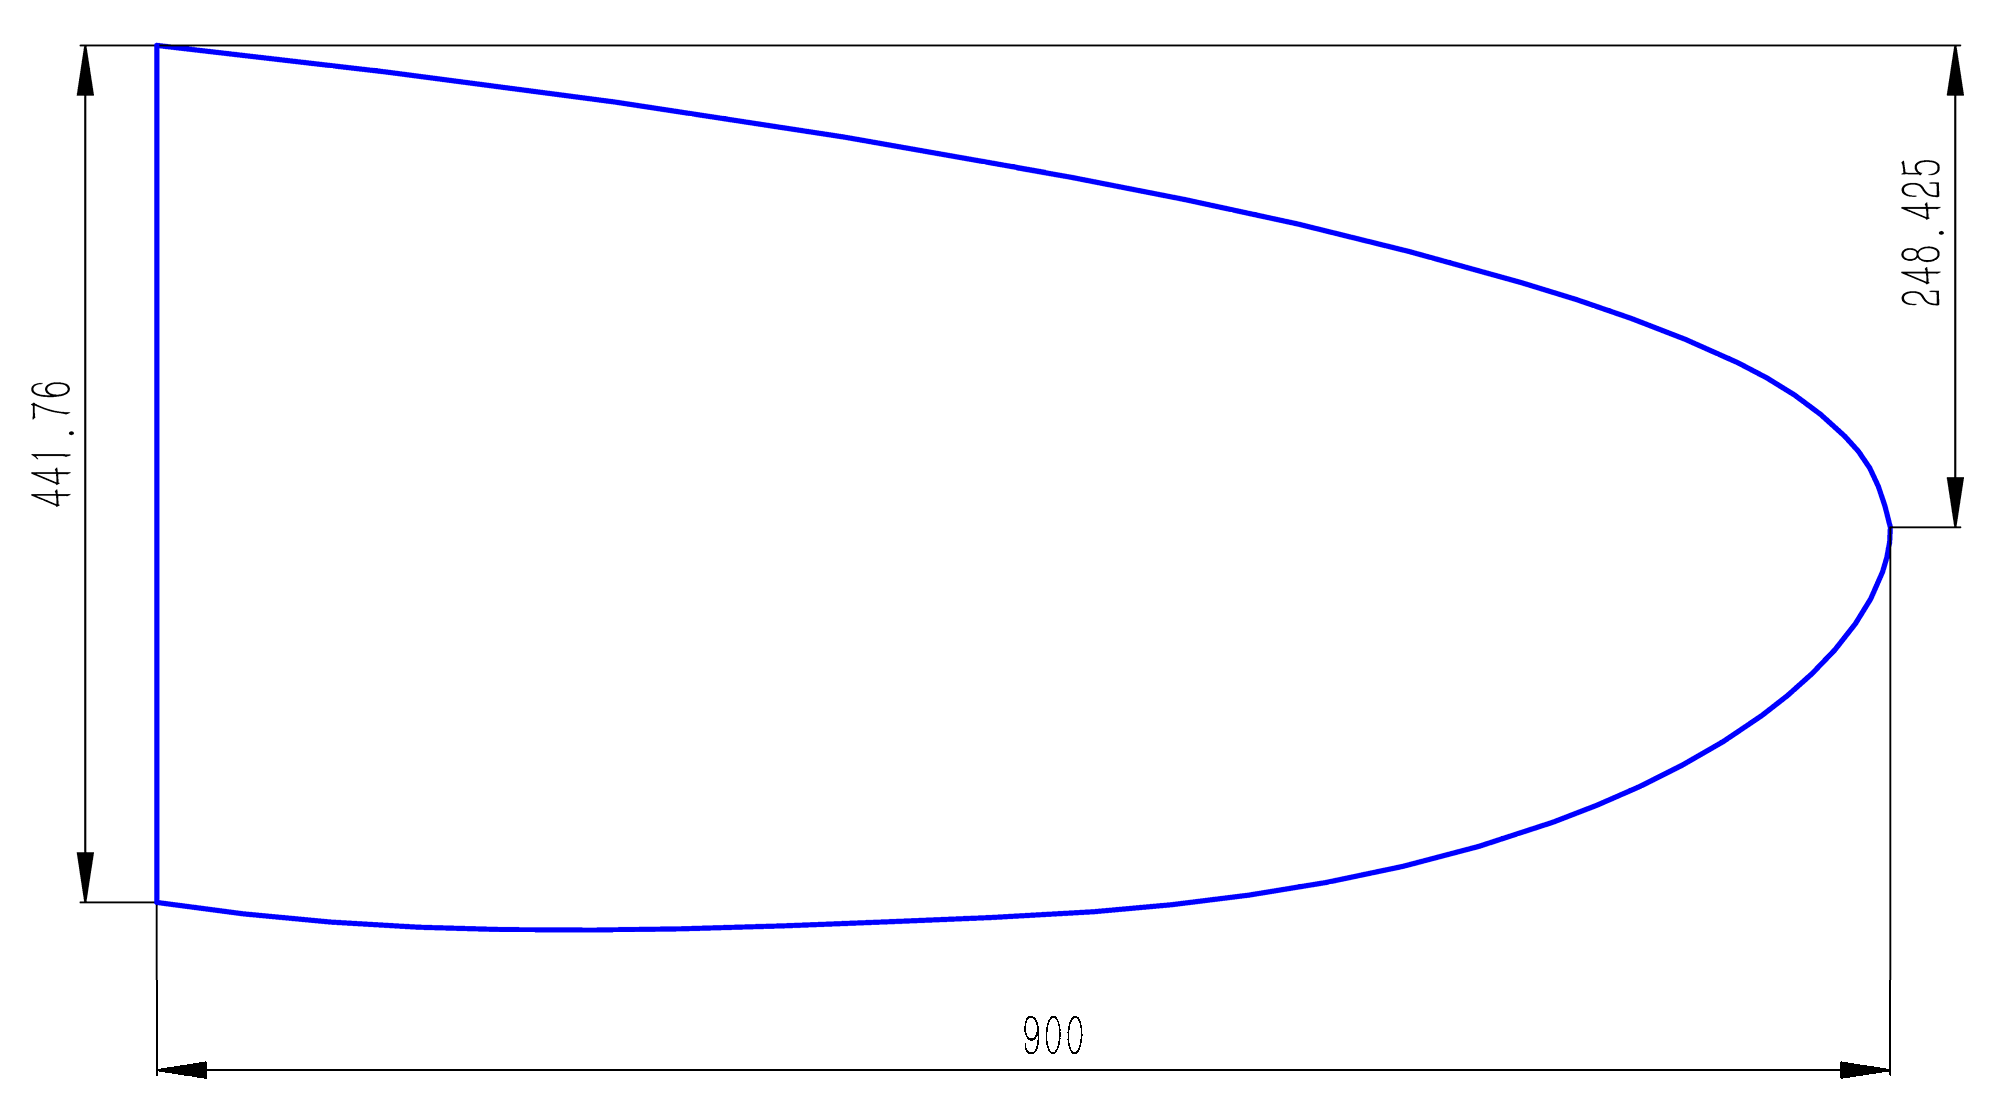
Figure 3, and
Figure 4 depicts the detailed shape and dimensions of the lip-port segment profile curve.
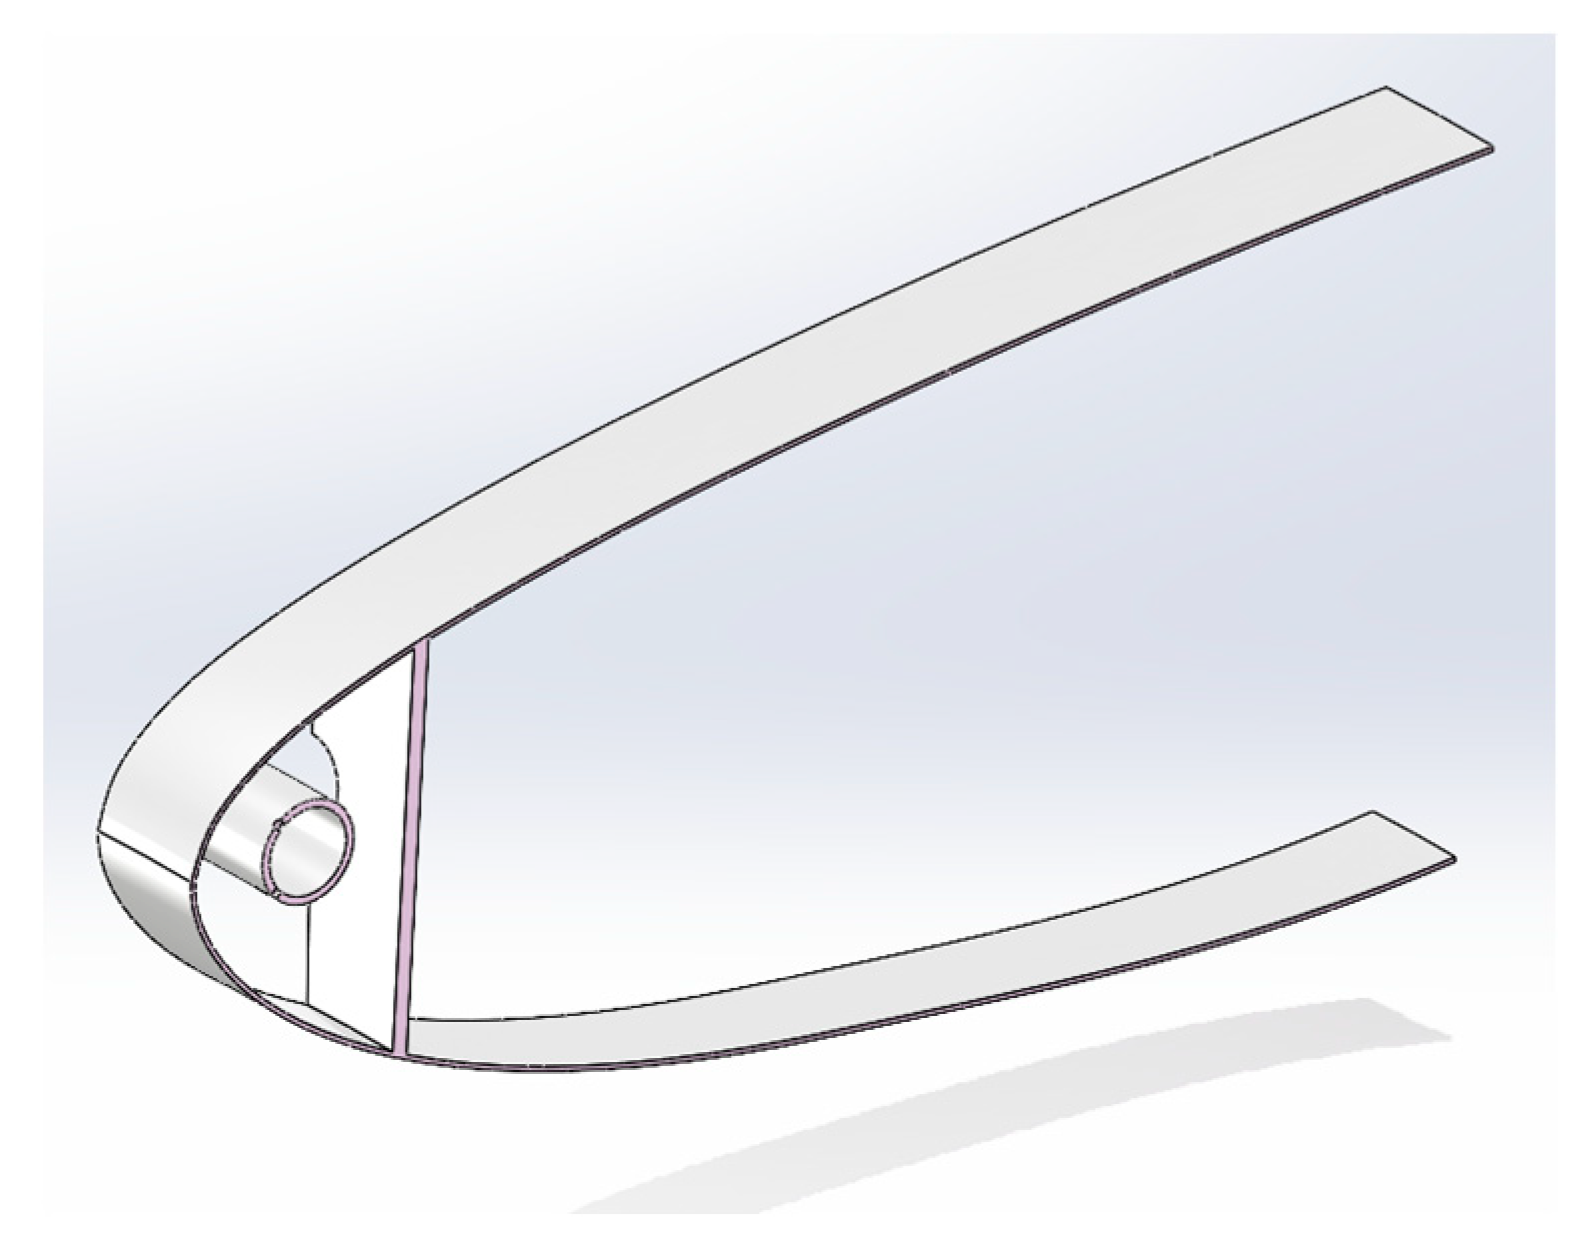
Due to the high computational cost required for the coupled thermal analysis calculation of the full annular anti-icing bay with a piccolo-tube structure, this study employs a 1/36 lip segment model. The structures of the piccolo tube and the 1/36 segment of the lip are visualized in
Figure 5 and
Figure 6, respectively. The anti-icing system specifications and piccolo tube geometric details are summarized in
Table 1.
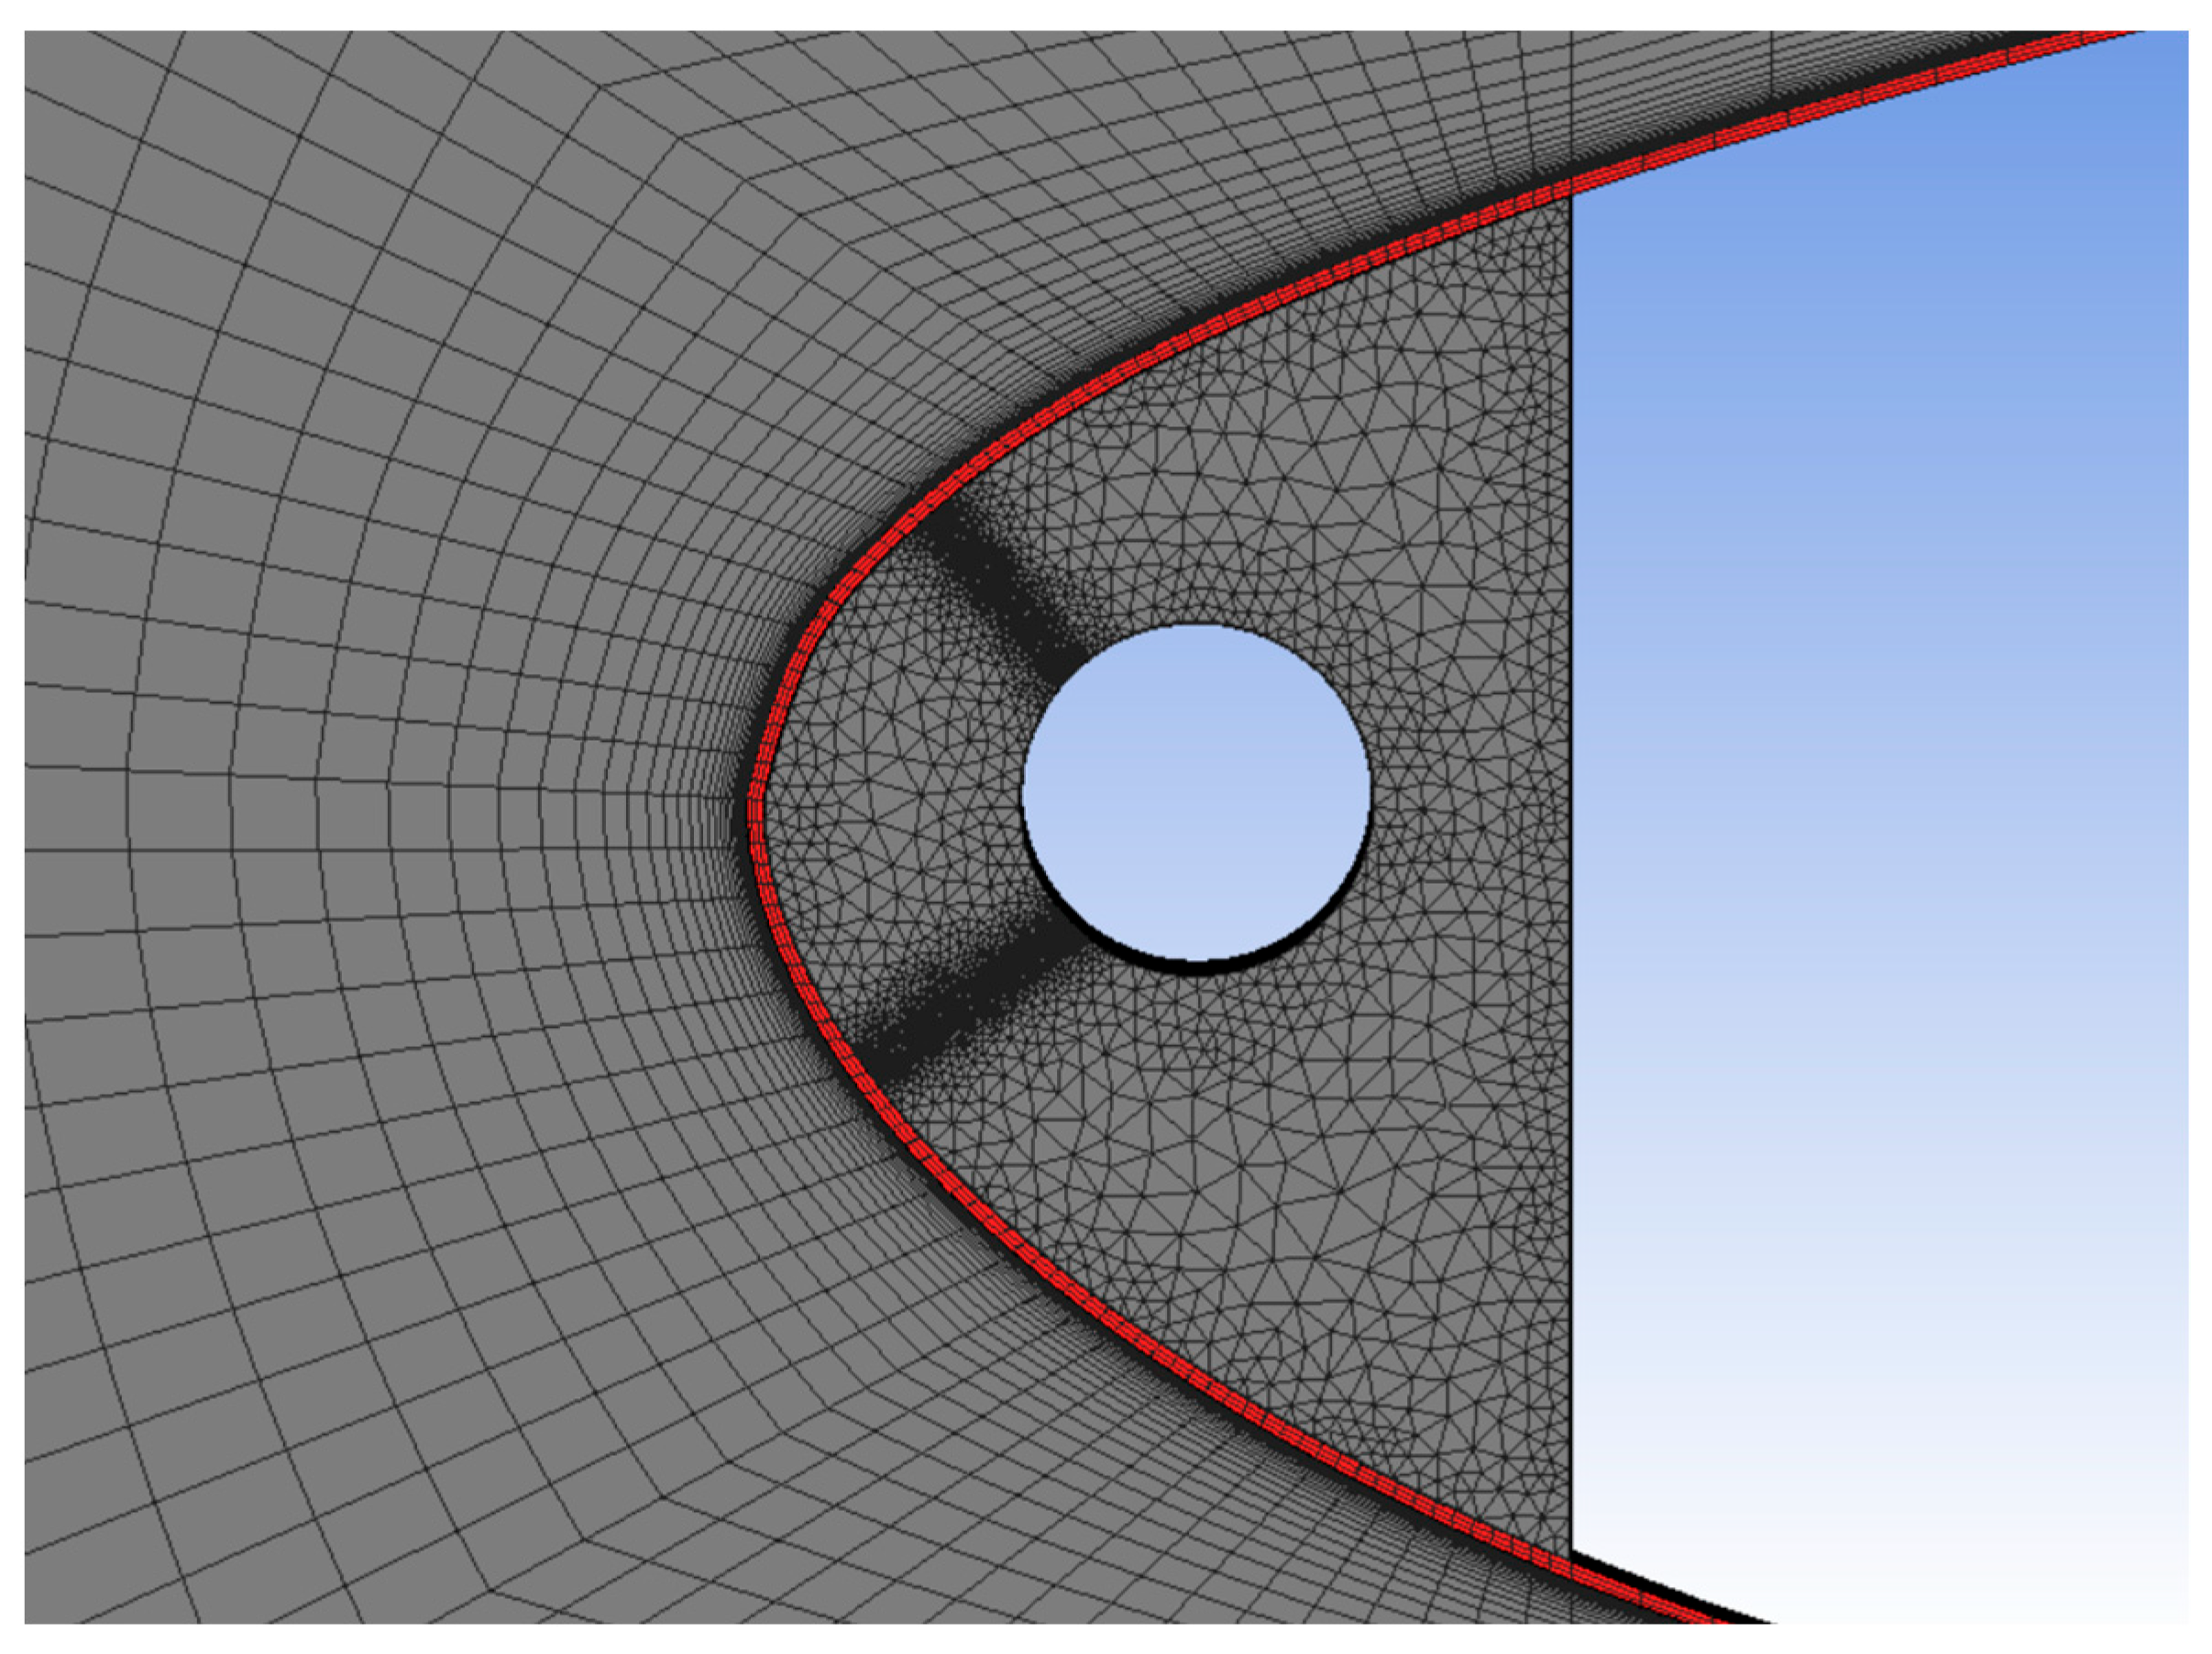
Based on the aforementioned model, a coupled computational grid for both internal and external flow is developed, as presented in
Figure 7. To evaluate the mesh independence, three sets of grids with a total number of cells of 980, 576, 750, 428, and 551, 218 were generated, ensuring that the y
+ values near the wall in both the internal and external flow fields were less than 1. Using these three sets of grids, temperature distribution on the lip surface was calculated at the same working condition, resulting in maximum temperatures of 275.26 K, 275.68 K, and 275.93 K, respectively. The maximum deviation among the results did not exceed 1 °C, indicating that all three sets of grids met the requirement for grid independence. For the subsequent calculations, the grid with a total number of 750,428 cells was selected.
3. Numerical Models
The external airflow field is mathematically described by the following equations, derived from the established model and computational grid:
where
cμ = 0.085,
c1 = 1.44,
c2 = 1.68,
σk = 0.72,
σε = 0.72, and
σT = 0.9~1.0.
The parameters in the aforementioned expressions are defined as follows:
ρ denotes the fluid density; p represents the thermodynamic pressure; u corresponds to the velocity field; τ signifies the shear stress components; H quantifies the total specific enthalpy; and T indicates the absolute temperature.
The water droplet impingement process is a typical two-phase flow problem involving air and water. Assuming the water droplet phase occupies a volume fraction αw and the air phase αa, the conservation relation αw + αa = 1 holds. The mean volume diameter (MVD) of supercooled droplets typically ranges from 0 to 100 μm (excluding super-large-droplet conditions), so the volume fraction αw is in the range of 10−6 to 10−5 orders of magnitude smaller than αa. Therefore, within the context of air phase governing equations, the approximation αa ≈ 1 is justified, and αw can be neglected.
In calculating typical supercooled droplet impingement characteristics, the model incorporates these assumptions to simplify the numerical implementation:
The effect of droplet motion on the airflow field is neglected.
Deformation, breakup, splashing, rebound, and secondary collisions of droplets are not considered.
Thermal and mass transport phenomena between supercooled droplets and cloud air, as well as changes in the physical properties of droplets during their motion, are neglected.
The influence of turbulent air fluctuations on droplet trajectory is disregarded, and only the effects of drag force, lift force, and gravity are considered during droplet motion.
The governing equations for the air phase have been stated in
Section 2. Since thermal effects in the droplet phase are neglected, the droplet dynamics are governed solely by mass conservation and momentum transport equations, expressed in differential form as
In the above expressions, uw denotes the droplet velocity, ρw corresponds to the supercooled water density, d represents the MVD of the droplets, and CD,sph is the dimensionless drag coefficient for spherical droplets.
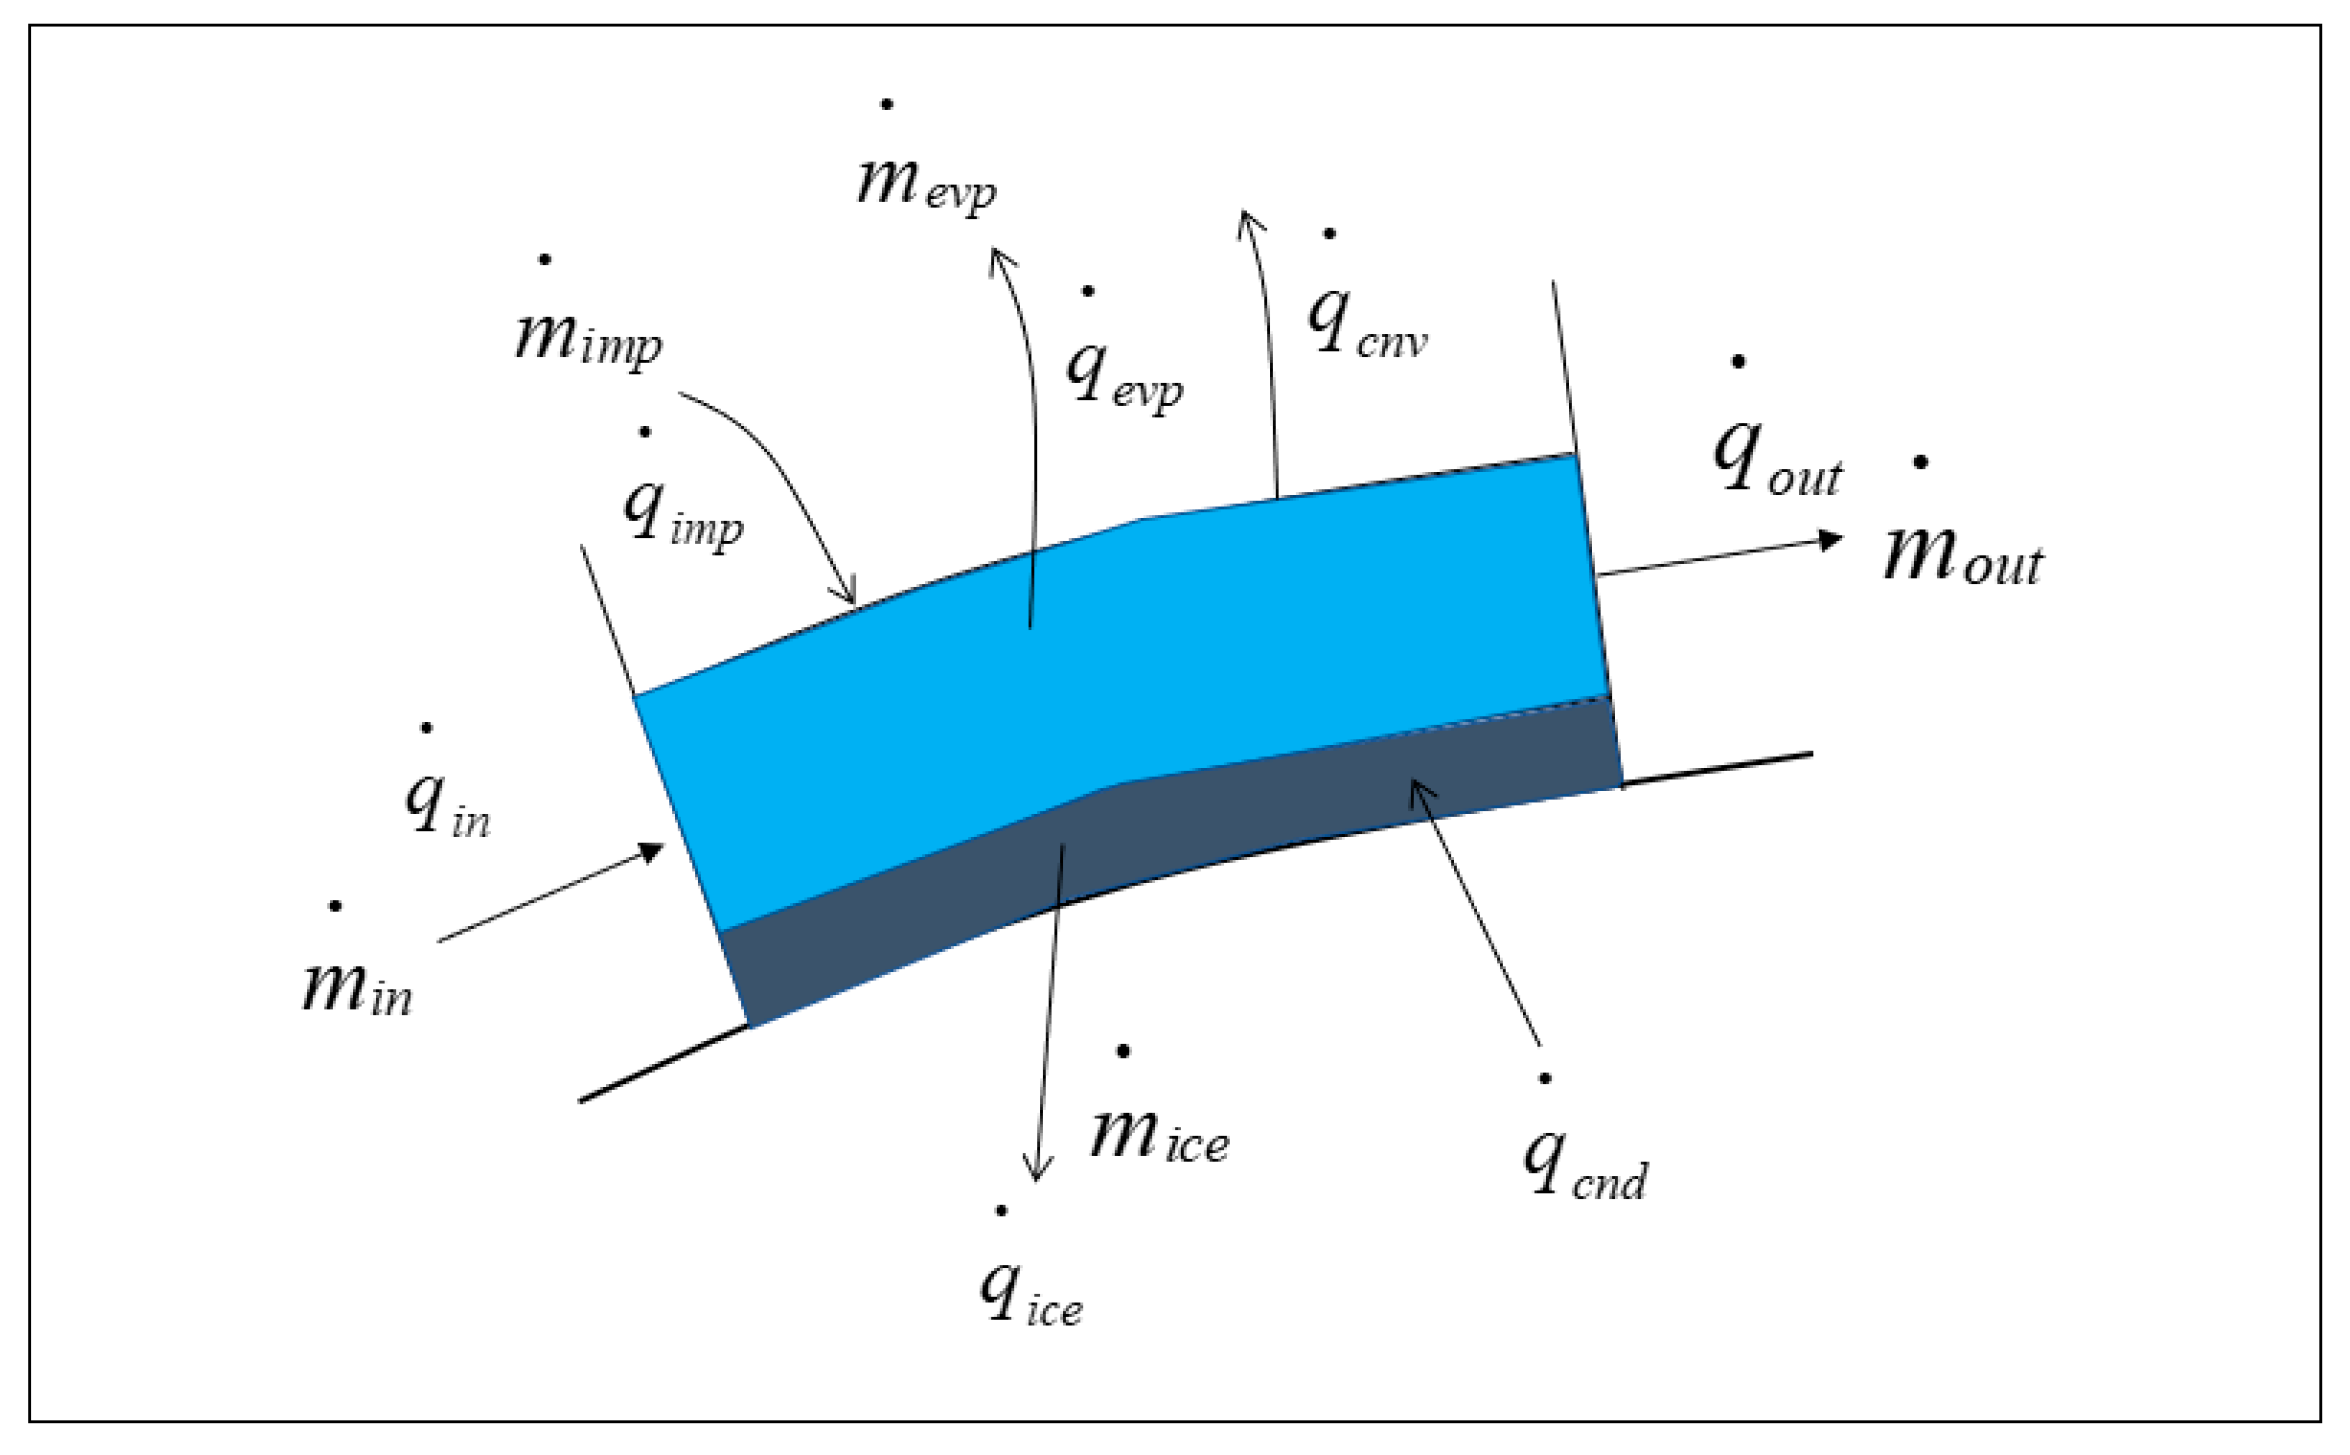
For the ice accretion simulation, the Messinger thermodynamic icing model shown in
Figure 8 is employed to simulate ice accretion. In the figure, the dark blue regions represent the ice on the surface, and the light blue regions represent the water film.
The time-dependent mass and energy governing equations are
The Messinger thermodynamic icing model serves as the analytical framework for simulating ice accretion processes, where mass flux M and thermal energy flux Q represent the fundamental transport variables. Within this formulation, subscript notation explicitly defines physical mechanisms: imp denotes the impingement flux of supercooled droplets on the icing surface, while in accounts for upstream overflow influx from adjacent control volumes, evp and out refer to the evaporation/sublimation losses and for downstream convective transport, respectively. The subscript ice corresponds to the ice formation, while cnd and cnv denote the conduction and convection terms.
In the coupled process, the initial equations governing temperature field evolution for internal and external flow regimes are expressed as
The temperature control equation for the solid domain (skin) is as follows:
The coupled temperature control equation is as follows:
where
ω is the relaxation factor.
4. Identification of Severe Icing Condition
To validate the protective effectiveness of the designed anti-icing structure, the ice accretion under thermal protection activation must be examined under the most severe icing conditions within the flight envelope. Therefore, it is essential to identify the most severe icing condition within the range of flight conditions shown in
Table 2.
To cover the range of conditions, the present manuscript employs Latin Hypercube Sampling (LHS) to sample conditions listed in
Table 2.
Latin Hypercube Sampling (LHS), a statistical technique for producing quasi-random samples across multidimensional parameter spaces, operates through the following procedural framework:
- (1)
In the cumulative distribution function, stratified sampling first determines the parameter value range, dividing the value space into N equal parts, resulting in N strata.
- (2)
Randomly select sampling points within each stratum and then invert to obtain N sampling values.
- (3)
Shuffle the order of the sampled points to ensure the independence of the sample space.
Using the above sampling method, a total of 30 sample conditions were obtained. The incoming air flow, supercooled droplet impingements, and icing accretions for these sampled conditions were calculated using the methods described in this section. After determining ice mass accumulation at the 600s mark for all scenarios, these values served as the objective function input to the Kriging surrogate model, which identified the parameter combination associated with the most critical icing scenario.
Kriging model [
29] accuracy and surface continuity are governed by the spatial covariance structure. Presently, the Gaussian formulation serves as the primary basis for constructing smoother surrogate models:
From the above equation, it can be seen that the value of the spatial correlation function R decreases as the distance between two spatial points increases, and θ is a coefficient that reflects the rate of change of the distance between two points. Heterogeneity in θ components indicates anisotropic spatial covariance properties. Parameter R quantifies the contribution of individual points x to the system response.
Test sample response values are typically calculated by substituting known sample data into
where
f(
x) is the linear combination of all test sample points.
Prediction error relative to actual measurements is quantified with
where
cT is the variance of the sample points.
The unbiased estimate of the test point can be obtained as
The MSE metric for the Kriging model is determined with the following formulation:
Kriging modeling minimizes MSE while satisfying unbiasedness constraints:
The variance
σ2 can be estimated using the maximum likelihood estimation of the response values of the test points:
By setting
θ, the general expression for the predicted value
at the location
x can be obtained as
Based on the shape of the surface generated by the Kriging model, it can be observed that there are multiple local extrema points on this surface. To address the issue of multiple extrema, this paper optimizes the Kriging model by incorporating a genetic algorithm. The corresponding code is implemented using the DACE toolbox and GA toolbox in MATLAB 2024R2 [
30].
5. Results and Discussion
A total of 30 sample conditions were generated via the LHS method within the range shown in
Table 2, and the detailed parameters are listed in
Table 3 (due to space limitations,
Table 3 shows only a portion of the conditions).
Using the calculation methods described in
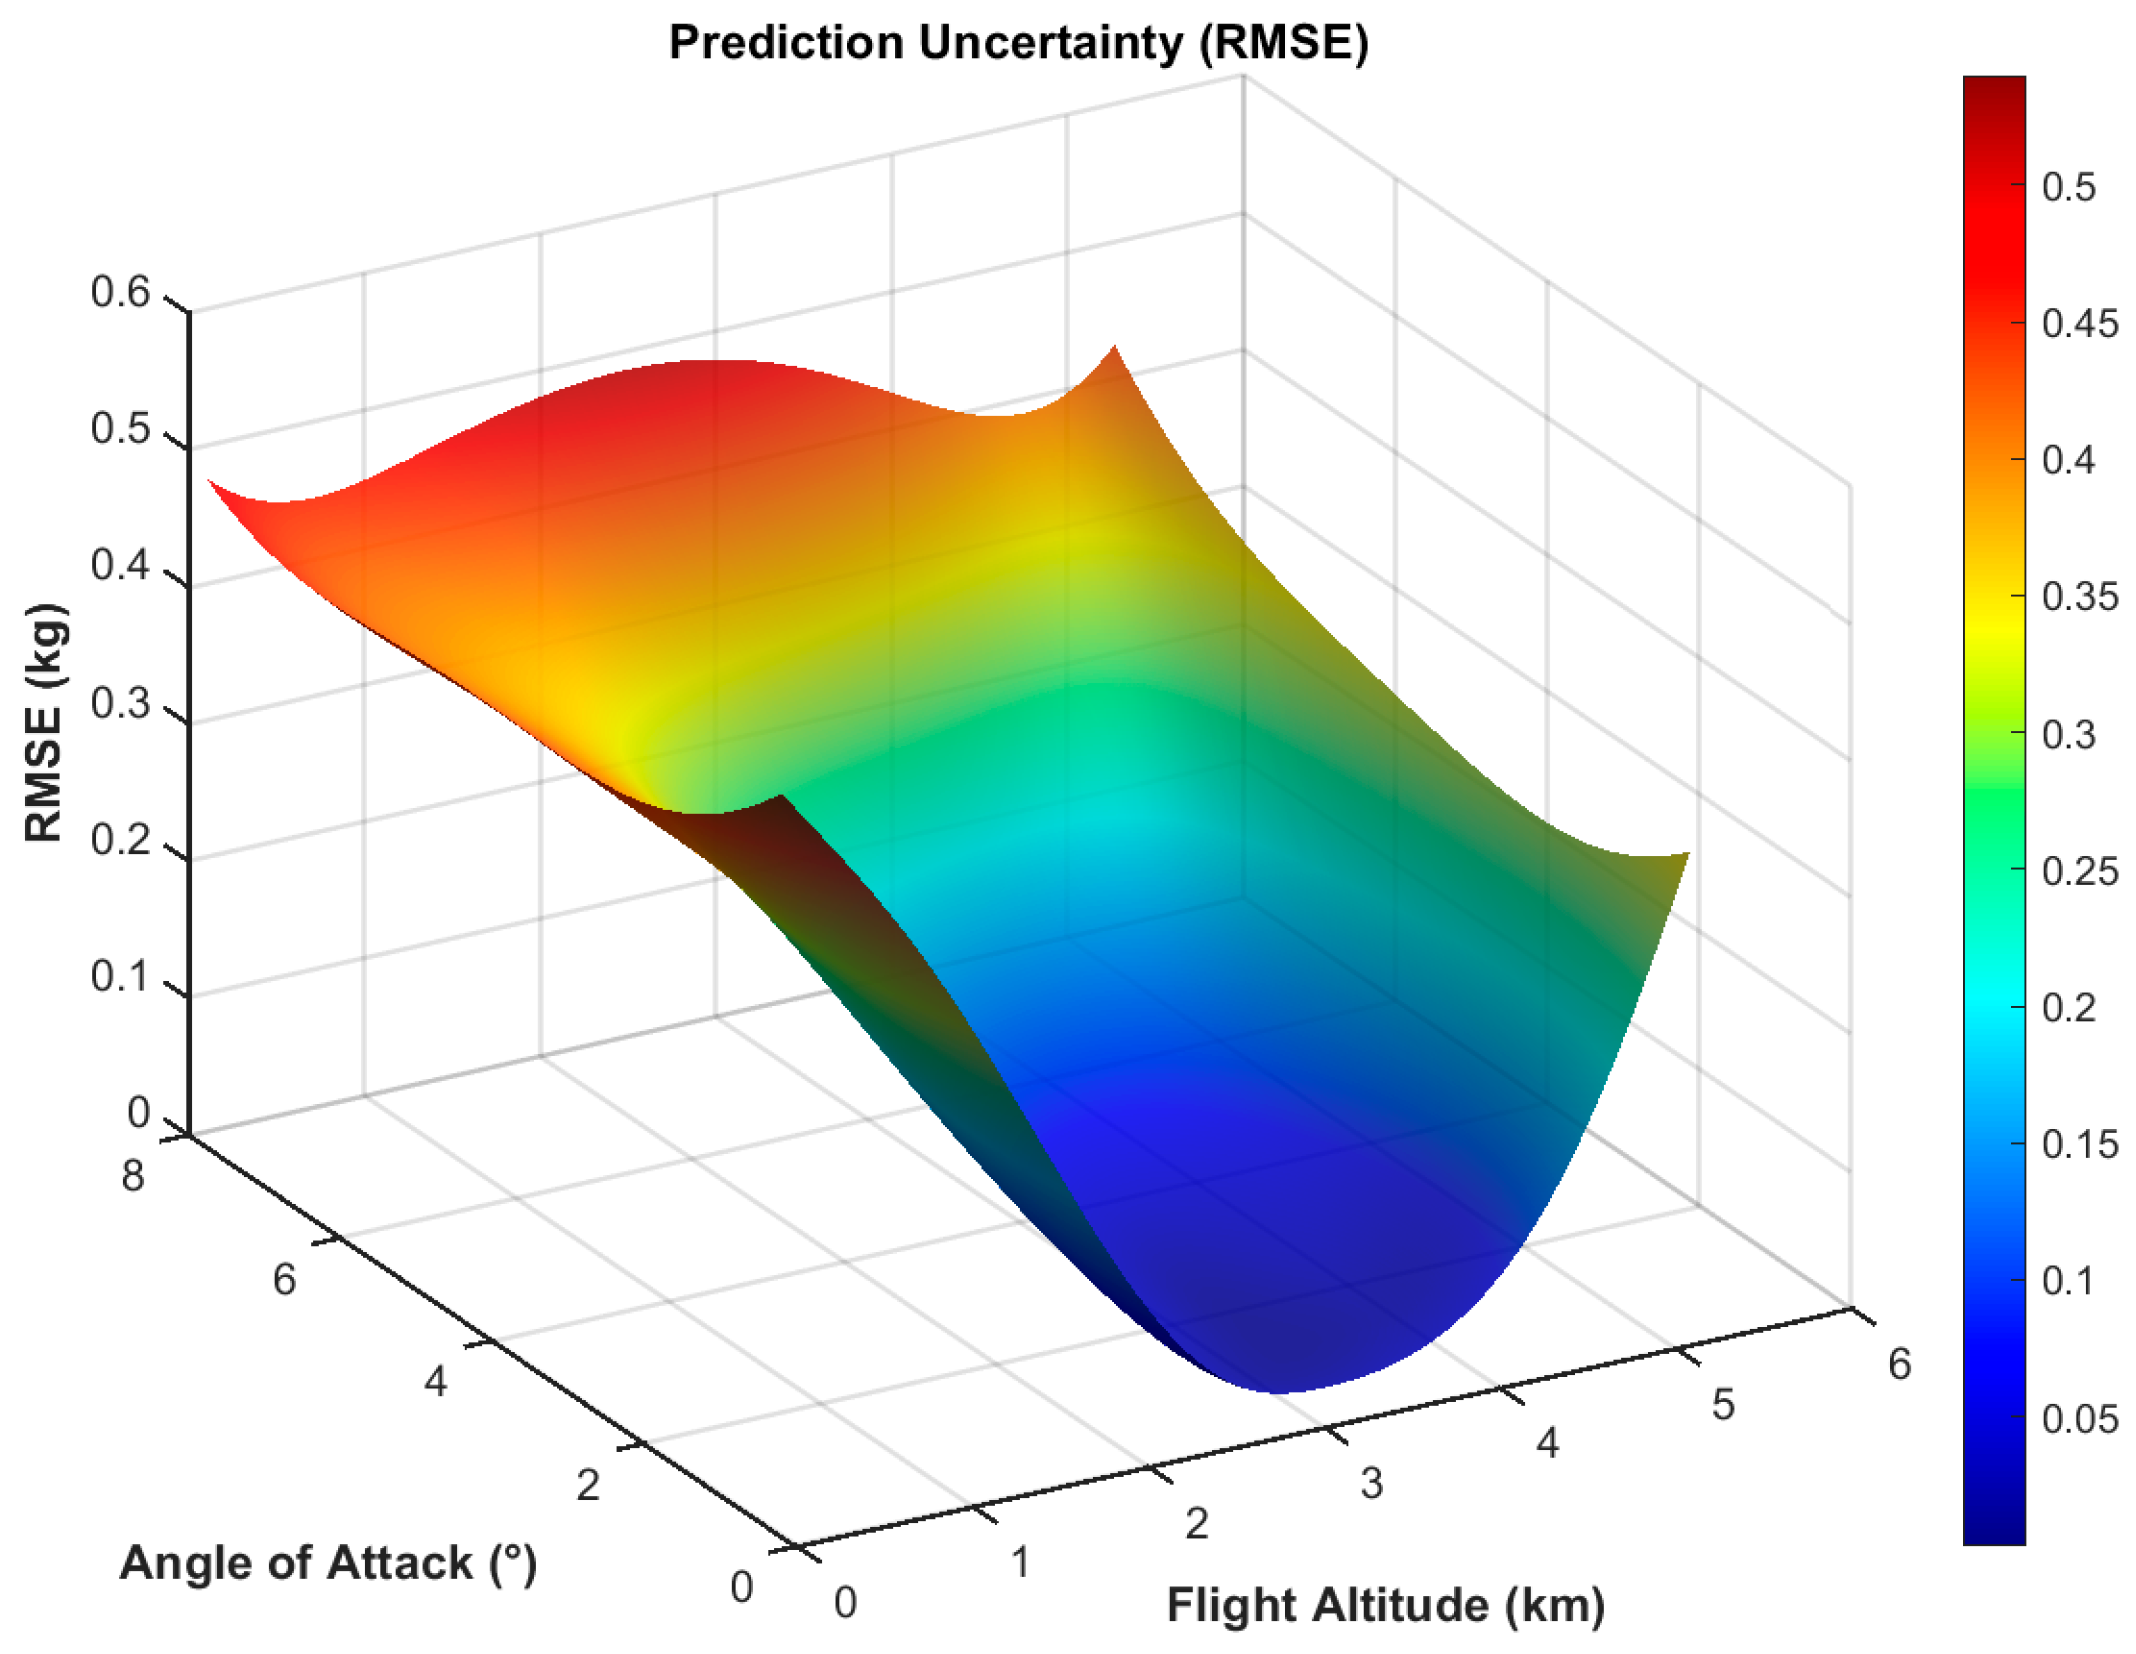
Section 3, the ice accretion for each condition after 600 s was calculated. The condition parameters and ice mass were then used as the variables and objective function, respectively, in the Kriging optimization method to identify the most severe icing conditions. The corresponding distributions of prediction standard deviation (RMSE) for these parameter combinations are shown in
Figure 9,
Figure 10 and
Figure 11, and it is observed that the maximum RMSE of all prediction models is below 0.55 kg, demonstrating high reliability and excellent generalization capability of the model across the parameter space.
The three-dimensional relationships between flying parameters and the predicted icing mass are illustrated in
Figure 12,
Figure 13 and
Figure 14, the optimal parameters with maximum icing mass are shown in
Table 4, and the RMSE of the model is 1.6% at this optimal point.
This paper employs the computational method presented in
Section 3 to calculate and analyze the interior and exterior flow fields as well as the coupled anti-icing under the aforementioned severe operating conditions.
Figure 15 and
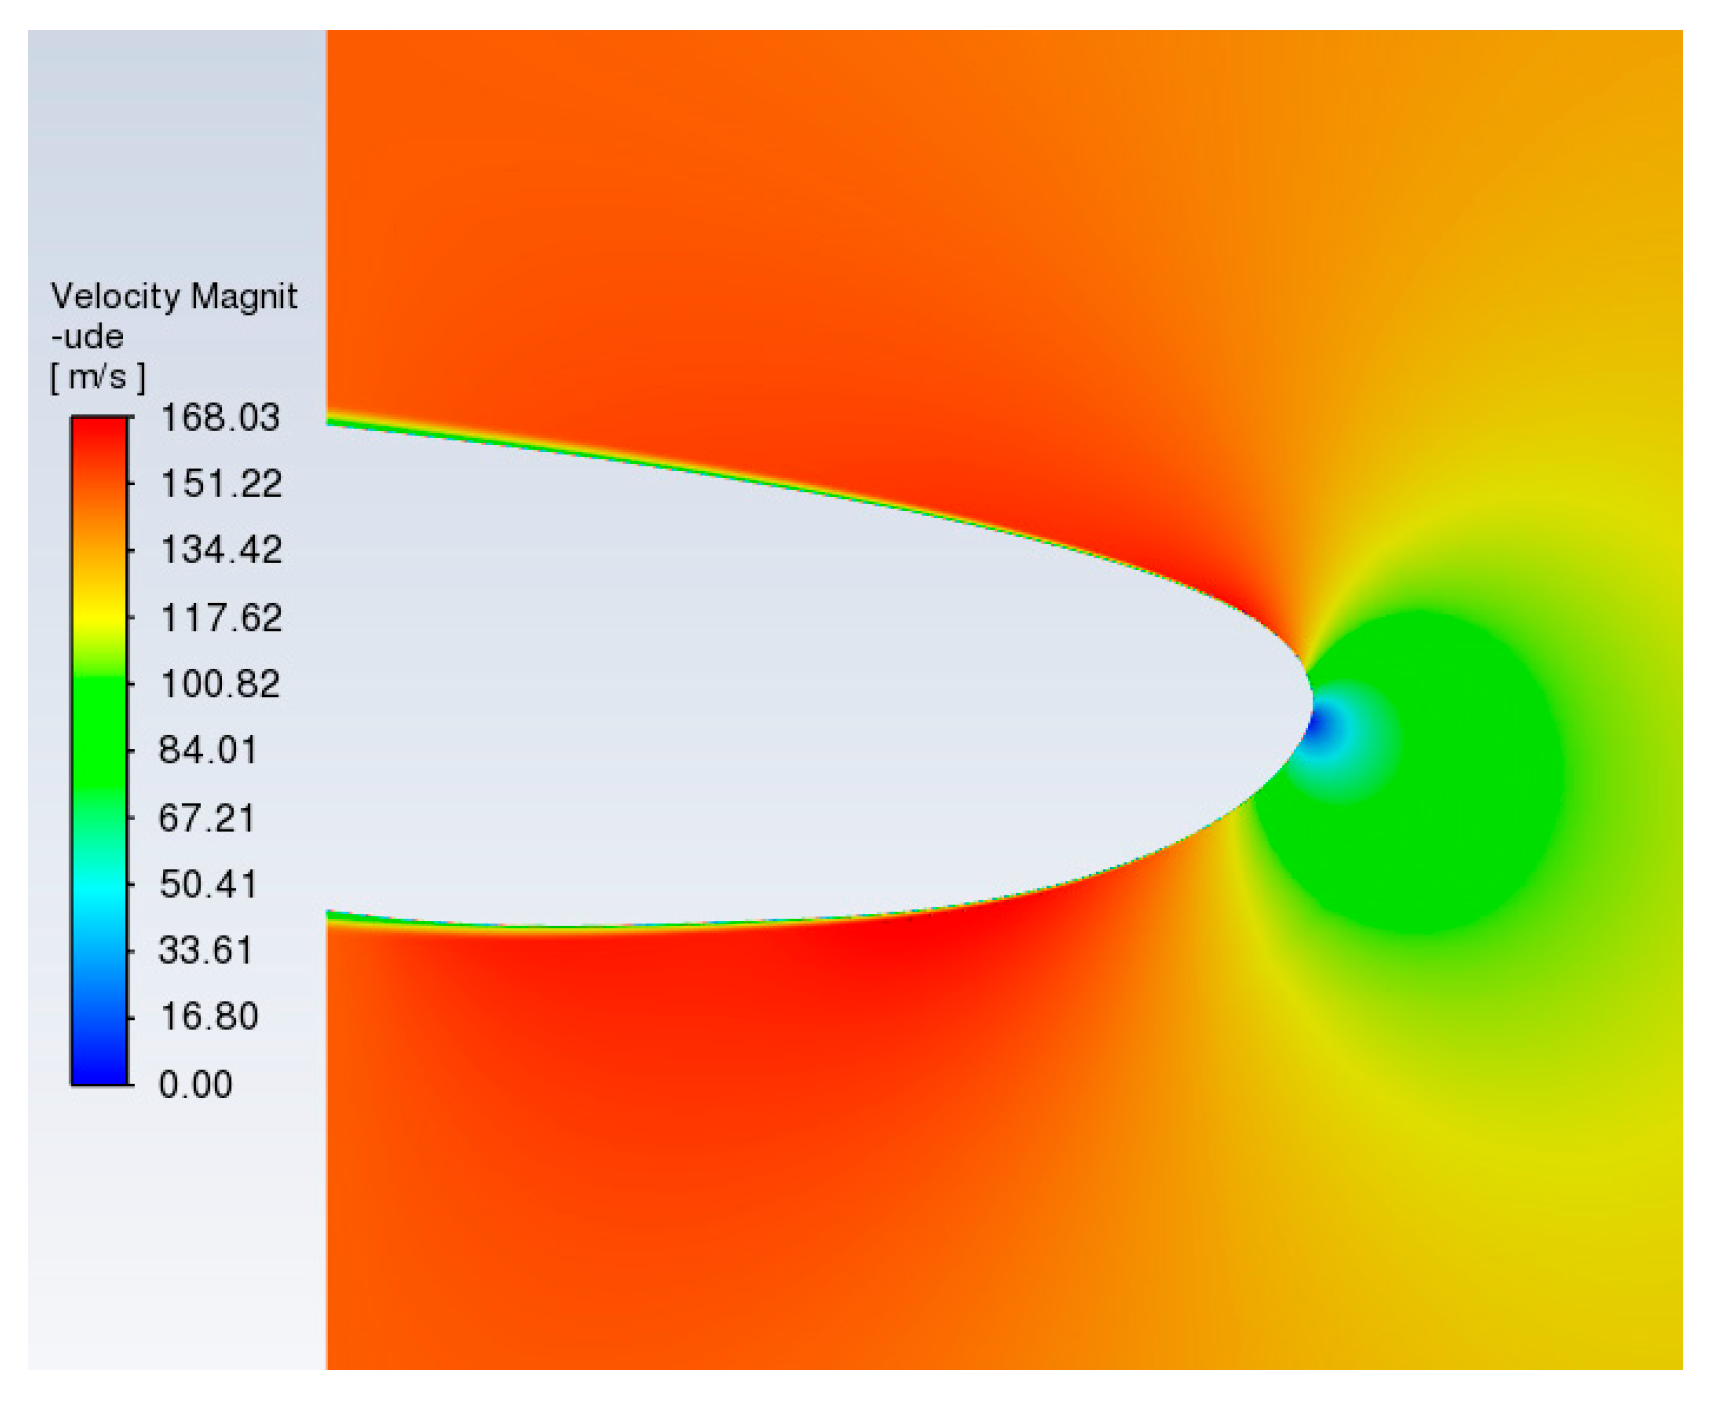
Figure 16 show the pressure coefficient and velocity distribution in exterior flow near the lip.
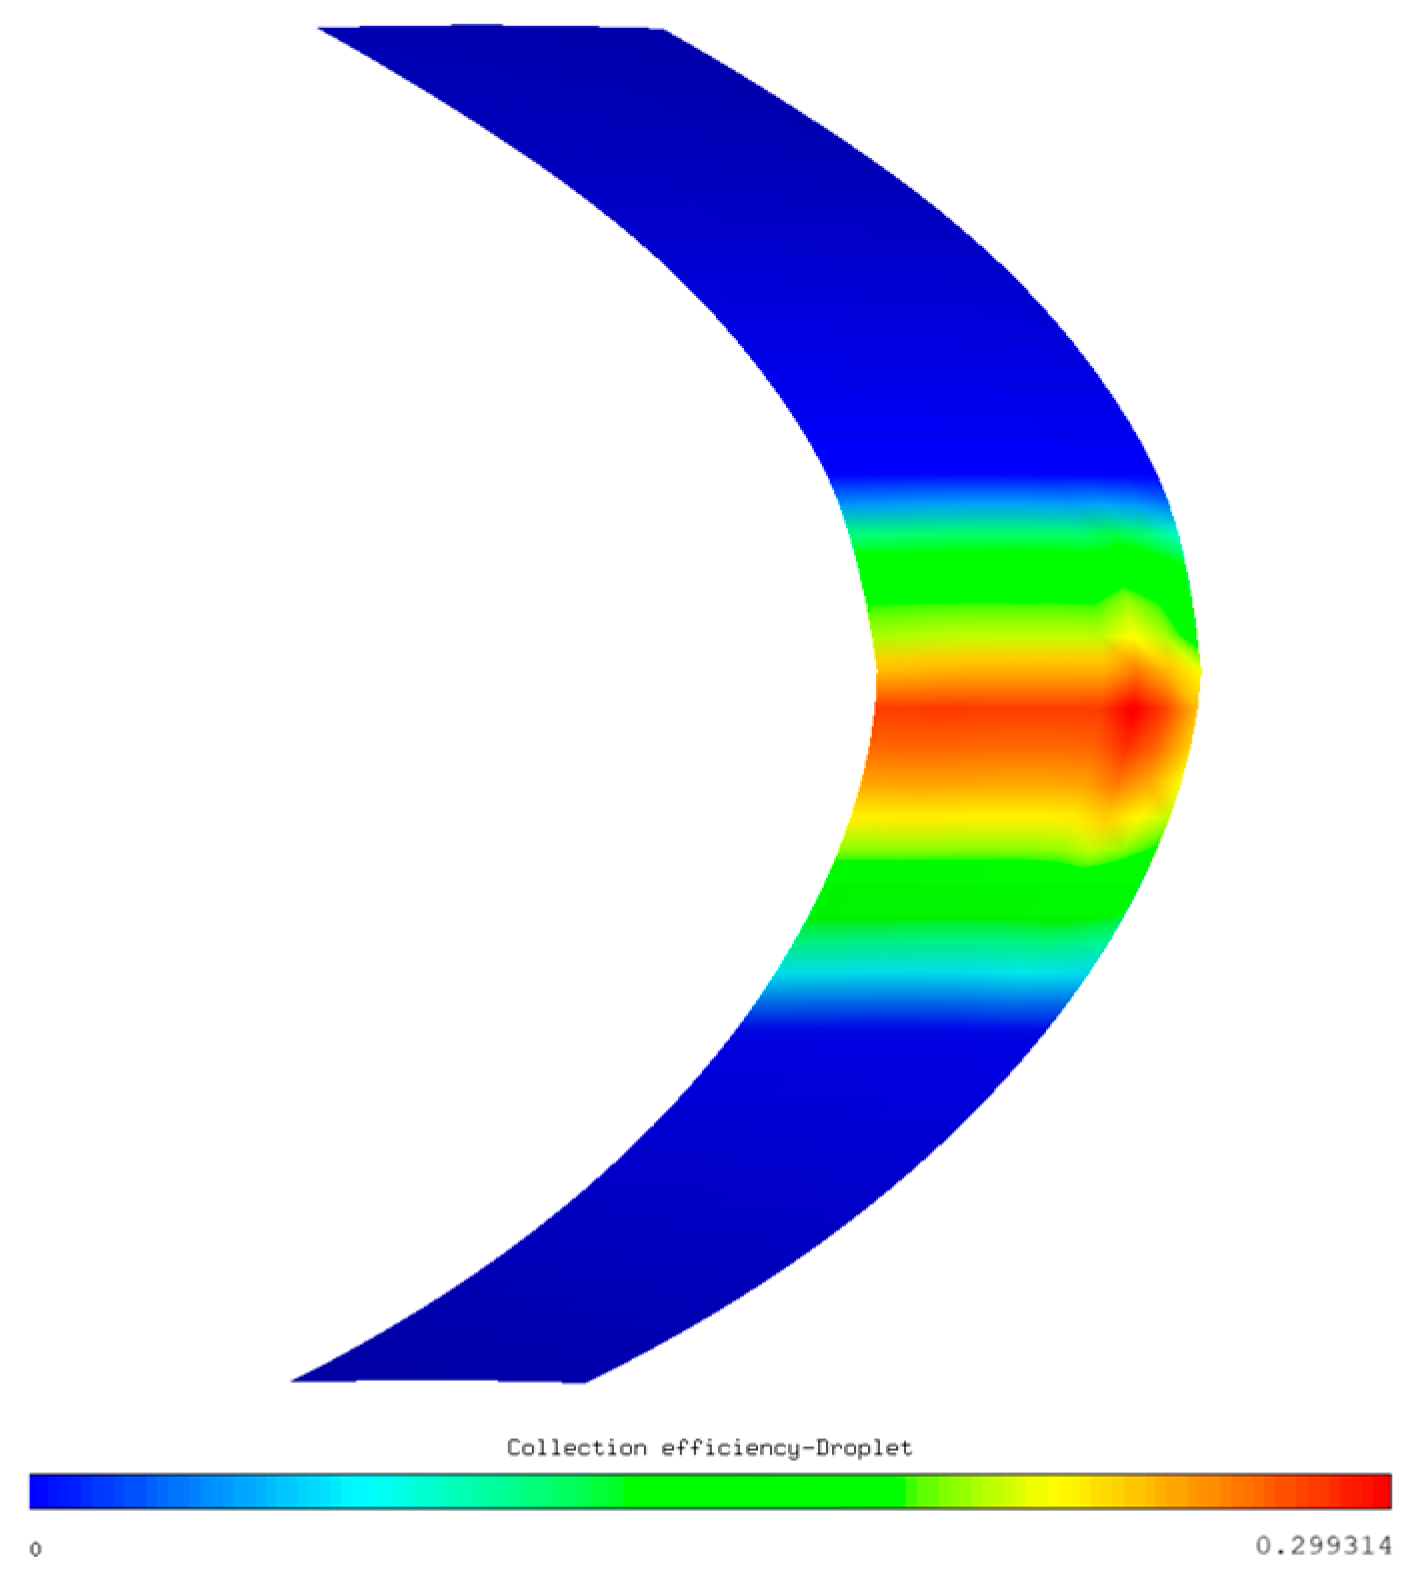
As evidenced by the data, the surface stagnation point shifts to the lower lip surface under high angle-of-attack conditions, whereas the upper surface exhibits both the minimum pressure coefficient and peak velocity. This specific location under compressible flow regimes concurrently attains the lowest air temperature. The resultant flow characteristics directly influence the droplet collection behavior, with the supercooled water collection coefficient attaining its maximum near the stagnation region, as shown in
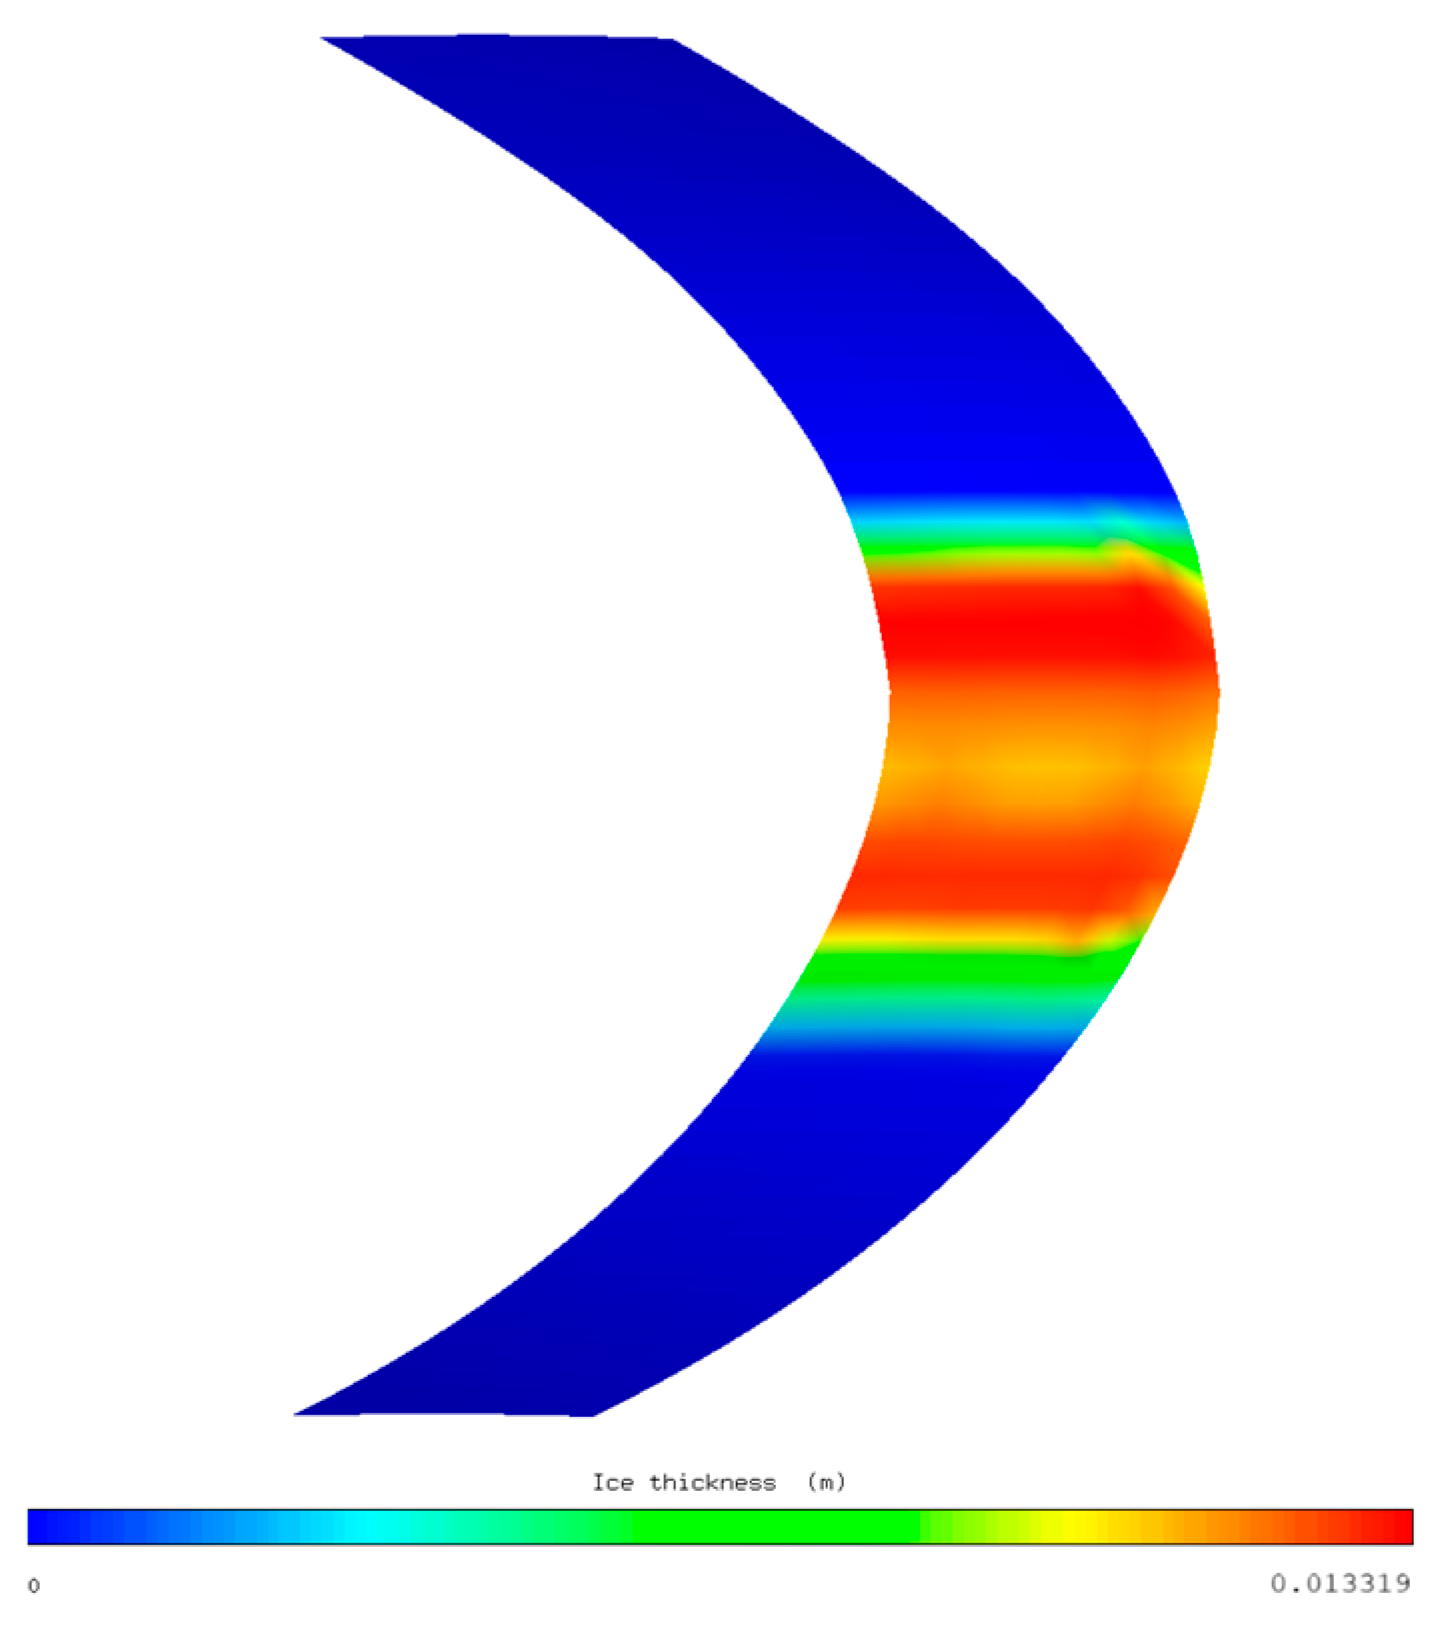
Figure 17. Upon impinging on the leading edge, the liquid film formed by the droplets flows along the lip surface. Ice accretes during this flowing process, and the ice thickness increases first and then decreases from the leading to the trailing edge, affected by the temperature reduction on the lip surface, as illustrated in
Figure 18. The maximum thickness appears near the low-temperature region on the upper surface.
Three-dimensional ice accretion morphologies at 1800 s are compared in
Figure 19 and
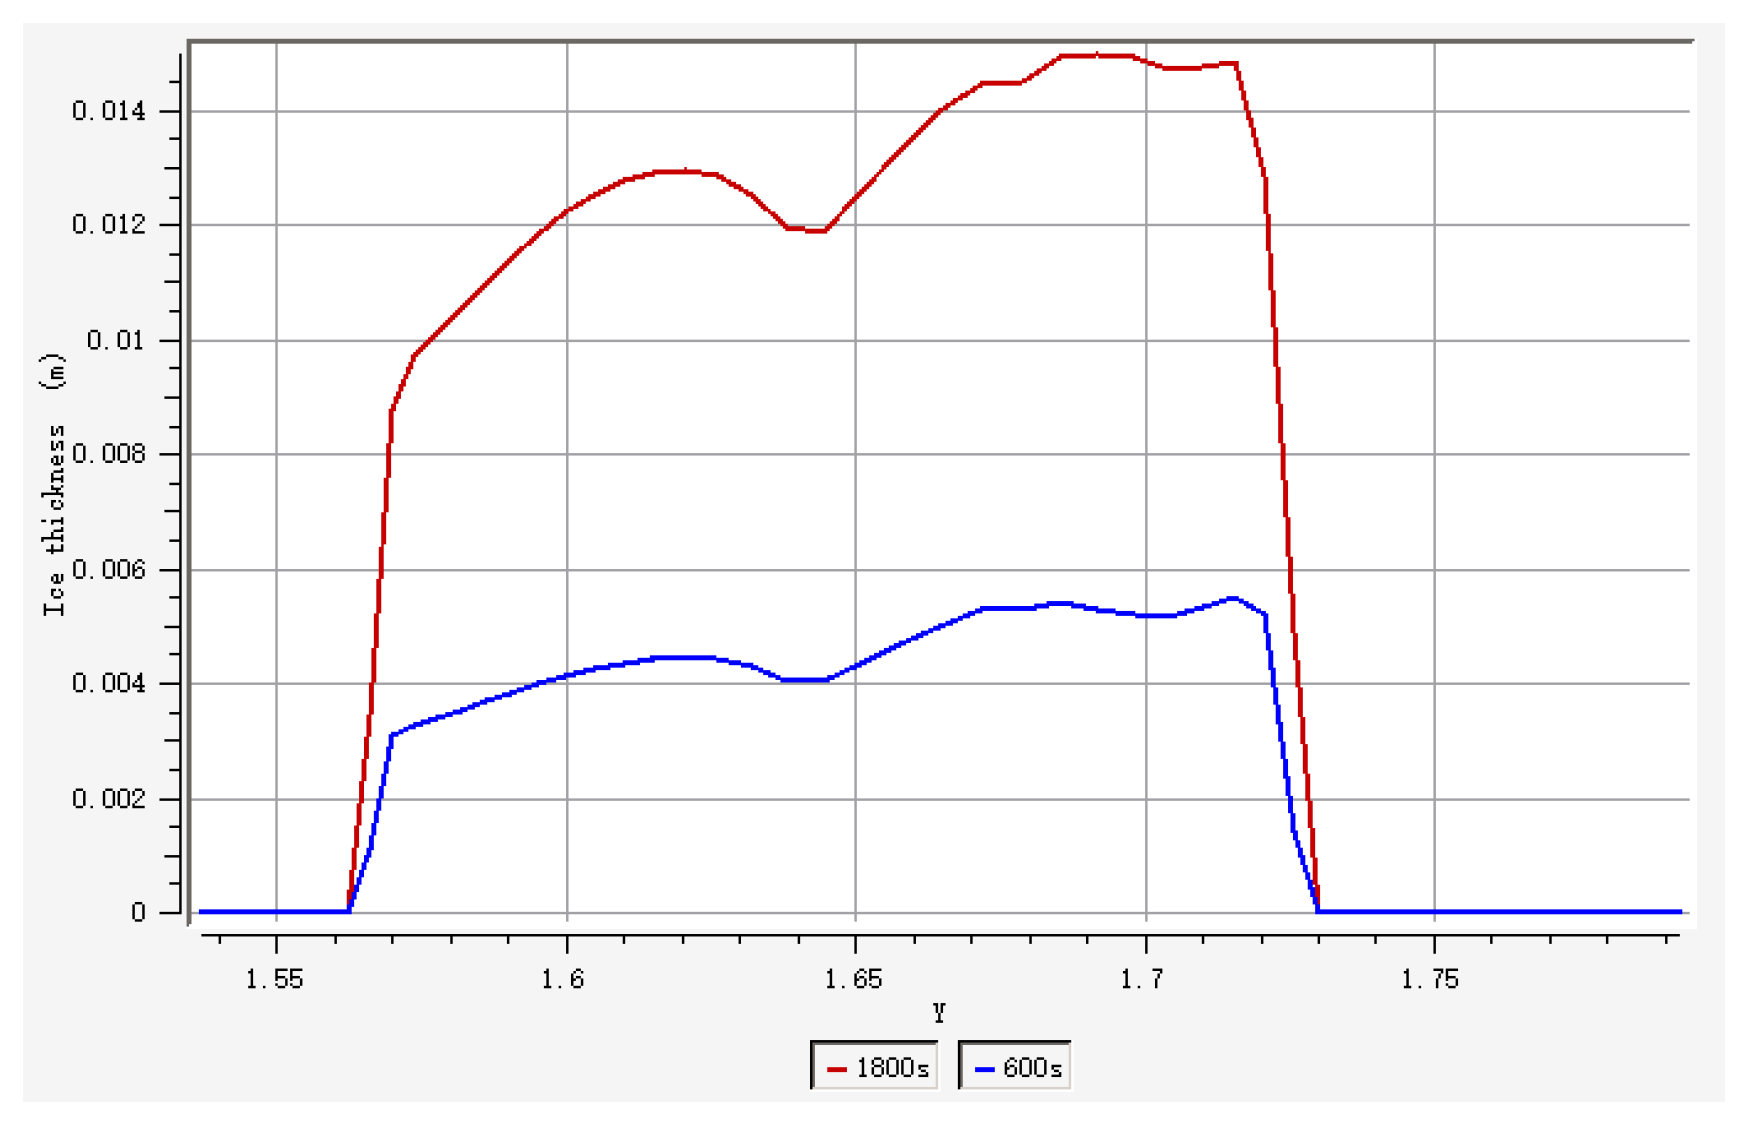
Figure 20, while
Figure 21 and
Figure 22 present cross-sectional comparisons (z = −0.04 plane, radial symmetry plane of the nacelle lip) at 600 s and 1800 s intervals. The results reveal a progressive accretion of the ice layer: The maximum thickness on the lip surface increases from 5.5 mm to 15.2 mm during the observation period, corresponding to a 176.4% increase. Due to the morphological evolution of the lip geometry, the maximal maximum thickness consistently localizes within the low-pressure/temperature region of the lip’s upper surface. Additionally, significant ice accumulation also occurs in the lower surface’s low-pressure zone, with thickness measurements showing rapid growth from 4.3 mm (600 s) to 12.9 mm (1800 s). This 193.2% increase rate slightly exceeds the upper surface’s growth rate, suggesting asymmetric accretion dynamics between the upper and lower surfaces under prolonged icing conditions.
Considering that in actual engine operation, the lower surface is affected by the suction of the bypass airflow, the actual surface temperature would be lower than the calculated values in this study. It can be inferred that under the severe icing conditions identified in this study, serious icing will occur on the engine nacelle lip, thereby the anti-icing protection is required to sustain aerodynamic performance and ensure continued flight safety.
In this model, the supplied air temperature for the anti-icing bay is 383.15 K, and the flow rate supplied to the lip is 0.193 kg/s. In this study, a portion of the supply air flow rate of 0.00535 kg/s is considered. To evaluate the effectiveness of the protective conditions and the anti-icing structure under severe flying conditions, the anti-icing characteristics were calculated using computational methods described in
Section 3.
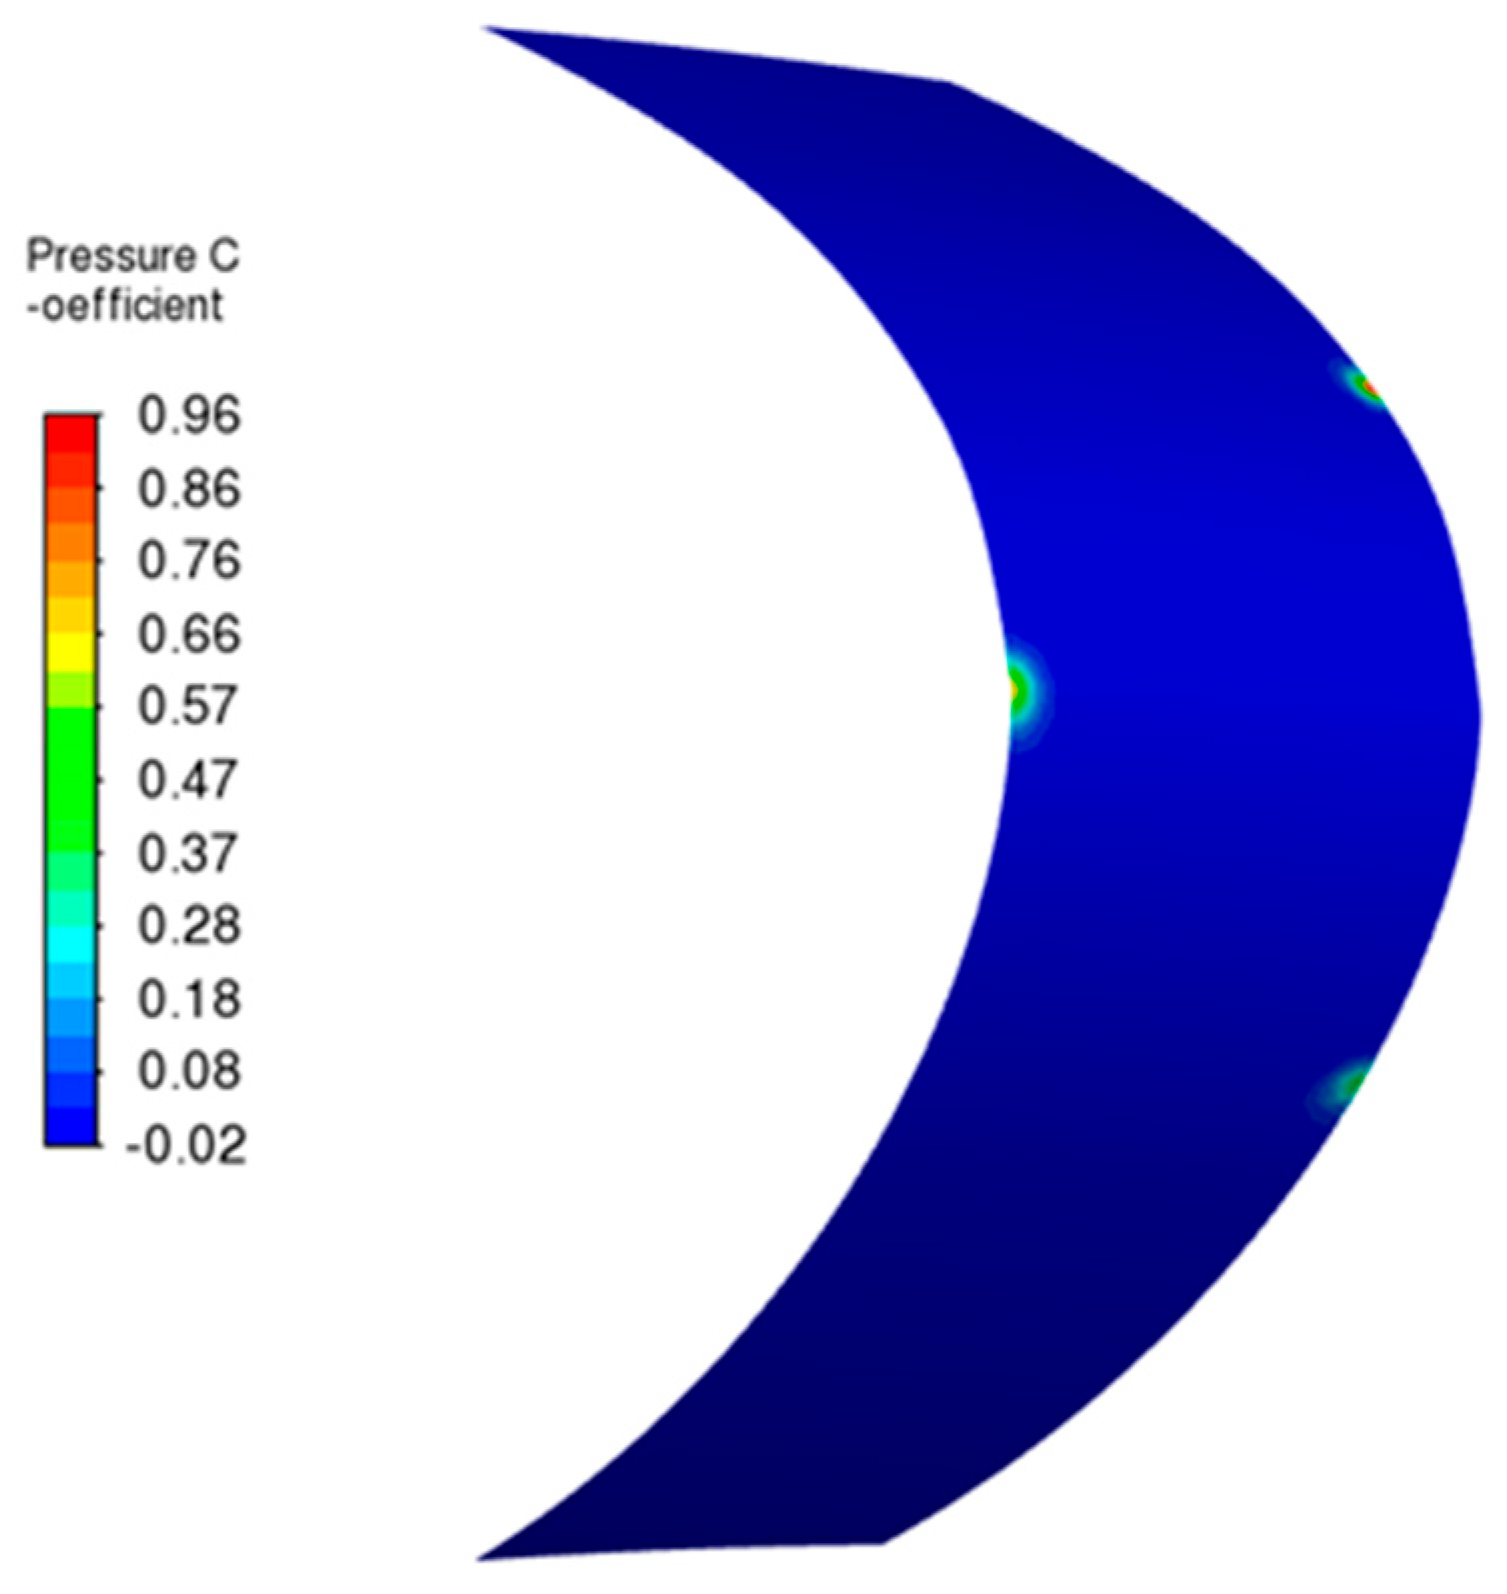
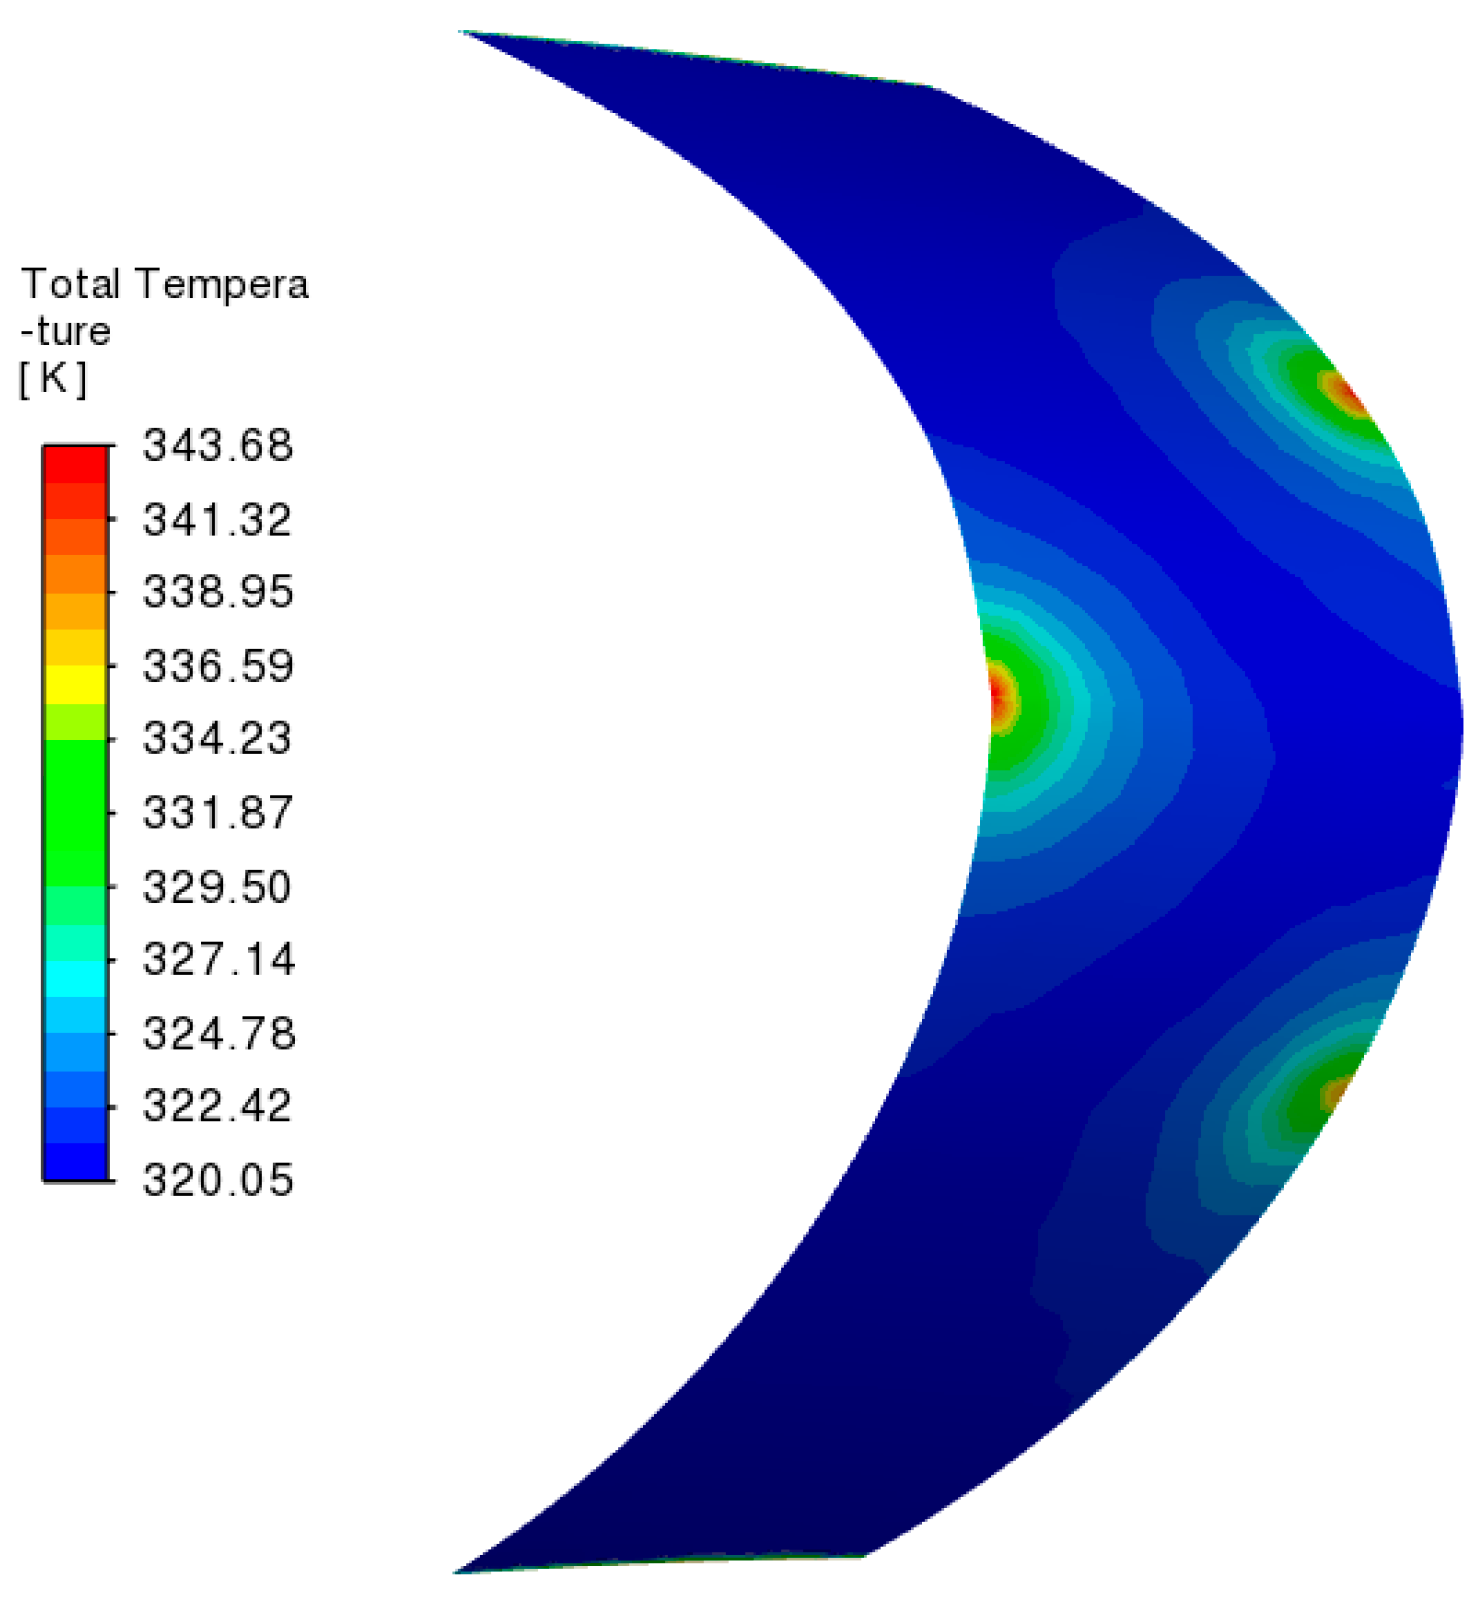
Figure 23 and
Figure 24 show the pressure coefficient and total temperature profiles across the anti-icing bay’s interior surface.
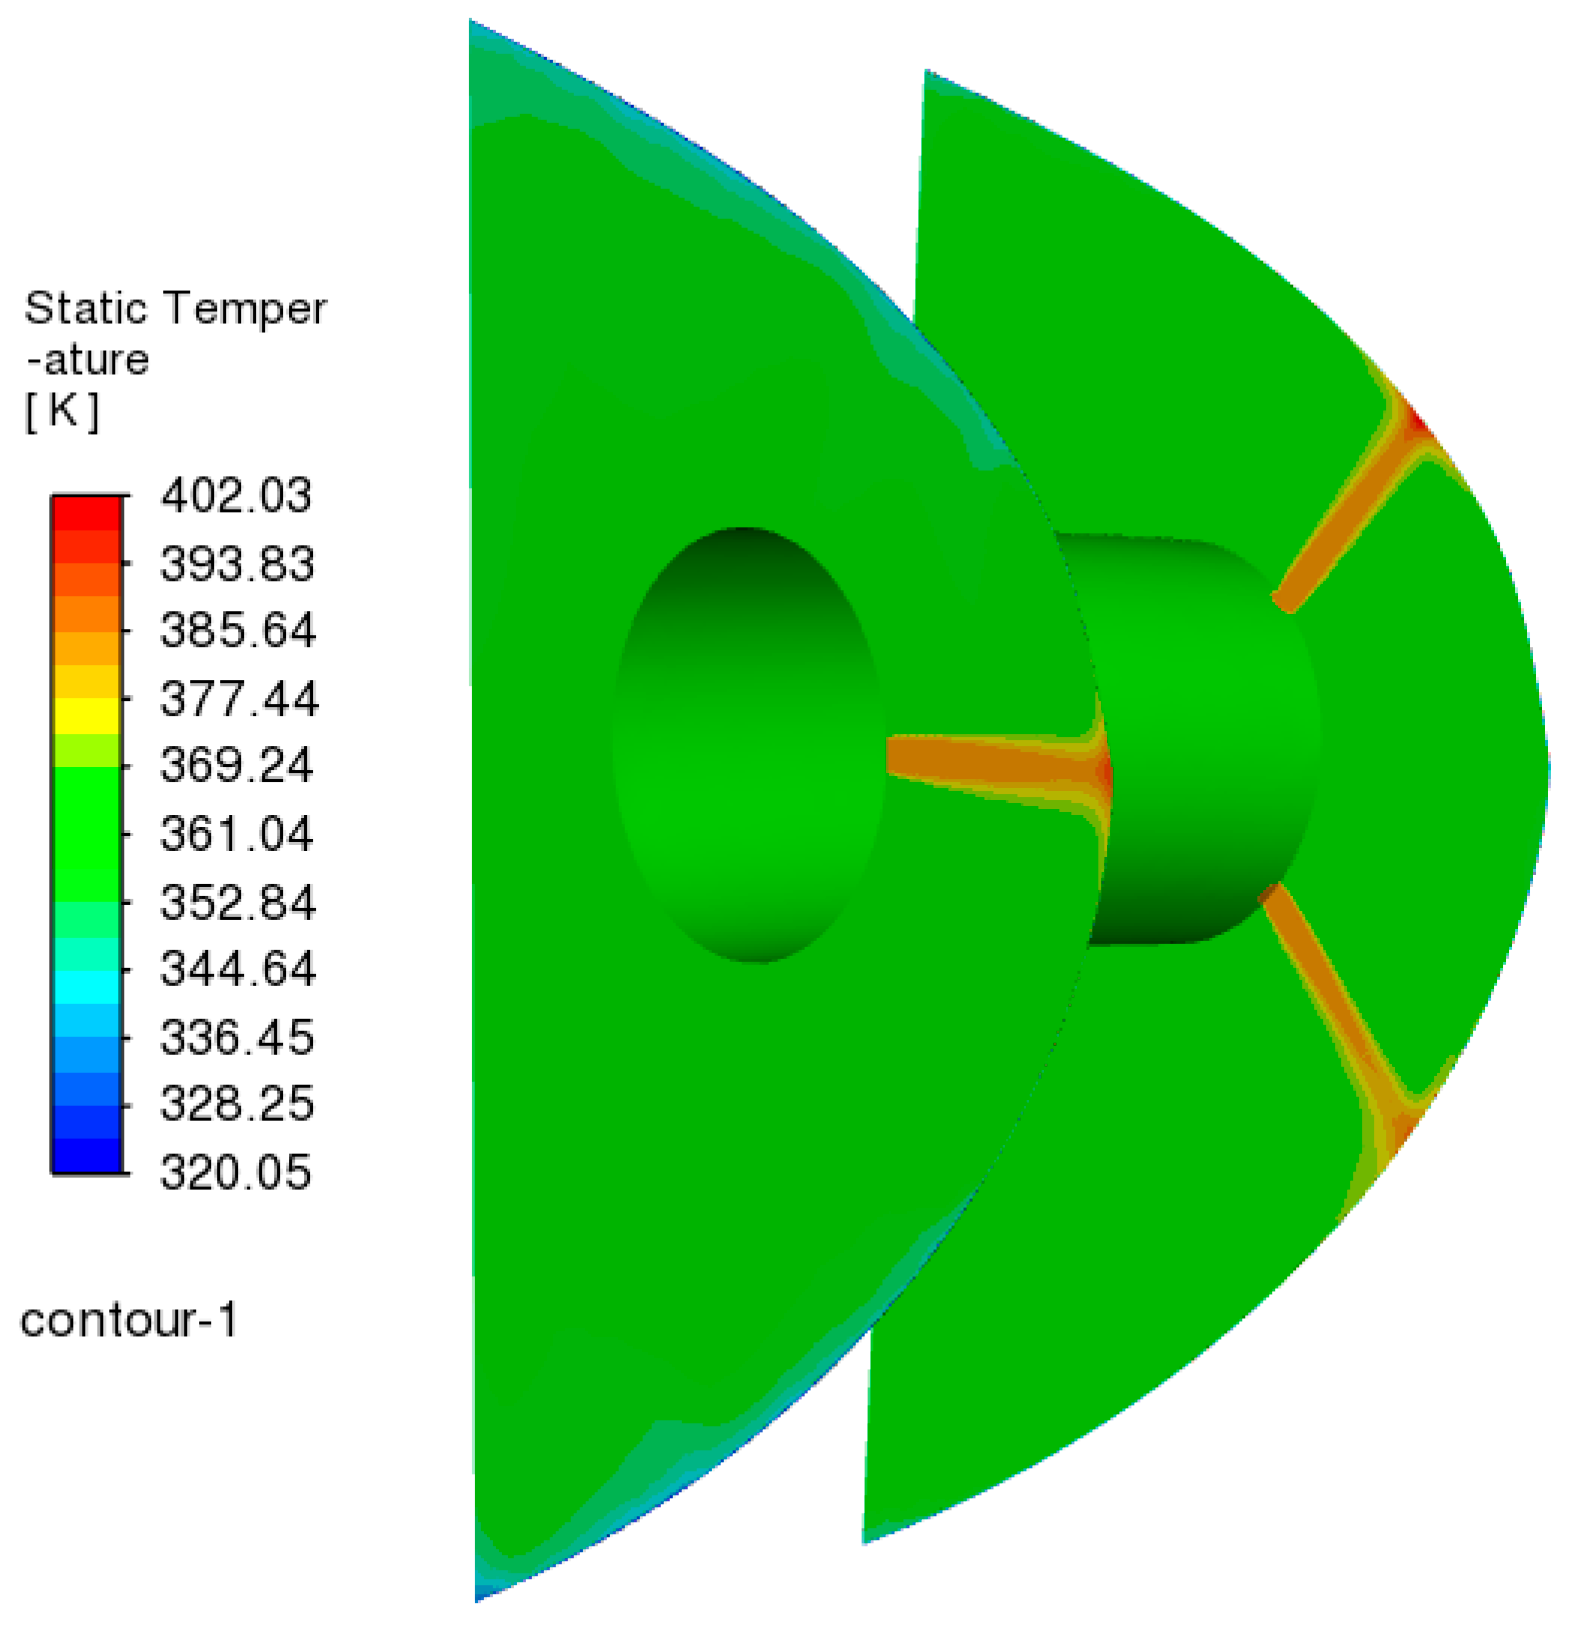
Figure 25 and
Figure 26 provide thermal and velocity fields on the jet exit’s symmetry plan. The results illustrate that the jet forms a pronounced stagnation zone near the anti-icing bay’s leading edge, accompanied by a simultaneous elevation in both the pressure coefficient (Cp) and total temperature values. Additionally, an effective entrainment is formed within the anti-icing bay with relatively homogeneous thermal distribution on the symmetry plane. Except for the jet region, the temperature is generally between 350 and 360 K, providing effective protection for the lip.
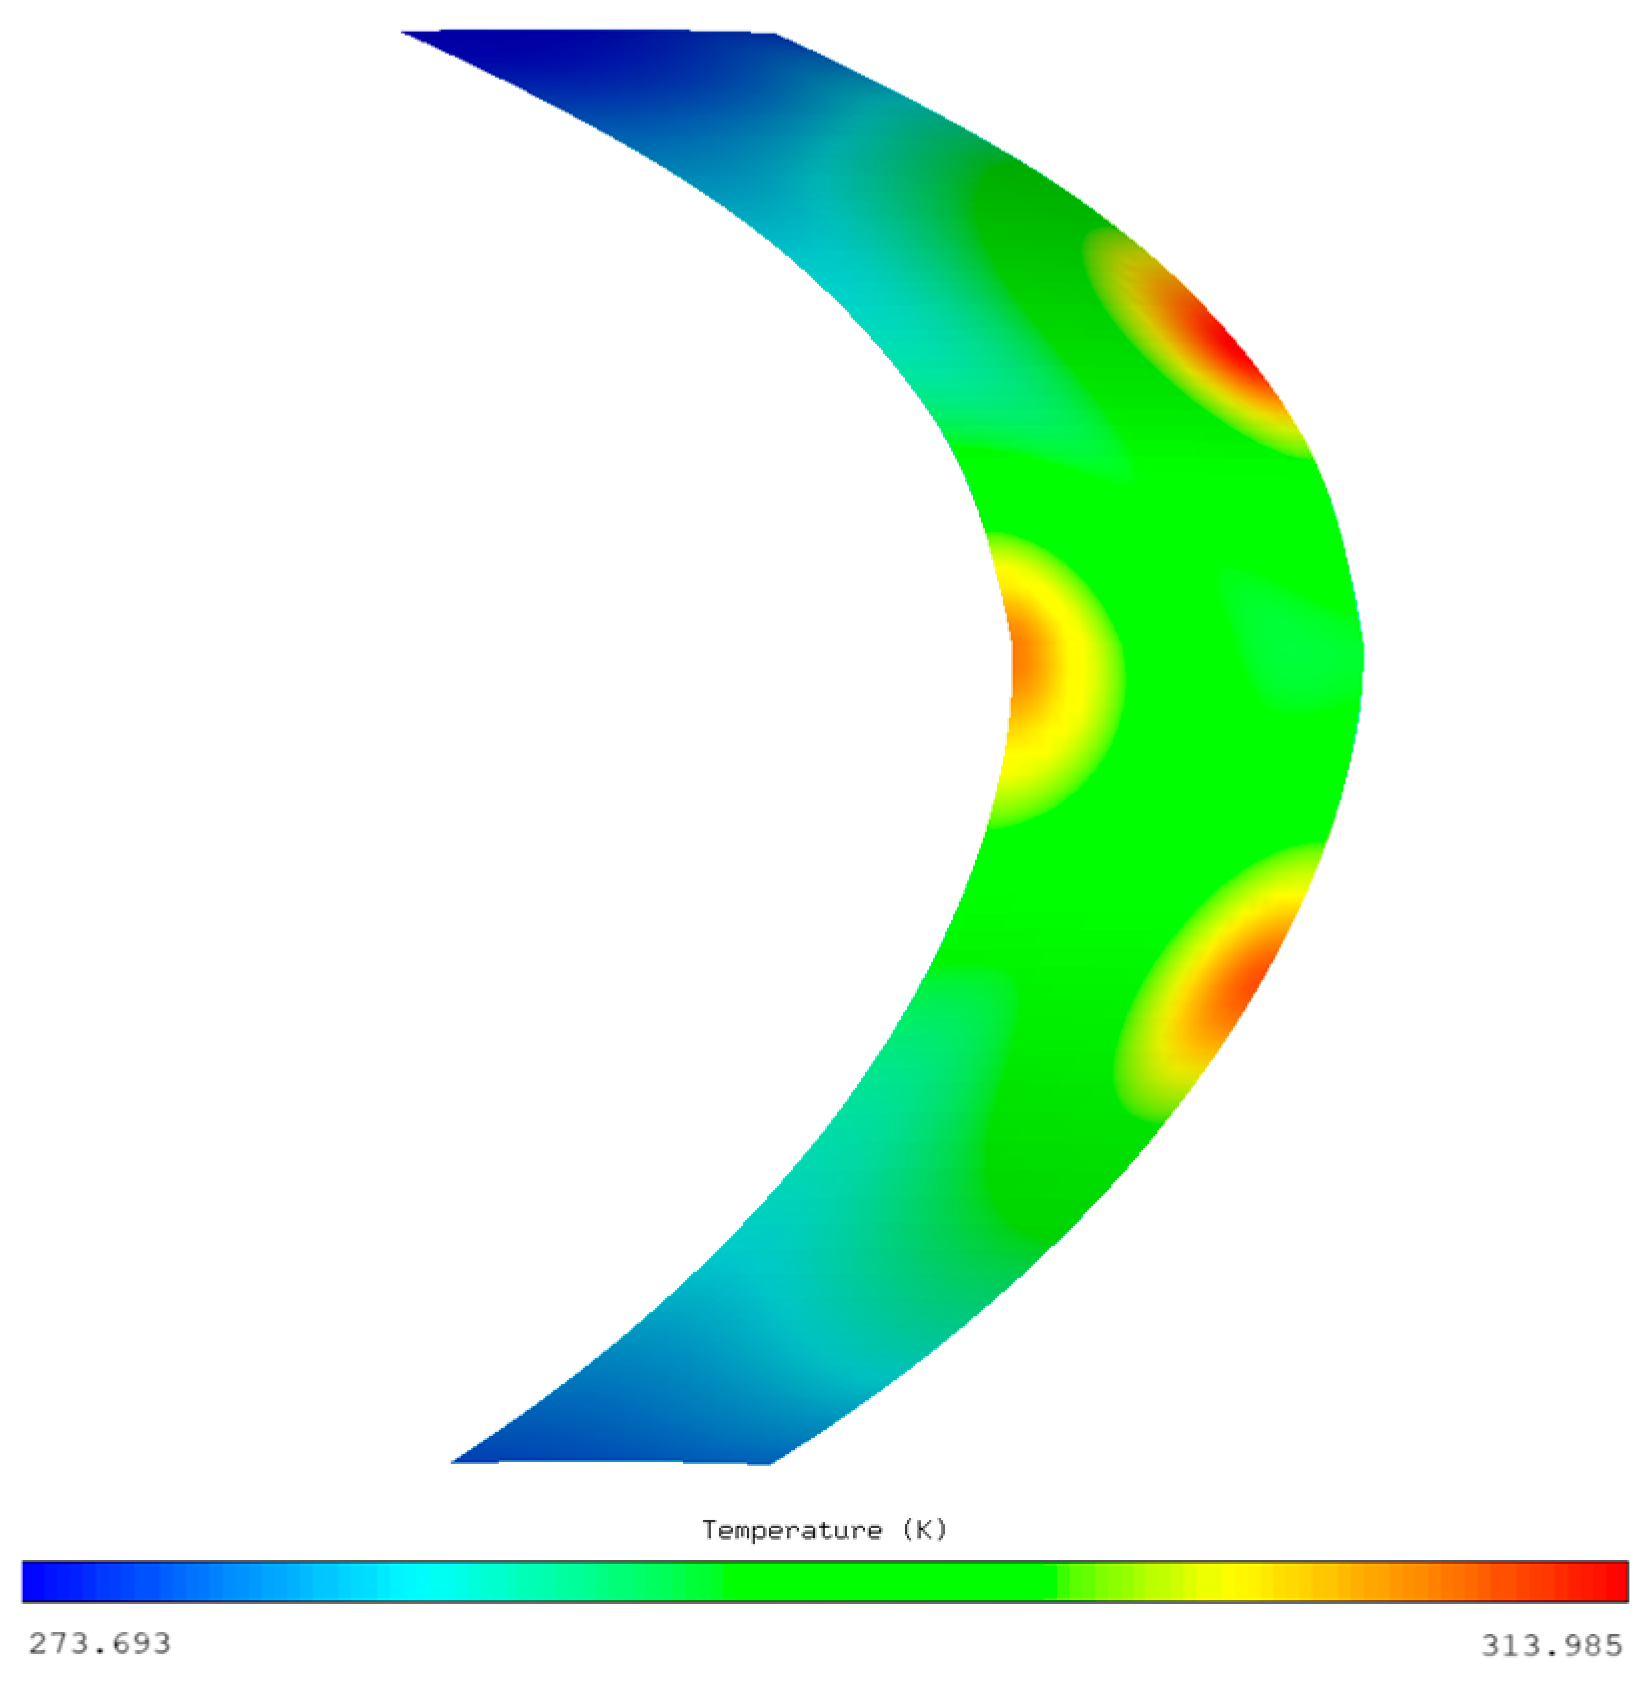
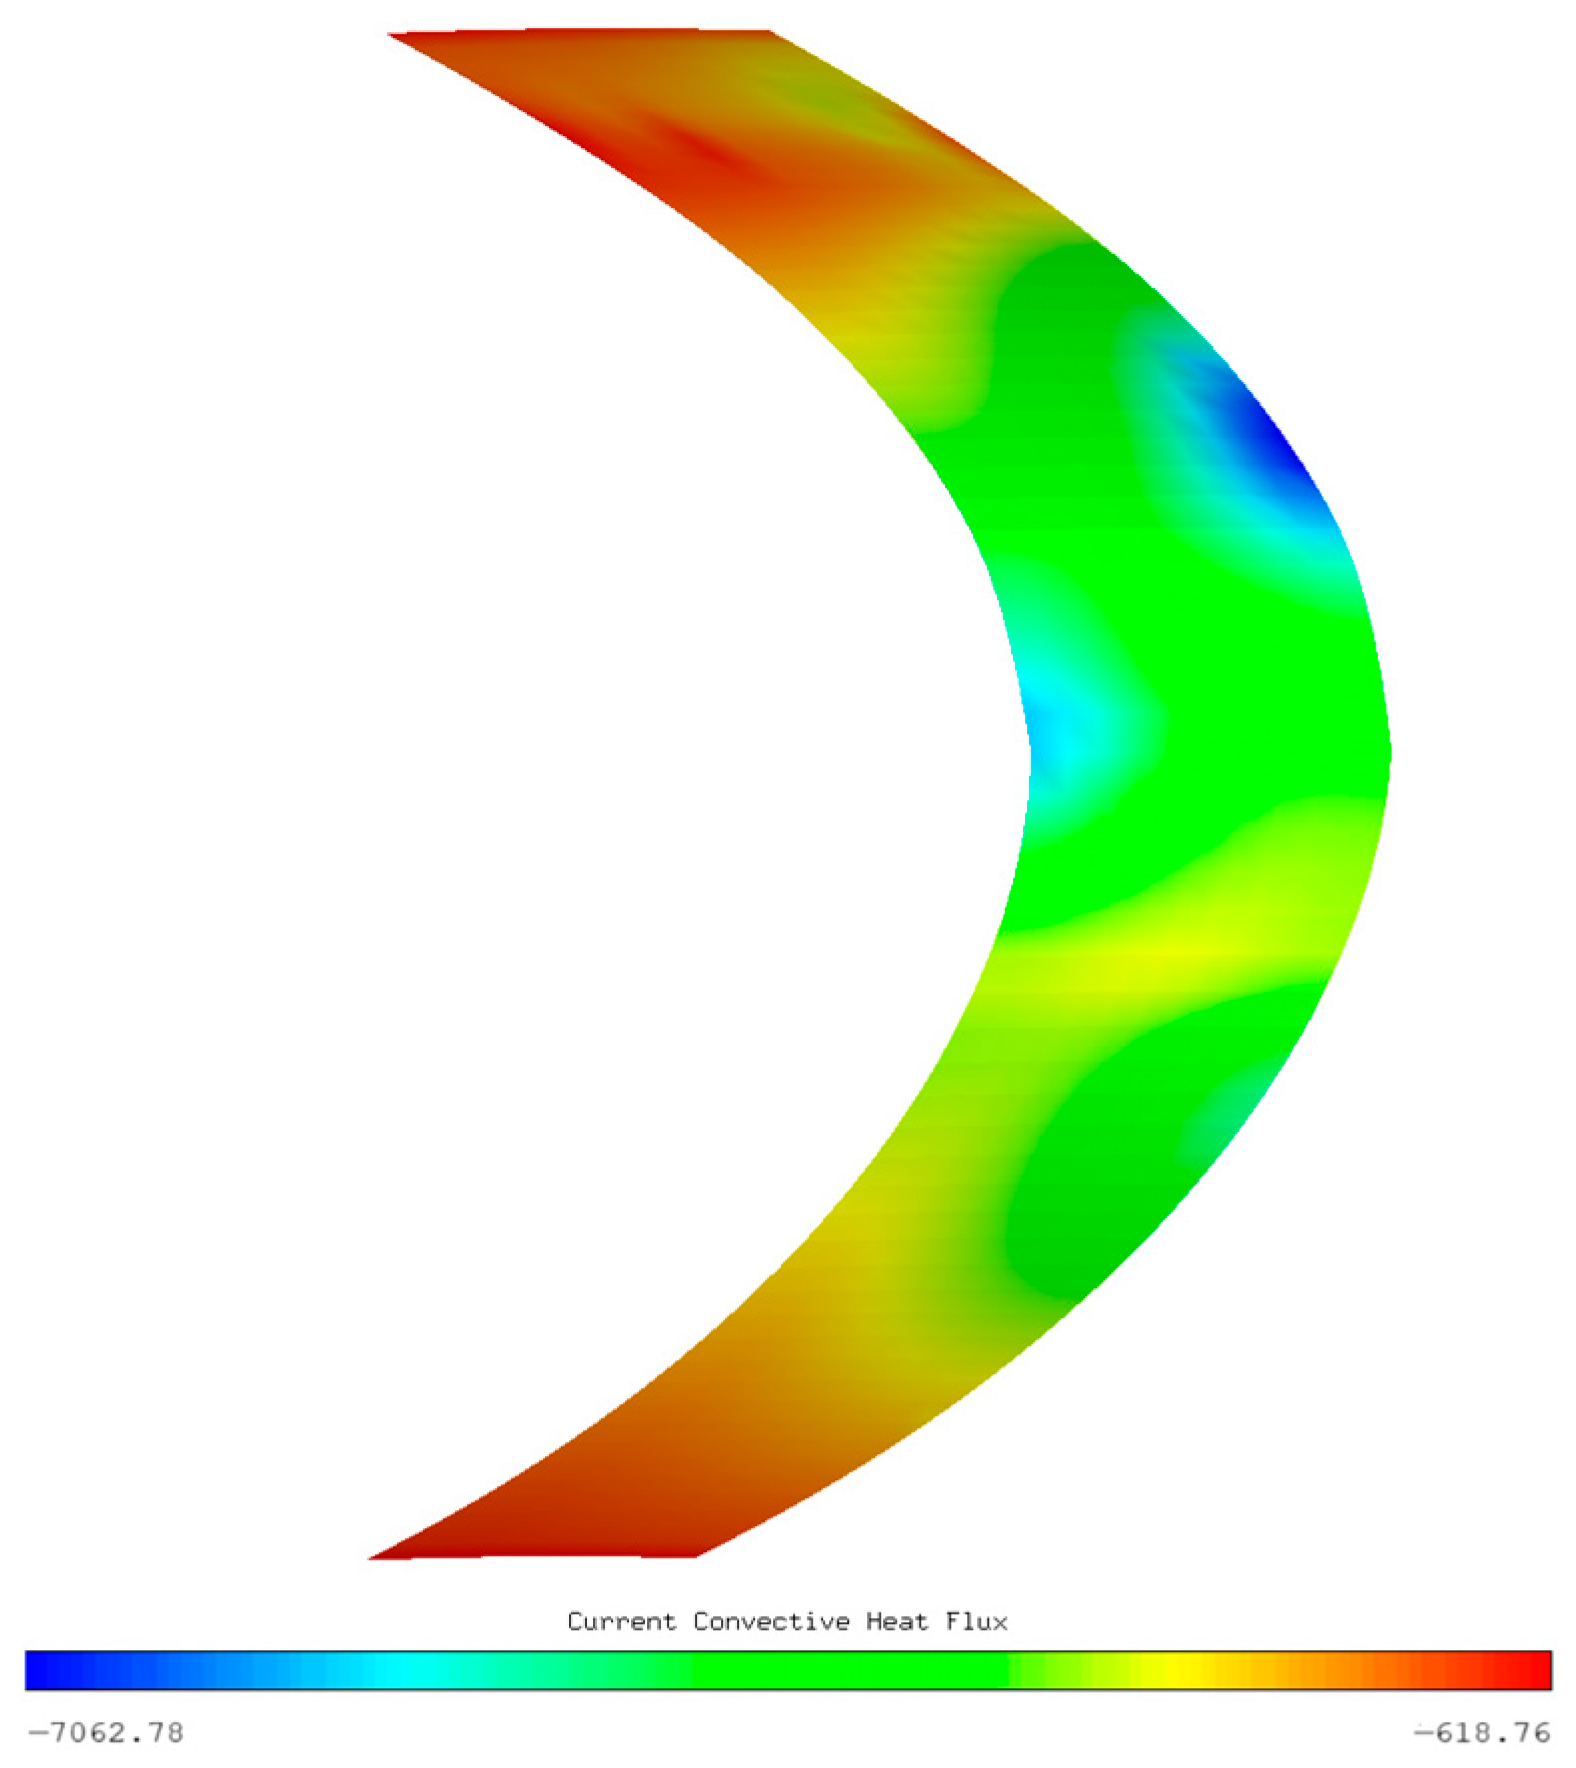
Figure 27 and
Figure 28 present the thermal profile and convective heat transfer characteristics on the protected surface. As revealed in
Figure 27, the implementation of a 383.15 K jet flow at 0.00535 kg/s mass flow rate provides effective coupled anti-icing performance under extreme icing conditions. The lip temperature maintains a minimum value of 273.69 K, which is above the ice formation threshold, ensuring complete ice protection. Additionally, the lower surface of the lip is closer to the stagnation point at large
AOA in severe icing conditions, resulting in a higher surface temperature and slightly less ice thickness compared to the upper surface. This thermal distribution manifests in localized heat transfer variations with the lower surface exhibiting 36.2% higher minimum convective flux than the upper surface, as illustrated in
Figure 28, and ensures better protection of the lower surface under the influence of bypass suction, ensuring safe engine operation under the most severe icing conditions.
6. Conclusions
For the icing problem within the given flight envelope, using Latin Hypercube Sampling (LHS) and Kriging optimization methods, the most severe flying condition with maximum ice mass can be identified.
Within the flight envelope, under severe icing conditions, the ice thickness reaches 5.4 mm and 15.2 mm outside the lip surface after 600 s and 1800 s, respectively. Near the nacelle’s inner side, the lower surface ice accretion shows thicknesses of 4.3 mm and 12.9 mm, respectively. The overall ice accretion rate on the lip surface is 7.8 g/s, posing a significant threat to engine safety.
The anti-icing structure designed in this study, with a supply air temperature of 383.15 K and a total supply air flow rate of 0.193 kg/s to the lip, maintains lip surface temperatures exceeding the ice formation threshold under operational conditions. It also creates a relatively uniform temperature field within the anti-icing cavity, achieving effective thermal protection.
The nacelle lip’s inner surface demonstrates a 36.2% elevation in minimum convective flux density relative to its outer counterpart, which effectively prevents ice ingestion and ensures safe engine operation under the most severe icing conditions.


