Article

Flight Connection Planning for Low-Cost Carriers Under Passenger Demand Uncertainty

1
Department of Aeronautics and Astronautics, The University of Tokyo, Tokyo 113-8656, Japan
2
Department of Aerospace Engineering, Department of Civil and Environmental Engineering, Department of Industrial and Operations Engineering, University of Michigan, 1320 Beal Avenue, Ann Arbor, MI 48109-2140, USA
3
Research Center for Advanced Science and Technology, The University of Tokyo, 4-6-1 Komaba, Meguro-ku, Tokyo 153-8904, Japan
*
Author to whom correspondence should be addressed.
Aerospace 2025, 12(7), 574; https://doi.org/10.3390/aerospace12070574
Submission received: 27 May 2025 / Revised: 20 June 2025 / Accepted: 20 June 2025 / Published: 24 June 2025
(This article belongs to the Special Issue Next-Generation Airport Operations and Management)

Abstract

As low-cost carriers (LCCs) continue expanding their networks and enhancing profitability through connecting services, passenger demand has become a critical factor in flight connection planning. However, demand is inherently uncertain due to economic cycles, seasonal fluctuations, and external disruptions, creating challenges for network design. This study proposes a flight connection planning model tailored to LCC operations that explicitly accounts for demand uncertainty. The model determines the optimal set of connecting itineraries to introduce over the existing network of flights, identifies promising transfer airports, and provides passenger allocation strategies across flights. We apply the model to Spring Airlines’ real-world network to evaluate its effectiveness. Results show that the proposed model outperforms the deterministic benchmark in feasibility and stability under varying demand scenarios. Specifically, under the same constraint of selecting up to 10 transfer airports, our model increases the number of connecting itineraries by 59.5% compared to the deterministic model and achieves a more balanced passenger distribution. Across 10 representative demand scenarios, the average standard deviation of load factors is reduced by 26.1% compared to the deterministic benchmark. Moreover, the deterministic solution yields a 22.9% failure rate for planned connections, while our model maintains 100% feasibility. These findings highlight the model’s value as a resilient, practical decision-support tool for airline planners.

1. Introduction

Airline network planning plays a vital role in the strategic decision making of airlines, shaping long-term competitiveness and profitability [1]. Traditionally, airline networks have followed either a point-to-point (P2P) structure used by low-cost carriers (LCC), or a hub-and-spoke (H&S) structure used by full-service carriers [2]. In recent years, however, many LCCs have begun to shift away from the pure P2P model by incorporating connection strategies into their networks [3,4]. For example, prominent LCCs such as Ryanair in Europe and Spring Airlines in Asia have explored the use of their base airports as de facto hubs by consolidating existing flight legs and offering integrated ticketing and baggage transfer solutions [5,6,7]. Figure 1 illustrates a representative example of connecting flight potential. Suppose a passenger wishes to travel from Sapporo to Okinawa, but the airline does not operate a direct flight on this route. Currently, the passenger must purchase two separate tickets and handle baggage independently during a layover at Kansai International Airport. However, if the airline offers a coordinated connection service at Kansai—without altering its existing flight schedule—it can create a new market (Sapporo–Okinawa) and attract more passengers by improving the travel experience. By combining individual flight legs into multi-leg itineraries, airlines can better accommodate diverse passenger needs and increase overall network revenue.
Numerous studies have examined the revenue-enhancing potential of adopting connecting flight strategies in LCC networks [8,9]. However, most of these contributions have focused on descriptive insights rather than providing prescriptive optimization models for decision making. A notable exception is the work by Birolini et al. [10], who developed a comprehensive modeling framework for LCCs to determine both the optimal set of flight legs to be connected and the corresponding passenger allocation proportions across each leg. Building on their valuable contribution to connection planning, our study extends the framework by explicitly incorporating passenger demand uncertainty, which is a critical factor in real-world contexts. This extension allows for more robust and reliable decision making under stochastic conditions, enhancing the practical applicability of connection planning strategies. Such uncertainty arises from factors including seasonal fluctuations, evolving passenger behavior, and unexpected external disruptions. Given that airline network planning decisions are typically long-term and difficult to reverse, ignoring demand variability may result in substantial mismatches between supply and demand, leading to significant operational costs [11]. It is, therefore, crucial to explicitly incorporate demand uncertainty into the connection planning process.
Motivated by this gap, this study seeks to bridge the gap between practical airline network planning for LCCs and the academic literature. We develop a robust optimization framework that explicitly incorporates demand uncertainty into the flight connection planning process. The proposed model aims to enhance the robustness and profitability of LCC networks by ensuring the consistent availability of connecting flights and stable revenue performance under varying demand conditions. This capability is particularly important as many carriers are transitioning from point-to-point models to hybrid network structures. The main contributions of this study are summarized as follows.
1.
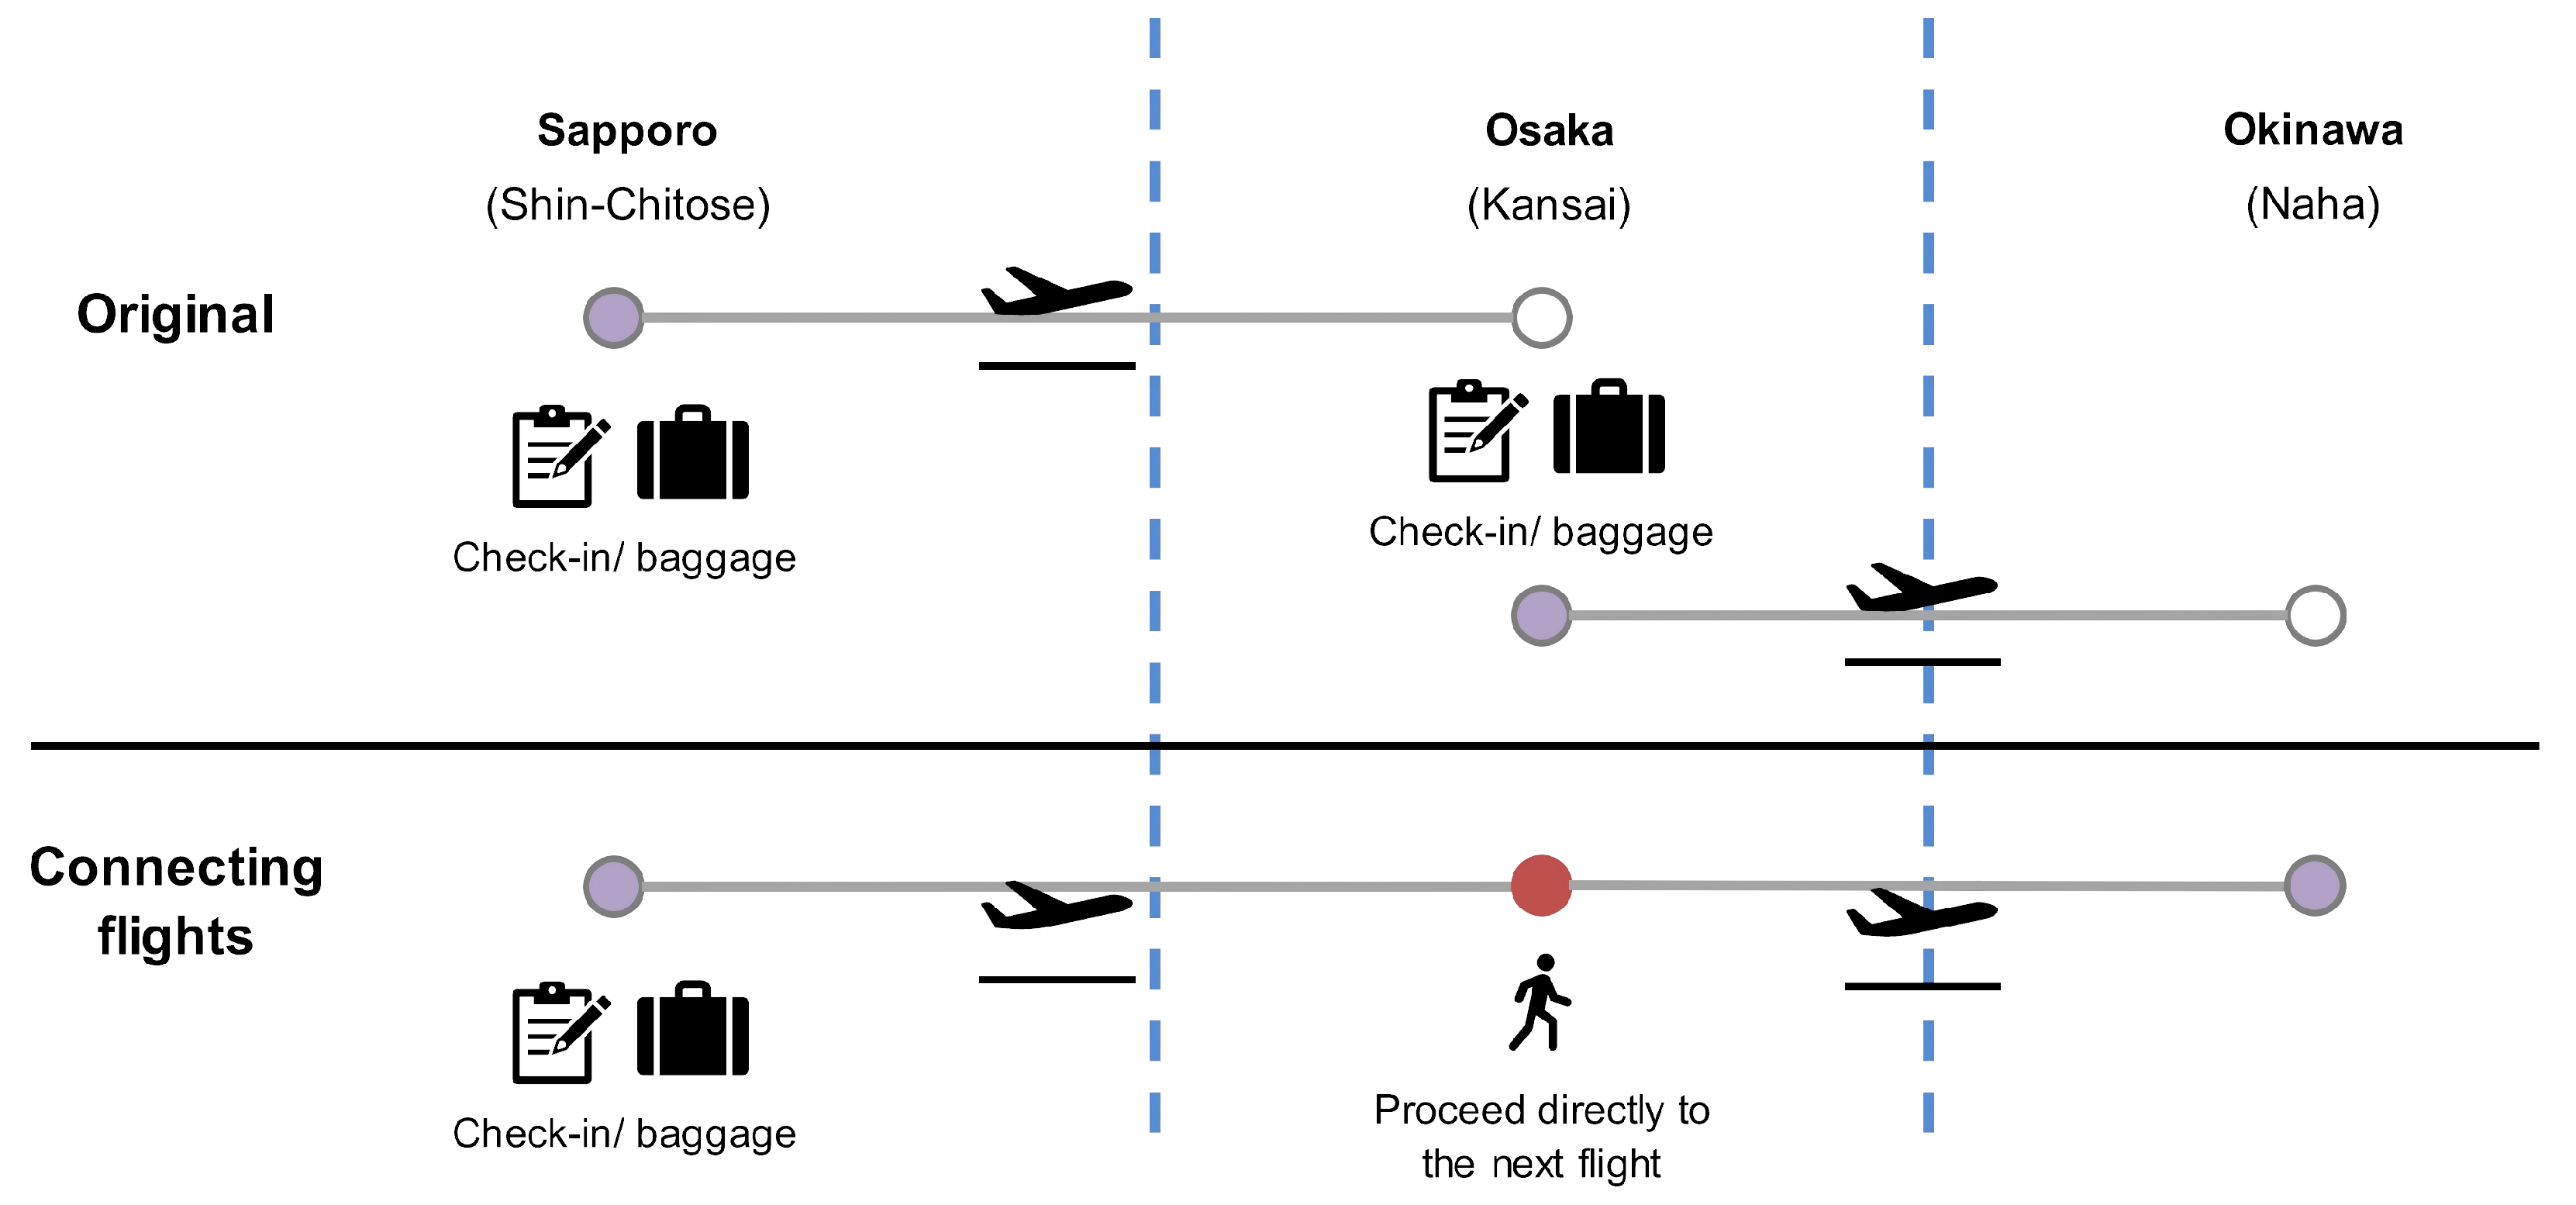
We develop an Uncertainty-Aware Integrated Connection Planning and Passenger Allocation Model (UICPPAM) for LCCs, which jointly optimizes the activation of connecting flights, transfer airports, and passenger allocation proportions guided by a discrete choice model. In this paper, the “activation of transfer airports” refers to the provision of transfer service functionality, such as through-checked baggage and seamless passenger transfer, at selected airports. Once activated, an airport is assumed to offer these services. Unlike existing studies that rely on deterministic or static demand assumptions, our model explicitly captures uncertainty across city-pair markets. It determines both the network configuration and passenger assignment within a unified framework that adapts to demand fluctuations.
2.
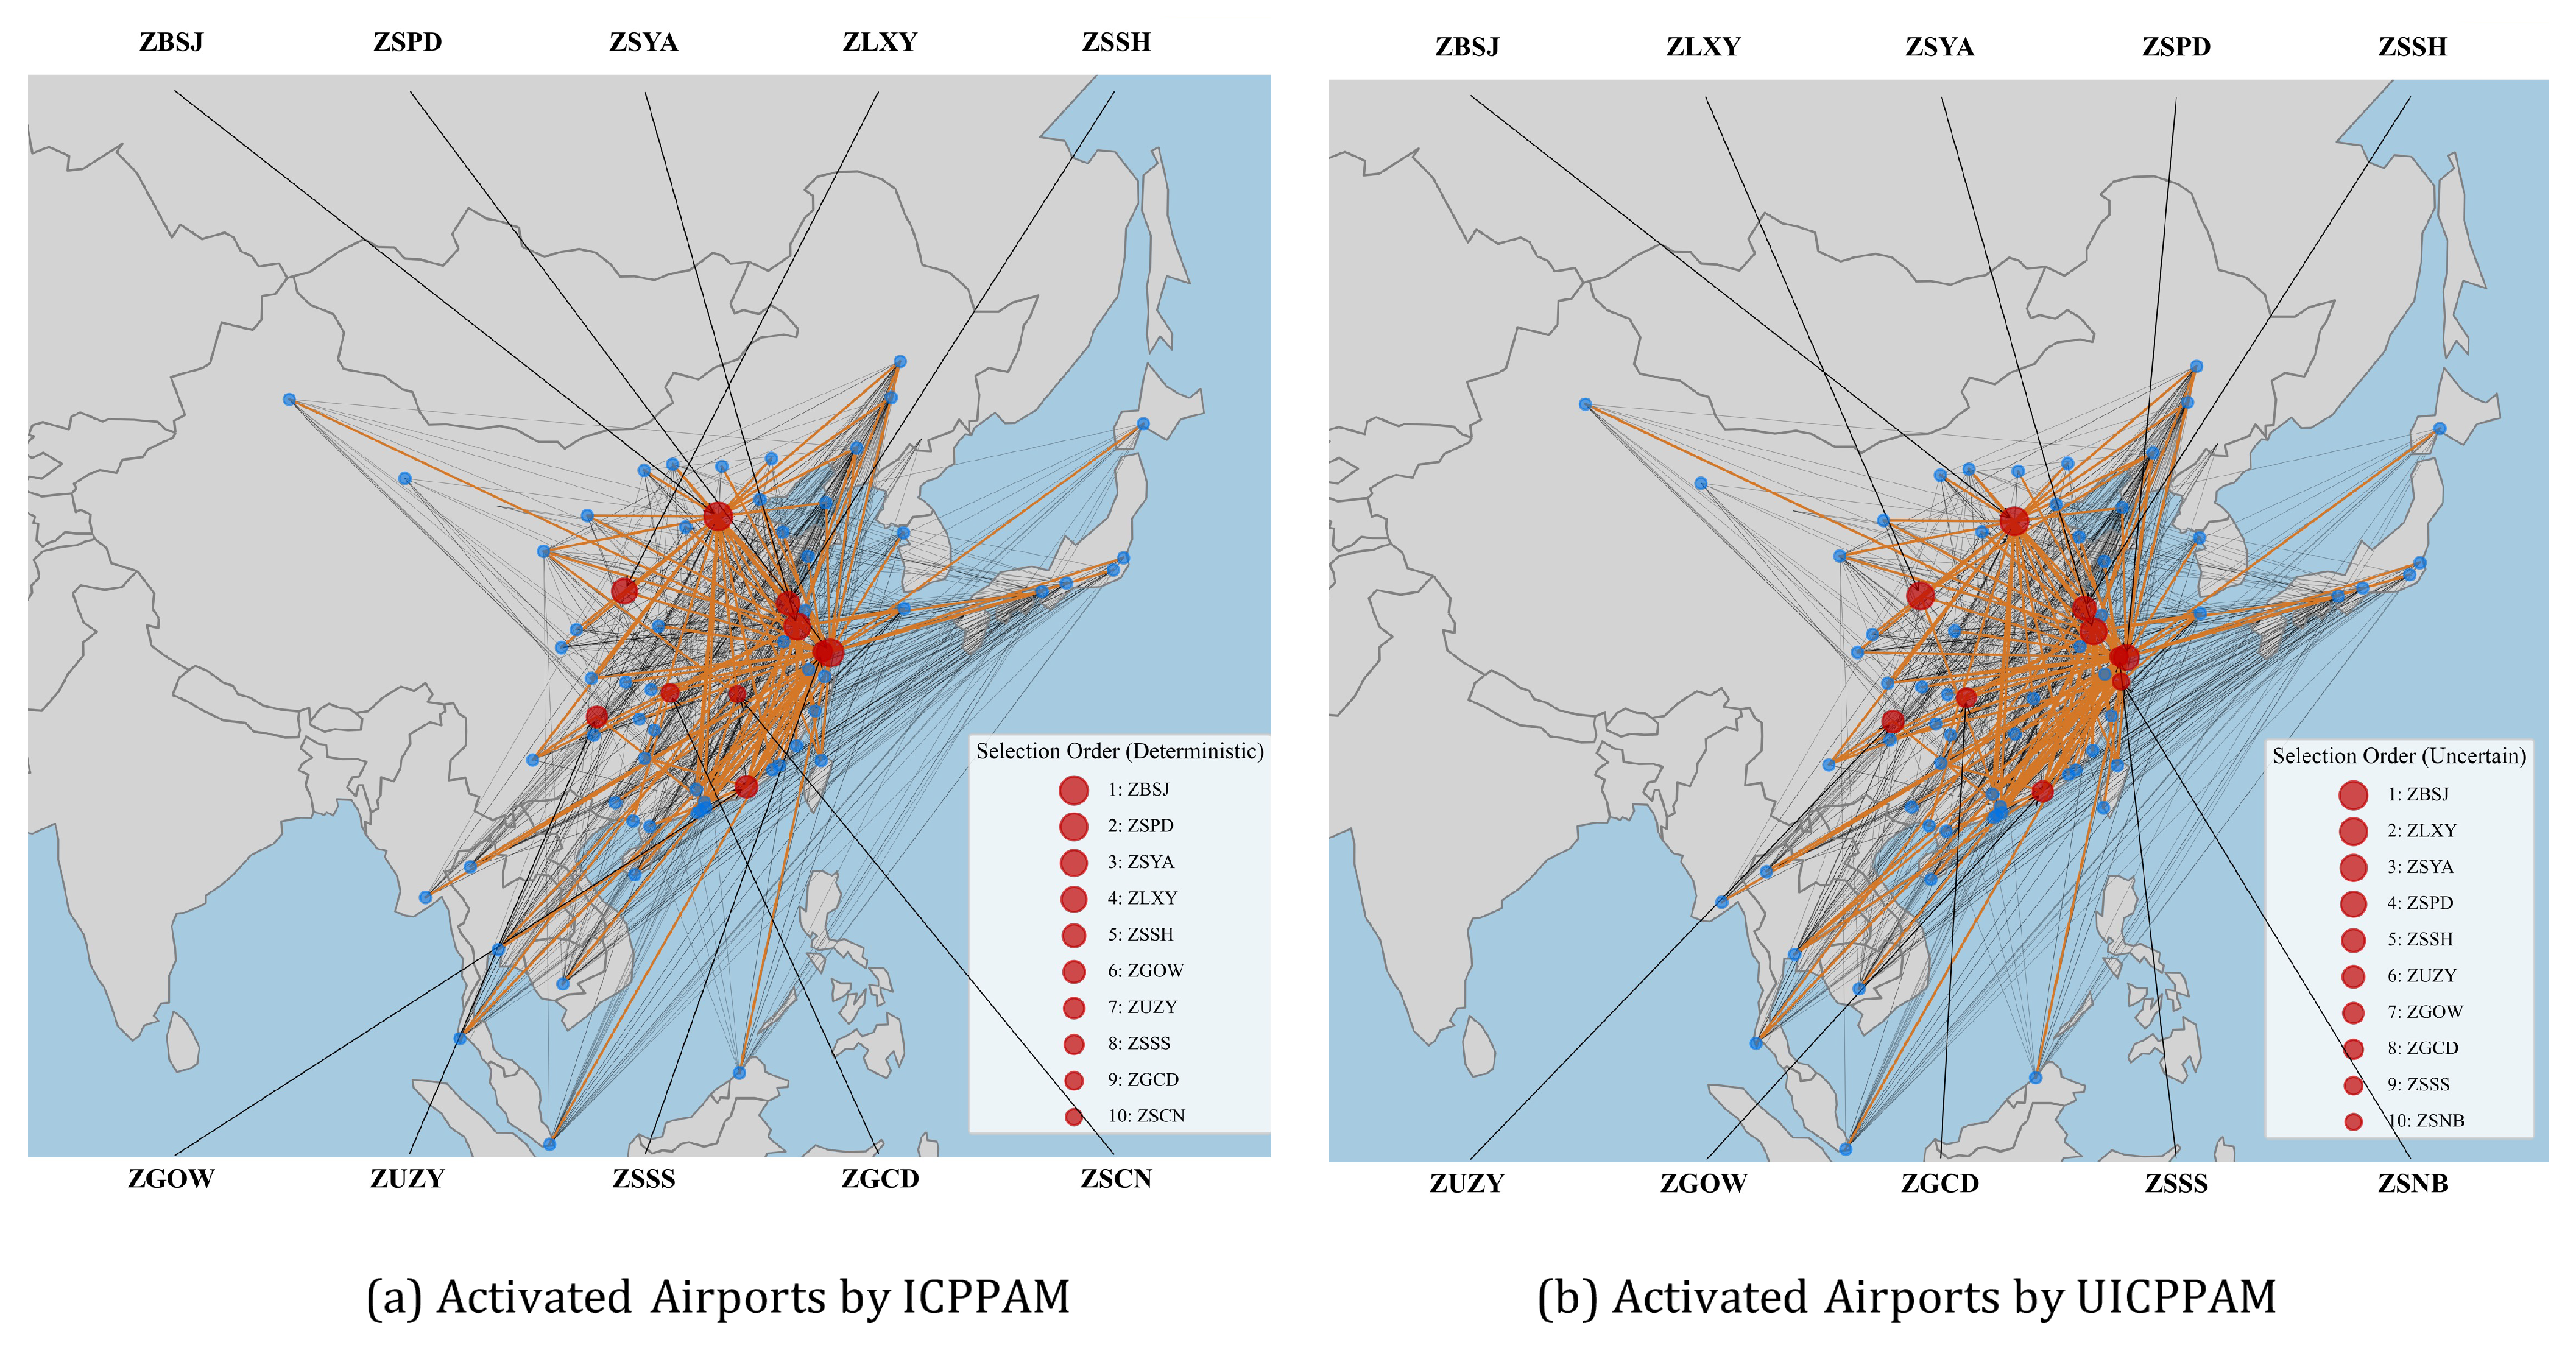
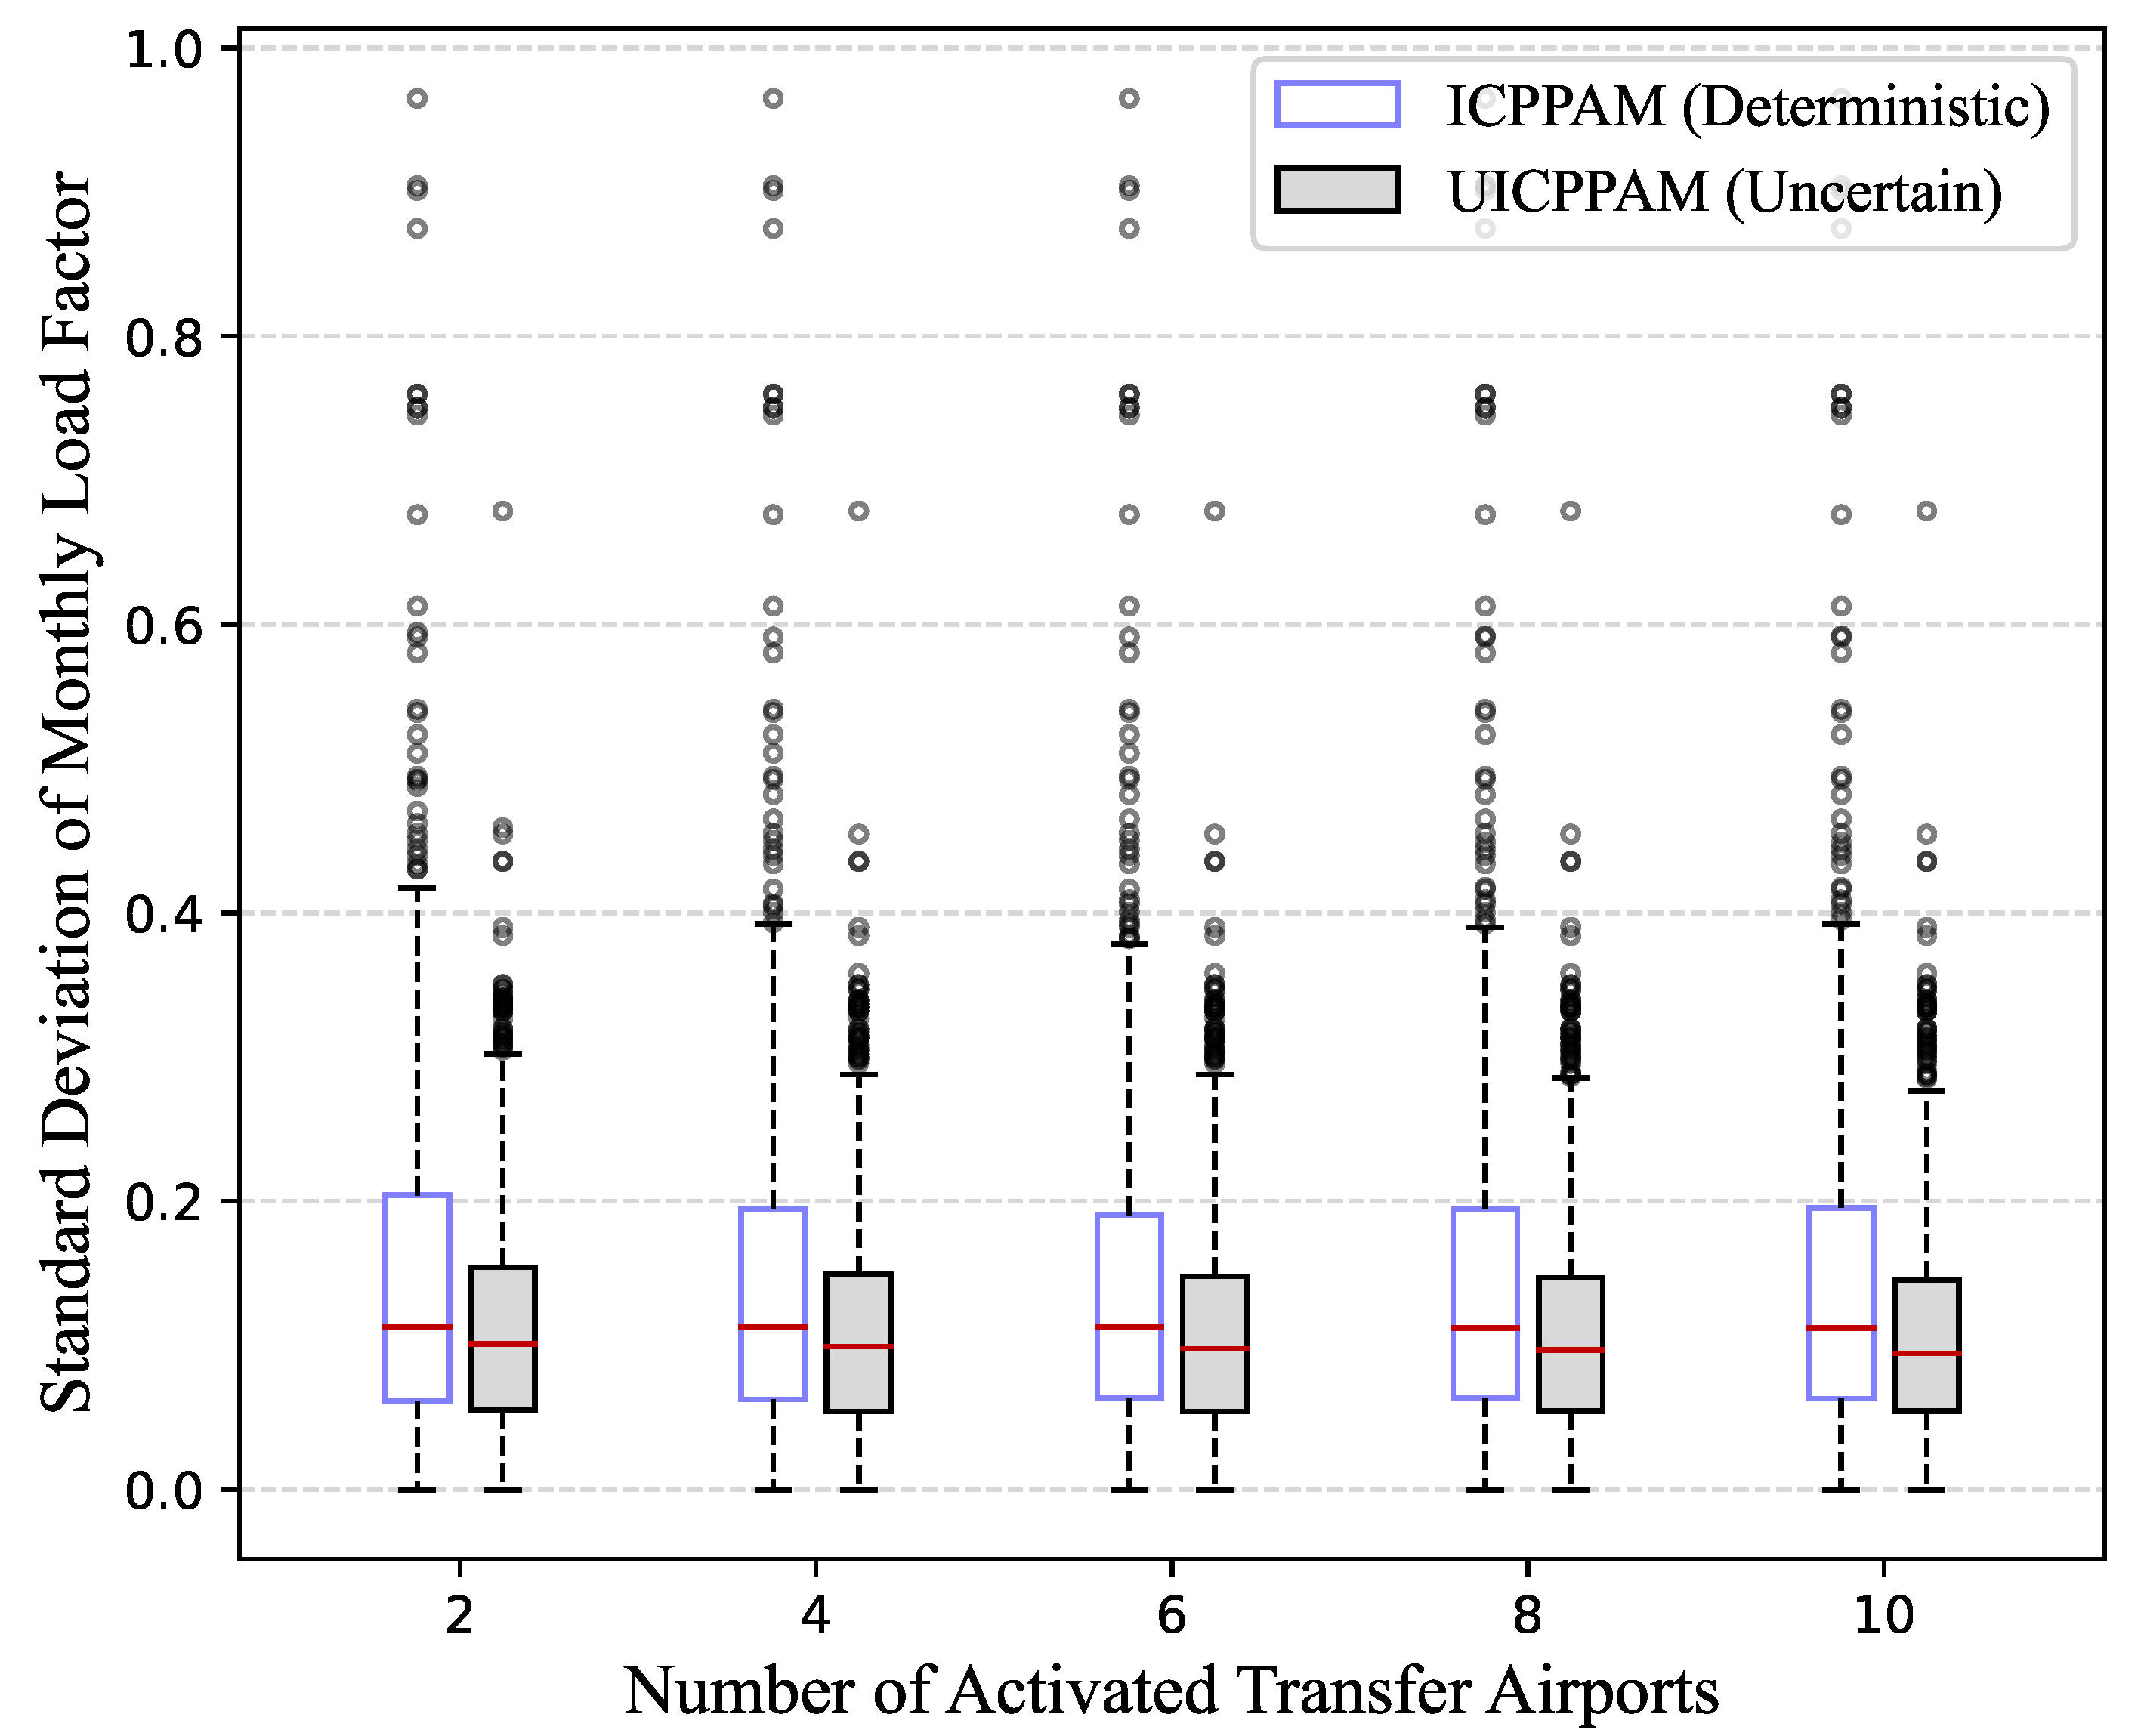
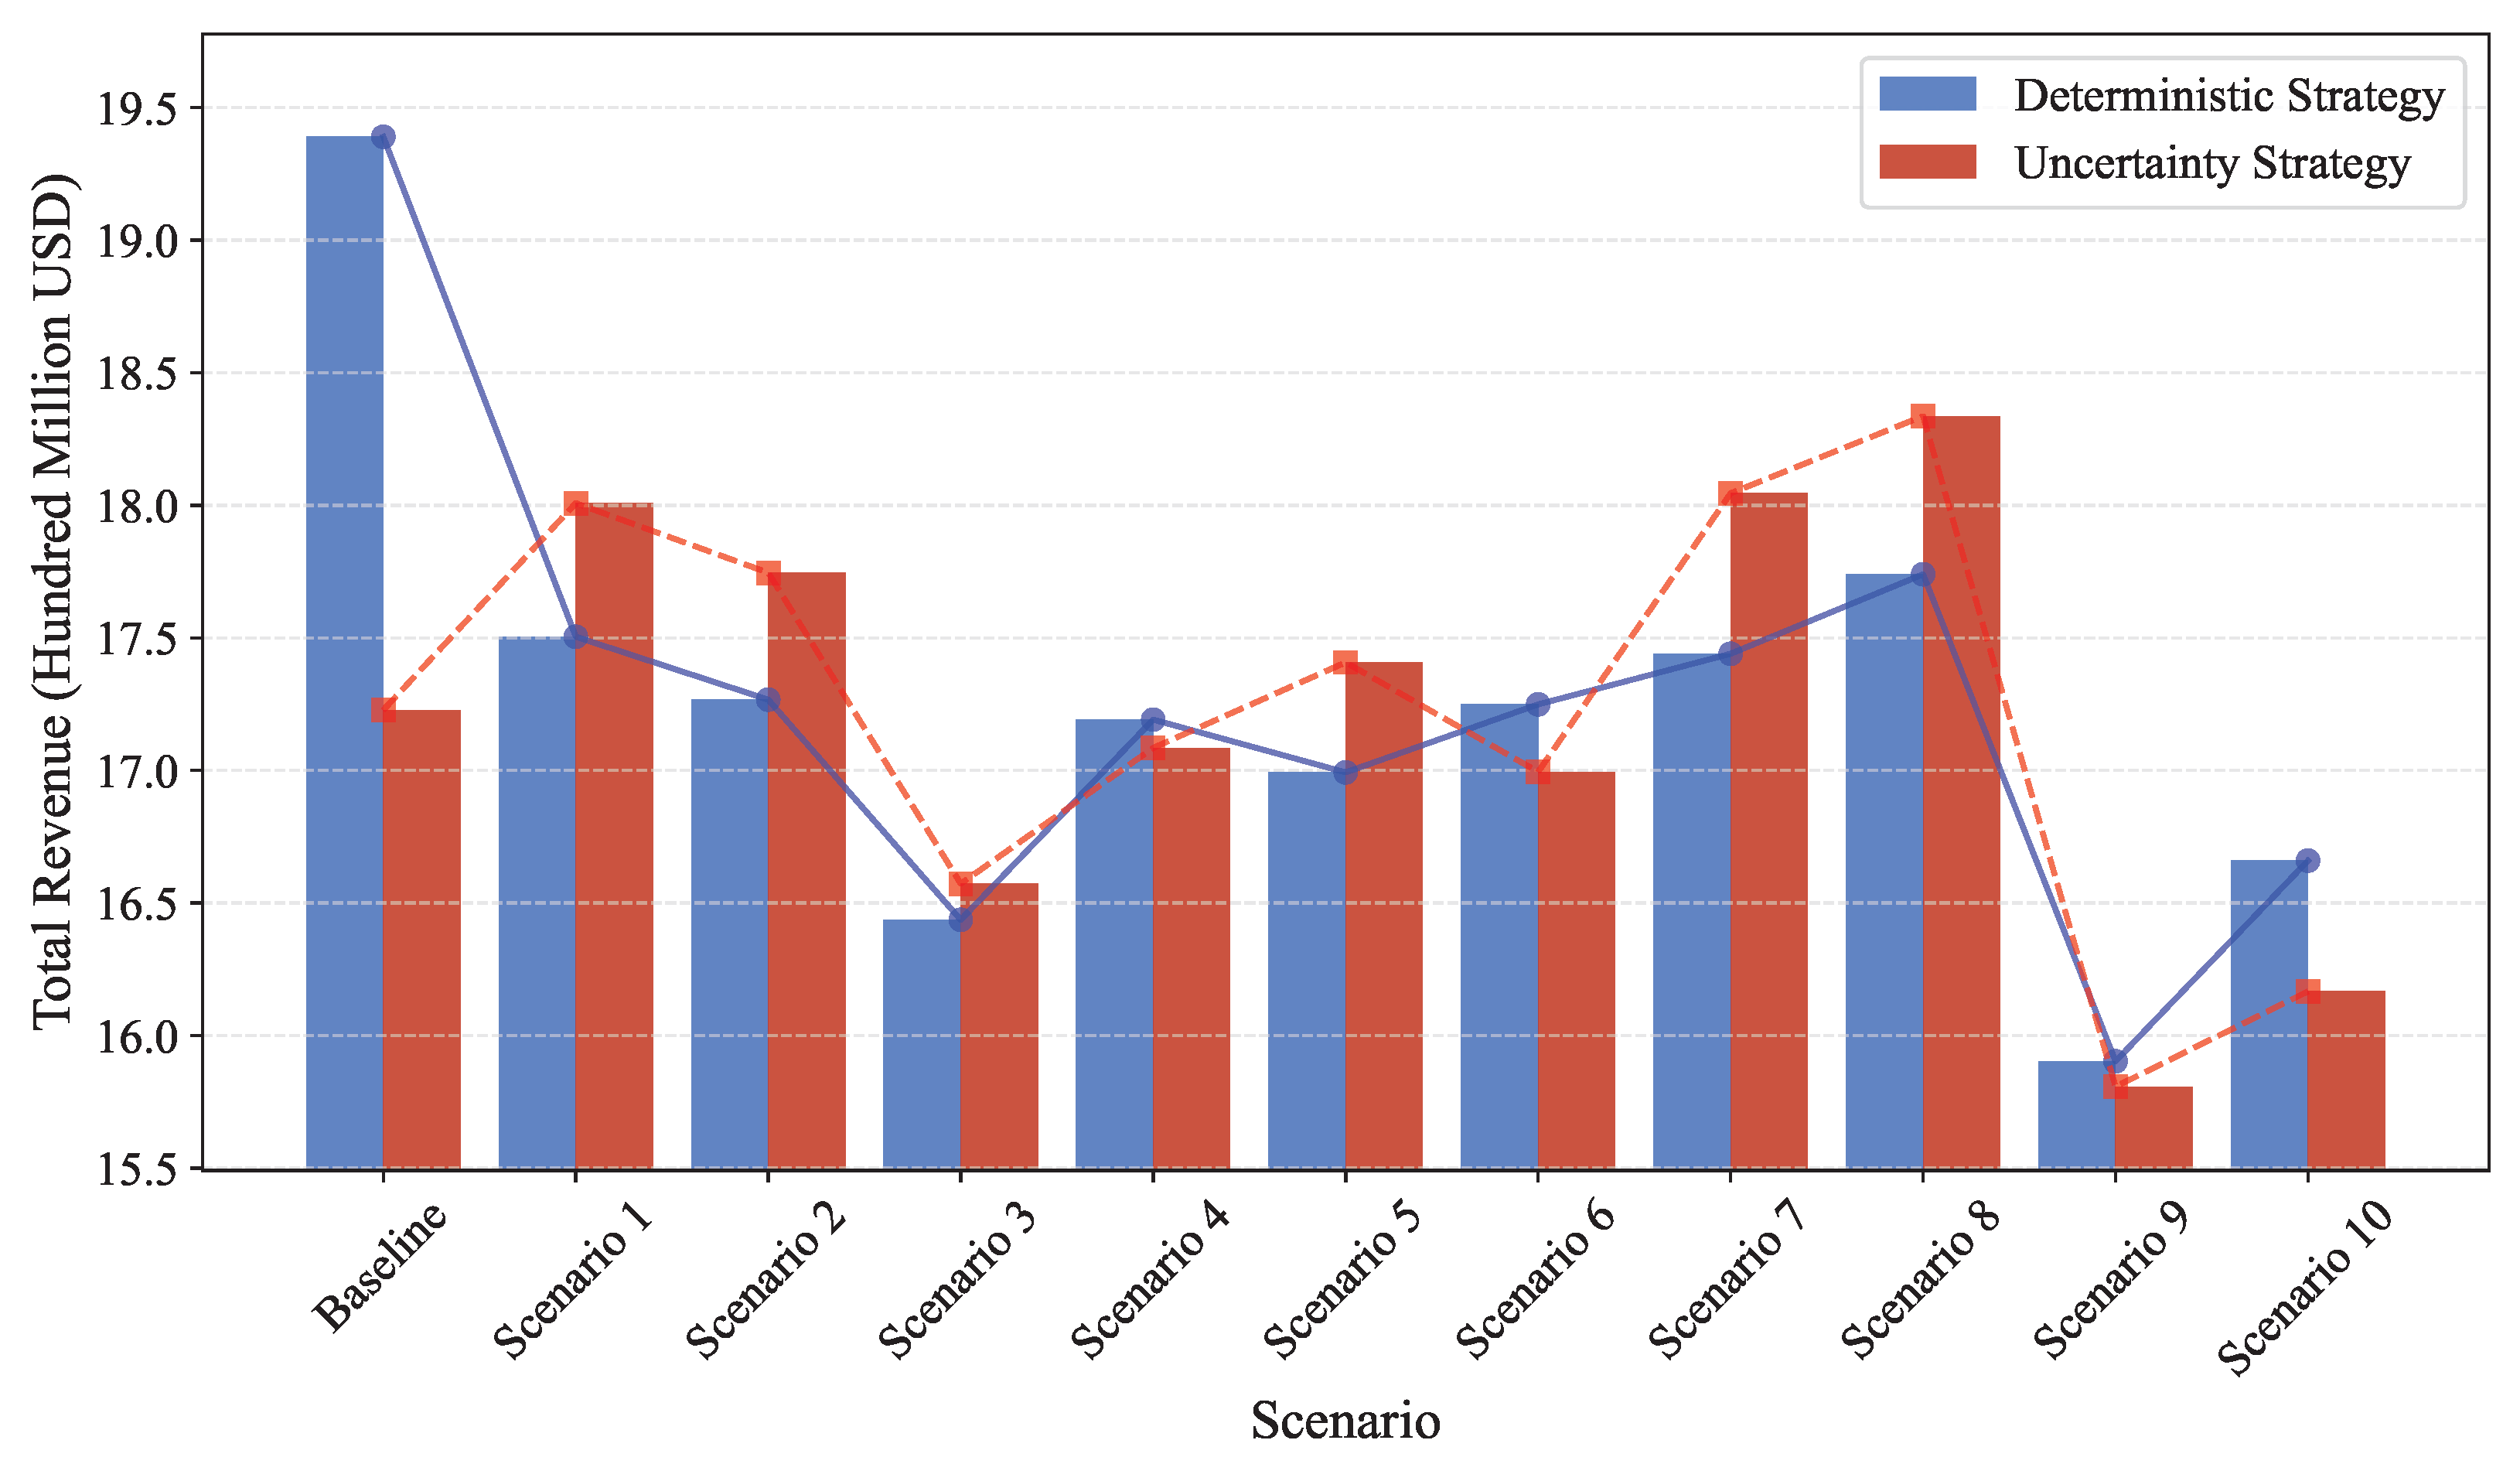
We validate the practical applicability of UICPPAM using real-world data from Spring Airlines, the largest low-cost carrier in China. Numerical experiments show that UICPPAM outperforms the deterministic benchmark (ICPPAM) under demand uncertainty, providing more robust connection strategies. Specifically, under the same setting of activating ten transfer airports, our model generates 59.5% more feasible connecting itineraries compared to ICPPAM. Furthermore, when applying the connection strategies and passenger allocation solutions produced by both models to the ten representative demand scenarios we generated, UICPPAM reduces the average standard deviation of flight load factors by 26.1% compared to ICPPAM and increases the average success rate of implementing connection strategies from 77.1% under ICPPAM to 100%.
3.
We highlight the importance of incorporating demand uncertainty into network planning and demonstrate the model’s potential to support resilient and data-driven decision making for LCCs.
The remainder of this paper is organized as follows. Section 2 provides a comprehensive review of relevant literature. In Section 3, we describe the optimization model of the proposed problem under passenger demand uncertainty. Section 4 is dedicated to solving the model. In Section 5, numerical experiments are conducted based on real-world Spring Airlines network data to demonstrate the effectiveness of the proposed model and derive managerial insights. Finally, Section 6 concludes the paper.

2. Related Literature

This work examines flight connection planning and passenger allocation under demand uncertainty in airline networks, with a focus on low-cost carriers. To better position our research, this section reviews the literature on the following three aspects: (i) airline network planning; (ii) development of LCC networks; and (iii) demand uncertainty in airline network planning.

2.1. Airline Network Planning

The design and optimization of airline networks have been widely studied due to their central role in airline operations and profitability. Early research efforts primarily focused on strategic decisions, such as determining optimal hub locations to minimize total travel cost or maximize network efficiency. The foundational work by O’Kelly [12] introduced the p-hub median problem, laying the groundwork for a rich stream of studies on hub location models. Subsequent developments expanded this framework to accommodate multiple hubs [13], stochastic demand conditions [14], and competitive environments [15]. Further refinements addressed issues like cost discounting on interhub links [16] and concave economies of scale [17], often through nonlinear or piecewise linear formulations.
Beyond network topology, the literature has also examined tactical-level problems such as flight scheduling, fleet assignment, and crew routing [18,19]. These problems are typically solved through large-scale integer programming and are often integrated with downstream decisions in operations research pipelines. Parallel advancements in revenue management introduced models to align seat inventory decisions with pricing structures, ranging from basic leg-based control [20] to network-wide bid price optimization [21]. More recent studies have moved toward integrated models that combine network design with passenger demand estimation. This stream of research acknowledges the mutual interdependence between supply-side planning and demand-side behavior. For instance, models have been proposed that embed discrete choice-based demand formulations directly into the optimization framework [22], enabling planners to better align network structure with expected passenger behavior. Such integration is particularly relevant in hub-and-spoke networks where multiple overlapping itineraries compete for passengers [23,24].

2.2. Development in LCC Networks

The archetypal LCC network strategy, pioneered effectively by Southwest Airlines in the US and later adopted by European carriers like Ryanair and EasyJet, was built upon the P2P model. This approach intentionally eschewed the complex H&S systems favored by incumbent Full-Service Network Carriers (FSNCs). As highlighted in multiple studies [25], the classic LCC P2P network focused on connecting city pairs directly, often utilizing secondary or underutilized airports to minimize costs and avoid head-to-head competition at major hubs [26]. This strategy facilitated high aircraft utilization, simplified operations, and catered primarily to price-sensitive leisure travelers and origin-destination (O&D) traffic. The initial success of this model was profound, demonstrating that a viable alternative to the established hub-and-spoke paradigm existed, particularly on short-to-medium haul routes. Research indicates this P2P focus was often coupled with high frequencies on dense routes and a geographically opportunistic expansion pattern [27].
Over time, the strictly P2P focus of the original LCC model has diminished, as many LCCs have begun to adopt connecting services and hybrid network strategies. This shift has been largely driven by market maturation, intensifying competition (often from other LCCs), and the inherent “growth limits of the LCC model” [28]. Many LCCs began adapting their network strategies. Literature points to a significant trend towards hybridization, where LCCs incorporate elements traditionally associated with FSNCs. This includes offering connecting flights, either self-connecting or through partnerships, and introducing fare bundles that move away from a purely unbundled pricing structure [29]. This evolution is evident in network structures. While P2P remains foundational, some LCCs have developed significant operational bases that function similarly to hubs, concentrating flights and facilitating transfers—a phenomenon described as “low-cost hubbing”. Examples like Spring Airlines in China demonstrate the development of “advanced networks supported by its core bases” [30]. Concurrently, network planning became increasingly data-driven, using optimization models [31] and complex network theory to support strategic adaptability [32].
In summary, contemporary network design for LCCs is no longer constrained by a single fixed paradigm. Instead, it increasingly emphasizes adaptability, efficiency, and resilience to cope with growing market competition and recurring external disruptions [33,34]. Against this backdrop, LCCs face mounting challenges in designing network structures that can accommodate demand fluctuations, competitive dynamics, and operational uncertainties—posing new methodological demands on network planning models.

2.3. Demand Uncertainty in Airline Network Planning

Passenger demand uncertainty is a fundamental challenge in airline network planning, significantly impacting decisions from strategic network design to tactical scheduling and operational management. Research highlights the inherent volatility and unpredictability in estimating passenger flows, necessitating sophisticated modeling approaches beyond deterministic assumptions. This uncertainty is often characterized as stochastic demand, demand volatility, or randomness in origin-destination flows, sometimes compounded by competitive market dynamics [35] or unforeseen disruptions [36].
To address this challenge, two dominant methodologies have emerged: stochastic programming and robust optimization. Stochastic programming, particularly two-stage models, is widely used to formulate network design problems where initial decisions are made before demand is fully known, followed by recourse actions [37]. These models explicitly incorporate probabilistic demand scenarios. Robust optimization, conversely, focuses on developing solutions that perform well even under worst-case demand scenarios within defined uncertainty sets [38,39]. This approach emphasizes resilience and avoids catastrophic failures under adverse conditions, often crucial for strategic decisions. Emerging techniques like reinforcement learning are also being explored for adaptive fleet and network planning under uncertainty [40].
Regardless of the method, the goal is to move beyond simple point estimates of demand and create network plans that are economically viable, operationally feasible, and resilient to the inherent unpredictability of passenger behavior. Building on the insights from the existing literature, this study employs a stochastic programming framework to explicitly capture city-pair demand uncertainty and derive a robust connection planning strategy that ensures feasibility and performance across all evaluated scenarios.

3. Problem Statement and Model Formulation

In this section, we provide a detailed description of the problem setting, focusing on the airline network structure, the endogenous treatment of travel demand, and the main decision variables. These elements collectively form the foundation of the mathematical model introduced in Section 3.2.

3.1. Problem Description

This study addresses the problem of introducing connecting flights within an existing LCC network and optimizing passenger allocation to maximize airline profits under demand uncertainty.
Consider a P2P network operated by an LCC, where all flights ( f F ) with fixed seat capacities ( k f K ) are scheduled as nonstop services between origin and destination airports. We aim to improve airline profits by developing new O&D markets through the connection of nonstop flights and reallocating passengers across itineraries without altering the existing flight schedule. Specifically, this is achieved by (i) selecting which nonstop itineraries ( i n s I n s ) to connect into new one-stop itineraries ( i c t I c t ); (ii) identifying airports ( h H ) to activate as transfer hubs offering services such as baggage-through check; and (iii) optimizing passenger allocation across itineraries. We determine the proportion x i of market demand d m assigned to each itinerary i to maximize total network profits. However, due to factors such as seasonality, holidays, and unexpected disruptions, demand is inherently uncertain. Consequently, a key requirement of this work is to appropriately handle demand uncertainty within the flight connection planning framework. To this end, we propose the Uncertainty-Aware Integrated Connection Planning and Passenger Allocation Model (UICPPAM), which can generate robust connection strategies that remain effective under a wide range of demand fluctuations. Without loss of generality, we adopt several assumptions and modeling rules proposed by Birolini et al. [10].
  • Generation of feasible connections. First, we also construct potential connecting itineraries through a preprocessing procedure that ensures temporal and spatial feasibility, as well as other operational constraints (see Section 5.2 for details).
  • Cost and modeling assumptions. Second, since the primary focus of this study is on generating robust connection and passenger allocation strategies under demand uncertainty, we adopt several similar cost-related assumptions and modeling rules, which are not the main subject of investigation in this work. Specifically, we assume that the existing flight schedule and capacity allocations remain unchanged and that the operational costs associated with current services are fixed and therefore excluded from the objective function. On the revenue side, the fare ( p i ) is defined as the average ticket price associated with itinerary i. Regarding the costs associated with providing connecting services, we define two components: c h f i x , representing the fixed cost of activating transfer airport h, and c h v a r , representing the variable cost incurred per passenger for enabling seamless transfer services on the itinerary i.
  • Endogenous demand modeling. Third, we model passenger demand as endogenous, allowing newly introduced connecting itineraries to compete with existing options by adopting a multinomial logit formulation (MNL) that captures how passengers choose among available itineraries [41]. This formulation estimates the probability of passengers selecting a specific itinerary based on the utility value V i (see Section 5.2 for details) they derive from it, thereby enabling the model to realistically account for demand redistribution within a given O&D market. Specifically, let M be the set of city-pair markets and I m I be the set of itineraries offered by the airline in market m. Each itinerary i I m is associated with a utility value V i , and its attractiveness is defined as: θ i = exp ( V i ) . To capture the effect of external alternatives (e.g., itineraries offered by competitors), we define an aggregate attractiveness term: θ m c m = j I m c m exp ( V j ) , where I m c m denotes the set of itineraries in the market m not offered by the target airline. Given this setup, the market share of itinerary i is computed as:
    x i = θ i · y i j I m θ j · y j + θ m c m
    where y i { 0 , 1 } is a binary variable that indicates whether the airline chooses to offer itinerary i. Then, the number of passengers assigned to itinerary i is d m · x i . This approach allows the model to account for both external and internal competition. External competition arises when other carriers serve the same market, while internal (or self) competition occurs when multiple feasible connecting itineraries from the same airline compete for the same O&D market.
Based on the above modeling assumptions and settings, the UICPPAM determines passenger flows on each itinerary—captured by the variables x i and x m c m —and jointly decides which connecting itineraries and transfer airports using the binary variables y i and w h , respectively.

3.2. Model Formulation

The problem described in Section 3.1 can be formulated as a mixed-integer linear programming (MILP) model. All notations involved in the model are detailed in Table 1. In the following, we present the formulation of UICPPAM.
In UICPPAM, E [ ] is the expected value of an airline’s revenue. Since passenger demand is no longer fixed but varies across different scenarios, UICPPAM aims to maximize the expected profit of the airline over all possible demand realizations as given by Equation (2a). The capacity constraints (2b) ensures that the total number of passengers on each flight leg, calculated as the sum of passengers across all itineraries using that leg, does not exceed its seating capacity. Constraints (2c) establish a proportional relationship between the market share of each itinerary and its utility value relative to the compound outside option. To maintain linearity, the binary variables y i are excluded from these constraints, with the condition that x i equals 0 when itinerary i is not operated being enforced through the big-M constraints (2d). Given that x m c m is bounded between 0 and 1, the big-M parameters M i m are defined as the ratio θ i / θ m c m , ensuring a tight and efficient formulation. Constraints (2e) ensure that the total market share across all available itineraries serving each market sums to 1, reflecting full demand allocation. Constraints (2f) establish the relationship between variables y i and w h , ensuring that connecting itineraries are operated only when the corresponding transfer airport is activated. Ultimately, the domains of the variables are defined by Equations (2g)–(2j).
max x , w E m M i I m d m ˜ x i p i m M i I c t o p I m d m ˜ x i c i v a r h H c h f i x w h
s . t . m M i I f I m d m ˜ x i k f , f F
x i θ i θ m c m x m c m , i I m , m M
x i M i m y i , i I m I c t o p , m M
i I m x i + x m c m = 1 , m M
y i w h , i I h I c t o p , h H
y i 0 , 1 , i I c t o p
w h 0 , 1 , h H
x i R + , i I
x m c m R + , m M
It is worth noting that the proposed model considers multiple demand scenarios to capture uncertainty. The construction of these scenarios, as well as the solution approach adopted to address them, will be described in detail in Section 4. When the demand d m is assumed to be deterministic, objective (2a) simplifies to a fixed form Z = max m M i I m d m x i p i m M i I c t o p I m d m x i c i v a r h H c h f i x w h , and the entire model degenerates into the ICPPAM introduced in [10].

4. Solution Approach

To make the UICPPAM model computationally tractable while effectively capturing the uncertainty in passenger demand, we adopt the Sample Average Approximation (SAA) [42] approach based on historical demand data. However, as the number of samples increases, the computational burden of solving the resulting optimization model rises significantly. To balance model tractability and scenario fidelity, we introduce a scenario generation procedure in Section 4.1, which first constructs candidate scenarios by discretizing historical demand using market-wise quantile binning and then identifies a reduced yet representative subset through frequency analysis and supplemental clustering. Section 4.2 provides a brief description of the model implementation and computational setup.

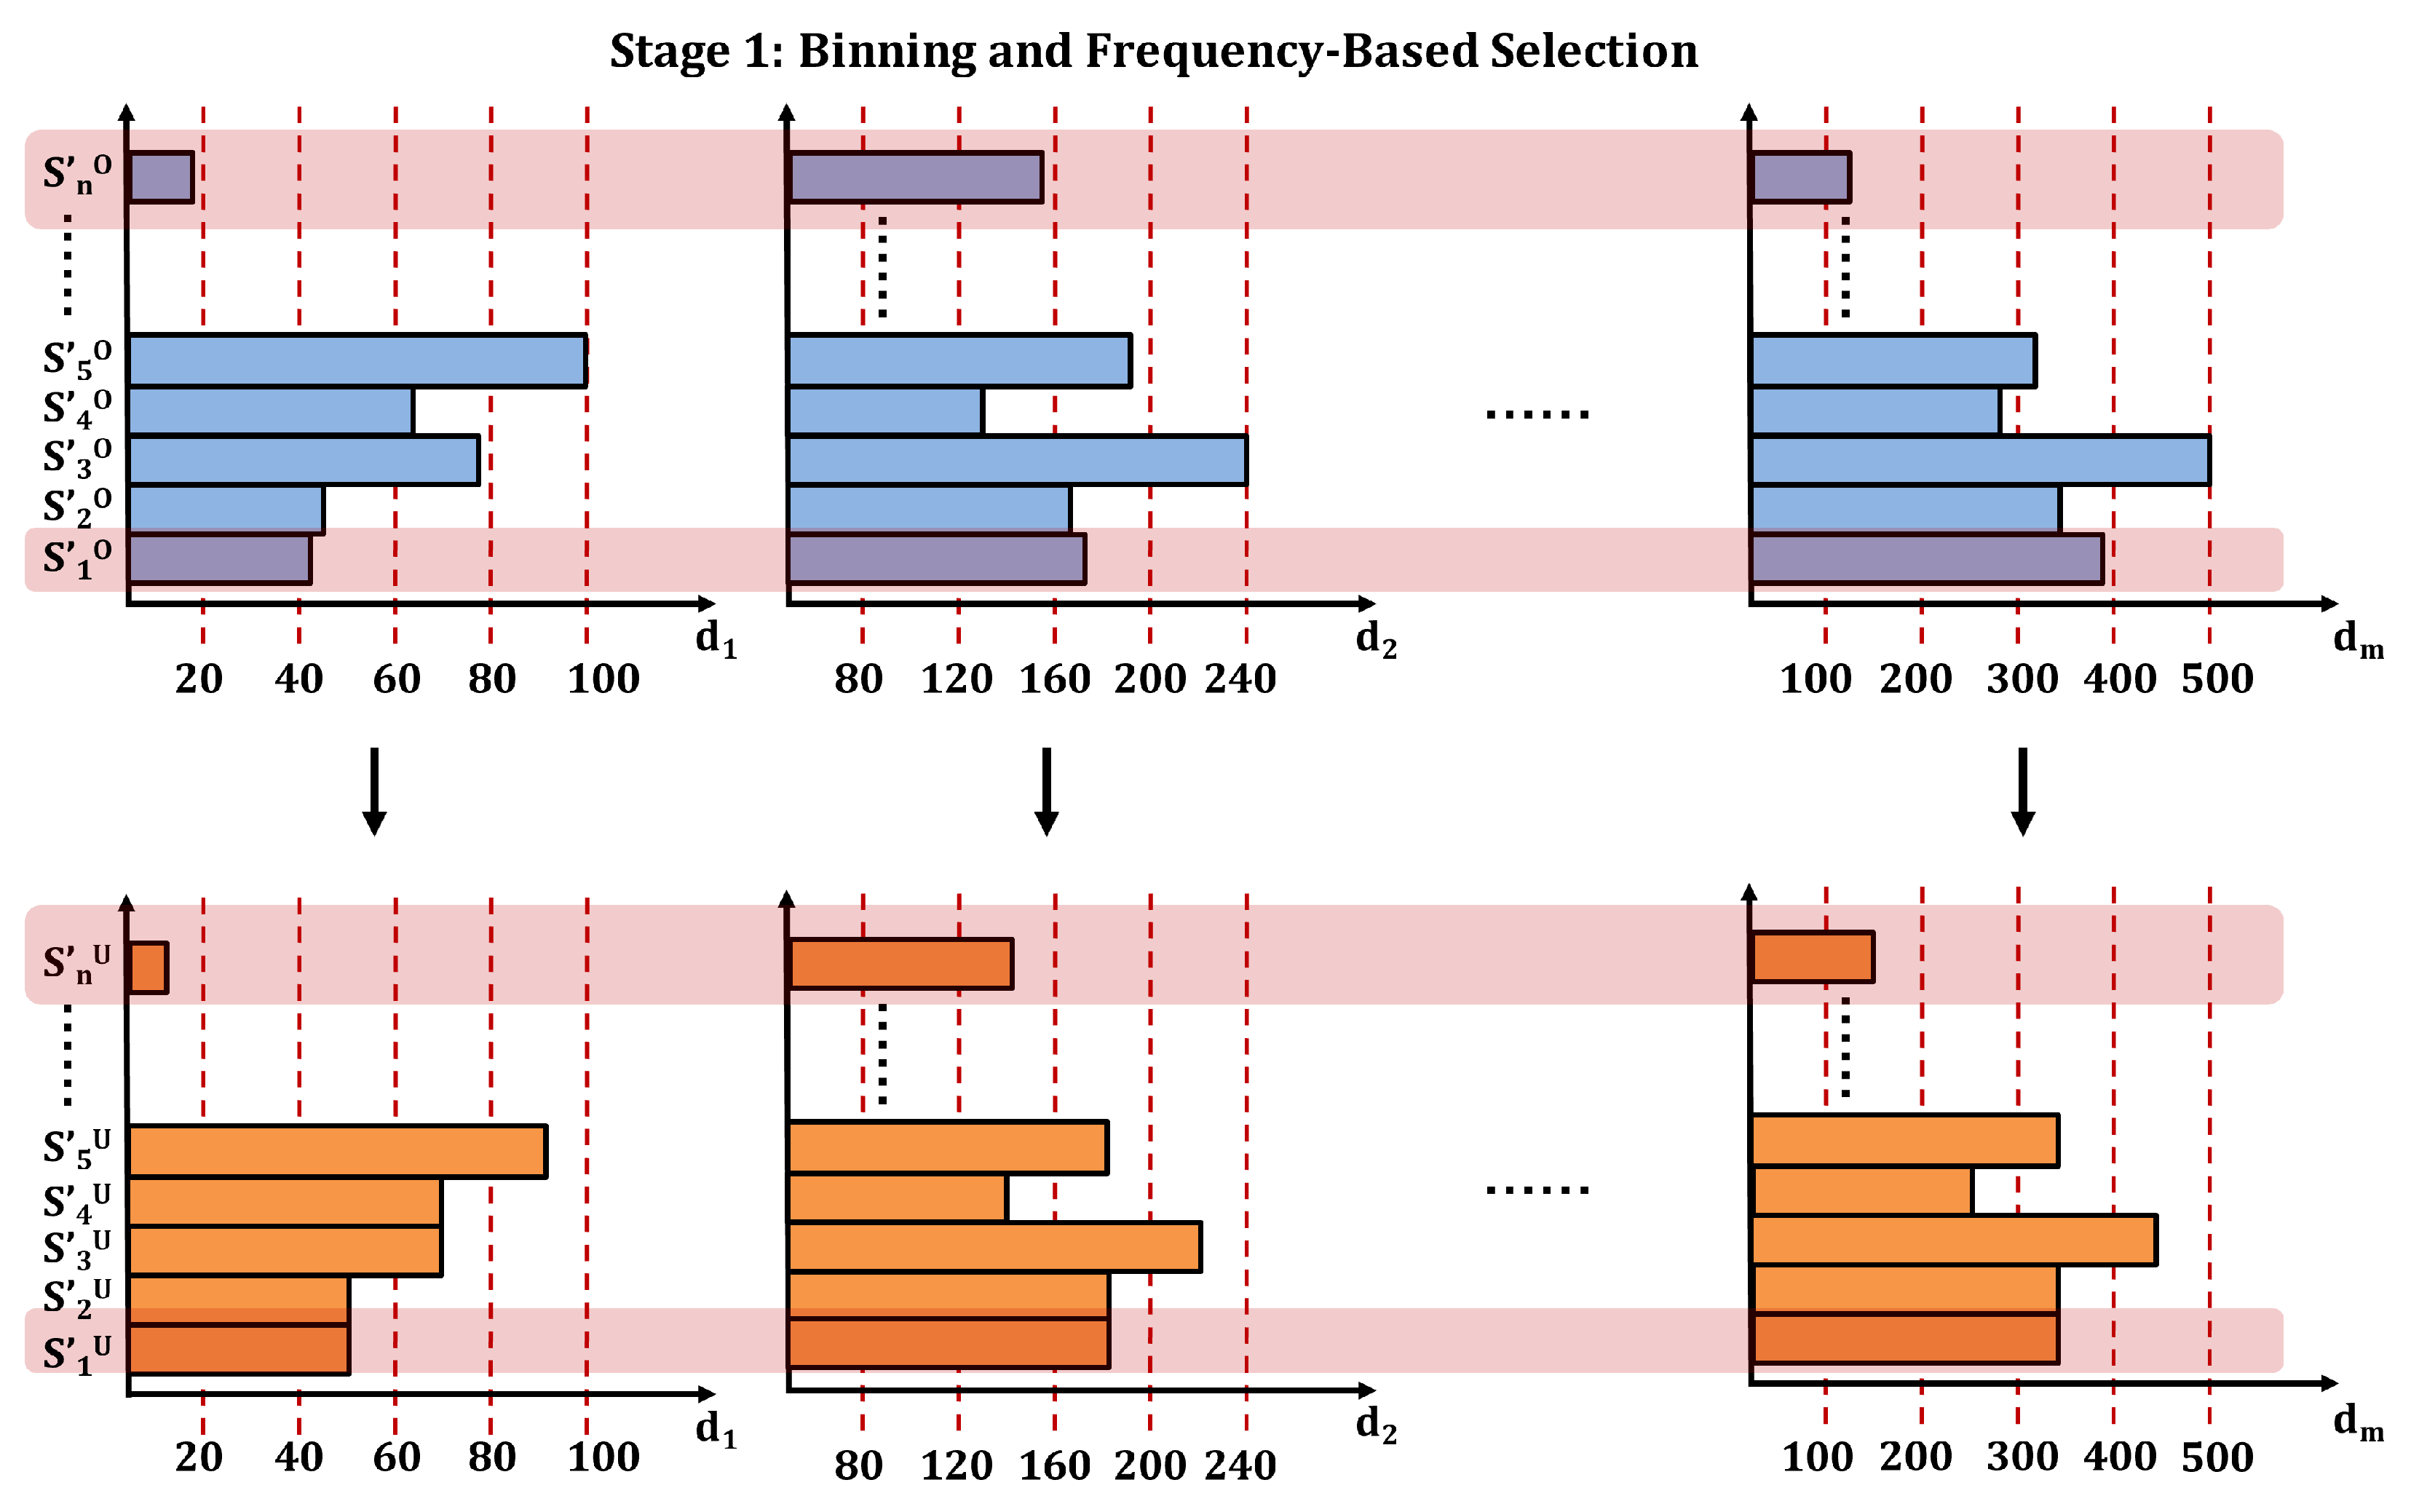
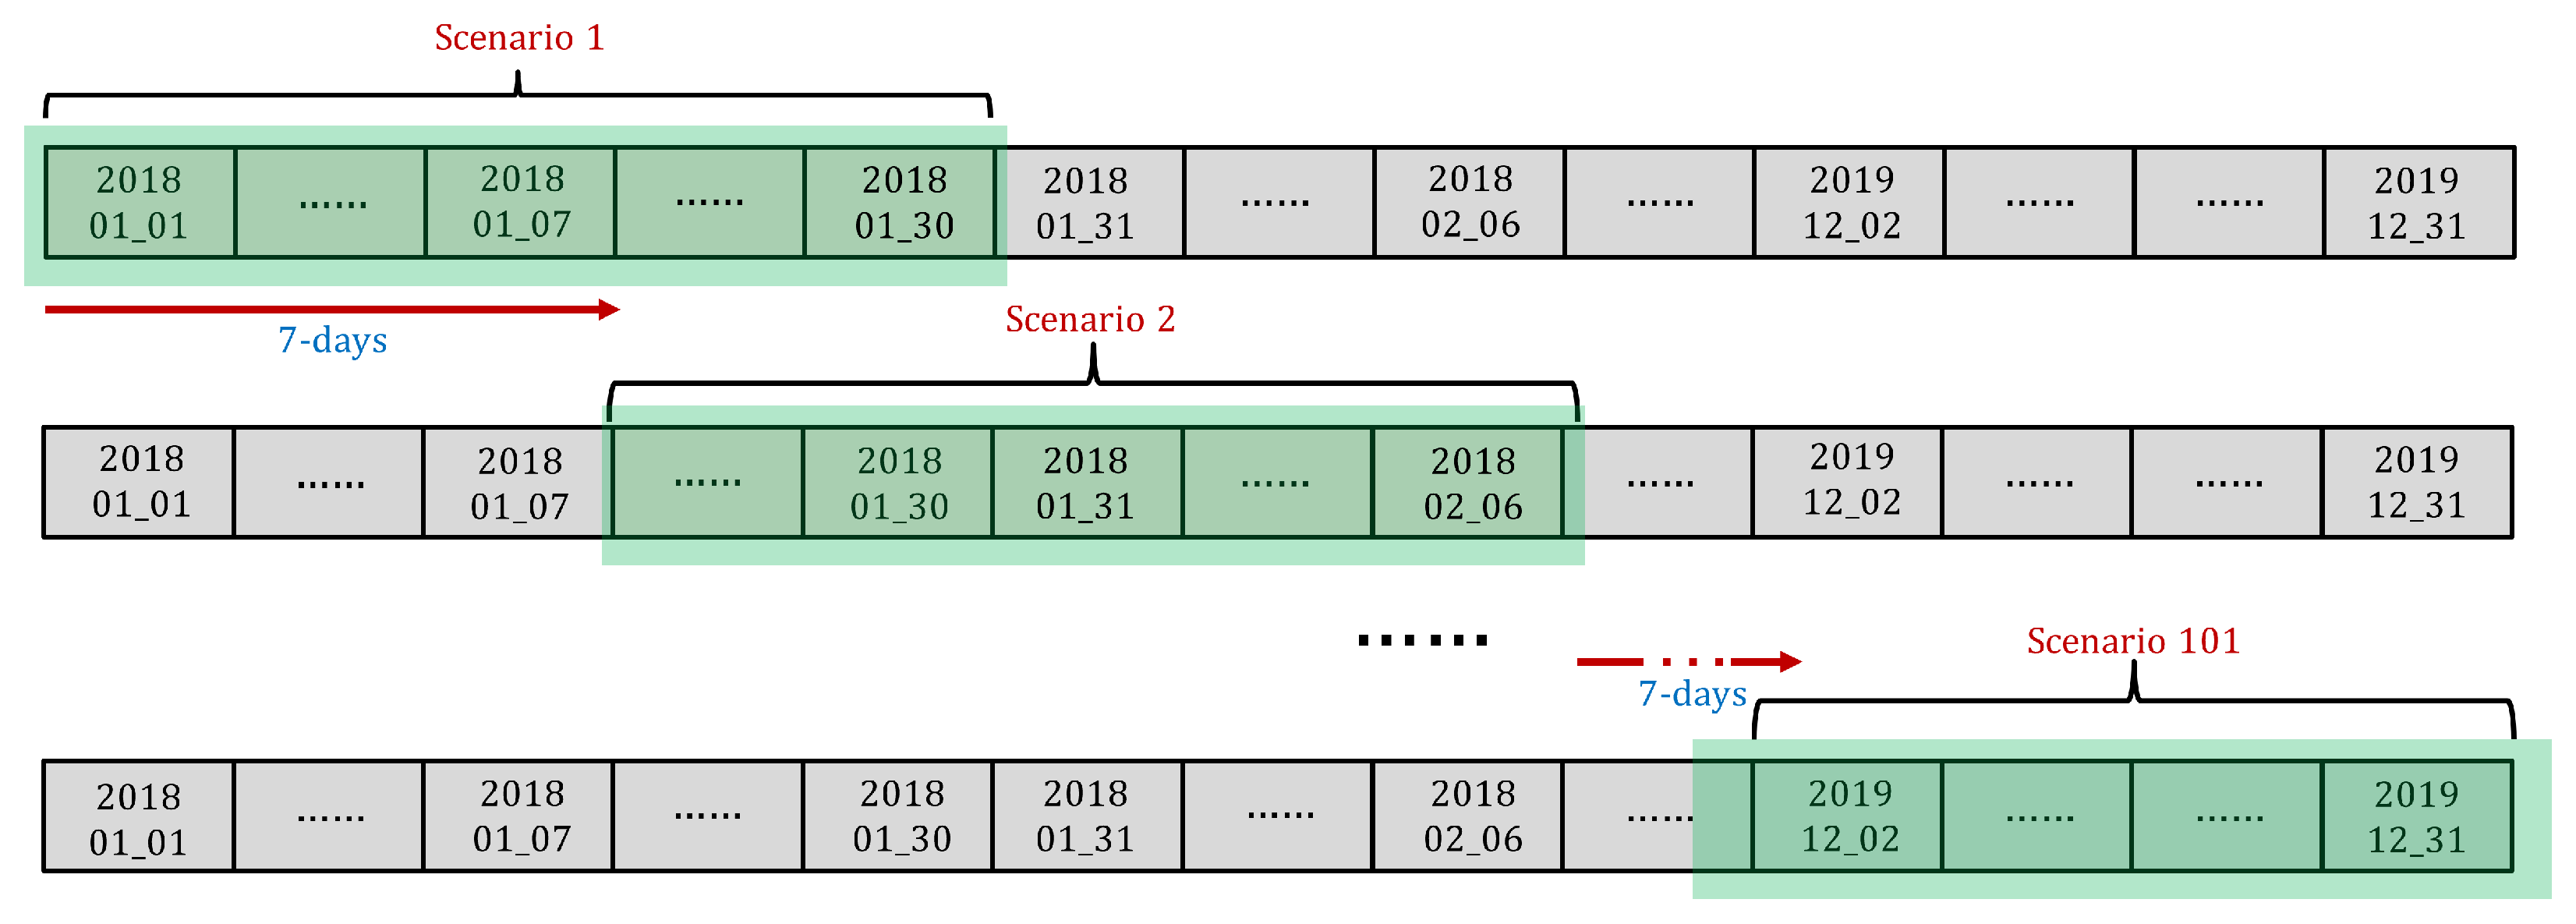
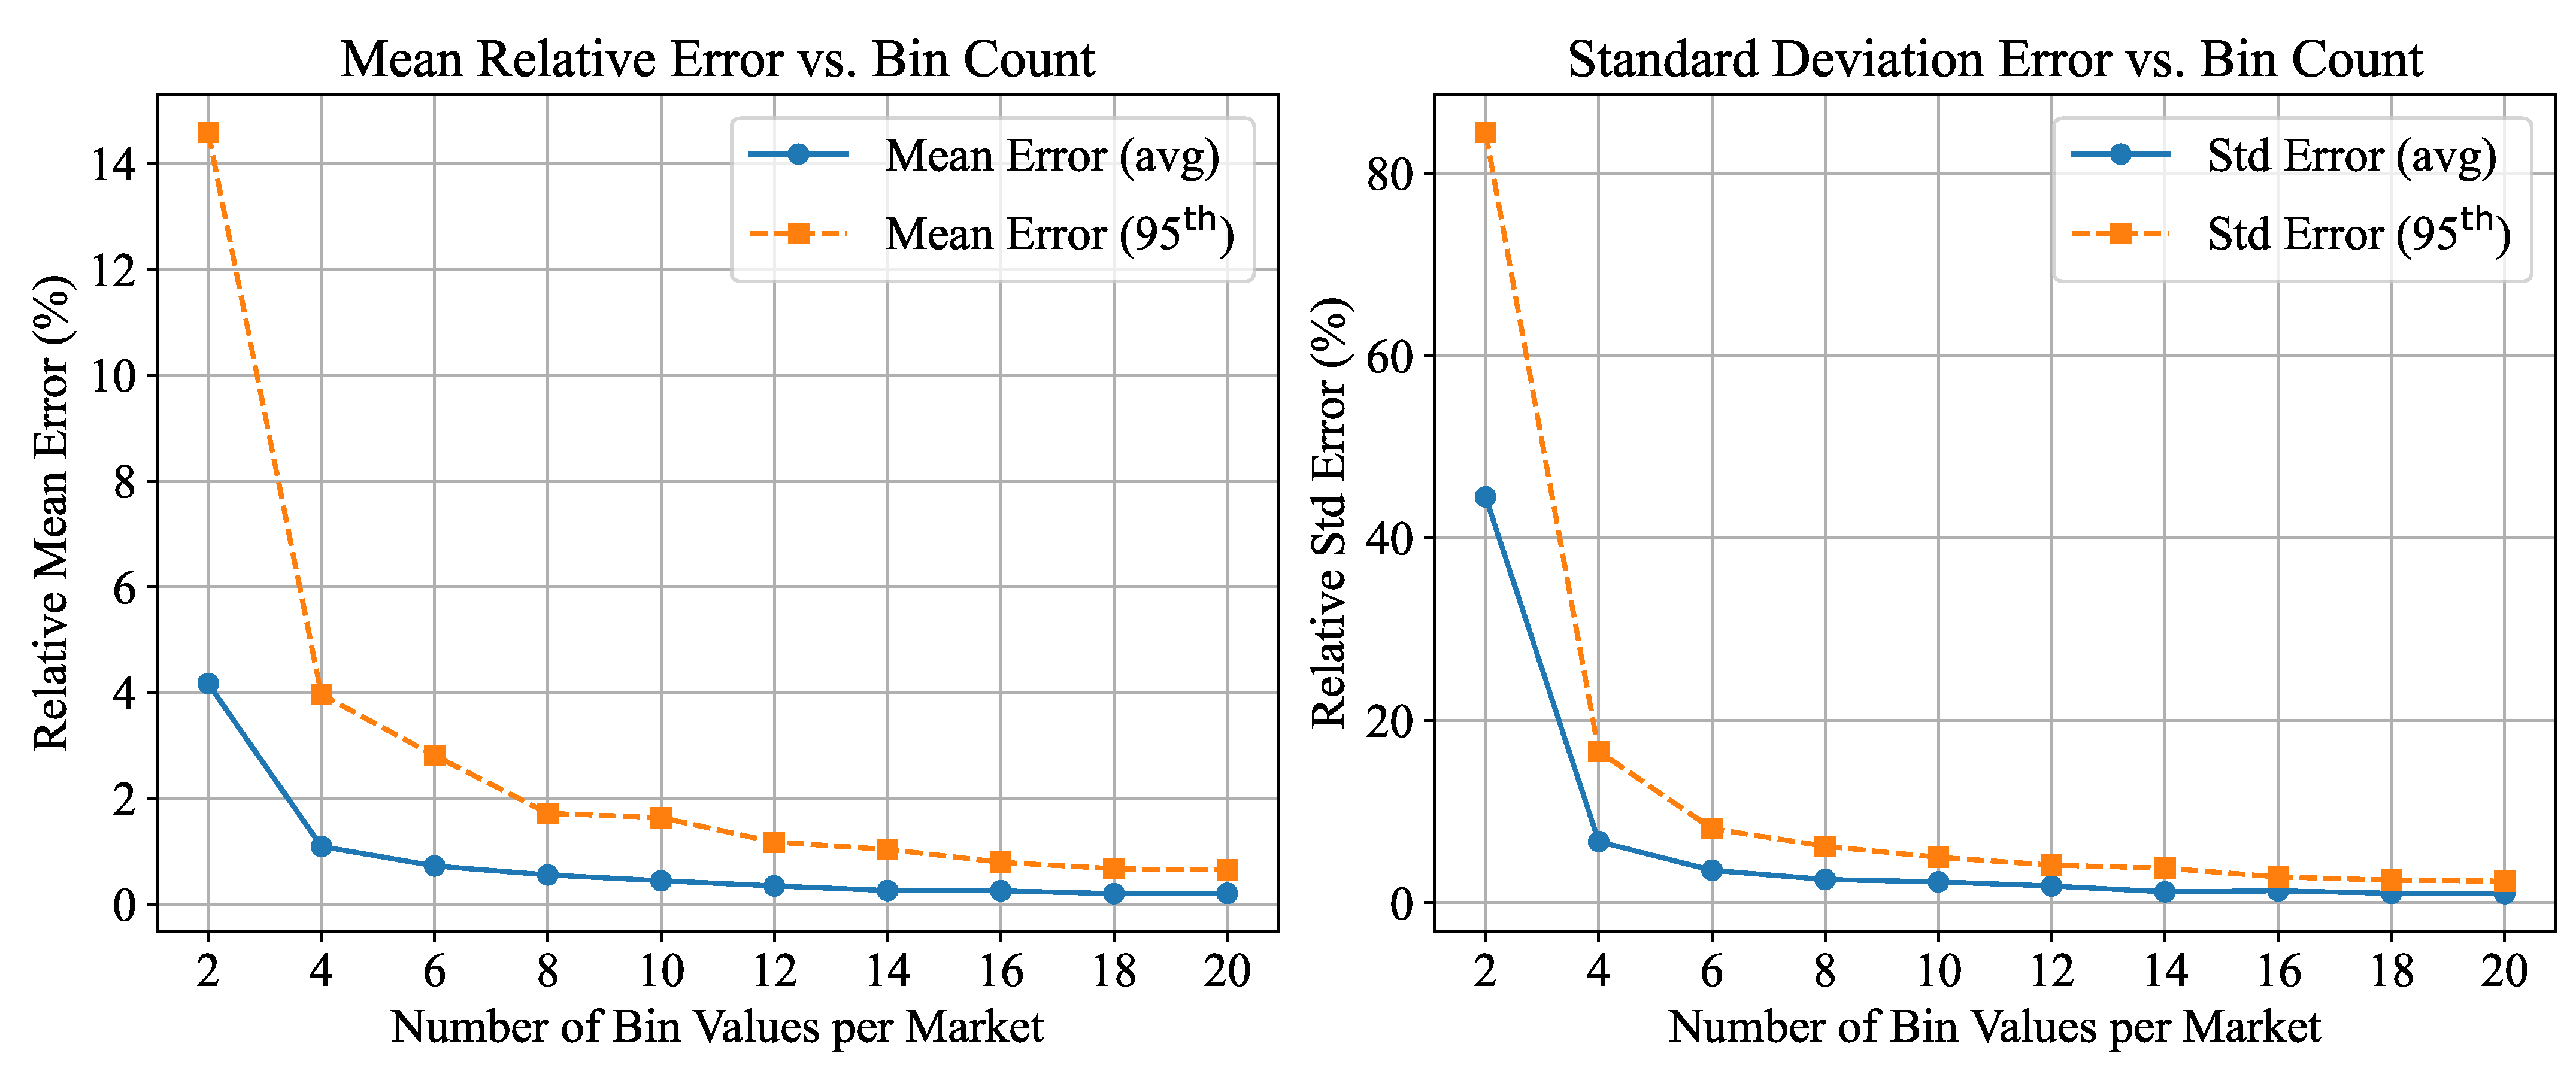
4.1. Scenario Generation

Scenario generation is a commonly used technique in stochastic programming [43]. Typically, these methods begin with a known probability distribution and apply heuristic algorithms to construct a scenario subset with a prescribed cardinality. In this study, we adopt an alternative approach that discretizes historical demand data using quantile-based binning and selects representative scenarios based on empirical frequency, optionally complemented by lightweight clustering. It is worth noting that our use of scenario generation serves two main purposes. First, it helps reduce the computational time required to solve the model, striking a balance between tractability and accuracy. Generally, a larger number of scenarios leads to more realistic solutions but significantly increases the computational burden. Second, scenario generation facilitates model validation: by solving a few representative scenarios using both deterministic and uncertainty-based models, we are able to compare and analyze the differences in the resulting outcomes.
In the context of the air transportation market, passenger demand exhibits continual variation, and the underlying probability distribution of operating conditions is often unknown. To address this challenge, we construct an initial scenario set S directly from historical operational records and later derive a reduced scenario set from it through quantization and selection. Take an initial set of historical demand scenarios S = { S 1 , S 2 , , S n } , which contains n scenarios and where each scenario S i R | M | represents observed demands across | M | markets. Our objective is to construct a reduced representative scenario set S that captures the essential variability of demand. We adopt a two-stage hybrid aggregation strategy:
  • Stage 1: Binning and Frequency-Based Selection
For each market m M , we partition the empirical demand range into k equally spaced intervals, each treated as a bin. Then, for each demand value d m i in scenario S i , we map it to the midpoint of its corresponding bin: d ^ m i = midpoint bin k ( d m i ) . This yields a quantized scenario S i U = ( d ^ 1 i , d ^ 2 i , , d ^ m i ) . We group scenarios sharing identical quantized outcomes and record the frequency of each unique combination. Finally, we select the most frequent quantized scenarios as the initial representative scenario set S . Figure 2 illustrates the process of selecting representative scenarios using binning and frequency-based selection. In the upper part of the figure, each subfigure corresponds to a market m, where the x-axis represents the number of passengers in that market, and the y-axis indexes the historical demand scenarios. Each light red horizontal shaded area corresponds to a historical scenario, such as S 1 O = ( 42 , 170 , , 395 ) . The red dashed lines divide the demand range into bins; when a demand value falls within a bin, it is mapped to the midpoint of that bin. For example, in the first subfigure at the top left, five red dashed lines divide the demand range evenly into five bins: 0–20, 20–40, 40–60, 60–80, and 80–100. The lower part of the figure shows the quantized scenarios after binning. For example, the original scenario S 1 O = ( 42 , 170 , , 395 ) is transformed into S 1 U = ( 50 , 180 , , 350 ) after mapping each market’s demand to its corresponding bin midpoint. Notably, some originally distinct scenarios may be mapped to the same quantized scenario after binning. For instance, scenarios S 1 O and S 2 O , although different in their original form, both map to the same quantized scenario S 1 U = S 2 U after binning. In this case, the frequency count for this quantized scenario increases. By counting the frequency of each unique quantized scenario across all markets, we identify the most frequent quantized outcomes. These most frequent scenarios are selected sequentially to form the representative scenario set, until the desired number of representative scenarios is obtained.
  • Stage 2: Clustering of Remaining Sparse Combinations
If the frequency distribution is highly sparse, which means that only a few combinations appear more than once while the majority of combinations occur only once, an additional clustering step is introduced to complement the selection process. It is important to note that this step is not mandatory. Stage 2 clustering is only performed when Stage 1 fails to yield the desired number of representative scenarios. In this case, we first determine the number of clusters and then apply clustering to the unselected quantized scenarios from Stage 1, such as S 3 U , , S n U . We use the 1 norm to measure scenario similarity: Δ ( S i U , S j U ) = m M | d ^ m i d ^ m j | . Within each cluster, we construct a new representative scenario by averaging the demand values across all markets. These clusters collectively define a new representative scenario set, which reflects the central tendency of the cluster and resembles the empirical data structure. The final scenario set S consists of both high-frequency patterns and synthetic scenarios.
This approach allows us to preserve the interpretability and empirical representativeness of frequency-based selection while improving coverage of low-density regions in the scenario space through a lightweight clustering mechanism.

4.2. Model Implementation and Setup

The model is implemented using Python (version 3.13.1) and Gurobi (version 10.0.3), running on an Apple M2 Max Chip (12-core CPU) with 32 GB of RAM.
In this study, we employ a sliding time window approach to augment the existing dataset (see Section 5.2 for details). Nevertheless, the resulting initial scenario set contains only 101 scenarios. Solving the UICPPAM model using all scenarios takes 48.59 s, while solving the deterministic version with a single scenario requires only 2.63 s. Although this indicates a moderate increase in computational time, the impact remains limited under the current sample size. Despite this, the proposed scenario generation method remains valuable. In practical applications where decision makers have access to a much larger set of historical samples (e.g., tens of thousands), our method can be readily applied to compress the scenario space and enable efficient solution of large-scale models. In this paper, we use the full set of scenarios to solve the UICPPAM model. The scenario reduction technique is employed primarily for experimental comparison between deterministic and stochastic solutions.

5. Case Study

In this section, we demonstrate the applicability of the proposed model through a large-scale, real-world case study based on Spring Airlines’ network. We begin by briefly introducing the background of Spring Airlines and outlining the rationale behind its selection as the case study. Section 5.2 describes the model’s parameter settings, including the treatment of the stochastic demand parameter d ˜ m , while Section 5.3 presents and discusses the experimental results.

5.1. Spring Airlines

Spring Airlines is an ideal case for demonstrating the effectiveness of the proposed model and deriving managerial insights for several reasons [5]. First, Spring Airlines is China’s first and largest LCC, operating 128 domestic and 82 international routes, connecting 93 domestic and international cities, managing a fleet of 93 aircraft (all Airbus A320), and transporting more than 22 million passengers in 2019, positioning itself as a leading LCC in Northeast Asia. Second, similar to globally renowned LCCs such as Ryanair and Southwest Airlines, Spring Airlines actively seeks to expand market opportunities by developing connecting services to enhance its network integration. Third, Spring Airlines emphasizes the development of robust connection strategies under varying passenger demand. According to its 2019 annual report, passenger transportation constitutes its primary revenue stream, and the revenue and profitability exhibit significant seasonal variations. Furthermore, due to constraints in airport infrastructure, airspace management, and flight operations technology, major domestic hub airports and trunk routes in China are approaching capacity limits. Facing competitive disadvantages in obtaining slots at certain airports and routes, Spring Airlines has increasingly focused on opportunities in second-tier cities to develop potential transfer hubs, thus achieving more robust and strategic network connectivity.
Based on these considerations, the Spring Airlines network provides an ideal setting for validating the UICPPAM, demonstrating its effectiveness in managing demand uncertainty within the integrated connection planning and passenger allocation framework.

5.2. Experimental Setup

In this case study, we analyze Spring Airlines’ network from 2018 to 2019. The operational flight data was obtained from Official Airline Guide (OAG) [44]. During this period, the airline operated an average of 10,159 flights per month, offering over 1.82 million seats monthly and serving 275 bidirectional airport pairs. To construct potential connecting flights, we employed a systematic approach similar to [45]. Specifically, this method relies on detailed flight schedules for individual segments, ensuring temporal and spatial feasibility by precisely aligning arrival and departure times. This allows for an accurate assessment of service frequency. Following industry standards and previous research, we restricted the allowable transfer time to between 45 min and 6 h. To eliminate excessively circuitous connections, we imposed an upper bound of 1.5 on the routing factor, defined as the ratio of actual flown distance to the direct-flight distance. Additionally, connections covering distances under 500 km were excluded to focus on more commercially relevant markets. To enhance reliability, we set a minimum service frequency of at least two flights per week to filter out sporadic connections. As a result, the final set of feasible one-stop itineraries comprised 540 unique travel paths, as illustrated in Figure 3. In Figure 3a, the orange nodes represent the ten airports with the highest degree centrality among all potential connections, most of which are located in the peripheral regions of the network. The size of each circle in this figure is proportional to the degree value, meaning that a larger circle indicates a greater number of direct connections (i.e., more routes connected to the airport). In contrast, Figure 3b highlights in red the transfer airports with the largest number of potential connections, which are primarily situated in the central part of the network. Here, the size of each red circle reflects the number of potential connecting itineraries that use the airport as a transfer point: the more potential connections, the larger the circle. These observations suggest that geographic location plays a critical role in determining an airport’s potential as a transfer hub. By strategically establishing connecting flights, it is possible to significantly enhance the overall network coverage under existing operational constraints.
Additionally, Spring Airlines serves a total of 783 unique city-pair markets, among which it holds a monopoly in 171 markets (21.8%). These monopoly markets are primarily composed of connections between secondary or tertiary cities. In terms of route structure, the airline operates 1139 distinct flight routes, including 599 direct point-to-point routes and 46 currently active one-stop connections. This implies that 494 routes, nearly half of the total, can potentially be developed via connecting flights, offering substantial opportunities for network expansion under the existing operational constraints.
For the passenger demand d ˜ m , we extracted demand data over a 24-month period from January 2018 to December 2019. To better capture uncertainty, we employed a sliding time window approach with a 7-day step size to expand the existing dataset. Figure 4 provides an illustration of the data expansion method. By applying this approach, we extended the 24-month dataset to a 101-month dataset, effectively increasing the number of scenarios while preserving the inherent fluctuations in passenger demand.
The seat capacity of each flight ( k f ) and the ticket price ( p i ) can be readily retrieved or computed from the dataset. To estimate the ticket price for newly constructed connecting itineraries, we adopt the itinerary pricing model developed in [10]. This model imputes prices based on a linear-in-parameter function of itinerary-specific and market-related variables. Specifically, it incorporates indicators such as whether the carrier is a low-cost or full-service airline l c c i , the itinerary type (nonstop or not) n s i , total flight distance d i s t i , and a market-level average price estimate p i m k t . The average market price is obtained via a regression tree model using key explanatory variables including local population, GDP, yearly passenger volume, and the number of competing carriers. This approach allows for a consistent estimation of price while accounting for both supply-side cost structures and demand-side preferences. We directly adopt the coefficients and their standard errors reported in the original study, avoiding redundant re-estimation. The full specification of the pricing model is provided in Equation (3), with standard errors shown in brackets.
ln ( p i ) = 0.2285 ( 0.157 ) + 0.9272 ( 0.032 ) · ln ( p i m k t ) 0.0632 ( 0.008 ) · l c c i + 0.0239 ( 0.006 ) · n s i + 0.035 ( 0.001 ) · d i s t i
To estimate the coefficients of the utility function, we follow the customary procedure described in [10,22], which is based on the standard logit framework. Specifically, we take the logarithm of the odds ratio between alternatives serving the same market, yielding a linear equation that relates the difference between the log market shares to the difference in itinerary attributes. This transformation allows the use of conventional regression models to estimate how factors such as ticket price ( p i ), frequency ( n i ), flying time ( f t i ), and connecting time ( c t i ) affect the perceived utility of a flight. Additionally, a dummy variable ( f s i ) is included to account for unobserved characteristics specific to Spring Airlines, ensuring that any residual carrier-specific effects are properly captured. The coefficients and their standard errors (shown in brackets) were estimated using observed market shares in our dataset. While we apply the same estimation approach as in [10], the resulting coefficients differ due to the distinct characteristics of our dataset, including carrier-specific features. The full specification of the utility function, with standard errors shown in brackets, is provided in Equation (4).
V i = 0.0325 ( 0.015 ) · p i + 0.023 ( 0.002 ) · n i 0.0144 ( 0.002 ) · f t i 0.0080 ( 0.001 ) · c t i + 0.5115 ( 0.021 ) · f s i
Regarding the variable cost c i var associated with serving each connecting passenger, previous studies pointed out that although this cost negatively affects overall revenue, the implementation of connecting services still leads to a significant improvement compared to not offering such services at all. Therefore, in this study, we do not delve deeply into this parameter and instead set it to a fixed value of c i var = 10 .
As for the fixed activation cost c h fix associated with each transfer airport, due to the lack of access to proprietary cost data from airlines, it is difficult to accurately estimate this value. To address this limitation, we adopt an alternative modeling approach by imposing a constraint on the number of transfer airports that can be activated, thereby indirectly controlling the total activation cost. Specifically, we incorporate the following constraint into the model: h H w h = Ω , ( Ω = 1 , 2 , , 10 ) . This constraint serves as a surrogate mechanism to reflect the cost of activating transfer airports within the objective function.

5.3. Results

In this section, we compare the deterministic model and the model with uncertainty across multiple dimensions, including the selection of activated transfer airports, activated connecting itineraries, passenger allocation ratios, total network revenue, and solution robustness. This comparison provides a comprehensive assessment of the impact of incorporating demand uncertainty into flight connection planning.

5.3.1. Selected Transfer Airports and Connecting Itineraries

To examine the behavioral differences between the deterministic model and the model with uncertainty, we solve both the ICPPAM (deterministic) and UICPPAM (uncertain) to compare the resulting decisions regarding selected transfer airports and connecting itineraries. The input for ICPPAM is based on the average passenger demand across all scenarios, whereas UICPPAM is solved over all historical demand scenarios to capture the uncertainty.
Table 2 presents the optimization results under the constraint of selecting up to 10 transfer airports ( Ω = 1 , 2 , , 10 ) within Spring Airlines’ network. The full names corresponding to the airport codes used in this table are provided in Appendix A Table A1. Here, Apt ( Ω ) denotes the allowed number of transfer airports (i.e., the selection constraint), while Apt refers to the specific airports that are ultimately selected and activated by the model. The table compares, for each additional selected airport, the absolute revenue increase Δ Rev($), the revenue growth rate Δ Rev(%), the cumulative number of activated connecting itineraries (AC), the ratio of AC to the total number of potential connections (PC), and the corresponding changes in the proportion of direct and one-stop passengers Δ Pax(%). The comparison indicates a high degree of consistency in the set of activated airports between the two models. Figure 5 illustrates the top 10 activated transfer airports under each model. The size of the red circles indicates the activation order of transfer airports; larger circles represent airports that are selected earlier, implying higher revenue contribution to the overall network. The orange lines highlight the connecting itineraries that are activated simultaneously when the corresponding transfer airport is selected. It is evident that the number of activated connections in Figure 5b (UICPPAM) is noticeably higher than in Figure 5a (ICPPAM), reflecting UICPPAM’s broader utilization of the network under uncertainty.
This difference not only reflects the number of activated connections but also stems from the distinct airport selection logic of the two models. ICPPAM tends to prioritize airports with more high-revenue connecting itineraries, whereas UICPPAM favors those with more stable demand patterns. As a result, the activation order of transfer airports differs, and each airport contributes differently to network revenue under the two models. For example, under the ICPPAM, the first three airports activated are ZBSJ, ZSPD, and ZSYA, which also correspond to the airports with the largest numbers of potential connections—81, 233, and 26, respectively. In contrast, under the UICPPAM, ZLXY emerges as the second airport to be activated despite having only six potential connections. Further analysis reveals that the demand fluctuations associated with ZLXY’s connecting itineraries are relatively small. This finding suggests that under demand uncertainty, the model prioritizes airports with more stable connecting markets over those with merely a large number of potential connections. Consequently, the selected routes tend to exhibit more stable and relatively higher revenue outcomes.
Significant differences are observed between the two models in terms of the activated connecting itineraries. As shown in Table 2, the number of activated connecting itineraries under UICPPAM is notably higher than that under ICPPAM, with approximately 59.5% more activated itineraries when up to 10 transfer airports are allowed. It is important to note that, for comparability, the number of passengers in UICPPAM is also calculated based on the average demand across all scenarios for each market. This ensures that differences between the two models arise from the allocation strategies rather than from demand realization. The comparison suggests that, under demand uncertainty, UICPPAM tends to distribute passenger flows across a greater number of itineraries to enhance the overall stability of network revenue. The Δ Pax(%) results further corroborate this observation. When the same airports are activated, UICPPAM exhibits a more balanced passenger allocation strategy. For instance, when ZSPD is activated, UICPPAM reduces the proportion of nonstop passengers by a larger margin than ICPPAM (a reduction of 4.73% points versus 1.31%), but shows a smaller increase in one-stop passengers (an increase of 51.8% points compared to 60.7%). In addition, when up to 10 airports are activated, UICPPAM reduces the overall share of nonstop passengers by 13.7%, while ICPPAM achieves only a 7.3% reduction. These findings indicate that UICPPAM adopts a more conservative and robust approach when shifting passengers toward connecting itineraries, avoiding excessive concentration on individual routes, and thus, reinforcing its strategy of maintaining distributional stability under demand uncertainty.
To further highlight the differences in passenger allocation strategies between the two models, we adopted the scenario generation method introduced in Section 4.1 to construct 10 representative scenarios.
Here, we first determine an appropriate number of bins k for discretizing the empirical demand distribution by conducting a sensitivity analysis with k ranging from 2 to 20 in increments of 2. For each bin count, we approximated the original dataset by replacing each market’s historical demand values with their closest bin centers. We then calculated the relative error in terms of mean and standard deviation between the approximated data and the original. The results, visualized in Figure 6, indicate that when k = 10, the mean relative error drops below 0.5%, and the standard deviation error is around 2.3%. Further increasing the number of bins leads to only marginal improvements. This suggests that a 10-bin configuration strikes a good balance between statistical fidelity and computational simplicity.
In addition to validating the bin count, we assessed the representativeness of the 10 selected demand scenarios using statistical comparisons with the full scenario set. Table 3 reports the relative errors of several statistical summaries across all markets. Specifically, the mean relative error in the mean demand is only 1.37%, with a 95th percentile of 3.98%, and a maximum of 59.91%. For standard deviation, the mean relative error is 6.12%, with a 95th percentile of 15.19%. The relative errors for the 25th, 50th, and 75th percentiles are similarly moderate, with average errors below 3% in all cases. These results demonstrate that the selected 10 representative scenarios capture the key statistical features of the full demand distribution with reasonably small distortion. Therefore, all subsequent analyses involving demand realization are conducted based on these statistically robust representative scenarios.
Using the passenger allocation ratios produced by each model, we computed the number of passengers assigned to each flight across the 10 scenarios and subsequently calculated the standard deviation of the monthly load factors for each flight. The results show that UICPPAM yields significantly more stable outcomes: its allocation ratios lead to consistently higher and more uniform load factors across all scenarios, reducing the average standard deviation of load factors by approximately 26.12% compared to ICPPAM.
In contrast, under the ICPPAM model, the allocation strategy often concentrates a large proportion of passengers onto high-demand, high-revenue routes in pursuit of profit maximization. Many of these routes, particularly those in tourism-oriented markets, are subject to pronounced seasonality. As a result, in low-demand scenarios, such aggressive allocation leads to substantial underutilization, with load factors dropping below 30%, thereby wasting valuable seat capacity. Conversely, in high-demand scenarios, the same allocation approach causes load factors on many flights to exceed 100%, rendering the connection strategies infeasible and resulting in a decline in overall revenue performance. In contrast, UICPPAM, by accounting for demand uncertainty, generates allocation strategies that maintain stable performance across a wide range of scenarios. Figure 7 further supports this observation, demonstrating that across configurations with different numbers of activated transfer airports, UICPPAM consistently outperforms ICPPAM in terms of load factor stability.
In summary, these findings reveal inherent limitations in the ICPPAM allocation strategy, particularly its vulnerability to demand uncertainty and its frequent generation of infeasible flight assignments. Section 5.3.2 will provide a more detailed examination of these limitations and their impact on network performance.

5.3.2. Robustness Analysis

The purpose of incorporating passenger demand uncertainty into flight connection planning is not only to maximize resource utilization across varying operational scenarios but, more importantly, to ensure the stability of the airline’s total revenue. Given that network planning is a strategic decision that has long-term impacts on airline operations, revenue stability is critical. Therefore, beyond achieving stable load factors, it is essential to evaluate the robustness of the model’s revenue performance under different demand conditions. To assess the advantages of the proposed model, we conduct a comparative analysis between the decisions generated by the deterministic model and those obtained from the uncertainty-based model.
We utilize the scenario generation method introduced in Section 4.1 to construct 10 representative demand scenarios. Across these scenarios, we observe that the decisions generated by the deterministic model are only optimal for the specific demand combination on which they are based. When applied to alternative demand scenarios, many connection flights that should have been activated fail to operate as planned. More specifically, under the deterministic model, we identify four primary types of connection activation failures, as illustrated in Table 4:
(i)
In some one-stop itineraries, a local flight serves as the shared feeder for multiple connecting itineraries. When the total number of passengers allocated to this local flight exceeds its available seat capacity, the first leg of the connecting itineraries fails to operate, thereby preventing all subsequent connections from being activated. In Case 1, Flight CQH8592 (from ZYTL to ZSPD) reaches its seat capacity limit and thus cannot support any onward connections.
(ii)
As an extension of type (i), in some one-stop itineraries, a local flight serves as the shared feeder for multiple connecting itineraries. Although the total number of passengers allocated to this local flight does not exceed its seat capacity, the available seats are insufficient to accommodate all the connecting itineraries simultaneously. As a result, selective allocation must be performed, potentially leading to the failure of certain connections. In Case 2, if priority is given to passengers traveling from ZYTL to ZUCK, the connection to VYYY may fail. Alternatively, if priority is given to passengers traveling from ZYTL to VYYY, all connections can be preserved, but at the cost of losing more demand from ZYTL to ZUCK.
(iii)
In some one-stop itineraries, a local flight serves as the second leg for multiple connecting itineraries. When the direct demand allocated to this local flight exceeds its seat capacity, the flight cannot accommodate passengers from the preceding connections, leading to the failure of all upstream itineraries. In Case 3, Flight CQH8617 (from ZBSJ to ZBOW) reaches its seat capacity limit due to direct demand, leaving no capacity for any inbound connections.
(iv)
Similar to the second case, this failure type arises when a local flight serves as the downstream leg for multiple one-stop itineraries. Although the total number of allocated passengers does not exceed the seat capacity, the remaining seats are insufficient to accommodate all connections simultaneously. As a result, selective allocation becomes necessary, potentially leading to the failure of some connecting itineraries. Case 4 provides a concrete example of this situation.
Among the four types of connection activation failures, Types 1 and 3 are relatively straightforward, as they result directly from hard capacity violations and can be identified without ambiguity. In contrast, Types 2 and 4 require decisions about how to allocate limited residual capacity when it is insufficient to support all connecting itineraries. In such cases, it becomes necessary to weigh the trade-off between preserving as many connections as possible and prioritizing higher-revenue markets at the expense of some connection failures. To ensure a fair comparison with the maximum revenue achievable under the uncertainty-based model, it is essential to identify infeasible connections accurately and recalculate the total network revenue accordingly. However, identifying invalidated connections and recalculating revenue in practice remains a highly complex task. The cases listed in Table 4 illustrate simplified scenarios. In reality, flights are often embedded in far more intricate coupling relationships, where a single flight may serve simultaneously as the feeder or downstream leg for numerous overlapping itineraries. A capacity bottleneck on one flight may cascade through the network, resulting in widespread disruptions and multiple reallocation possibilities.
Ideally, such challenges would be addressed through comprehensive global optimization to determine the best reallocation and maximize total revenue. For example, suppose Flight A feeds into both (A,B) and (A,C) connections. A surge in local passengers on Flight A may leave only 10 available seats, making it impossible to satisfy the one-stop demands of both connections simultaneously. Prioritizing (A,B) based on higher fare may invalidate (A,C), and further shortages on Flight B could propagate failures to subsequent connections such as (B,D) and (B,E). To address this complexity tractably, we propose a priority-based dynamic allocation algorithm. All connecting itineraries are first sorted in descending order of fare. For each itinerary, the algorithm checks whether all involved flights have sufficient remaining seats. If so, the passengers are assigned, and seat capacities are immediately updated; otherwise, the itinerary is invalidated. This approach prioritizes higher-value connections and dynamically maintains allocation feasibility throughout the reallocation process. The corresponding pseudocode is presented in Algorithm 1.
Algorithm 1: Priority-based dynamic allocation for passenger reallocation
Require: 
Set of connecting itineraries I c t , set of flight capacity K
Ensure: 
Allocation decision for each connecting itinerary
1:
Sort all connecting itineraries in I c t in descending order of their fare
2:
for each connecting itinerary i I c t (in sorted order) do
3:
   Identify the set of flights involved in i
4:
   Check if all involved flights have sufficient remaining seats
5:
   if seats are sufficient for all involved flights then
6:
     Assign passengers to i
7:
     Update the remaining seat capacity for each involved flight
8:
   else
9:
     Mark i as invalidated
10:
   end if
11:
end for
We first evaluated the baseline scenario, in which the deterministic model (ICPPAM) uses the average demand across all historical data as input, while the uncertainty-based model (UICPPAM) considers the entire historical demand distribution. Under this specific setting, ICPPAM achieves significantly higher revenue than UICPPAM. However, it is important to emphasize that this baseline scenario is inherently unrealistic, as it ignores the natural variability and stochasticity of passenger demand. The connection strategies derived from the deterministic model are optimized solely for this fixed average demand, meaning they are designed to maximize revenue only under this particular, simplified condition. This explains why, in Figure 8, the deterministic model achieves markedly higher revenue under the baseline scenario. In contrast, real-world airline operations rarely encounter such stable conditions. For example, during peak travel seasons, passenger demand in certain markets can surge dramatically, while in off-peak periods, demand in some markets may decline sharply or even disappear altogether. Under such varying conditions, would the deterministic strategy still perform as well? Would all connecting itineraries continue to be executed successfully without encountering the four types of connection failures previously discussed?
To rigorously assess the performance of the two models under demand uncertainty, we conducted experiments across 10 representative demand scenarios generated from historical data. Using Algorithm 1, we evaluated the connection failure rates and calculated the corresponding total revenue under each scenario. The results show that, on average, the deterministic strategy (ICPPAM) experiences a connection failure rate of 22.9%, whereas the uncertainty-based strategy (UICPPAM) successfully maintains the feasibility of all connecting itineraries across all scenarios. This provides a direct comparison of the network robustness between the two models and establishes the foundation for the subsequent revenue performance analysis. Furthermore, when the connection strategies and passenger allocation ratios determined by each model are applied to the 10 generated demand scenarios, UICPPAM consistently outperforms ICPPAM in terms of revenue under most conditions, particularly in high-demand scenarios where the number of invalidated connections under the ICPPAM strategy increases substantially, leading to significant revenue losses. These findings validate the central purpose and contribution of this study: UICPPAM offers a more stable and robust network design under demand uncertainty. Nevertheless, it is worth noting that in certain scenarios (such as Scenarios 4, 6, 9, and 10), despite experiencing a considerable number of connection failures, the deterministic strategy still achieves higher revenue than the uncertainty-based strategy. This outcome highlights the conservative nature of UICPPAM, where potential high gains are deliberately sacrificed to ensure solution feasibility and overall revenue stability. Future research will explore how to better balance this trade-off between robustness and the ability to capture higher profits under favorable conditions.
In summary, these findings reinforce the advantages of UICPPAM over the deterministic model and highlight its potential as a more robust and reliable tool for supporting connection planning under demand uncertainty.

6. Discussion

The connection strategy plays a crucial role in shaping the network development of LCCs undergoing strategic transformation. Traditionally, LCCs and full-service carriers (FSCs) have operated with clear and distinct strategic boundaries. FSCs emphasize connectivity through broad network coverage, comprehensive service offerings, and premium branding, targeting high-yield passengers and long-haul connecting traffic. By contrast, LCCs have long prioritized cost minimization to enhance profitability—for instance, avoiding H&S structures to maximize aircraft utilization, operating from secondary airports to reduce airport charges, and standardizing fleets and cabin configurations to simplify operations. From this perspective, connectivity has not typically been a strategic objective for LCCs. However, recent developments suggest a shift in this paradigm. Annual reports from carriers such as Spring Airlines and Ryanair reveal a growing interest in building their own hub structures and leveraging opportunities in emerging secondary cities to expand markets. In China, Spring Airlines has ranked among the most profitable carriers for consecutive years, outperforming major FSCs such as China Southern and China Eastern. This performance underscores the potential value of a hybrid network strategy. Notably, Spring Airlines has explicitly emphasized the importance of connection planning in its corporate reports [5]. Among the ten most promising transfer airports identified by our model, eight have already been established as strategic bases for Spring Airlines by 2023 (excluding ZUZY and ZGCD). Compared with 2019, the carrier’s deployed capacity at these bases has increased by 213.5%.
However, while such connection strategies are gaining traction among LCCs, one critical challenge remains largely unresolved: the robustness of network planning under demand uncertainty. The air travel market is inherently cyclical and subject to sharp demand fluctuations. Despite their efforts to develop connecting networks, most LCCs lack effective strategies to hedge against these uncertainties. Developing a robust connection planning framework that accounts for uncertain passenger demand is, therefore, both timely and necessary. That is the reason why we do this research.
Despite the contributions made in this study, several challenges remain. For instance, as observed in Section 5, the model tends to produce overly conservative solutions under certain scenarios, resulting in unacceptably low revenues—particularly from the perspective of LCCs, which are highly sensitive to profitability. Mitigating this conservatism is, therefore, an important avenue for future work. One potential direction is to incorporate overbooking strategies, which are commonly employed by airlines to hedge against no-show risks and improve revenue outcomes. In addition, our scenario-based stochastic model is inherently reliant on historical data. This raises concerns regarding its ability to handle extreme, long-term disruptions, such as the COVID-19 pandemic, that may significantly deviate from past patterns. Addressing such concerns calls for the integration of more robust optimization frameworks. In this regard, the continued development of robust and distributionally robust optimization methods offers promising tools for enhancing model resilience and generalizability in uncertain and volatile environments.
Moreover, the current model assumes fixed ticket prices and static flight schedules, which may reduce its applicability to real-world LCC operations. In practice, LCCs often adjust prices dynamically and revise flight schedules based on demand fluctuations and operational conditions. Incorporating these features would enhance the realism of the model but also introduce significant complexity. Demand, pricing, and scheduling are closely linked decisions, and capturing their interaction requires a joint optimization framework. Such a framework must reflect temporal demand changes, price elasticity, and schedule flexibility, all of which increase the uncertainty and computational difficulty. Extending the current model to include these dynamic elements remains a challenging but valuable direction for future research, especially for airlines seeking to plan robust networks under multiple interacting uncertainties.

7. Conclusions

7.1. Summary and Contributions

This study developed a robust optimization framework for flight connection planning in low-cost carrier networks, explicitly accounting for passenger demand uncertainty. The proposed model—referred to as the Uncertainty-Aware Integrated Connection Planning and Passenger Allocation Model (UICPPAM)—determines which connecting itineraries should be activated and how passengers should be allocated across feasible options in order to maximize airline revenues. To evaluate the effectiveness of the proposed model, we conducted a series of numerical experiments using real-world operational data from Spring Airlines. The experimental results show that, compared with a deterministic model, UICPPAM generates more reliable and robust solutions across varying demand scenarios. Specifically, when activating 10 transfer airports, the number of activated connecting itineraries increases by 59.5%, and the standard deviation of load factors across all flights is reduced by 26.1%, indicating a more balanced passenger distribution. Moreover, when applying the deterministic model’s strategy to 10 representative demand scenarios, 22.9% of the activated connections on average become infeasible due to demand fluctuations. In contrast, our model maintains 100% feasibility across all scenarios. These findings demonstrate that our proposed model effectively captures real-world operational dynamics and enables the managers of LCCs to improve both revenue performance and operational efficiency under demand uncertainty. The original contribution of this study lies in the development of a novel planning framework for low-cost carriers that explicitly addresses uncertainty in passenger demand.

7.2. Limitations and Future Work

Several limitations remain to be addressed in future research. First, the demand scenarios used in the model are constructed from historical data. However, historical datasets may not fully capture all possible future demand patterns. Future research could explore the construction of uncertainty sets from historical data and extend the current approach toward a distributionally robust optimization model. In addition, components such as demand forecasting models and macroeconomic trend analysis could be integrated into the framework. This would help the model anticipate structural shifts in air travel demand caused by economic fluctuations, geopolitical changes, and evolving passenger behavior in the post-COVID-19 era [46,47,48]. A sequential approach that first predicts demand and then optimizes the network could further improve the model’s realism and practical value. Second, ticket prices are assumed to be fixed in this study, and average fares are used across routes. In practice, however, airfares may vary significantly due to dynamic pricing mechanisms. Future extensions could aim to incorporate fare volatility by identifying pricing patterns and embedding them within the optimization framework. Third, the proposed model provides strategic-level planning recommendations. Integrating these decisions with tactical measures—such as fleet assignment and schedule adjustments—would be a valuable and challenging direction for future investigation. Despite these limitations, the present study offers a practical and adaptable tool for helping LCCs manage risk and maintain long-term profitability during their transition toward hybrid network structures. The proposed modeling framework is broadly applicable in practice, and the parameters can be easily tailored by different airlines to generate robust connection strategies suited to their specific operational environments.

Author Contributions

Conceptualization, W.D. and E.I.; methodology, W.D., M.Z.L. and E.I.; software, W.D.; validation, W.D., M.Z.L. and E.I.; formal analysis, W.D., M.Z.L. and E.I.; investigation, W.D. and E.I.; resources, E.I.; data curation, W.D.; writing—original draft preparation, W.D; writing—review and editing, M.Z.L. and E.I.; visualization, W.D.; supervision, E.I.; project administration, E.I.; funding acquisition, E.I. All authors have read and agreed to the published version of the manuscript.

Funding

This study was conducted as part of an industry–academia collaboration project with Japan Airlines (JAL) Aviofuture Lab. It was supported by a Grant-in-Aid for Scientific Research (Project Numbers: 24KK0088 and 25K07952).

Data Availability Statement

The data presented in this study are available on request from the corresponding author. The data are not publicly available because the source data are commercially available by a data vendor.

Acknowledgments

The authors wish to thank Koji Tominaga at Research Center for Advanced Science and Technology, The University of Tokyo for his technical support.

Conflicts of Interest

The authors declare no conflicts of interest. The funder had no role in the design of the study; in the collection, analyses, or interpretation of data; in the writing of the manuscript; or in the decision to publish the results.

Abbreviations

The following abbreviations are used in this manuscript:
LCCLow-Cost Carriers
P2PPoint-to-Point
H&SHub-and-Spoke
FSNCsFull-Service Network Carriers
O&DOrigin-Destination
MNLMultinomial Logit Formulation
MILPMixed-Integer Linear Programming
FSCFull-Service Carriers

Appendix A. List of Airports

Table A1. List of airports mentioned in the paper.
ICAO CodeAirport NameCountryCity
VYYYYangon International AirportMyanmarYangon
ZBSJShijiazhuang Zhengding International AirportChinaShijiazhuang
ZBOWBaotou Donghe International AirportChinaBaotou
ZLXYXi’an Xianyang International AirportChinaXi’an
ZGCDChangde Taohuayuan AirportChinaChangde
ZGOWJieyang Chaoshan International AirportChinaJieyang
ZSAMXiamen Gaoqi International AirportChinaXiamen
ZSCNNanchang Changbei International AirportChinaNanchang
ZSNBNingbo Lishe International AirportChinaNingbo
ZSPDShanghai Pudong International AirportChinaShanghai
ZSSHHuai’an Lianshui AirportChinaHuai’an
ZSSSShanghai Hongqiao International AirportChinaShanghai
ZSYAYangzhou Taizhou International AirporChinaYangzhou
ZUCKChongqing Jiangbei International AirportChinaChongqing
ZUZYZunyi Xinzhou AirportChinaZunyi
ZYTLDalian Zhoushuizi International AirportChinaDalian
ZYTXShenyang Taoxian International AirportChinaShenyang

References

  1. Oum, T.H.; Zhang, A.; Zhang, Y. Airline network rivalry. Can. J. Econ. 1995, 28, 836–857. [Google Scholar] [CrossRef]
  2. Klophaus, R.; Merkert, R.; Lordan, O. Mesh network as a competitive advantage for European LCCs: An alternative topology to hub-and-spoke for selling online connections. Transp. Policy 2021, 106, 196–204. [Google Scholar] [CrossRef]
  3. Zeigler, P.; Pagliari, R.; Suau-Sanchez, P.; Malighetti, P.; Redondi, R. Low-cost carrier entry at small European airports: Low-cost carrier effects on network connectivity and self-transfer potential. J. Transp. Geogr. 2017, 60, 68–79. [Google Scholar] [CrossRef]
  4. Klophaus, R.; Fichert, F. From low-cost carriers to network carriers without legacy? Evolving airline business models in Europe. In Airline Economics in Europe; Emerald Publishing Limited: Leeds, UK, 2019; Volume 8, pp. 57–75. [Google Scholar]
  5. Spring Airlines. Spring Airlines Annual Report 2023. 2025. Available online: https://ajax.springairlines.com/content/invester/%E6%98%A5%E7%A7%8B%E8%88%AA%E7%A9%BA%EF%BC%9A%E6%98%A5%E7%A7%8B%E8%88%AA%E7%A9%BA2023%E5%B9%B4%E5%B9%B4%E5%BA%A6%E6%8A%A5%E5%91%8A.pdf (accessed on 29 March 2025).
  6. Maertens, S.; Pabst, H.; Grimme, W. The scope for low-cost connecting services in Europe—Is self-hubbing only the beginning? Res. Transp. Bus. Manag. 2016, 21, 84–93. [Google Scholar] [CrossRef]
  7. Cattaneo, M.; Malighetti, P.; Paleari, S.; Redondi, R. Evolution of the European network and implications for self-connection. J. Air Transp. Manag. 2017, 65, 18–28. [Google Scholar] [CrossRef]
  8. Malighetti, P.; Paleari, S.; Redondi, R. Connectivity of the European airport network: “Self-help hubbing” and business implications. J. Air Transp. Manag. 2008, 14, 53–65. [Google Scholar] [CrossRef]
  9. Morlotti, C.; Birolini, S.; Cattaneo, M.; Redondi, R. Introducing connecting flights in LCCs’ business model: Ryanair’s network strategy. J. Air Transp. Manag. 2020, 87, 101849. [Google Scholar] [CrossRef]
  10. Birolini, S.; Besana, E.; Cattaneo, M.; Redondi, R.; Sallan, J.M. An integrated connection planning and passenger allocation model for low-cost carriers. J. Air Transp. Manag. 2022, 99, 102160. [Google Scholar] [CrossRef]
  11. Suh, D.Y.; Ryerson, M.S. Forecast to grow: Aviation demand forecasting in an era of demand uncertainty and optimism bias. Transp. Res. Part E Logist. Transp. Rev. 2019, 128, 400–416. [Google Scholar] [CrossRef]
  12. O’kelly, M.E. The location of interacting hub facilities. Transp. Sci. 1986, 20, 92–106. [Google Scholar] [CrossRef]
  13. O’Kelly, M.E.; Bryan, D.; Skorin-Kapov, D.; Skorin-Kapov, J. Hub network design with single and multiple allocation: A computational study. Locat. Sci. 1996, 4, 125–138. [Google Scholar] [CrossRef]
  14. Contreras, I.; Cordeau, J.F.; Laporte, G. Stochastic uncapacitated hub location. Eur. J. Oper. Res. 2011, 212, 518–528. [Google Scholar] [CrossRef]
  15. Tiwari, R.; Jayaswal, S.; Sinha, A. Competitive hub location problem: Model and solution approaches. Transp. Res. Part B Methodol. 2021, 146, 237–261. [Google Scholar] [CrossRef]
  16. O’Kelly, M.E.; Bryan, D. Interfacility interaction in models of hub and spoke networks. J. Reg. Sci. 2002, 42, 145–164. [Google Scholar] [CrossRef]
  17. Racunica, I.; Wynter, L. Optimal location of intermodal freight hubs. Transp. Res. Part B Methodol. 2005, 39, 453–477. [Google Scholar] [CrossRef]
  18. Barnhart, C.; Cohn, A. Airline schedule planning: Accomplishments and opportunities. Manuf. Serv. Oper. Manag. 2004, 6, 3–22. [Google Scholar] [CrossRef]
  19. Lohatepanont, M.; Barnhart, C. Airline schedule planning: Integrated models and algorithms for schedule design and fleet assignment. Transp. Sci. 2004, 38, 19–32. [Google Scholar] [CrossRef]
  20. Belobaba, P. Air Travel Demand and Airline Seat Inventory Management. Ph.D. Thesis, Massachusetts Institute of Technology, Cambridge, MA, USA, 1987. [Google Scholar]
  21. Talluri, K.; Van Ryzin, G. An analysis of bid-price controls for network revenue management. Manag. Sci. 1998, 44, 1577–1593. [Google Scholar] [CrossRef]
  22. Hsiao, C.Y.; Hansen, M. A passenger demand model for air transportation in a hub-and-spoke network. Transp. Res. Part E Logist. Transp. Rev. 2011, 47, 1112–1125. [Google Scholar] [CrossRef]
  23. Wei, K.; Vaze, V.; Jacquillat, A. Airline timetable development and fleet assignment incorporating passenger choice. Transp. Sci. 2020, 54, 139–163. [Google Scholar] [CrossRef]
  24. Birolini, S.; Jacquillat, A.; Cattaneo, M.; Antunes, A.P. Airline Network Planning: Mixed-integer non-convex optimization with demand–supply interactions. Transp. Res. Part B Methodol. 2021, 154, 100–124. [Google Scholar] [CrossRef]
  25. Franke, M. Network design strategies. In Airline Operations; Routledge: London, UK, 2017; pp. 44–60. [Google Scholar]
  26. De Neufville, R. Low-cost airports for low-cost airlines: Flexible design to manage the risks. In Low Cost Carriers; Routledge: London, UK, 2017; pp. 163–196. [Google Scholar]
  27. Dobruszkes, F. An analysis of European low-cost airlines and their networks. J. Transp. Geogr. 2006, 14, 249–264. [Google Scholar] [CrossRef]
  28. De Wit, J.G.; Zuidberg, J. The growth limits of the low cost carrier model. In Low Cost Carriers; Routledge: London, UK, 2017; pp. 383–390. [Google Scholar]
  29. Fageda, X.; Suau-Sanchez, P.; Mason, K.J. The evolving low-cost business model: Network implications of fare bundling and connecting flights in Europe. J. Air Transp. Manag. 2015, 42, 289–296. [Google Scholar] [CrossRef]
  30. Wu, C.; Liao, M.; Zhang, Y.; Luo, M.; Zhang, G. Network development of low-cost carriers in China’s domestic market. J. Transp. Geogr. 2020, 84, 102670. [Google Scholar] [CrossRef]
  31. Franke, M. Competition between network carriers and low-cost carriers—retreat battle or breakthrough to a new level of efficiency? J. Air Transp. Manag. 2004, 10, 15–21. [Google Scholar] [CrossRef]
  32. Lordan, O. Study of the full-service and low-cost carriers network configuration. J. Ind. Eng. Manag. (JIEM) 2014, 7, 1112–1123. [Google Scholar] [CrossRef]
  33. Pearson, J.; O’Connell, J.F.; Pitfield, D.; Ryley, T. The strategic capability of Asian network airlines to compete with low-cost carriers. J. Air Transp. Manag. 2015, 47, 1–10. [Google Scholar] [CrossRef]
  34. Pels, E. Airline network competition: Full-service airlines, low-cost airlines and long-haul markets. Res. Transp. Econ. 2008, 24, 68–74. [Google Scholar] [CrossRef]
  35. Yang, T.H.; Huang, Y. Hub-and-spoke airline network design under competitive market. J. Ind. Prod. Eng. 2015, 32, 186–195. [Google Scholar] [CrossRef]
  36. Lee, J.; Marla, L.; Jacquillat, A. Dynamic disruption management in airline networks under airport operating uncertainty. Transp. Sci. 2020, 54, 973–997. [Google Scholar] [CrossRef]
  37. Yang, T.H. A two-stage stochastic model for airline network design with uncertain demand. Transportmetrica 2010, 6, 187–213. [Google Scholar] [CrossRef]
  38. Wang, Z.; Qi, M. Robust service network design under demand uncertainty. Transp. Sci. 2020, 54, 676–689. [Google Scholar] [CrossRef]
  39. Bauschert, T.; Büsing, C.; D’Andreagiovanni, F.; Koster, A.M.; Kutschka, M.; Steglich, U. Network planning under demand uncertainty with robust optimization. IEEE Commun. Mag. 2014, 52, 178–185. [Google Scholar] [CrossRef]
  40. De Koning, M.; Santos, B.F. Fleet Planning Under Demand Uncertainty: A Reinforcement Learning Approach; Technical report; Delft University of Technology: Delft, The Netherlands, 2020. [Google Scholar]
  41. Ben-Akiva, M.E.; Lerman, S.R. Discrete Choice Analysis: Theory and Application to Travel Demand; MIT Press: Cambridge, MA, USA, 1985; Volume 9. [Google Scholar]
  42. Kleywegt, A.J.; Shapiro, A.; Homem-de Mello, T. The sample average approximation method for stochastic discrete optimization. SIAM J. Optim. 2002, 12, 479–502. [Google Scholar] [CrossRef]
  43. King, A.J.; Wallace, S.W. Modeling with Stochastic Programming; Springer: New York, NY, USA, 2012; Volume 4. [Google Scholar]
  44. OAG. Official Airline Guide. 2025. Available online: https://www.oag.com/flight-data-sets (accessed on 10 June 2025).
  45. Birolini, S.; Cattaneo, M.; Malighetti, P.; Morlotti, C. Integrated origin-based demand modeling for air transportation. Transp. Res. Part E Logist. Transp. Rev. 2020, 142, 102050. [Google Scholar] [CrossRef]
  46. Serrano, F.; Kazda, A. The future of airports post COVID-19. J. Air Transp. Manag. 2020, 89, 101900. [Google Scholar] [CrossRef]
  47. Macilree, J.; Duval, D.T. Aeropolitics in a post-COVID-19 world. J. Air Transp. Manag. 2020, 88, 101864. [Google Scholar] [CrossRef]
  48. Bulchand-Gidumal, J.; Melián-González, S. Post-COVID-19 behavior change in purchase of air tickets. Ann. Tour. Res. 2021, 87, 103129. [Google Scholar] [CrossRef]
Figure 1. An example of connecting flights.
Aerospace 12 00574 g001
Figure 2. Schematic diagram of scenario generation (Stage 1).
Aerospace 12 00574 g002
Figure 3. Potential connection itineraries in Spring Airlines’ network.
Aerospace 12 00574 g003
Figure 4. Illustration of data expansion using a sliding time window.
Aerospace 12 00574 g004
Figure 5. Activated airports and itineraries under ICPPAM and UICPPAM.
Aerospace 12 00574 g005
Figure 6. Relative mean and standard deviation errors across different bin counts.
Aerospace 12 00574 g006
Figure 7. Load factor stability comparison under varying numbers of activated transfer airports.
Aerospace 12 00574 g007
Figure 8. Comparison of the revenue under different models across demand scenarios.
Aerospace 12 00574 g008
Table 1. Model notation.
NotationDescription
Sets
F Set of flights operated by the target airline, indexed by f
I Set of itineraries available to the target airline, indexed by i
M Set of markets, indexed by m
A Set of airports served by the target airline, indexed by a
H Set of candidate transfer airports, indexed by h
K Set of flight capacity, indexed by k f
I n s Subset of nonstop itineraries, indexed by i, I n s I
I c t Subset of connecting (one-stop) itineraries, indexed by i, I c t I
I f Subset of itineraries containing flight f, I f I
I m Subset of itineraries in market m, indexed by i, I m I
I h Subset of connecting itineraries via transfer airport h, indexed by i, I h I
I c t s e l f Subset of self-hubbing itineraries, indexed by i, I c t s e l f I c t
I c t o p Subset of handled itineraries, indexed by i, I c t o p I c t
I c t f Subset of connecting itineraries with flight f as the first leg, indexed by i, I c t f I c t
Parameters
p i Average price of itineraries i
k f Capacity (number of seats) available on flight f, k f K
d m ˜ Total demand in market m, as a random parameter; equals d m in the deterministic case
θ i Attractiveness of itinerary i
θ m c m Aggregate attractiveness of the outside option in market m
c h f i x Activation costs defined for each transfer airport h
c i v a r Per passenger operating costs for one-stop handle itineraries, i I c t o p
Decision variables
w h Binary variables, where 1 indicates transfer airport h H is activated, and 0 otherwise.
y i Binary variables, where 1 indicates itinerary i I is operated, and 0 otherwise.
x m c m Market share captured by the outside option
x i Market share on itinerary i
Table 2. Results under different models.
ModelApt ( Ω )Apt Δ Rev ($) Δ Rev (%)AC (AC/PC) Δ Pax (%)
NonstopOne-Stop
ICPPAM1ZBSJ2.891.62%43 (8.0%)−1.37%
2ZSPD2.161.19%104 (19.3%)−1.31%+60.7%
3ZSYA2.121.15%127 (23.5%)−1.05%+41.2%
4ZLXY1.951.05%130 (24.1%)−1.37%+26.6%
5ZSSH1.460.78%141 (26.1%)−0.28%+11.8%
6ZGOW1.250.66%143 (26.5%)−0.50%+13.0%
7ZUZY1.210.64%143 (26.5%)−0.43%+9.3%
8ZSSS0.870.46%162 (30.0%)−0.51%+8.3%
9ZGCD0.780.40%167 (30.9%)−0.35%+6.3%
10ZSCN0.530.27%168 (31.1%)−0.33%+3.6%
UICPPAM1ZBSJ2.571.62%50 (9.3%)−2.65%
2ZLXY1.911.20%54 (10.0%)−1.53%+45.8%
3ZSYA1.781.09%75 (13.9%)−1.02%+31.4%
4ZSPD1.731.05%193 (35.7%)−4.73%+51.8%
5ZSSH1.170.70%203 (37.6%)−1.01%+12.5%
6ZUZY1.080.64%205 (38.0%)−0.58%+9.1%
7ZGOW0.910.53%219 (40.6%)−0.90%+7.8%
8ZGCD0.740.43%224 (41.5%)−0.37%+5.2%
9ZSSS0.670.39%257 (47.6%)−1.10%+6.4%
10ZSNB0.540.31%268 (49.6%)−0.65%+4.2%
Table 3. Aggregated relative error summary.
Error TypeMean (%)Max (%)95th Percentile (%)
Mean Error1.3759.913.98
Std Error6.12135.5115.19
25th Quantile Error2.0469.209.36
50th Quantile Error2.7366.517.20
75th Quantile Error1.6562.256.17
Table 4. Examples of flight connection activation failures.
Case1st Leg d m x i Pax k f 2nd Leg d m x i Pax k f AC Status
1ZYTL–ZSPD
(CQH8592)
95,1975.4%51405022ZSPD–ZUCK
(CQH6107)
15,5034.1%635-failed
ZSPD–VYYY
(CQH6243)
25220.4%51-
2ZYTL–ZSPD
(CQH8592)
82,2985.4%44445022ZSPD–ZUCK
(CQH6107)
15,7424.1%645-failed
ZSPD–VYYY
(CQH6243)
23420.4%48-
3ZYTX–ZBSJ
(CQH8575)
236677.1%1824ZBSJ–ZBOW
(CQH8617)
12,75742.4%54085022failed
ZSAM–ZBSJ
(CQH8976)
167517.6%295
4ZYTX–ZBSJ
(CQH8575)
223477.1%1729ZBSJ–ZBOW
(CQH8617)
801842.4%34005022failed
ZSAM–ZBSJ
(CQH8976)
154617.6%272
Disclaimer/Publisher’s Note: The statements, opinions and data contained in all publications are solely those of the individual author(s) and contributor(s) and not of MDPI and/or the editor(s). MDPI and/or the editor(s) disclaim responsibility for any injury to people or property resulting from any ideas, methods, instructions or products referred to in the content.

