
Lessons Learned from Official Airline Reports of Onboard Fumes and Smoke

Abstract
1. Introduction
2. Materials and Methods
2.1. Identified the Subset of Relevant SDRs
2.2. Reviewed and Classified the Type and Source of Fumes/Smoke
2.3. Calculated Proportions of Fume Events/Other SOFs Reports by Aircraft Type (2018–2023)
2.4. Summarized Phases of Flight for Fume Events (2018–2023)
2.5. Identified Repeat Fume Events on A320fam and B737fam Aircraft (2018–2023)
3. Results
3.1. Reviewed and Classified Type and Source of Fumes/Smoke (2018–2023)
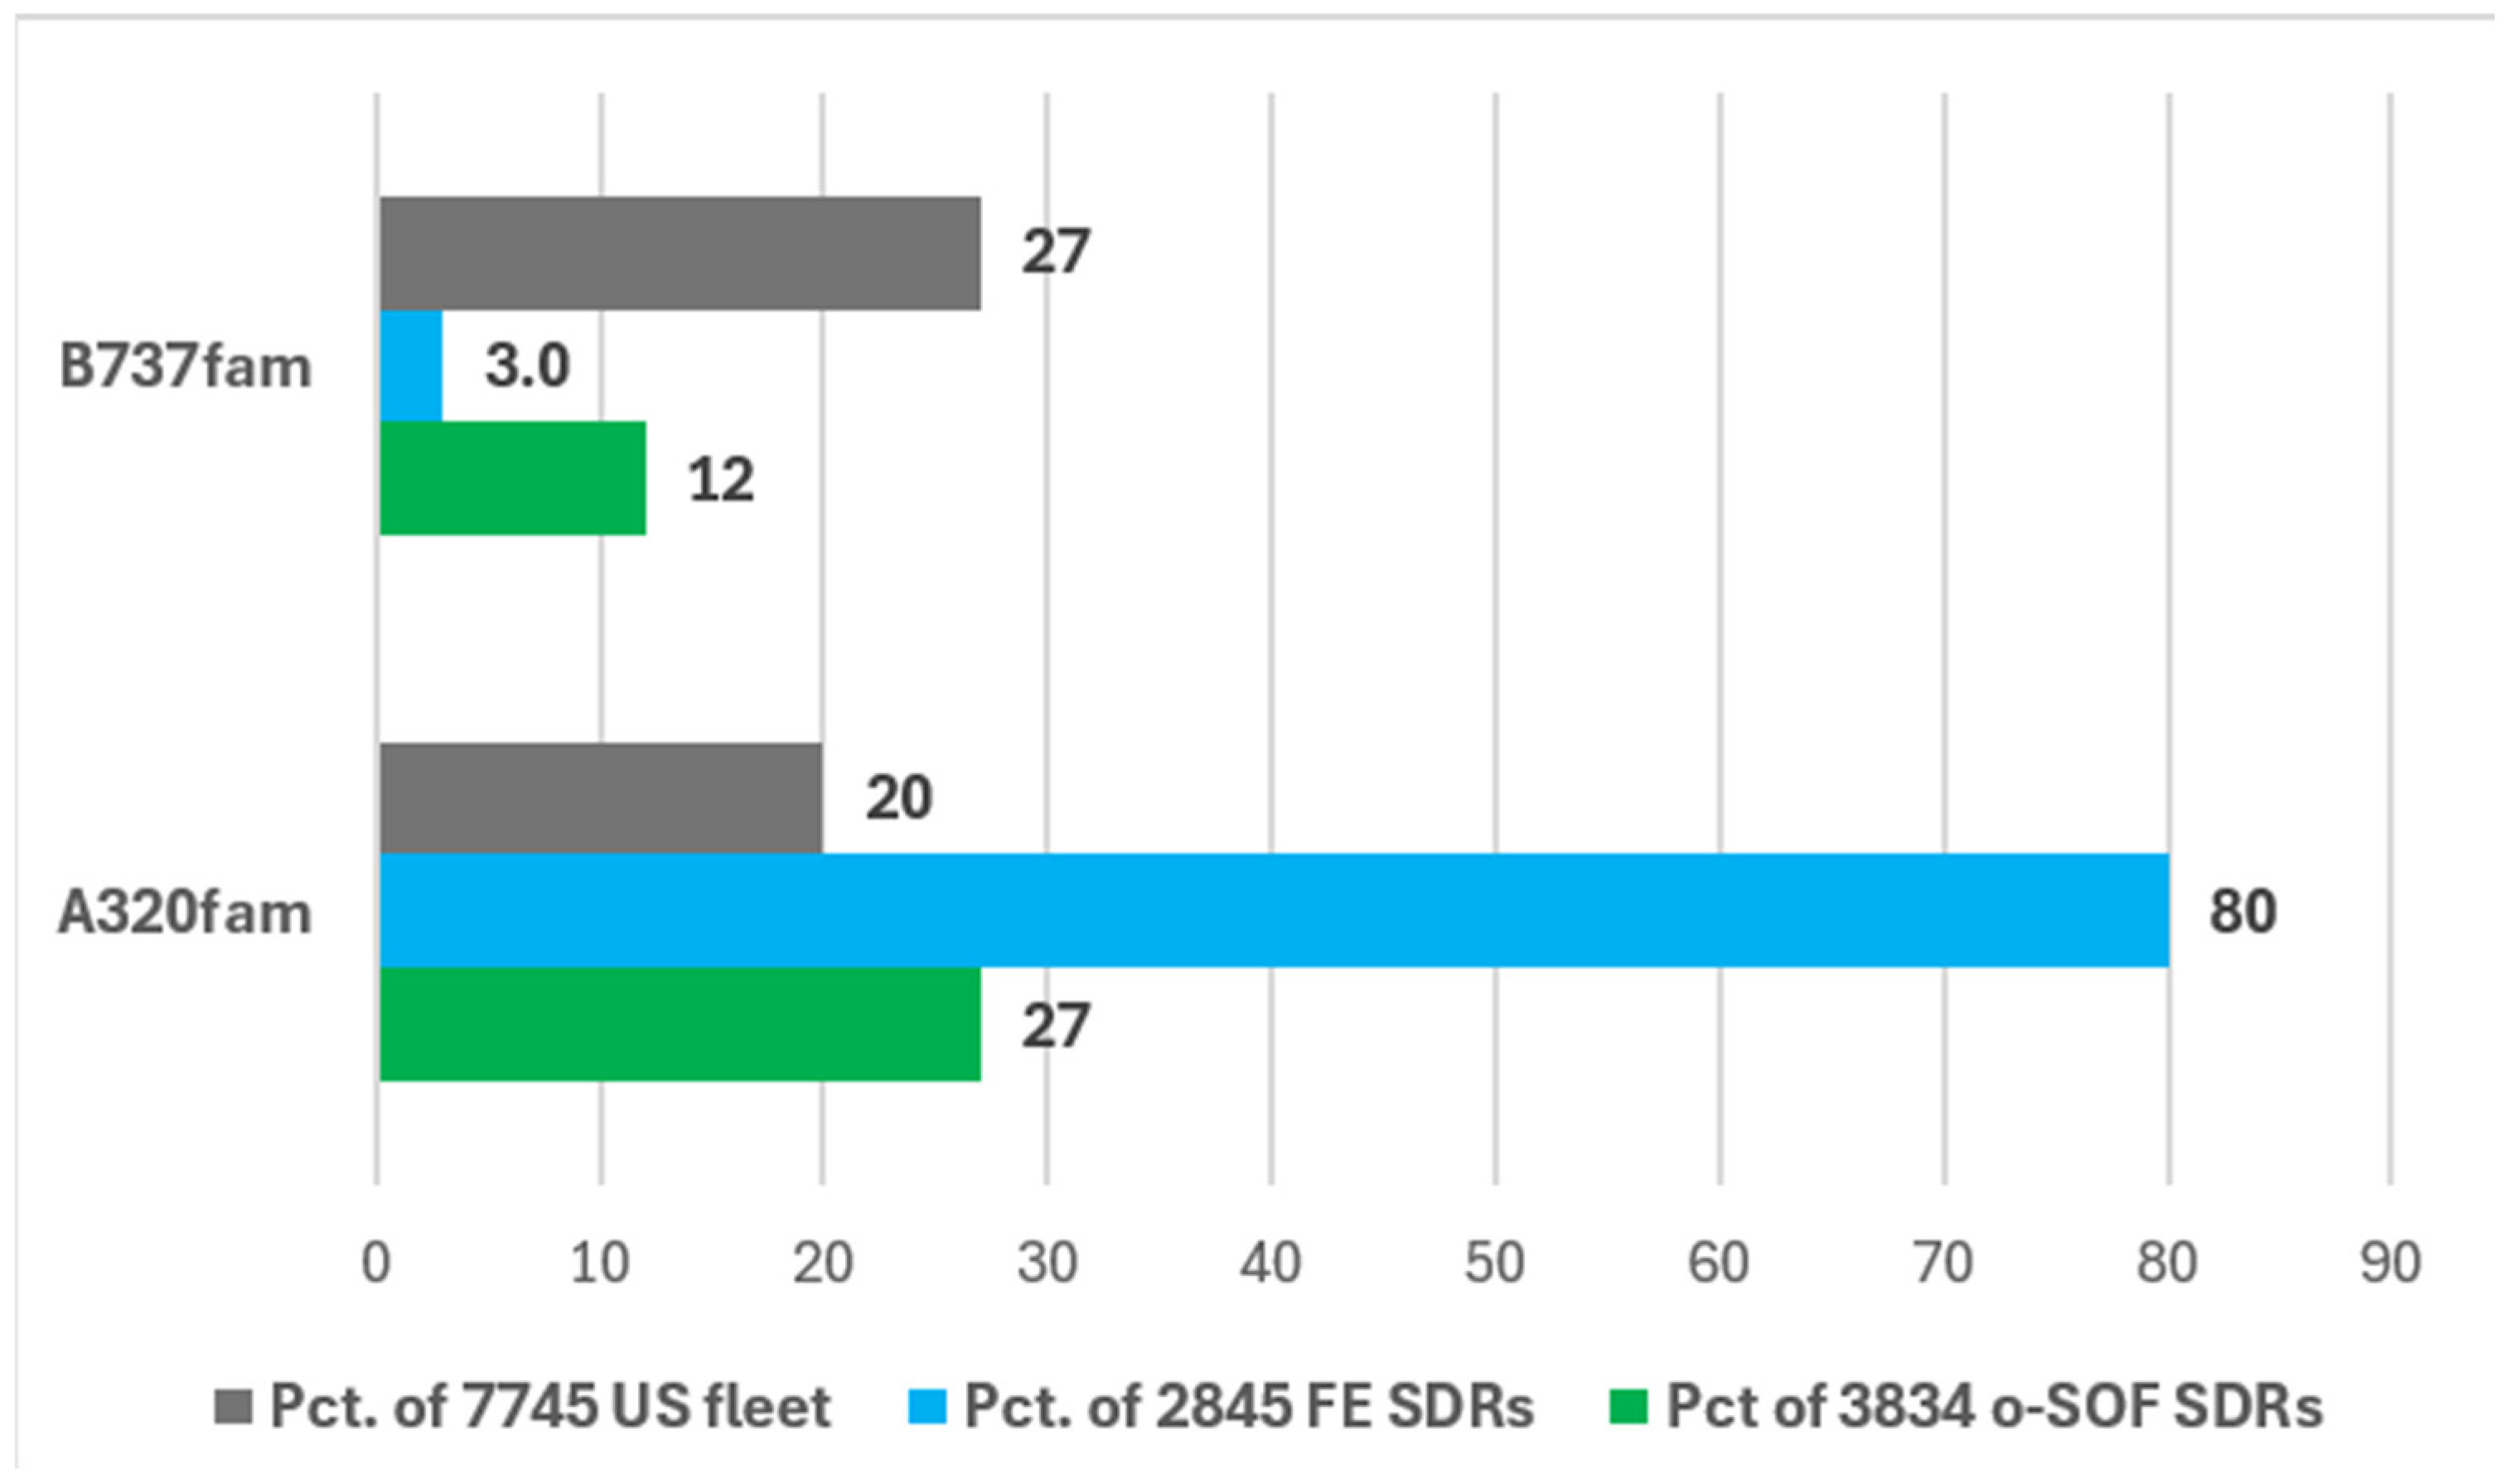
3.2. Calculated Proportions of SOFs Events and Fume Events by Aircraft Type (2018–2023)
3.3. Summarized Phases of Flight for Fume Events (2018–2023)
3.4. Identified Repeat Fume Events on A320fam and B737fam Aircraft (2018–2023)
4. Discussion
4.1. Overview
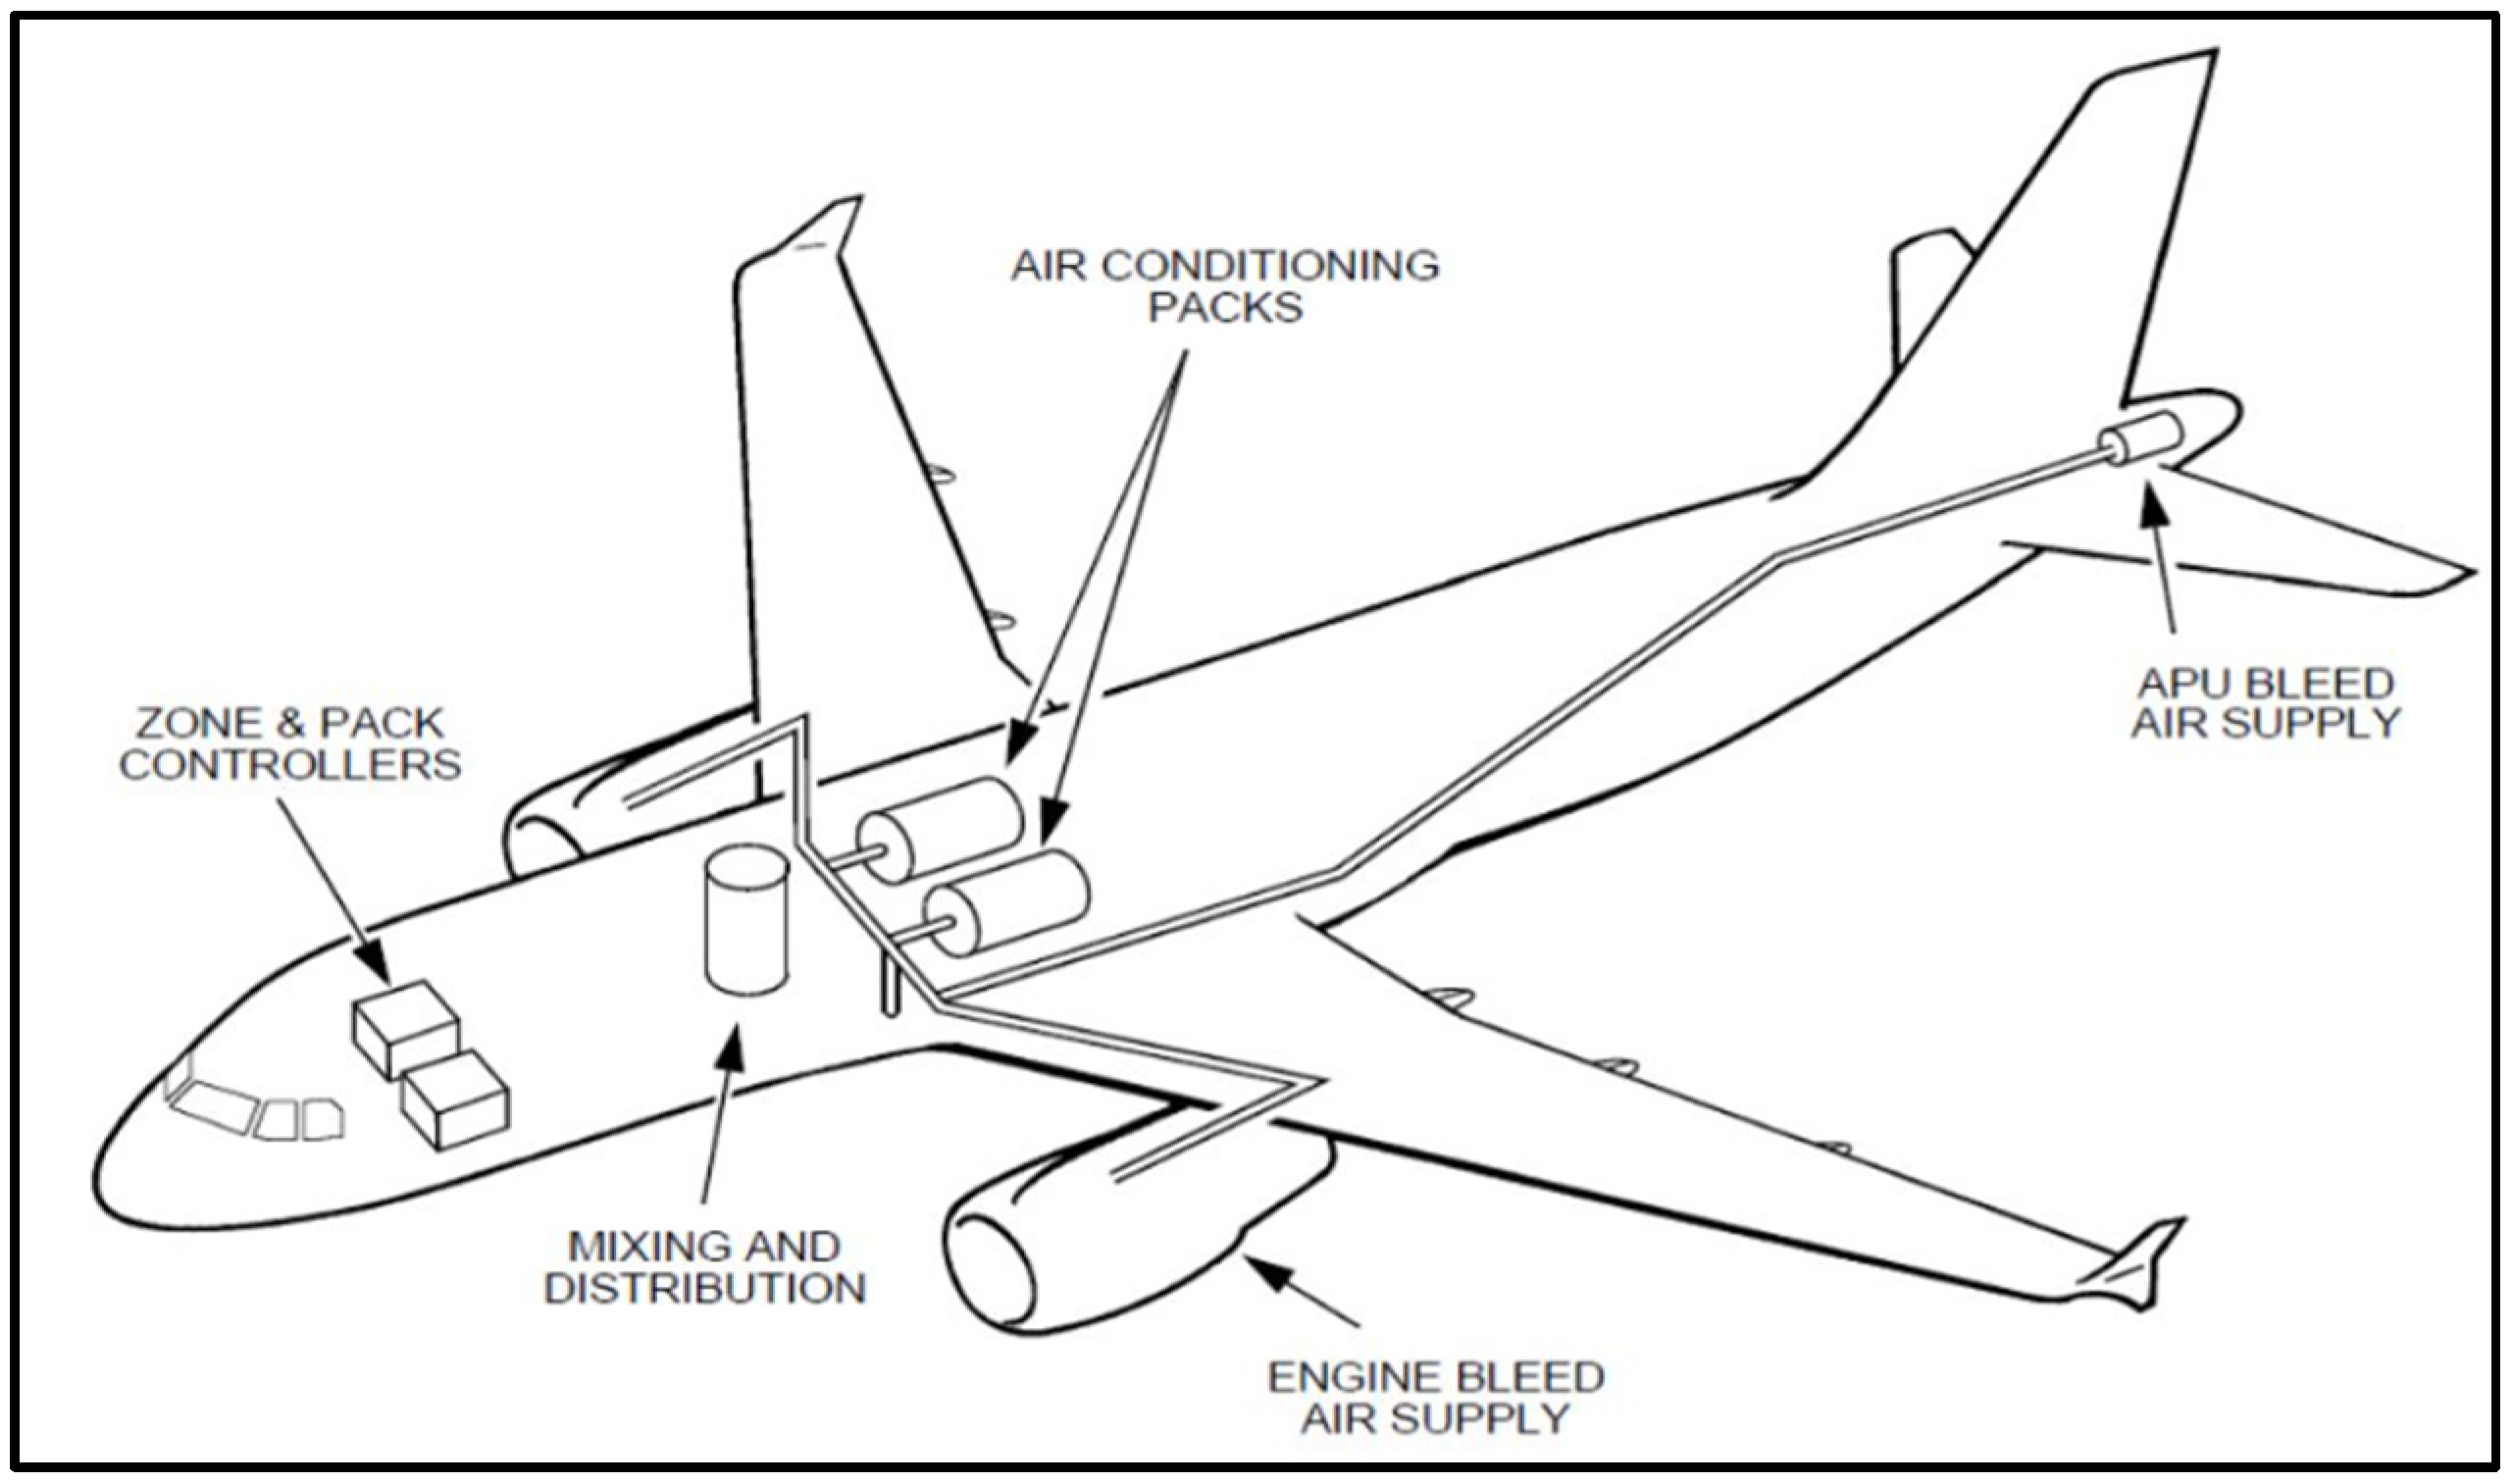
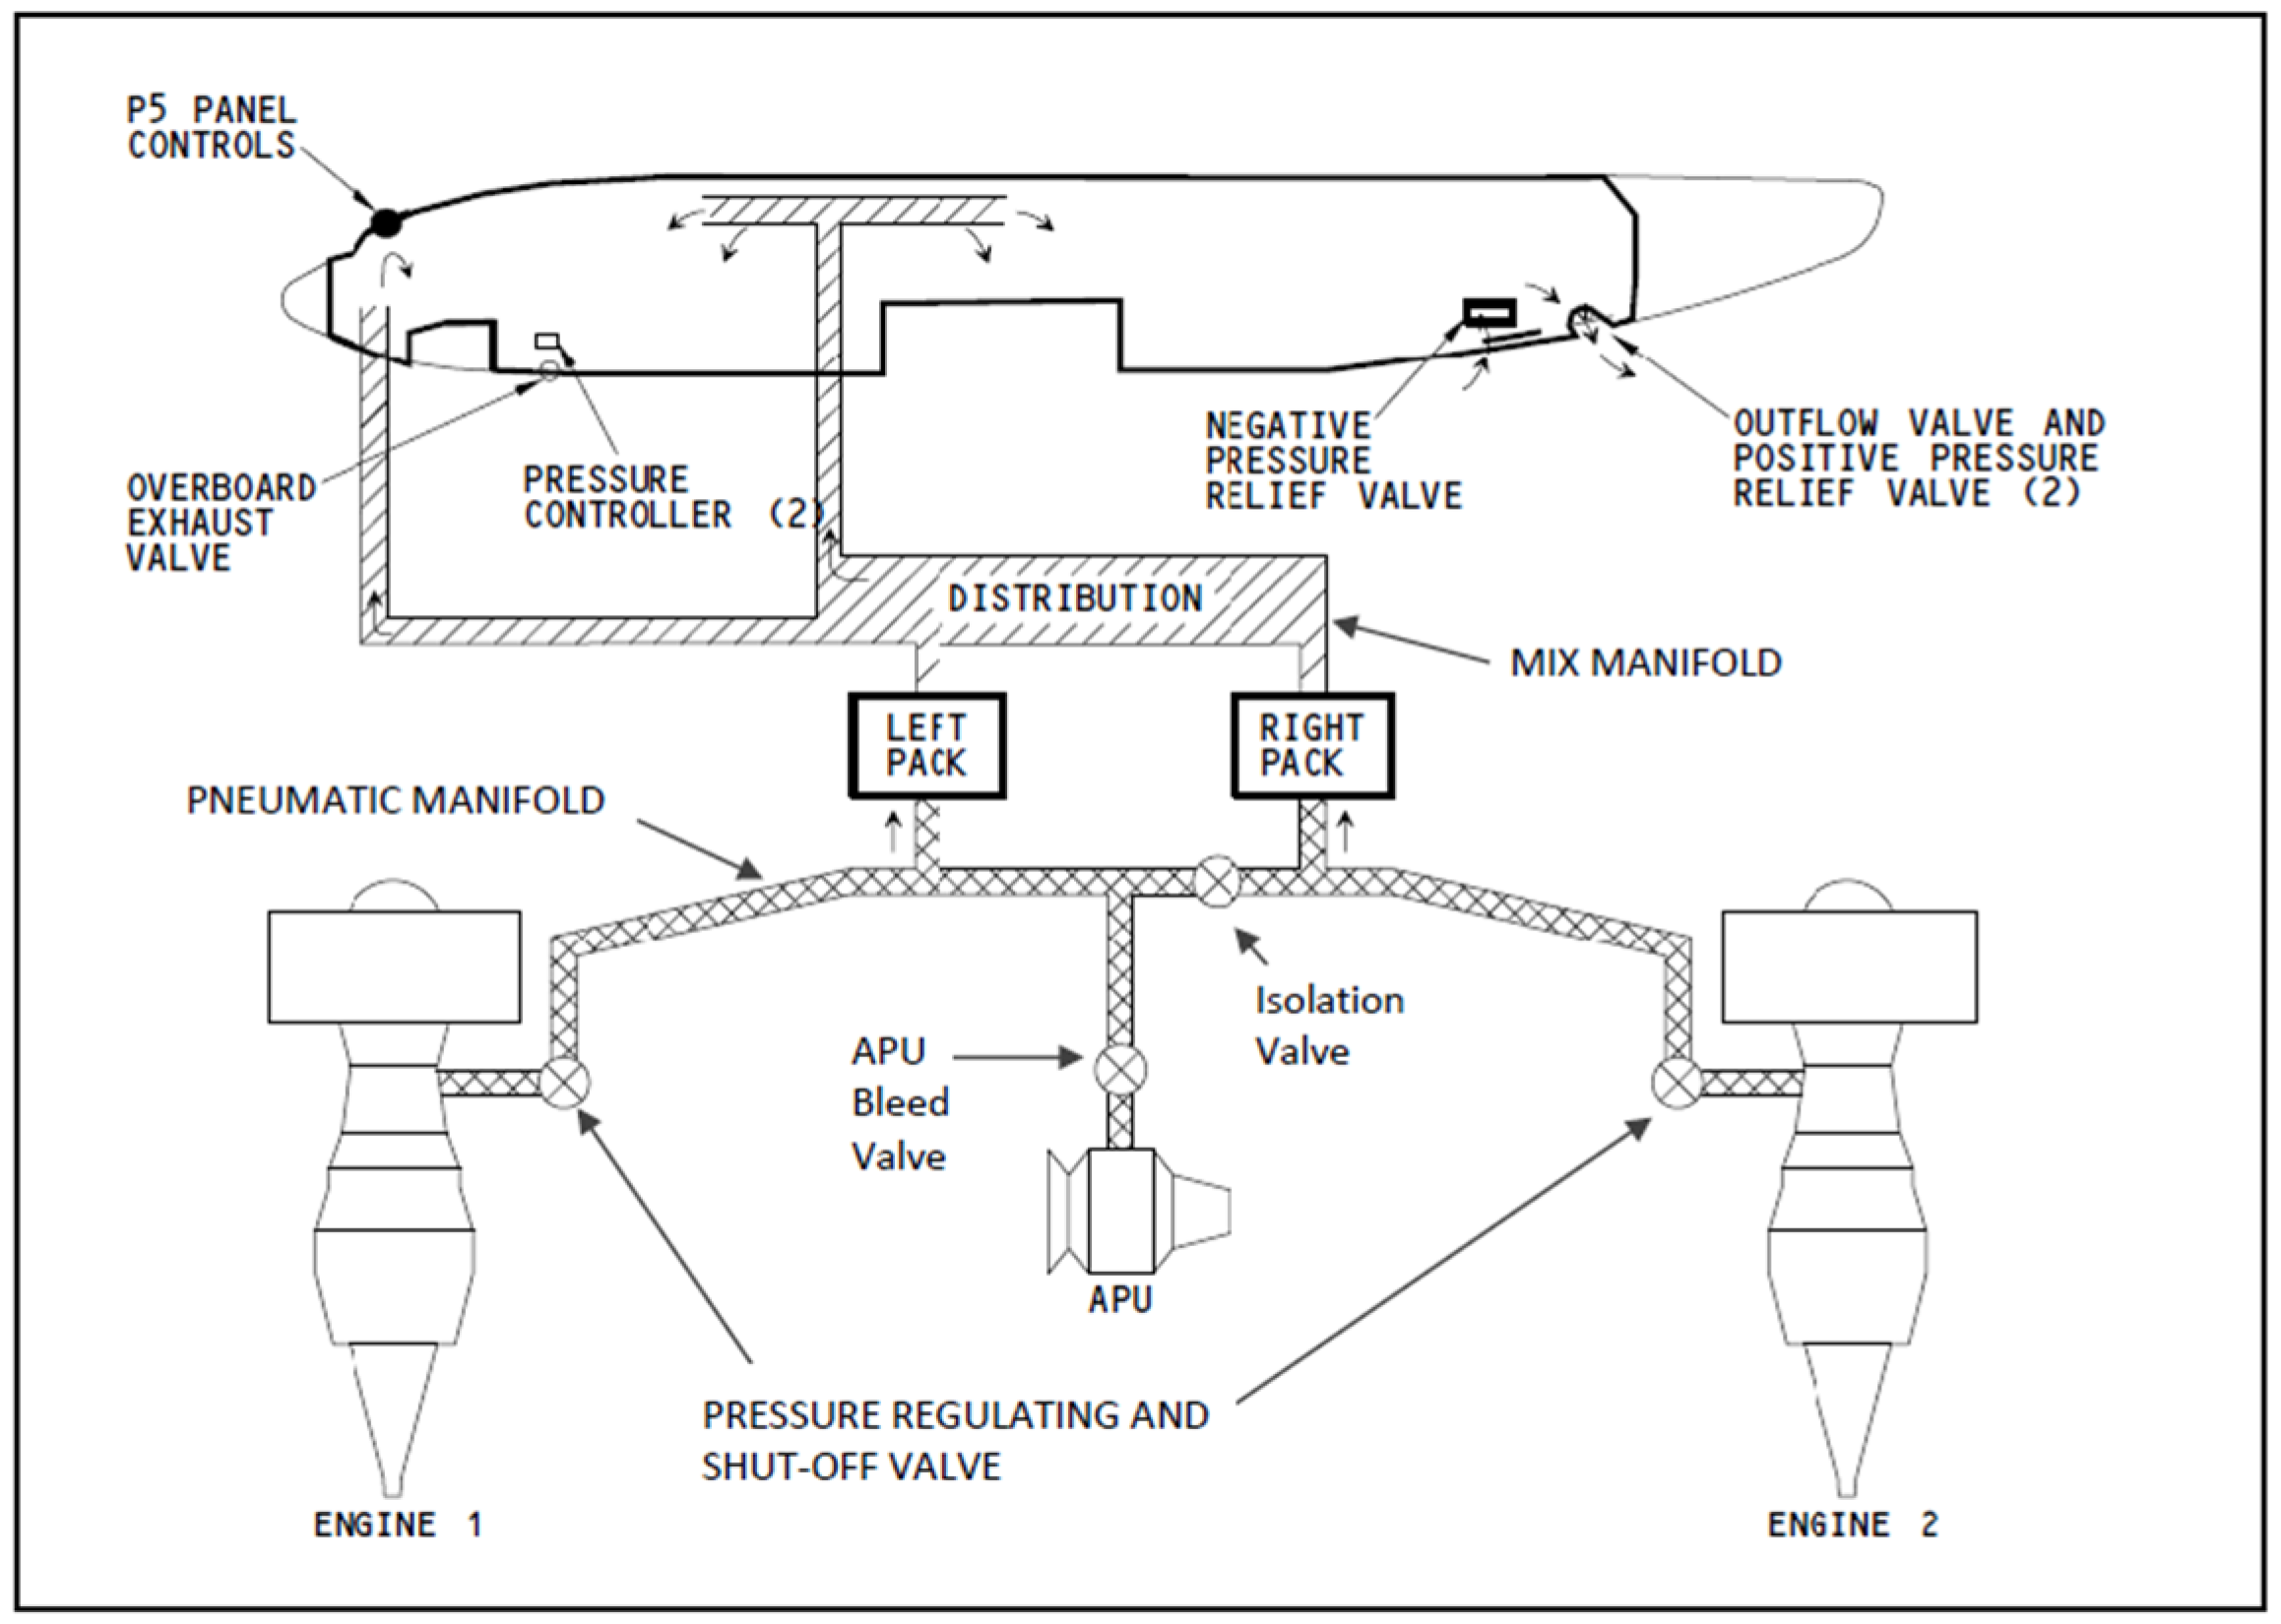
4.2. Design Features of All Bleed Air Ventilation Systems, Including A320fam and B737fam
4.2.1. Compressor Seals and Other APU/Engine Components Can Leak (Function of Design)
4.2.2. Fluid Residues Become Secondary Sources of Fumes (Function of Design)
4.2.3. Difficult to Reproduce a Fume Event on the Ground (Function of Design)
4.3. Comparison of B737fam and A320fam Fume Event Data
4.3.1. Comparison of Relevant Design Features on A320fam and B737fam
4.3.2. Comparison of Maintenance Procedures on A320fam and B737fam
4.3.3. Comparison of Fume Event Reporting Norms and Practices
5. Conclusions
6. Limitations
Supplementary Materials
Funding
Data Availability Statement
Acknowledgments
Conflicts of Interest
Abbreviations
| A320fam | Airbus 320 family aircraft (A319, A320, A321 including neo and ceo) |
| AMM | Aircraft Maintenance Manual |
| APU | Auxiliary Power |
| B737fam | Boeing 737 family aircraft (B737 next generation and MAX) |
| BTS | Bureau of Transportation Statistics |
| ceo | Classic engine option |
| CWFE | Consistent with a fume event |
| ECS | Environmental control system |
| FAA | Federal Aviation Administration |
| FE | Fume event |
| MEL | Minimum equipment list |
| N | Number |
| neo | New engine option |
| o-SOF | Other sources of SOF (i.e., other than oil and hydraulic fluid) |
| S/F/FL | Smoke/fume/fluid loss |
| SOFs | Smoke, odor, fumes |
| SDR | Service Difficulty Reporting |
Appendix A

| Type of Fumes/Smoke | Description of Criteria |
|---|---|
| ACM smoke | “ACM” (air cycle machine) faults or failures are often characterized by smoke, vibration, and/or a loud noise, as well as problems in regulating the onboard temperature. After an ACM fault or failure, the unit is usually removed and replaced. |
| Battery | “Battery” includes smoke or fumes generated by faulty/overheated onboard batteries and from faulty/overheated lithium-ion batteries brought on board as carry-on items. |
| Bird | “Bird” includes reports of birds being ingested into one or both engines during flight. |
| Bleed * | “Bleed” includes reports consistent with either engine oil or hydraulic fluid fumes with sufficient detail to be confident that it is one or the other but insufficient detail to be certain which one. The reports cite a distinct/strong odor sourced to the air supply vents and a reference to engine power (e.g., idle, full power, start) and/or phases of flight (e.g., climb, descent), often followed by decontamination of the ECS (“pack burn”). |
| CWFE ** | “Consistent with fume event” includes reports with a distinct odor sourced to the air supply vents, which is often described as “burning”, “hot plastic”, or “hot rubber”. The description of conditions is insufficient to assign the event to the bleed category but the details are consistent with a fume event, such as the timing of the fumes relative to changing engine/APU power, phase(s) of flight, the location(s) in cabin/flight deck, the maintenance troubleshooting procedures, or the remedial actions (e.g., pack burn, remove and replace (R&R) coalescer bag, R&R ozone converter, etc.). This category represents another datapoint on the spectrum of certainty with which fume events were classified. |
| Deicing | “Deicing” primarily includes reports of ingestion of deicing fluid into the APU inlet and bleed air stream when the APU is accidentally turned on during a deicing operation. Deicing fluid can also seep through aircraft door seals when the fluids are sprayed against them, especially at high pressure. |
| Duct-related | “Duct-related” includes materials such as grease or insulation fibers that enter the supply air when a duct ruptures or is damaged. |
| Electrical | “Electrical” includes reports that reference an electrical odor and/or description of a confirmed electrical fault such as a faulty light ballast, windshield heater, inflight entertainment system, or galley equipment. This does not include burned food, faulty ovens, or fans. |
| Fan | “Fan” includes failures or malfunctions of a variety of fans, especially the recirculated air fans in the air supply system. The faults can be electrical (e.g., overheated or failed component) or mechanical (faulty or worn bearings). |
| Fuel/exhaust | “Fuel” and “exhaust” are grouped together and include fumes from fueling operations and exhaust fumes from the aircraft, other aircraft, and ground-based air conditioning carts and service vehicles at airports. |
| Hydraulic fluid | “Hydraulic fluid” includes reference to hydraulic fluid ingestion into the APU inlet (especially if it is located on the aircraft belly), which can contaminate the APU-supplied bleed air and soil the air supply ducting upstream and downstream of the compressor. The fluid may be from the landing gear or from other fluid leaks or spills that streak across the fuselage and can be ingested. Hydraulic fluid fumes typically do not contaminate bleed air supplied by the propulsion engines because there is no obvious path for hydraulic fluid to be ingested into the engine intakes. However, hydraulic fluid fumes can manifest inflight from previously deposited residues on ducts and pack components. |
| Lavatory | “Lavatory” includes fluid spillage or blockage in the lavatory supply and sewage systems, including blue fluid, wastewater, and human waste. |
| Oil | “Oil” includes reports with a reference to the smell of “dirty socks”, “oil”, or “musty”, and with onboard conditions consistent with bleed air contamination, such as fumes onset during an engine power setting change, worse on takeoff and climb, subsides during cruise, returns on descent. Other factors include the reported location(s) of the fumes in the cabin/flight deck in the context of the ECS configuration and whether maintenance troubleshooting actions are consistent with oil fumes; this is often followed by a “pack burn” procedure intended to remove residues on ducts and air conditioning packs. |
| Oven | “Oven” faults or failures will be electrical in nature, but this category stands alone because its maintenance response is narrow and defined. If the oven is at fault, then it is often removed and replaced. This category does not include burned food or coffee. |
| Other | “Other” includes miscellaneous faults such as clogged water lines, lightning strikes, dirty residue on compressor blades before an engine wash, cracked heat exchangers, coolant leaks, and cargo. |
| Don’t know | “Don’t know” includes reports either with insufficient details to make a judgment or unfamiliar parts/faults. |
| Not applicable | “Not applicable” reports were removed from the original downloaded dataset because the narrative fields included a reference to either smoke or fumes, but without either smoke or fumes being present onboard (e.g., “ground crew reports smoke pouring from right engine” or “smoke detector batteries need to be replaced”). |
| Source | Description |
|---|---|
| APU leak, fault, fail (primary source) | Oil can seep through APU compressor seals when the pressure differential across the seal is insufficient to keep the oil out of the bleed air, as well as when the seal is worn, failed, or has accumulated coked oil around its face. Moreover, leaks from other APU components, such as the oil cooling fan and various valves, can also be ingested into the APU bleed air in a variety of ways, depending on the aircraft system design. If the APU oil reservoir is overserviced, then the excess oil can contaminate the APU/compartment, which can enter the APU bleed air stream. If oil in the APU compartment is improperly drained, it can be re-ingested into the APU inlet with some designs. Hydraulic fluid leaks and spills may be ingested into the APU inlet. |
| Engine leak, fault, fail (primary source) | Oil can seep through engine compressor seals when the pressure differential across the seal is insufficient to keep the oil out of the bleed air, as well as when the seal is worn, failed, or has accumulated coked oil around its face. Oil leaks from other engine components may also enter the bleed air, depending on the aircraft system design. If the engine oil reservoir is overserviced, then the excess oil may contaminate the engine bleed air stream. Hydraulic fluid is unlikely to enter the engine bleed air, so it should not be the primary source of these fumes. |
| Duct/pack residues (secondary source) | Contaminated duct and pack surfaces can be secondary sources of fumes. The network of ventilation ducts has these four components: (1) A section of pressurized duct carries bleed air from the APU compressor to each of the air conditioning packs; (2) sections of pressurized duct carry bleed air from the compressor in each propulsion engine to its respective air conditioning pack, assuming normal configuration; (3) smaller sections of pressurized duct carry a fraction of the APU and engine bleed air stream referred to as “trim air”. The trim air ducts bypass the packs and allow for small volumes of hot air to be fed into the supply duct for each zone to adjust the temperature in that zone; (4) low-pressure ducts downstream of the air conditioning packs typically carry a mixture of cooled, dehumidified bleed air and recirculated air to the cabin and flight deck, with configurations that vary according to aircraft type and settings. Air conditioning pack surfaces prone to contamination include primary heat exchangers, secondary heat exchangers, and coalescer bags. The components of each pack can also produce fumes or smoke from failures or malfunctions, but these reports are not included in this category. |
| Don’t know if primary or secondary source | There was insufficient information in the event description to determine if the source(s) of the fumes was primary, secondary, or both. |
| Aircraft Type # | Pct. of 7475 in US Fleet | Pct. (N) of 2845 FE SDRs | Ratio of Pct. FE SDRs ÷ Pct. of Fleet | Pct. (N) of 3834 o-SOF SDRs | Ratio of Pct. o-SOF SDRs ÷ Pct. of Fleet |
|---|---|---|---|---|---|
| B737fam | 27 (2035) | 3.0 (85) | 0.11 | 12 (472) | 0.45 |
| A320fam | 20 (1505) | 80 (2272) | 4.0 | 27 (1048) | 1.4 |
| E170/175-e2 | 7.5 (560) | 1.0 (30) | 0.14 | 3.3 (125) | 0.44 |
| B767 | 5.8 (436) | 1.1 (31) | 0.19 | 4.7 (181) | 0.81 |
| B757 | 5.4 (407) | 1.9 (53) | 0.34 | 3.6 (137) | 0.66 |
| CRJ900 * | 3.7 (278) | 0.70 (20) | 0.19 | 3.6 (137) | 0.96 |
| CRJ200 * | 3.5 (263) | 0.42 (12) | 0.12 | 1.6 (60) | 0.44 |
| Cessna208 | 3.3 (245) | 0 (0) | 0 | 0.37 (14) | 0.11 |
| B777 | 3.1 (233) | 0.70 (21) | 0.23 | 3.1 (120) | 1.0 |
| CRJ700-701 * | 2.9 (219) | 0.21 (6) | 0.07 | 2.9 (113) | 1.0 |
| MD80fam | 2.5 (188) | 2.7 (77) | 1.1 | 3.9 (151) | 1.6 |
| ERJ140-145 | 2.3 (170) | 2.1 (61) | 0.94 | 10 (390) | 4.5 |
| B747 | 1.7 (127) | 0.04 (1) | 0.02 | 0.70 (27) | 0.42 |
| A300-310 | 1.6 (122) | 0.39 (11) | 0.24 | 0.44 (17) | 0.27 |
| MD11 | 1.5 (109) | 0.46 (13) | 0.31 | 0.57 (22) | 0.39 |
| B787 | 1.3 (97) | 0 (0) | 0.00 | 1.1 (42) | 0.85 |
| A330 | 1.1 (85) | 1.4 (41) | 1.3 | 1.6 (61) | 1.4 |
| E190-e2 | 0.96 (72) | 0.49 (14) | 0.51 | 0.97 (37) | 1.0 |
| A220 | 0.75 (56) | 0.11 (3) | 0.14 | 0.21 (8) | 0.28 |
| ATR42-72 | 0.71 (53) | 0.04 (1) | 0.05 | 0.26 (10) | 0.37 |
| CRJ550 ** | 0.51 (38) | 0 (0) | 0 | 0 (0) | 0 |
| A350 ** | 0.25 (16) | 0 (0) | 0 | 0 (0) | 0 |
| Dash8 ** | 0.24 (18) | 0.35 (10) | 1.5 | 0.89 (34) | 3.7 |
| DC10 ** | 0.21 (16) | 0 (0) | 0 | 0 (0) | 0 |
| B727 ** | 0.12 (9) | 0 (0) | 0 | 0 (0) | 0 |
| EMB120-ERJ135 ** | 0.06 (5) | 0.39 | 6.4 | 1.7 (67) | 29 |
| Other | 1.5 (115) | 2.5 (72) | 1.7 | 15 (561) | 9.5 |
| Total | 100 (7745) | 100 (2845) | 100 | 100 (3834) | 100 |
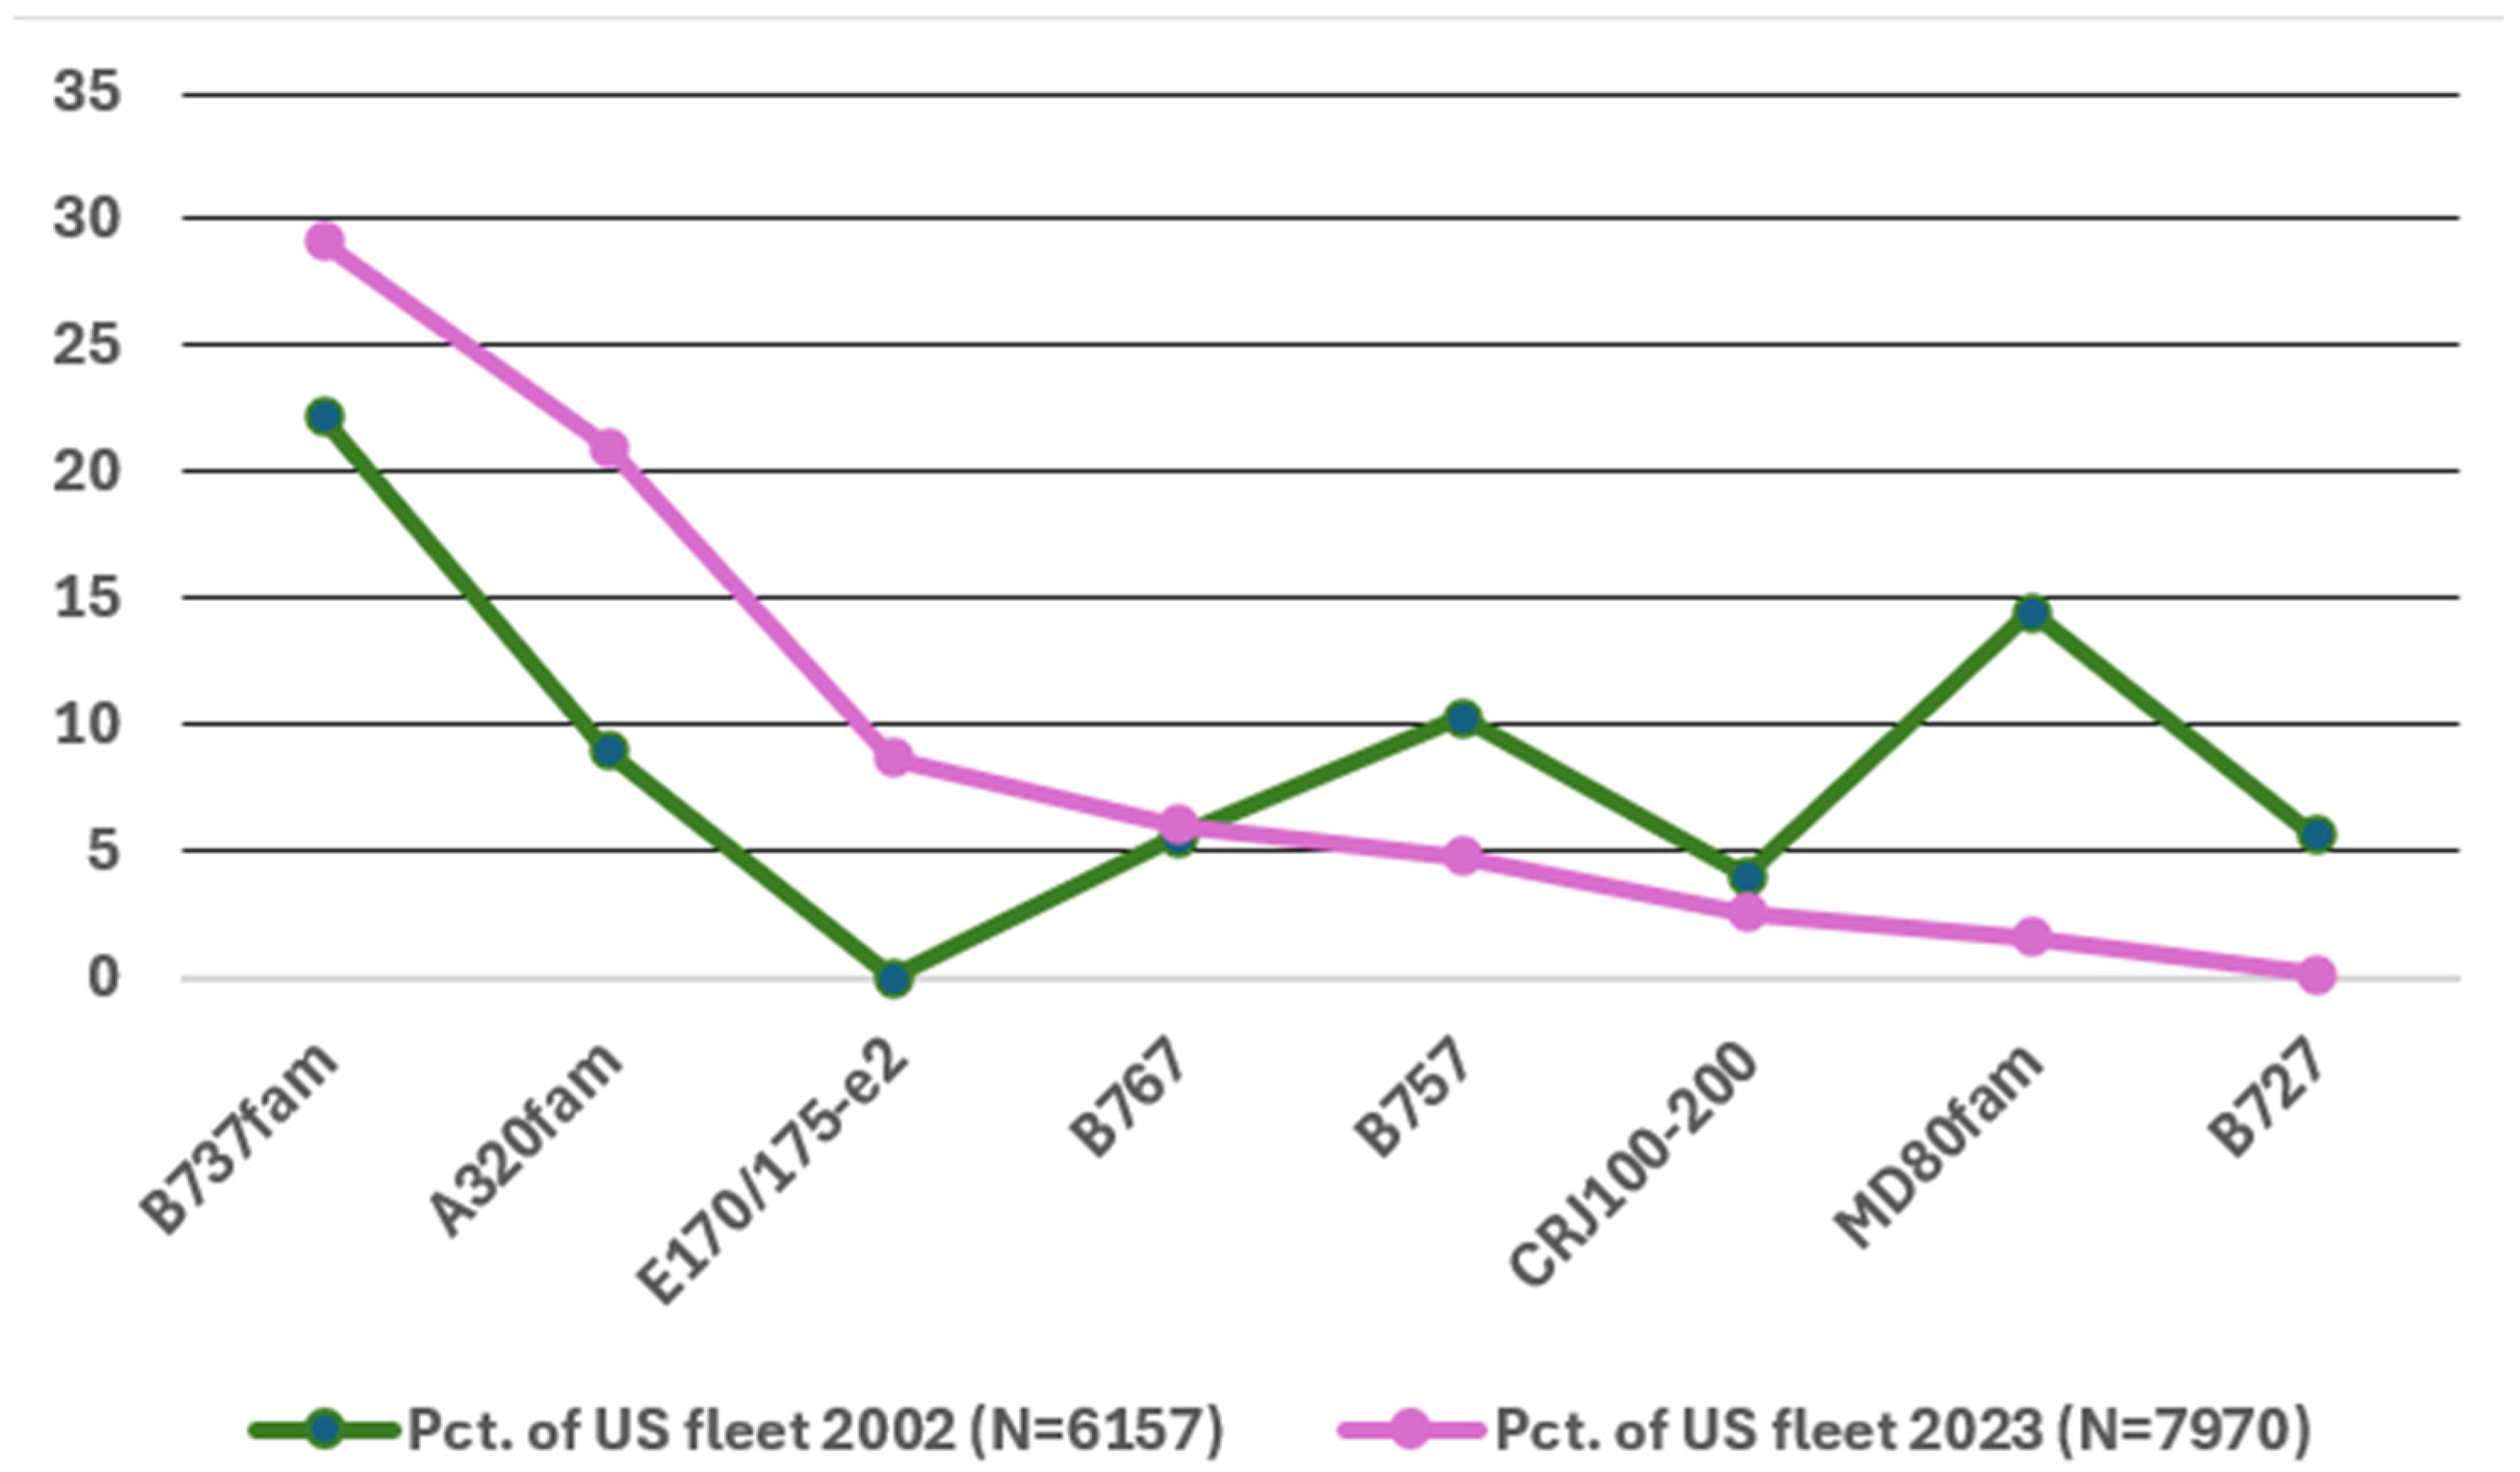
| Aircraft Type | Pct. of US Fleet 2002 (n = 6157) | Pct. of US Fleet 2023 (n = 7970) |
|---|---|---|
| B737fam | 22 | 29 |
| A320fam | 8.9 | 21 |
| E170/175-e2 | 0 | 8.6 |
| B767 | 5.5 | 6.0 |
| B757 | 10 | 4.8 |
| CRJ900 | 0 | 3.4 |
| Cessna208 | 4.2 | 3.2 |
| B777 | 2.1 | 3.0 |
| CRJ700-701 | 0.68 | 2.6 |
| CRJ100-200 | 4.0 | 2.5 |
| B747 | 2.2 | 1.9 |
| ERJ140-145 | 1.6 | 1.8 |
| MD80fam | 14 | 1.6 |
| A300-310 | 2.8 | 1.5 |
| A220 | 0 | 1.4 |
| MD11 | 1.2 | 1.3 |
| B787 | 0 | 1.2 |
| A330 | 0.15 | 1.0 |
| CRJ550 | 0 | 0.74 |
| E190-e2 | 0 | 0.72 |
| ATR42-72 | 1.5 | 0.68 |
| A350 | 0 | 0.35 |
| EMB120-135 | 1.2 | 0.10 |
| B727 | 5.6 | 0.088 |
| Dash8 | 0.70 | 0 |
| DC8 | 1.3 | 0 |
| DC10 | 2.4 | 0 |
| Saab340 | 2.8 | 0 |
| Other | 4.3 | 1.4 |
| Total | 100 | 100 |
References
- Anderson, J. Sources of onboard fumes and smoke reported by US airlines. Aerospace 2021, 8, 122. [Google Scholar] [CrossRef]
- Boeing Airplane Company. Decontamination Program: B-52 Aircraft; Report no.: D-14766-2; Boeing Airplane Company: Seattle, WA, USA, 1953; Available online: https://perma.cc/VA8L-XXV8 (accessed on 1 May 2025).
- Gaume, J. Analytical Considerations Concerned with Cephalagia on the DC-10 Aviation Medicine and Safety Research Science Research; McDonnell Douglas Corporation: Long Beach, CA, USA, 1973; Available online: https://perma.cc/Y4GD-Q3QA (accessed on 1 May 2025).
- Rayman, R.M.; McNaughton, G.B. Smoke and Fumes in the Cockpit. Aviat. Space Environ. Med. 1983, 54, 738–740. Available online: https://pubmed.ncbi.nlm.nih.gov/6626083 (accessed on 1 May 2025). [PubMed]
- ICAO. Circular 344-AN/202: Guidelines on Education, Training and Reporting Practices Related to Fume Events; International Civil Aviation Organization: Montréal, QB, Canada, 2015. [Google Scholar]
- Burdon, J.; Budnik, L.T.; Baur, X.; Hageman, G.; Howard, C.V.; Roig, J.; Coxon, L.; Furlong, C.E.; Gee, D.; Loraine, T.; et al. Health consequences of exposure to aircraft contaminated air and fume events: A narrative review and medical protocol for the investigation of exposed aircrew and passengers. Environ. Health. 2023, 22, 43. [Google Scholar] [CrossRef] [PubMed]
- Rolls-Royce; Intellectual Property Office, UK Department for Science, Innovation and Technology. Aircraft Pneumatic System Supplying Air to Environmental Controls System. Patent GB2544187A, 10 May 2017. Available online: https://perma.cc/6YPW-D942 (accessed on 1 May 2025).
- Pratt & Whitney; US Patent and Trademark Office. Detection of Oil Contamination in Engine Air. Patent 2017/0248571-A1, 31 August 2017. [Google Scholar]
- Boeing; United States Patent and Trademark Office. Seal Assembly and Method for Reducing Aircraft Engine Oil Leakage. Patent US 10,927,845 B2, 23 February 2021. Available online: https://perma.cc/2V5H-JJPF (accessed on 1 May 2025).
- Vera-Barcelo, L. A Clean APU Means Clean Air. Flight Airworthiness Support Technology. Airbus Tech. Mag. 2013, 52, 4–9, Airbus SAS. Available online: https://perma.cc/zk7p-jz8v (accessed on 1 May 2025).
- Michaelis, S. Aircraft clean air requirements using bleed air systems. Engineering 2018, 10, 142–172. [Google Scholar] [CrossRef]
- Johnson, D. Turbine engine lubricant and additive degradation mechanisms. In Aerospace Engineering; IntechOpen: London, UK, 2018; pp. 1–19. [Google Scholar]
- FAA. Aircraft Air Quality and Bleed Air Contamination Detection: Engine Stand Tests, Sensor Technologies, and Chemical Sampling; Report no.: DOT/FAA/TC-23/46, Phase 2; FAA: Atlantic City, NJ, USA, 2023; Volume 1. [Google Scholar] [CrossRef]
- EASA. Characterisation of the Toxicity of Aviation Turbine Engine Oils after Pyrolysis (AVOIL); European Aviation Safety Agency: Cologne, Germany, 2017; Available online: https://perma.cc/8KTC-NRK5 (accessed on 1 May 2025).
- SAE. Airborne Chemicals in Aircraft Cabins; Report no.: AIR 4766/2, Rev. A; SAE Aerospace: Warrendale, PA, USA, 2021. [Google Scholar] [CrossRef]
- Bobb, A.; Still, K. Known Harmful Effects of Constituents of Jet Oil Smoke; Naval Health Research Center: San Diego, CA, USA; USAF: Dayton, OH, USA, 2003. [Google Scholar]
- OHRCA-ACER. Cabin air quality project incidents report. Occupational Health Research Consortium in Aviation and the Airliner Cabin Environment Research Center of Excellence. Submitted to the US Federal Aviation Administration; Jul-2014. Available online: https://perma.cc/F5VC-6Z88 (accessed on 1 May 2025).
- FAA. 14 CFR 121.703: Service Difficulty Reports; FAA: Washington, DC, USA, 2006. [Google Scholar]
- FAA. Service Difficulty Reports Search Page. Federal Aviation Adminstration, US Department of Transportation Washington, DC. Available online: https://sdrs.faa.gov/Query.aspx (accessed on 2 July 2024).
- BTS. Commercial Aviation in 2020: Downturn in Airline Passengers, Employment, Profits, and Flights Operated, in the Wake of COVID-19, was Partially Mitigated by Increases in Air Cargo; Bureau of Transportation Statistics, US Department of Transportation: Washington, DC, USA, 2021. Available online: https://perma.cc/Y24R-L4ZB (accessed on 1 May 2025).
- BTS. US Airlines June 2021 Passengers Increased 304% from June 2020 but Still Declined 21% from Pre-Pandemic June 2019; Bureau of Transportation Statistics, US Department of Transportation: Washington, DC, USA, 2021. Available online: https://perma.cc/9C63-ET6Y (accessed on 1 May 2025).
- BTS. Schedule B-43 Aircraft Inventory, Air Carrier Financial Reports (F-41 Financial Data); Bureau of Transportation Statistics, US Department of Transportation: Washington, DC, USA, 2024. Available online: https://www.transtats.bts.gov (accessed on 8 July 2024).
- BTS. T-100 Segment Data; Bureau of Transportation Statistics, US Department of Transportation: Washington, DC, USA. Available online: https://transtats.bts.gov/ (accessed on 8 July 2024).
- US Congress. Public Law 101-164, Sec. 335: Permanent Prohibition Against Smoking on Scheduled Airline Flights; US Congress: Washington, DC, USA, 1989.
- US Congress. Public Law 106-181, Sec. 708: Prohibitions Against Smoking on Scheduled Flights; US Congress: Washington, DC, USA, 2000.
- Aviation.stackexchange.com. Image of Components and Layout of Typical Aircraft Air Supply System Reproduced by Permission from Response. no. 15520; Posted 8 June 2017. Available online: https://perma.cc/99CE-4NMT (accessed on 11 March 2025).
- AAIU. Serious Incident: Boeing 737-8AS, EI-EFB; Report no.: 2016-013; Air Accident Investigation Unit: Dublin, Ireland, 2018; Available online: https://perma.cc/D3KR-MXP8 (accessed on 18 September 2014).
- SAE. Air 4766/2 (2005); Arp 4418a-(2008) Under Review 2017; Society of Automotive Engineers: Warrendale, PA, USA, 2005. [Google Scholar]
- Chupp, R.E.; Hendricks, R.C.; Lattime, S.B.; Steinetz, B.M. Sealing in turbomachinery. J. Propuls. Power 2006, 22, 313–349. [Google Scholar] [CrossRef]
- FAA. Service Difficulty Report no. DALA2018073104799, B757, Difficulty Date 27 July 2018. Available online: https://sdrs.faa.gov/Query.aspx (accessed on 8 July 2024).
- FAA. Service Difficulty Report no. ASAA2019021828216, B737MAX, Difficulty Date 18 February 2019. Available online: https://sdrs.faa.gov/Query.aspx (accessed on 8 July 2024).
- FAA. Service Difficulty Report no. YENA2023062200729, A321, Difficulty Date 20 June 2023. Available online: https://sdrs.faa.gov/Query.aspx (accessed on 8 July 2024).
- FAA. Service Difficulty Report no. AALA202206249488, A319, Difficulty Date 23 June 2022. Available online: https://sdrs.faa.gov/Query.aspx (accessed on 8 July 2024).
- ASHRAE/ANSI. Standard 161: Air Quality Within Commercial Aircraft; American Society of Heating, Refrigerating, and Air Conditioning Engineers/American National Standards Institute: Peachtree Corners, GA, USA, 2023. [Google Scholar]
- Aircraft Maintenance World. Image of A320fam APU Inlet Reproduced from Aircraft Maintenance World Facebook Page; Uploaded 12 May 2021. Available online: https://perma.cc/K2BJ-7Q7J (accessed on 1 April 2025).
- Aviation.stackexchange.com. Image of B737fam APU Inlet Reproduced by Permission from Response. to User Question no. 8441; posted 2 September 2014. Available online: https://aviation.stackexchange.com/users/1696/fooot (accessed on 14 March 2005).
- FAA. 14 CFR 43.13: Performance Rules (General). Report no.: Amdt. 43–28, Federal Aviaiton Administration. Washington, DC, USA, 1987. Available online: https://www.ecfr.gov/current/title-14/chapter-I/subchapter-C/part-43/section-43.13 (accessed on 8 July 2024).
- FAA. FSAW 06-05a: Guidance for Smoke/Fumes in the Cockpit/Cabin. Federal Aviation Administration. Washington, DC, USA, 2006. Available online: https://perma.cc/A7BS-UAHK (accessed on 1 May 2025).
- Murawski, J.; Supplee, D. An attempt to characterize the frequency, health impact, and operational costs of oil in the cabin and flight deck supply air on US commercial aircraft. ASTM J. Int. 2008, 5, 1–15. [Google Scholar] [CrossRef]
- FAA. 14 CFR 21.3: Reporting of Failures, Malfunctions, or Defects, Admt. 21-36; Federal Aviation Administration: Washington, DC, USA, 1980.
- FAA. Advisory Circular 21-9A: Reporting Failures, Malfunctions, or Defects; Federal Aviation Administration: Washington, DC, USA, 1982. Available online: https://perma.cc/W3TV-3SQE (accessed on 8 July 2024).

| Year | Total SDRs | N SDRs Classified as S/F/FL with Actual S/F | Total SDRs Classified as Oil/Hydraulic/Bleed (“Fume Events”) | N Operational Aircraft | N Departures (Millions) |
|---|---|---|---|---|---|
| 2018 | 58,790 | 1892 | 719 | 7166 | 9.5 |
| 2019 | 63,491 | 1990 | 750 | 7243 | 9.6 |
| 2022 | 60,830 | 1296 | 618 | 7530 | 7.8 |
| 2023 | 60,565 | 1501 | 758 | 7970 | 9.4 |
| Total | 243,676 | 6679 (2.7%) | 2845 (43%) | = 7475 | 36.3 |
| Type Smoke/Fumes | N Smoke/Fume SDRs | Pct. of 6679 Smoke/Fume SDRs |
|---|---|---|
| Oil * | 1970 | 29 |
| Electrical | 1359 | 20 |
| Bleed * | 778 | 12 |
| CWFE ** | 492 | 7.4 |
| Fan | 408 | 6.1 |
| ACM smoke | 280 | 4.2 |
| Fuel/exhaust | 197 | 2.9 |
| Oven | 197 | 2.9 |
| Hydraulic fluid * | 97 | 1.5 |
| Deicing fluid | 47 | 0.70 |
| Lavatory | 39 | 0.58 |
| Battery | 26 | 0.39 |
| Duct (break, fault) | 24 | 0.36 |
| Bird | 11 | 0.16 |
| Other | 268 | 4.0 |
| Don’t know | 486 | 7.3 |
| Total | 6679 | 100 |
| Source of Oil/Hydraulic Fumes | N Fume Event SDRs | Pct. of 2845 Fume Event SDRs |
|---|---|---|
| APU leak/fault/fail (primary) | 940 | 33 |
| Engine leak/fault/fail (primary) | 311 | 11 |
| Pack/duct (secondary) | 115 | 4.0 |
| Don’t know | 1479 | 52 |
| Total | 2845 | 100 |
| Pct. (N) of US Fleet (n = 7475) | Pct. (N) of o-SOF (n = 3384) | Pct. o-SOF ÷ Pct. US Fleet | Top Three Types of o-SOF SDRs | |
|---|---|---|---|---|
| A320fam | 20 | 27 (1048) | 1.4 | CWFE (28%), electrical (22%), fan (15%) |
| MD80fam * | 2.5 | 3.9 (151) | 1.6 | electrical (42%), CWFE (13%), fuel/exhaust (15%) |
| ERJ140-145 | 2.3 | 10 (390) | 4.5 | electrical (39%), ACM smoke (21%), CWFE (5.4%) |
| A330 | 1.1 | 1.6 (61) | 1.4 | electrical (31%), CWFE (16%), oven (9.8%) |
| Phases of Flight | Pct. (N) of 2845 Fume Event SDRs |
|---|---|
| Takeoff/climb | 19 (538) |
| Cruise | 7.2 (205) |
| Descent (incl. approach) | 47 (1340) |
| Landing | 1.4 (39) |
| Taxi/ground hold | 4.4 (124) |
| Inspection/maintenance | 4.2 (119) |
| Not reported/unknown | 17 (480) |
| Total | 100 (2845) |
| Characteristics of Repeat Fume Events | A320fam | B737fam |
|---|---|---|
| Total fume event SDRs | 2270 * | 85 |
| Total unique aircraft (N-numbers) | 665 | 80 |
| Max. number of fume event SDRs per aircraft | 48 | 3 |
| Min. number of fume events SDRs per aircraft | 1 | 1 |
| Number of aircraft with 5+ fume event SDRs | 143 | 0 |
| Operator Type | N of FE (Airline Records) | FE per Aircraft in Fleet | N FE SDRs Sent to FAA | N Aircraft with Repeat FE (Range of Repeats) |
|---|---|---|---|---|
| All A320fam | 604 | 3.1 | 425 (70%) | 92 (2–25) |
| All B737fam | 63 | 0.27 | 8 (13%) | 12 (2–3) |
| Mixed: A320fam | 268 | 0.55 | 91 (34%) | 18 (2–4) |
| B737fam | 32 | 0.085 | 25 (78%) | 1 (2) |
Disclaimer/Publisher’s Note: The statements, opinions and data contained in all publications are solely those of the individual author(s) and contributor(s) and not of MDPI and/or the editor(s). MDPI and/or the editor(s) disclaim responsibility for any injury to people or property resulting from any ideas, methods, instructions or products referred to in the content. |
© 2025 by the author. Licensee MDPI, Basel, Switzerland. This article is an open access article distributed under the terms and conditions of the Creative Commons Attribution (CC BY) license (https://creativecommons.org/licenses/by/4.0/).
Share and Cite
Anderson, J.T.L. Lessons Learned from Official Airline Reports of Onboard Fumes and Smoke. Aerospace 2025, 12, 437. https://doi.org/10.3390/aerospace12050437
Anderson JTL. Lessons Learned from Official Airline Reports of Onboard Fumes and Smoke. Aerospace. 2025; 12(5):437. https://doi.org/10.3390/aerospace12050437
Chicago/Turabian StyleAnderson, Judith T. L. 2025. "Lessons Learned from Official Airline Reports of Onboard Fumes and Smoke" Aerospace 12, no. 5: 437. https://doi.org/10.3390/aerospace12050437
APA StyleAnderson, J. T. L. (2025). Lessons Learned from Official Airline Reports of Onboard Fumes and Smoke. Aerospace, 12(5), 437. https://doi.org/10.3390/aerospace12050437