Abstract
Subjective selection of simulation interface shapes may introduce errors in the strength and fatigue analysis of thermal barrier coatings (TBCs). However, the applicability of different interface shapes for the TBCs simulation has rarely been investigated. Based on the TBCs thermal fatigue experiment, a finite element model is established and combined with the Fruit Fly Optimization Algorithm (FOA), a TBCs life prediction model is established. Then, five typical interface shapes, sawtooth, sinusoidal, semicircular, elliptical, and trapezoidal, are identified based on fine-scale photographs of the real interface morphology of the TBCs. Finally, the interface shape with the highest simulation applicability is identified through interface stress state analysis and life prediction error analysis, and verified through experiment. The results show that the stress maximum location of the sawtooth and trapezoidal interface shapes is inconsistent with the experimental onset of damage in TBCs, which proves that the applicability of the two shapes in the simulation of TBCs is not high. When applying equivalent strain for life prediction, the life prediction errors for the semicircular interface shape, elliptical interface shape, and sinusoidal interface shape are 72.84%, 61.74%, and 58.72%, respectively. The lowest life prediction error is obtained by using data from the sinusoidal interface shape. Therefore, the sinusoidal interface shape is the most applicable simplified shape for TBC simulation. Applying sinusoidal interface shape for additional TBCs life prediction with only 13.52% error, which verifies the accuracy of the methodology and conclusions of this study. These conclusions can inform accurate strength and fatigue simulation analysis of TBCs.
1. Introduction
Turbine blades of aero-engines and gas turbines are continuously subjected to high gas temperatures of over 1000 °C during operation [1,2,3]. Thermal barrier coatings (TBCs), as an important means of protecting hot components, help to increase the temperature limit that turbine blades can withstand [4,5,6]. Thermal barrier coatings are multilayer structures, the main structure is a top coat (TC) for thermal insulation, and its main component is ceramic material [7,8]. The Bond coat (BC) is mainly composed of metal and provides the bonding force to tightly bond the TC to the turbine blade, and to balance the thermal mismatch [9,10]. Aluminum in BC combines with oxygen at high temperatures to form thermally grown oxide (TGO) [11]. The TGO causes TBCs to be susceptible to fatigue failure [12]. Once the fatigue failure of TBCs occurs, the metal blades will face high-temperature gas, which will greatly reduce the blade’s life and even lead to blade damage and accidents. At the beginning of the study, scholars used experiments to determine the performance of TBCs and analyzed the damage mechanism in conjunction with fine-scale photographs of TBCs [13]. However, as new TBC materials and structures continue to be proposed [14,15,16], the experimental party cost increases. Therefore, the application of the finite element method to carry out the damage mechanism analysis of TBCs is used by more and more scholars [17,18,19].
The finite element method can construct the TBCs model from the fine scale, which brings great convenience to the study of the damage mechanism [20,21]. The TC/TGO and TGO/BC are known as the TBCs interface. In order to enhance the bonding strength between the layers of TBCs, the interface generally has a complex morphology [22,23]. To enhance the computational efficiency of simulation, complex TBC interface morphology is generally simplified into regular curves, of which sinusoidal curves are the most coμmonly used [24,25,26]. The shape of the regular curve of the TBCs interface that has been simplified is referred to as the interface shape in this study. Kim et al. [27] derived a life prediction formula for TBCs by means of a finite element model (FEM) with sinusoidal interface shape and thermal cycling experiments, taking into account the stress ratio. Xiao et al. [28] derive the critical delamination thickness of TBCs by developing a finite element method based on a sinusoidal interface shape FEM, and the method can simultaneously consider thermal cycling and growth stress. Zhu et al. [29] studied the effect of structural parameters on the crack stress intensity factor by means of a sinusoidal interface shape FEM. Hu et al. [30] investigated, by means of the finite element method, the effect of the TGO component and position on the interface stress distribution on a sinusoidal interface shape. Although the sinusoidal interface shape can approximately reflect the TBC’s real interface morphology, the real morphology also has similarities with other regular curves [31,32].
With the in-depth study of TBCs, scholars began to carry out studies by applying regular curves such as sawtooth curve, elliptic curve [33], and semicircular curve [34,35] as an approximate substitute for the complex interface morphology. Moridi et al. [36] used a semicircular interface shape to research the effect of TGO thickness and roughness on the TBC’s thermal stresses by simulation. Wang et al. [37] also applied the semicircular interface shape to study the complex cracking behavior of TBCs under isothermal conditions and gradient cooling conditions. Zhang et al. [38] investigated the stress distribution and residual stress state on TBCs using an elliptical interface shape and a sawtooth interface shape. Gu et al. [39] used a sawtooth interface shape and discussed the effect of sawtooth shape on the thermal conductivity of TBCs through thermal conductivity theory. In suμmary, the TBCs interface morphology can be simplified into various shapes such as sinusoidal, semicircular, elliptical, and sawtooth, etc., and the basis of the simplified shapes is mostly derived from the fine-scale interface photographs of TBCs. There are subjective factors that influence the selection of TBC interface shapes to be performed by the previous authors, which can introduce errors in the strength and fatigue analysis of the TBCs. Scholars have rarely considered the applicability of interface shapes for simulation studies of TBCs before.
The study is to study the applicability of different interface shapes for the simulation of TBCs. Based on the TBCs thermal fatigue experiment, a finite element model is established and combined with the (Fruit Fly Optimization Algorithm) FOA, a TBCs life prediction model is established. Then, five typical interface shapes, sawtooth, sinusoidal, semicircular, elliptical, and trapezoidal, are identified based on fine-scale photographs of the real interface morphology of the TBCs. Finally, the interface shape with the highest simulation applicability is identified through interface stress state analysis and life prediction error analysis and verified through experiment.
2. Models and Methods
2.1. Thermal Fatigue Experiment of Thermal Barrier Coatings
TGO growth [40,41,42] and thermal mismatch between different layers [43,44] due to frequent thermal shock are the main reasons for the failure of TBCs. Most of the experiments on TBCs use thermal cycling loads to test the fatigue life. Yang et al. [45,46] conducted thermal cycling experiments on TBCs with a maximum temperature of 1050 °C. A circular tube of material DZ40M is used as an experimental piece in the experiment and the dimensions of the circular tube are shown in Figure 1. The TBCs on the circular tube are prepared by the APS spraying method. The BC material sprayed is Ni22Cr10Al1.0Y with a thickness of 0.125 μm. The TC, with a thickness of 0.25 μm, is made of 6–8% Y2O3-ZrO2. On the outer surface of the middle part of the circular tube, the heating is carried out using an induction coil with the highest temperature of 1050 °C and a heating time of 180 s. In order to simulate the harsh operating environment of the real TBCs, the test piece is cooled by passing the 20 °C gas inside the circular tube for 240 s. A thermocouple was placed at the surface of the TBCs to measure the temperature during the experiment, and the temperature test results are shown in Figure 2 [46].
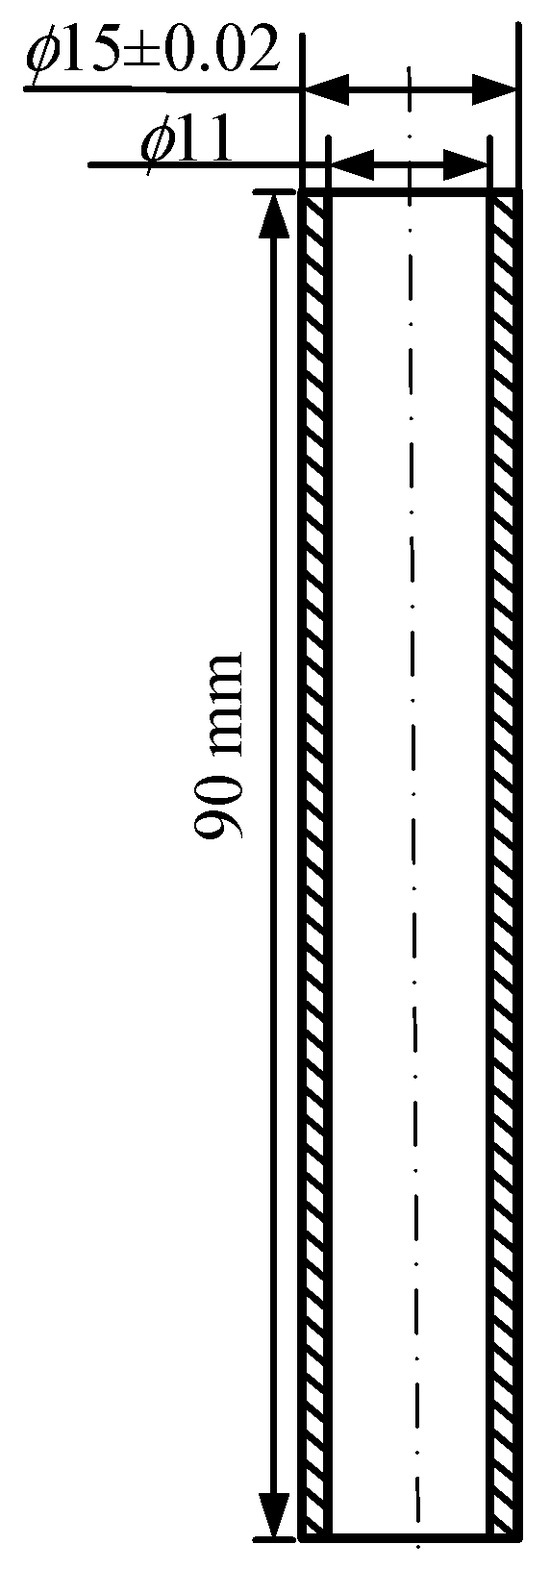
Figure 1.
Size of the circular tube.
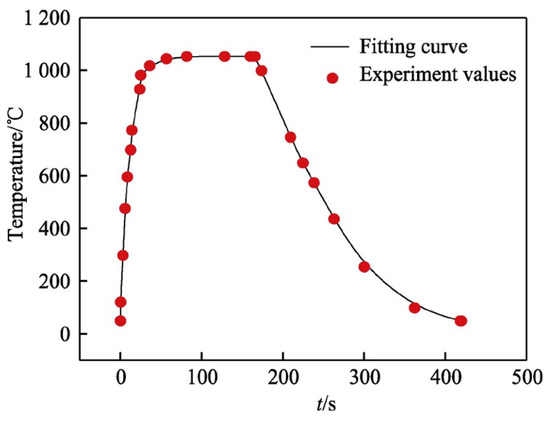
Figure 2.
Surface temperature of TBCs at the time of the experiment [46].
In order to investigate the life of TBCs under different operating conditions, different experimental groups are set up for comparative analysis. Two experimental conditions with and without high-temperature retention, as well as four kinds of pre-oxidized experimental pieces of 50 h, 100 h, 200 h, and 300 h, were designed. The TBC fatigue life is derived based on the generation of visible cracks on the surface, and the fatigue life results are shown in Table 1 [46].

Table 1.
Fatigue test results of TBCs [46].
2.2. Finite Element Modeling of Thermal Barrier Coatings
The FEM of TBCs is constructed based on the test pieces used in the experiments in Section 2.1. The thickness of the thermal barrier coating is consistent with the thickness of the layers on the specimen. As shown in Figure 3, the cross-section in the middle of the circular tube with TBCs is taken as the study area. As shown by the black triangles in Figure 3, the fixed constraint is added to the bottom of the model to simulate the constraints in the radial direction of the circular tube. The displacement in the y-direction is set to 0 to simulate the axial constraint of the circular tube, as shown by the blue triangle in Figure 3. Axisymmetric constraints are added in the z-direction to simulate the circumferential constraints of the circular tube. To match the experiments in Section 2.1, the loads are temperature curves, obtained by fitting the experimental data, as shown in Figure 2. The temperature curve of the corresponding moment is loaded onto the surface of the TBCs during the heating period, while the convective heat transfer coefficient of 50 W/m2 is given on the circular tube’s inner surface. The opposite is true during cooling. The established model is meshed and the overall mesh size is set to 10 μm. To ensure the TBCs interface simulation accuracy, the interface mesh needs to be encrypted. For the interface encryption, three mesh sizes are set, 2 μm, 1 μm, and 0.5 μm. The simulation analysis reveals that the stress results of the interface are basically unchanged when the interface meshes are 1 μm and 0.5 μm. In order to ensure the simulation efficiency, the interface mesh density is chosen to be 1 μm. The total number of nodes is 28,090 and the total number of meshes is 9260.
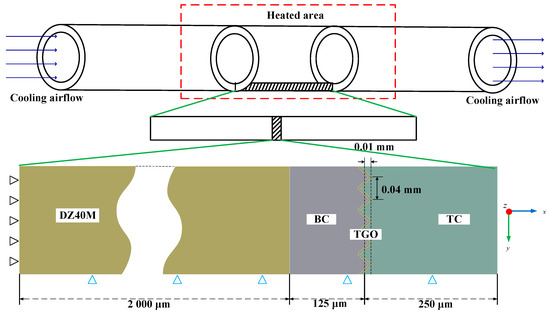
Figure 3.
Finite element model of TBCs.
In this study, the fatigue study of thermal barrier coatings is conducted based on the imaging-only life prediction model, and only the stress and strain information at the interface of TBCs is required. There is no need to consider fatigue problems such as internal cracking due to pores. Therefore, no pores are modeled in the TBCs model with reference to previous studies [16,24,34].
In the simulation study of TBCs, the interface morphology is generally simplified into regular shapes such as sinusoidal curves, sawtooth, and ellipses. As shown in Figure 4 [47,48], all these interface shapes are present in the real TBCs interface morphology. However, which simplified interface shape is more suitable for the TBCs simulation and analysis has rarely been investigated. To this end, FEMs of five TBCs interface shapes, sawtooth, sinusoidal, semicircular, elliptical, and trapezoidal, are developed based on fine-scale photographs of the real interface morphology, as shown in Figure 5. The applicability of interface shapes is demonstrated by subsequent analysis. The structural parameters of the five interface shapes, as shown in Table 2. All models are built with 5 cycles to avoid errors arising from boundary effects. The model also takes into account changes in TGO thickness, and six models with oxide thicknesses of 0.7 μm, 2 μm, 4 μm, 6 μm, 8 μm, and 10 μm are developed for each interface shape, respectively. The TC material is considered as an elastic material for the simulation, and the TGO, BC, and the circular tube material are considered as elastic-perfectly plastic materials. TBCs material parameters ss shown in Table 3 and Table 4.
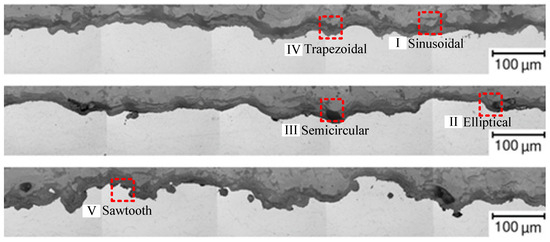
Figure 4.
SEM scan image of thermal barrier coatings [47,48]. (I) Sinusoidal; (II) Elliptical; (III) Semicircular; (IV) Trapezoidal; (V) Sawtooth.
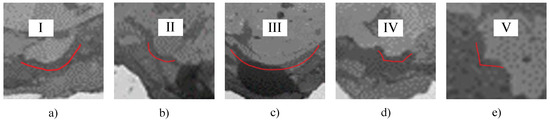
Figure 5.
Original image of each interface shape of TBCs. (a) Sinusoidal; (b) Elliptical; (c) Semicircular; (d) Trapezoidal; (e) Sawtooth [47,48].
Table 2.
Structural parameters of different interface shapes [47].
Table 3.
TBCs material parameters of different temperatures [49,50].
Table 4.
TBC material yield strength of different temperatures [49,50].
In the thermal cycling experiments described above, there was a lack of microstructural data for the interfaces of TBCs. The TBCs in Figure 4 and Figure 5 use the same materials and processes as the experiments and are able to respond well to the contour shapes between the layers of the TBCs. Therefore, this study refers to the interface shape in Figure 4 to model the finite element of the TBCs. However, the length data for the various shapes remained consistent with the experiment.
In this study, the transient thermal and transient structural modules of Workbench 2024 R2 are used for finite element calculations. For the finite element calculation, the temperature distribution of the TBCs is calculated inside the transient thermal module, and then the transient structural calculation is performed to obtain the stress and strain of the TBCs.
2.3. Thermal Barrier Coatings Life Prediction Model Based on FOA
In this study, the life prediction model of TBCs considering the effect of oxidative damage is obtained by combining the Manson-Coffin formula and cumulative damage theory. The process of predictive modeling is as follows.
The Manson-Coffin formula is as follows:
where N is the fatigue life of the member, Δε is the strain range, and Δε0 and ρ are constants of the material that can be determined from experimental.
The cumulative damage theory is as follows:
where k is the different load types, di is the damage of the ith load, Ni is the cycle life under the ith load, ni is the number of cycles of the ith load, and D is the total damage. The criterion for damage is that the cumulative damage exceeds 1.
The life prediction model of the TBCs is obtained by associating Equations (1) and (2) and considering the effect of oxidative damage into account as shown below:
where Δεi is the strain range under the ith load is the current TGO thickness, δ0 is the critical TGO thickness, β is the coefficient, and k value is the number of times of different kinds, which is also the fatigue life prediction value. When the TGO thickness reaches δ0, the oxidation causes complete damage to the TBCs.
There are still four unknown parameters that need to be determined experimentally among the prediction model, which are β, Δε0, and δ. The small amount of experimental data makes it more difficult to solve for the four parameters by fitting. To this end, this study transforms the fitting problem into an optimization problem, using the FOA [51,52] to solve the unknown parameters in the life prediction model.
The FOA-specific workflow is as follows. First, the population is initialized to generate the initial population, and the initial position Ri of each drosophila in the population is defined as follows:
where Ri is a 4-dimensional column vector, the values of each dimension of correspond to the values of the 4 parameters, is the upper bound of each parameter, and is the lower bound of each parameter. r is the number of random numbers belonging to the direct order from 0 to 1.
The fitness of each drosophila is judged based on its location:
Iterate over all drosophila to find the minimum fitness value , and its corresponding position . Update the positions of all drosophila according to the position corresponding to the minimum fitness:
where n is a four-dimensional vector of random numbers. This is repeated to update the drosophila position until the output condition is satisfied.
Figure 6 is the flowchart of thermal barrier coatings life prediction based on FOA. The process of predicting the life of TBCs based on the FOA is as follows. In this study, the functions shown in Figure 6 are implemented by programming using Matlab 2017b. The initial fruit fly population is set to 1000 and the maximum number of iterations is 400. Experimental data on the fatigue life of TBCs used in Fitness Function are shown in Table 1. The initial position of the drosophila is generated by entering the upper and lower bounds of the four unknown parameters. The maximum error in TBC life prediction is calculated for different operating conditions based on each drosophila location. The maximum error is used as the fitness of each drosophila. Iterate over all drosophila to find the minimum fitness value and its corresponding position . Determine whether this adaptation satisfies the output condition, if yes, output and , if no, update the position of each drosophila according to . Iterate the computation repeatedly until the output condition is satisfied. In addition, tb is the experimental duration and ta is the pre-oxidation time in Figure 6.
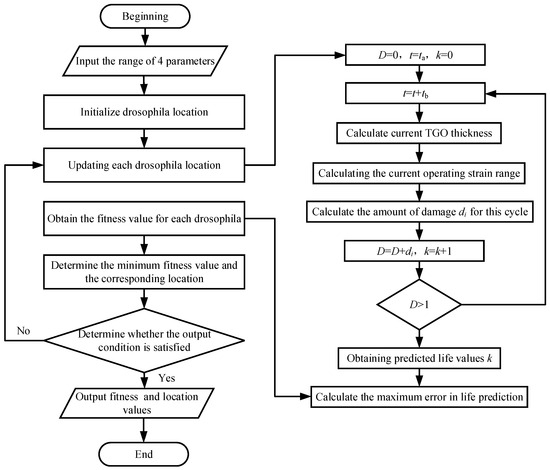
Figure 6.
Flowchart of thermal barrier coatings life prediction based on FOA.
3. Results
3.1. Interface Stress Analysis of Thermal Barrier Coatings
Since most of the failure behaviors of the TBCs occur at the interface where the TC meets the TGO, the stress analysis region is the interface of the TC [53]. Take a peak and valley in the middle of the TBCs FEM and analyze the stress. The damage of the TBCs is strongly influenced by the temperature. Therefore, for the stress analysis, only the highest moment of temperature (540 s) during thermal cycling is considered. Equivalent stress σe and maximum principal stress σm are two quantities coμmonly used in strength and fatigue analyses, and for this reason, these two stresses are analyzed separately in this study. In the study of TBCs, the extreme point on the interface near the outside of the TC is generally referred to as the peak, and the extreme point away from the outside of the TC is referred to as the valley.
Figure 7 shows the σe of the sawtooth interface shape for different TGO thicknesses. Figure 8 shows the σm of the sawtooth interface shape for different TGO thicknesses. With the increase of TGO thickness, the maximum σe value of TC shows a decrease and then an increase, as shown in Figure 7. When the TGO thickness is 10 μm, the global maximum σe of 420.80 MPa is obtained. In addition, the location of the maximum σe is located at the peak of the wave when the TGO thickness is less than 6 μm, and the maximum σe is located at the valley of the wave when the TGO thickness is 8 μm, and 10 μm. As shown in Figure 8, the σm distribution pattern of TC is basically consistent with the σe. When the TGO thickness is 0.7 μm, the global maximum σm of 322.07 MPa is obtained.
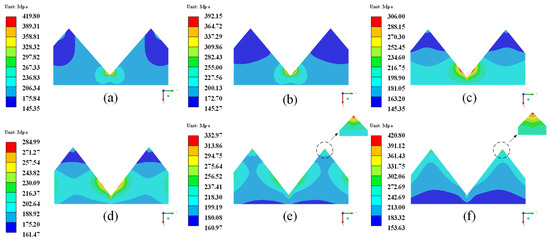
Figure 7.
σe of the sawtooth interface shape for different TGO thicknesses. (a) 0.7 μm; (b) 2 μm; (c) 4 μm; (d) 6 μm; (e) 8 μm; (f) 10 μm.
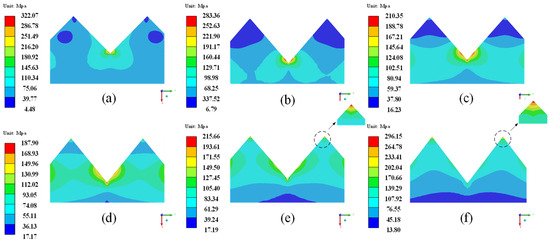
Figure 8.
σm of the sawtooth interface shape for different TGO thicknesses. (a) 0.7 μm; (b) 2 μm; (c) 4 μm; (d) 6 μm; (e) 8 μm; (f) 10 μm.
Figure 9 shows the σe of the sinusoidal interface shape for different TGO thicknesses. Figure 10 shows the σm of the sinusoidal interface shape for different TGO thicknesses. As shown in Figure 9, the maximum σe value of TC shows an increase and then a decrease with the increase of TGO thickness. The global maximum σe of 308.74 MPa is obtained when the TGO thickness is 4 μm. In addition, the location of the σe maximum moves from the peak to the middle as the TGO thickness increases. As shown in Figure 10, the σm distribution pattern of TC is basically consistent with the σe. When the TGO thickness is 4 μm, the global maximum σm of 205.81 MPa is obtained.
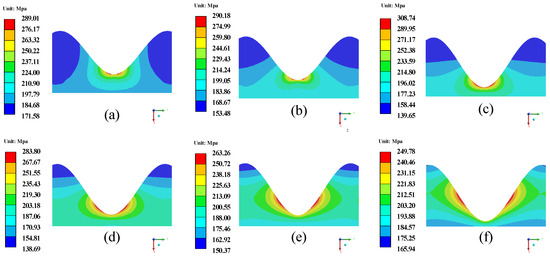
Figure 9.
σe of the sinusoidal interface shape for different TGO thicknesses. (a) 0.7 μm; (b) 2 μm; (c)4 μm; (d) 6 μm; (e) 8 μm; (f) 10 μm.
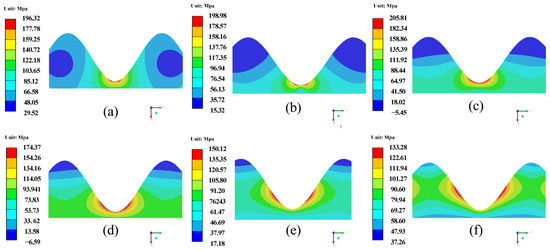
Figure 10.
σm of the sinusoidal interface shape for different TGO thicknesses. (a) 0.7 μm; (b) 2 μm; (c) 4 μm; (d) 6 μm; (e) 8 μm; (f) 10 μm.
Figure 11 shows the σe of the semicircular interface shape for different TGO thicknesses. Figure 12 shows the σm of the semicircular interface shape for different TGO thicknesses. When the TGO thickness is 0.7 μm, the global maximum σe of 296.92 MPa is obtained, as shown in Figure 11. In addition, the location of the σe maximum moves from the peak to the middle as the TGO thickness increases. As shown in Figure 12, the σm distribution pattern of TC is basically consistent with the σe. The global maximum σm of 183.80 MPa is obtained when the TGO thickness is 0.7 μm.
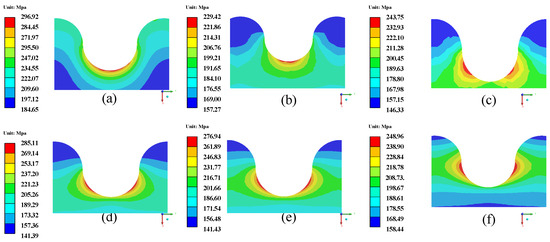
Figure 11.
σe of the semicircular interface shape for different TGO thicknesses. (a) 0.7 μm; (b) 2 μm; (c) 4 μm; (d) 6 μm; (e) 8 μm; (f) 10 μm.
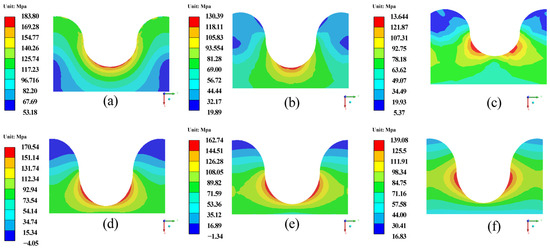
Figure 12.
σm of the semicircular interface shape for different TGO thicknesses. (a) 0.7 μm; (b) 2 μm; (c) 4 μm; (d) 6 μm; (e) 8 μm; (f) 10 μm.
Figure 13 shows the σe of the elliptical interface shape for different TGO thicknesses. Figure 14 shows the σm of the elliptical interface shape for different TGO thicknesses. As shown in Figure 13, the global maximum σe of 293.42 MPa is obtained when the TGO thickness is 6 μm. In addition, the location of the σe maximum moves from the peak to the middle as the TGO thickness increases. As shown in Figure 14, the σm distribution pattern of TC is basically consistent with the σe. When the TGO thickness is 0.7 μm, the global maximum σm of 176.39 MPa is obtained.
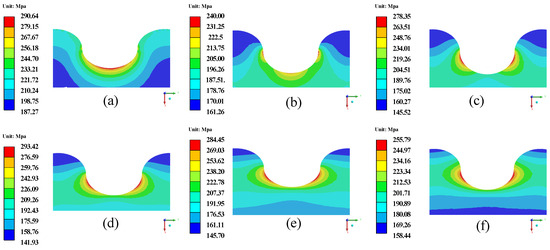
Figure 13.
σe of the elliptical interface shape for different TGO thicknesses. (a) 0.7 μm; (b) 2 μm; (c) 4 μm; (d) 6 μm; (e) 8 μm; (f) 10 μm.
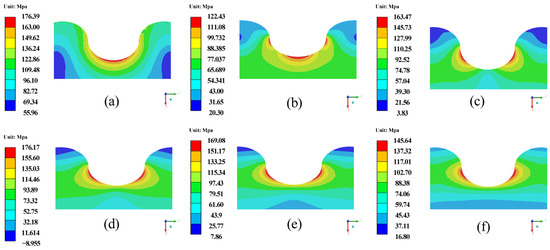
Figure 14.
σm of the elliptical interface shape for different TGO thicknesses. (a) 0.7 μm; (b) 2 μm; (c) 4 μm; (d) 6 μm; (e) 8 μm; (f) 10 μm.
Figure 15 shows the σe of the trapezoidal interface shape for different TGO thicknesses. Figure 16 shows the σm of the trapezoidal interface shape for different TGO thicknesses. As shown in Figure 15, the global maximum σe of 419.50 MPa is obtained when the TGO thickness is 0.7 μm. In addition, when the TGO thickness is 10 μm, the maximum σe is located at the bottom corner of the trapezoid, and at all other TGO thicknesses, the maximum σe is located at the top corner of the trapezoid. As shown in Figure 16, the σm distribution pattern of TC is basically consistent with the σe. When the TGO thickness is 0.7 μm, the global maximum σm of 301.14 MPa is obtained.
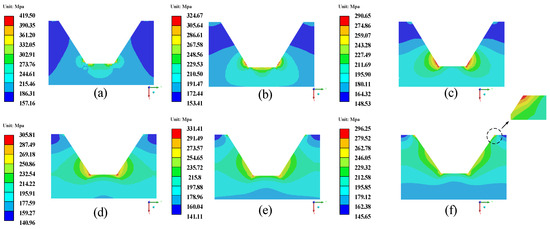
Figure 15.
σe of the trapezoidal interface shape for different TGO thicknesses. (a) 0.7 μm; (b) 2 μm; (c) 4 μm; (d) 6 μm; (e) 8 μm; (f) 10μm.

Figure 16.
σm of the trapezoidal interface shape for different TGO thicknesses. (a) 0.7 μm; (b) 2 μm; (c) 4 μm; (d) 6 μm; (e) 8 μm; (f) 10 μm.
Regardless of the interface shape, the location of the maximum σe/σm moves from the peak toward the valley with increasing TGO. For interface shapes in the form of curves such as sinusoidal, semicircular, and elliptical, the location of the stress maximum moves slowly and does not extend beyond the middle of the interface. For sawtooth and trapezoidal interface shapes, there is an abrupt change in the stress maximum location, moving directly from near the peak to the valley. Whereas studies by Rabiei and Evans have shown that the destruction of TC generally begins between the peak and the middle of the interface [54]. The maximum stress location for the sawtooth and trapezoidal interface shapes is not consistent with the experiment. In addition, stress concentrations occur at the sharp corners of the sawtooth and trapezoidal interface shapes, and the global maximum σe for both exceeds the ultimate stress of 370 MPa for the damage of TBCs [55]. In suμmary, the stress distributions and values of the sawtooth and trapezoidal interface shapes are not consistent with the phenomena of the actual damage of the TBCs, and the applicability of the two in the simulation of TBCs is not high.
3.2. Precision Analysis of Thermal Barrier Coating Life Prediction
Substituting the fatigue-prone point operating strain ranges for the sinusoidal, elliptical, and semicircular interface shapes into the FOA-based life prediction model for TBCs described in Section 2.3, respectively. This enables us to obtain the life prediction results and the maximum error in the life prediction. The life prediction results and life prediction maximum error can be obtained. The applicability of the simulation analysis can be determined by analyzing the maximum error corresponding to the three interface shapes.
As shown in Figure 16, it is also necessary to know the correspondence between the TGO thickness and the time t when performing the lifetime prediction of TBCs. In this study, the equation of oxidation time versus TGO thickness is established by reference [56], as follows:
where Q and h0 are both constants with values of 12,713 and 3382, t is the experimental time, T is the experimental temperature in K, and γ is a constant with a value of 0.286.
The location of the stress maximum at a TGO thickness of 4 μm, was chosen as its danger point location [10]. Extract the operating strain range at the fatigue-prone point with different TGO thicknesses and establish the relationship equation between TGO thickness and operating strain range. The process of solving the TGO thickness from time t and then solving the operating strain range from the TGO thickness can be realized to simplify the life prediction step. The operating strain range corresponding to the equivalent stress is the equivalent strain range, and the operating strain range corresponding to the maximum principal stress is the maximum principal strain range. Figure 17 shows the sinusoidal shape operating strain range. Figure 18 shows the semicircular shape operating strain range. Figure 19 shows the elliptical shape operating strain range.
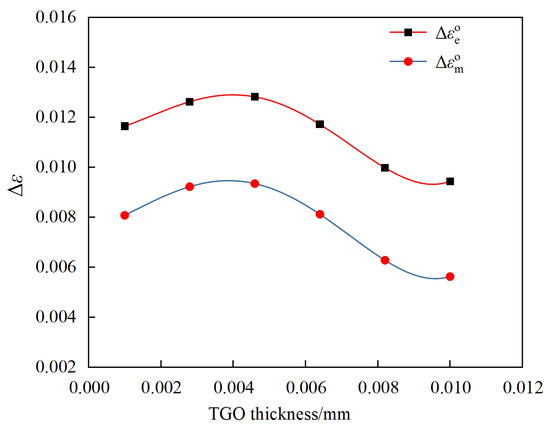
Figure 17.
Sinusoidal shape operating strain range.
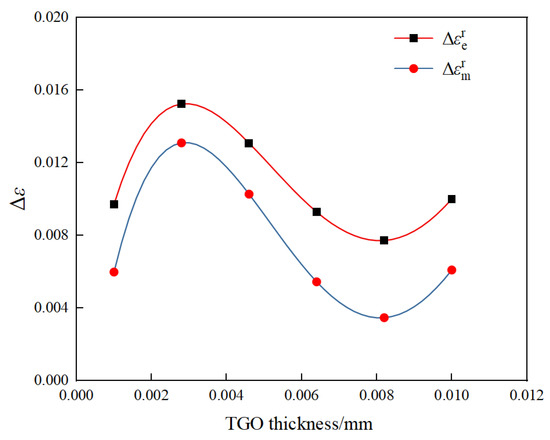
Figure 18.
Semicircular shape operating strain range.
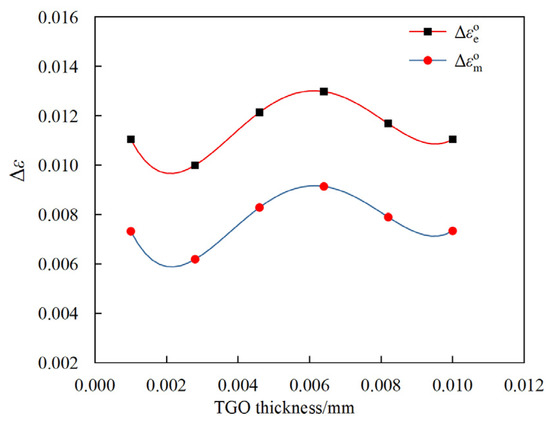
Figure 19.
Elliptical shape operating strain range.
The fitted equation for the range of TGO thickness versus operating strain is given below:
Equations (8)–(13), is the equivalent strain range of the sinusoidal interface shape, is the maximum principal strain range of the sinusoidal interface shape, is the equivalent strain range of the semicircular interface shape, is the maximum principal strain range of the semicircular interface shape, is the equivalent strain range of the elliptical interface shape, is the maximum principal strain range of the elliptical interface shape.
Equations (8)–(13) are substituted into the life prediction model to obtain the coefficients and life prediction errors corresponding to different interface shapes. Table 5 shows the range and the result of coefficients for each interface shape. Table 6 shows the life prediction errors for each interface shape. As shown in Table 6, the error in equivalent strain is smaller than the error in maximum principal strain for different interface shapes. The simulation data using the sinusoidal interface configuration had the smallest life prediction error of 58.72%. The results illustrate that the sinusoidal interface shape is the most applicable simplified shape as a TBC simulation. The results are in agreement with the conclusions of the literature [56].
Table 5.
Range and the result of coefficients for each interface shape.
Table 6.
Life prediction errors for each interface shape.
3.3. Validation of the Applicability of Sinusoidal Interface Shape
With the 35 min high temperature holding time, the 50 h pre-oxidation time, and the 0.4 μm, TC thickness, the fatigue life of this experimental part is 340 cycles [56]. And the other experimental conditions are in keeping with Section 2.1. The experiment described above can be used as a validation experiment to verify the conclusions of Section 3.2. Based on the parameters of the experimental part and the experimental operating conditions, the sinusoidal interface shape is applied to establish the corresponding finite element model. Figure 20 shows the distribution of equivalent stress for the validation model.
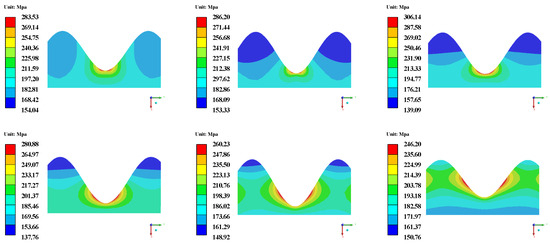
Figure 20.
Distribution of equivalent stress for the validation model.
Fatigue-prone point is identified in the same way and the range of operating strains is extracted. Equation (14) is the fitting equation for the equivalent strain range of the validated model to the TGO thickness. Substituting Equation (14) into the life prediction process and applying the coefficients corresponding to the equivalent strain ranges of the sinusoidal interface shape in Table 5, the life prediction results in 386 cycles. The error between the experimental results and the life prediction results is only 13.52%, which verifies the accuracy of the methodology and conclusions of this study.
4. Conclusions
In this study, five typical interface shapes, sawtooth, trapezoidal, semicircular, elliptical, and sinusoidal, are modeled for the simulation of TBCs. The simulation applicability of different interfacial configurations is determined through interfacial stress state analysis and life prediction error method analysis, and the conclusions obtained are as follows:
(1) Regardless of the interface shape, the location of the maximum σe/σm moves from the peak toward the valley with increasing TGO. For the sawtooth and trapezoidal interface shapes, there is an abrupt change in the stress maximum location, moving directly from near the crest to the trough, which is inconsistent with the experimental onset of damage in TBCs. In addition, stress concentrations occur at the sharp corners of the sawtooth and trapezoidal interface shapes, and the global maximum σe for both exceeds the ultimate stress of 370 MPa for the damage of TBCs. In suμm, ary, the stress distributions and values of the sawtooth and trapezoidal interface shapes are not consistent with the phenomena of the actual damage of the TBCs, and the applicability of the two in the simulation of TBCs is not high.
(2) When applying equivalent strain for life prediction, the life prediction errors for the semicircular interface shape, elliptical interface shape, and sinusoidal interface shape are 72.84%, 61.74%, and 58.72%, respectively. When applying maximum principal strain for life prediction, the life prediction errors for the semicircular interface shape, elliptical interface shape, and sinusoidal interface shape are 76.80%, 77.77%, and 63.26%, respectively. The error in applying equivalent strain is smaller than the error in maximum principal strain for different interface shapes. The lowest life prediction error is obtained by using data from the sinusoidal interface shape. Therefore, the sinusoidal interface shape is the most applicable simplified shape for TBC simulation.
(3) Based on additional TBCs fatigue experimental data, the finite element model is established using a sinusoidal interface shape, and life prediction has been carried out. The error in life prediction is only 13.52%, which verifies the accuracy of the methodology and conclusions of this study.
5. Prospect
Simulation is used to predict performance for the design of TBC structures. Simulation of TBCs considering only the macroscopic shape does not provide a good response to performance or identify the cause of failure. However, for the simulation of the microstructure of TBCs, the contour shape of the interface is taken into account. This study has analyzed and obtained the sinusoidal curve as the most suitable interfacial shape for TBCs, which can provide a reference for performance simulation in the design of TBCs. Based on this study, the following three improvements can be made in future research. (1) Due to the extreme scarcity of experimental data on TBCs, the conclusions obtained in this study are verified by only one experimental condition (TC 400 μm, high temperature maintained for 35 min). In future research, experimental validation of operating conditions such as different maximum temperatures, different maintenance times, and different TBC thicknesses can be added so that the conclusions can meet different operating conditions. (2) For the growth process of TGO, a uniform thickening process is currently adopted in this study, but non-uniform growth phenomena can exist during the use of TBCs. Therefore, in the future, the effect of TGO thickness on fatigue life in the case of non-uniformity will be addressed, as well as whether the sinusoidal shape is still applicable for life prediction. (3) The FOA used in the study has the advantage of a simpler principle and faster convergence, which can avoid precocity to a certain extent, but the disadvantage of a weaker local search capability. The algorithm can also be replaced with intelligent optimization algorithms such as Genetic Algorithm, Particle Swarm Algorithm, and Artificial Bee Colony Algorithm in future research.
Author Contributions
Conceptualization, J.T.; methodology, Y.A. and X.H.; software, T.B.; resources, P.G.; writing—original draft preparation, X.H.; writing—review and editing, Y.Y. All authors have read and agreed to the published version of the manuscript.
Funding
This research was funded by [Scientific Research Fund of Liaoning Provincial Education Department] grant number [LJKZ0182] And [Shenyang Aerospace University] grant number [21YB03].
Data Availability Statement
Data are contained within the article.
Conflicts of Interest
The authors declare no conflict of interest.
Abbreviations
The following abbreviations are used in this manuscript:
| TBCs | Thermal Barrier Coatings |
| TC | Top Coat |
| BC | Bond Coat |
| TGO | Thermally Grown Oxide |
| FEM | Finite Element Method |
| σe | equivalent stress |
| σm | maximum principal stress |
| N | the fatigue life of the member |
| Δε | strain range |
| Δεe | equivalent strain |
| Δεm | maximum principal strain |
| ΔεI | strain range under the ith load |
| β | coefficient |
| δ0 | TGO critical thickness |
| δ | current TGO thickness |
| Q | activation energy |
| T0 | experimental temperature |
| T | absolute temperature |
| h | high bound |
| l | lower bound |
References
- Padture, N.P.; Gell, M.; Jordan, E.H. Thermal barrier coatings for gas-turbine engine applications. Science 2002, 296, 280–284. [Google Scholar] [CrossRef] [PubMed]
- Ren, J.; Li, X.; Jiang, H. Conjugate heat transfer characteristics in a highly thermally loaded film cooling configuration with TBC in syngas. Aerospace 2019, 6, 16. [Google Scholar] [CrossRef]
- Hsiao, Y.; Shiah, Y. Efficient BEM modeling of the heat transfer in the turbine blades of aero-parts. Aerospace 2023, 10, 885. [Google Scholar] [CrossRef]
- Pan, Y.; Han, D.; Huang, S.; Niu, Y.; Liang, B.; Zheng, X. Thermal insulation performance and thermal shock resistance of plasma-sprayed TiAlCrY/Gd2Zr2O7 thermal barrier coating on γ-TiAl alloy. Surf. Coat. Technol. 2023, 468, 129715. [Google Scholar] [CrossRef]
- Li, Y.; Li, C.J.; Yang, G.J.; Xing, L.K. Thermal fatigue behavior of thermal barrier coatings with the MCrAlY bond coats by cold spraying and low-pressure plasma spraying. Surf. Coat. Technol. 2010, 205, 2225–2233. [Google Scholar] [CrossRef]
- Cheng, C.; Lv, T.; Song, B.; Chai, Y.; Luo, J.; Li, G.; Yang, L.; Zhou, Y. Thermal cycling property of the novel Hf6Ta2O17/YSZ TBCs prepared by atmospheric plasma spraying technology. Surf. Interfaces 2024, 53, 105050. [Google Scholar] [CrossRef]
- Padture, N.P. Advanced structural ceramics in aerospace propulsion. Nat. Mater. 2015, 15, 804–809. [Google Scholar] [CrossRef]
- Vaßen, R.; Jarligo, M.O.; Steinke, T.; Mack, D.E.; Stöver, D. Overview on advanced thermal barrier coatings. Surf. Coat. Technol. 2010, 205, 938–942. [Google Scholar] [CrossRef]
- Kim, D.; Park, K.; Kim, K.; Seok, C.S.; Lee, J.; Kim, K. A method for predicting the delamination life of thermal barrier coatings under thermal gradient mechanical fatigue condition considering degradation characteristics. Int. J. Fatigue 2021, 151, 106402. [Google Scholar] [CrossRef]
- Jonnalagadda, K.P.; Eriksson, R.; Li, X.H.; Peng, R.L. Thermal barrier coatings: Life model development and validation. Surf. Coat. Technol. 2019, 362, 293–301. [Google Scholar] [CrossRef]
- Qiao, D.; Zeng, W. Numerical stress analysis of TBCs at film cooling hole’s edge based on TBC-film cooling system. J. Therm. Spray Technol. 2024, 33, 2627–2640. [Google Scholar] [CrossRef]
- Rahimi, J.; Poursaeidi, E.; Montakhabi, F.; Sigaroodi, M.R.J.; Jamalabad, Y.Y. Effect of thermal spraying method, time and temperature on the thickness of thermally grown oxide and lifetime of thermal barrier coatings. J. Therm. Spray Technol. 2023, 32, 2580–2602. [Google Scholar] [CrossRef]
- Yan, K.; Yu, H.; Xiang, Y.; Guo, Y.; Wu, Y.; Li, Z.; Sun, J.; Li, Z. Oxidation and interfacial cracking behaviors of TBCs with double-layered bond coat on different substrate materials. Corros. Sci. 2022, 209, 110770. [Google Scholar] [CrossRef]
- Zhao, Y.; Wu, Y.; Tao, T.; Li, L.; Wang, Q.; Ding, G.; Zhang, C. Optimization design and performance verification of the CeYSZ/Al2O3 double ceramic layer thermal barrier coatings structure parameters. J. Therm. Spray Technol. 2024, 33, 2698–2710. [Google Scholar] [CrossRef]
- Roy, P.; Parthiban, K.; Ghosh, S. Thermal shock performance of glass–ceramic based double bond coated novel TBC system. Therm. Sci. Eng. Prog. 2025, 58, 103176. [Google Scholar] [CrossRef]
- Al-Athel, K.; Loeffel, K.; Liu, H.; Anand, L. Modeling decohesion of a top-coat from a thermally-growing oxide in a thermal barrier coating. Surf. Coat. Technol. 2013, 222, 68–78. [Google Scholar] [CrossRef]
- Pakseresht, A.; Ariharan, S.; Sekar, A.; Parchovianský, M. Investigating hot corrosion, CMAS, and thermal shock behaviour of double-layer YSZ/La2Ce2O7 + YSZ thermal barrier coatings. J. Therm. Spray Technol. 2024, 34, 809–822. [Google Scholar] [CrossRef]
- Koushali, A.G.; Sameezadeh, M.; Vaseghi, M.; Safarpour, P. Modeling and simulation of thermal fatigue crack in EB-PVD TBCs under non-uniform temperature. Ceram. Int. 2017, 43, 13140–13145. [Google Scholar] [CrossRef]
- Choi, S.R.; Zhu, D.; Miller, R.A. Fracture behavior under mixed-mode loading of ceramic plasma-sprayed thermal barrier coatings at ambient and elevated temperatures. Eng. Fract. Mech. 2005, 72, 2144–2158. [Google Scholar] [CrossRef]
- Burov, A.; Fedorova, E. Modeling of interface failure in a thermal barrier coating system on Ni-based superalloys. Eng. Fail. Anal. 2021, 123, 105320. [Google Scholar] [CrossRef]
- Rajabi, M.; Aboutalebi, M.R.; Seyedein, S.H.; Ataie, S.A. Simulation of residual stress in thick thermal barrier coating (TTBC) during thermal shock: A response surface-finite element modeling. Ceram. Int. 2022, 48, 5299–5311. [Google Scholar] [CrossRef]
- Lim, J.G.; Seo, S.; Koo, J.M.; Seok, C.S.; Choi, J.B.; Kim, M.K. Parametric study for optimal design of an air plasma sprayed thermal barrier coating system with respect to thermal stress. Surf. Coat. Technol. 2017, 315, 105–111. [Google Scholar] [CrossRef]
- Yao, Y.; Ai, Y.; Guan, P.; Tian, J.; Bao, T.; Xie, S. Thermal fatigue life predication of thermal barrier coatings by 3D hill-like model and GA. Surf. Coat. Technol. 2021, 426, 127771. [Google Scholar] [CrossRef]
- Liu, J.H.; Liu, Y.B.; Liu, L.; Yu, Y.H.; He, X. Submodeling method to study the residual stress of TBCs near the interfacial asperity on a vane. Eng. Fail. Anal. 2021, 122, 105220. [Google Scholar] [CrossRef]
- Bao, T.; Ai, Y.; Guan, P.; Tian, J.; Yao, Y.; He, J. Cross-scale modeling and elasto-plastic mechanical properties of TBC with 3D hill-like interface. Ceram. Int. 2024, 50, 15251–15260. [Google Scholar] [CrossRef]
- Yao, Y.; Ai, Y.; Guan, P.; Tian, J.; Bao, T.; Hu, X.; Wu, C. Minimum life point determination and fatigue life prediction of thermal barrier coatings based on extended stress and strain method. Int. J. Fatigue 2024, 186, 108419. [Google Scholar] [CrossRef]
- Kim, D.H.; Kim, K.K.; Ark, K.B.; Yun, J.H.; Seok, C.S. Prediction of thermal fatigue life based on the microstructure of thermal barrier coating applied to single-crystal CMSX-4 considering stress ratio. Ceram. Int. 2021, 47, 21950–21958. [Google Scholar] [CrossRef]
- Xiao, Y.; Yang, L.; Zhu, W.; Zhou, Y.; Pi, Z.; Wei, Y. Delamination mechanism of thermal barrier coatings induced by thermal cycling and growth stresses. Eng. Fail. Anal. 2021, 121, 105202. [Google Scholar] [CrossRef]
- Zhu, Y.; Yan, B.; Cai, D.; Wu, K.; Zhang, X. Structural parameter study on stress intensity factors of interfacial crack in thermal barrier coatings. Ceram. Int. 2021, 47, 14354–14365. [Google Scholar] [CrossRef]
- Hu, Z.C.; Wang, L.; Zhuang, M.X.; Zhang, H.Y.; Li, G.S.; Liu, Y.; Wang, Y.; Yang, Y. Influence of internal oxidation of the bond-coat on the residual stress around the TGO and failure modes of the APS-TBCs: A finite element simulation study. Ceram. Int. 2021, 47, 5364–5373. [Google Scholar] [CrossRef]
- Wei, Z.Y.; Cai, H.N.; Tahir, A.; Zhang, W.W.; Li, X.F.; Zhang, Y.; Huang, Y.P.; Liu, Y. Stress states in plasma-sprayed thermal barrier coatings upon temperature cycling: Combined effects of creep, lastic deformation, and TGO growth. Ceram. Int. 2019, 45, 19829–19844. [Google Scholar] [CrossRef]
- Javad, R.; Esmaeil, P.; Farzam, M.; Sigaroodi, M.R.J.; Jamalabad, Y.Y. Experimental and numerical life evaluation of TBCs with different BC and diffusion coating under cyclic thermal loading. Int. J. Appl. Ceram. Technol. 2023, 20, 2888–2918. [Google Scholar]
- Luo, S.; Huang, R.; Bai, H.; Jiang, P.; Qu, Z.; Fang, D. Interfacial failure behavior of thermal barrier coatings (TBCs) at high temperatures: An in-situ indentation study based on X-ray imaging. J. Mech. Phys. Solids 2024, 187, 105647. [Google Scholar] [CrossRef]
- Ranjbar-Far, M.; Absi, J.; Mariaux, G.; Dubois, F. Simulation of the effect of material properties and interface roughness on the stress distribution in thermal barrier coatings using finite element method. Mater. Des. 2010, 31, 772–781. [Google Scholar] [CrossRef]
- Chen, Z.; Jia, W.; Zhao, K.; Fang, L. Comparison of stress evolution under TGO growth simulated by two different methods in thermal barrier coatings. Ceram. Int. 2020, 46, 2915–2922. [Google Scholar] [CrossRef]
- Moridi, A.; Azadi, M.; Farrahi, G.H. Thermo-mechanical stress analysis of thermal barrier coating system considering thickness and roughness effects. Surf. Coat. Technol. 2014, 243, 91–99. [Google Scholar] [CrossRef]
- Wang, H.; Dong, H.; Cai, Z.; Li, Y.; Wang, W.; Liu, Y. Peridynamic-based investigation of the cracking behavior of multilayer thermal barrier coatings. Ceram. Int. 2022, 48, 23543–23553. [Google Scholar] [CrossRef]
- Zhang, B.; Chen, K.; Baddour, N. Stress models for electron beam-physical vapor deposition thermal barrier coatings using temperature-process-dependent model parameters. J. Eur. Ceram. Soc. 2021, 41, 5658–5674. [Google Scholar] [CrossRef]
- Gu, S.; Lu, T.J.; Hass, D.D.; Wadley, H.N.G. Thermal conductivity of zirconia coatings with zig-zag pore microstructures. Acta Mater. 2001, 49, 2539–2547. [Google Scholar] [CrossRef]
- Wei, Z.-Y.; Chai, Y.-J.; Yi, P.; Meng, G.-H.; Zhang, W.-W. Stress profile and crack evolution in a three-dimensional (3D) thermal barrier coatings during isothermal cyclic test. Ceram. Int. 2022, 48, 30606–30620. [Google Scholar]
- Wei, Z.Y.; Cai, H.N.; Zhao, S.D.; Li, G.R.; Zhang, W.W.; Tahir, A. Dynamic multi-crack evolution and coupling TBC failure together induced by continuous TGO growth and ceramic sintering. Ceram. Int. 2022, 48, 15913–15924. [Google Scholar] [CrossRef]
- Dong, H.; Yang, G.J.; Li, C.X.; Luo, X.T.; Li, C.J. Effect of thickness on thermal cyclic lifetime and failure mode of plasma-sprayed. J. Am. Ceram. Soc. 2014, 97, 1226–1232. [Google Scholar] [CrossRef]
- Martena, M.; Botto, D.; Fino, P.; Sabbadini, S.; Gola, M.M.; Badini, C. Modelling of TBC system failure: Stress distribution as a function of TGO thickness and thermal expansion mismatch. Eng. Fail. Anal. 2006, 13, 409–426. [Google Scholar] [CrossRef]
- Jonnalagadda, K.; Eriksson, R.; Yuan, K.; Li, X.; Ji, X.; Yu, Y.; Peng, R.L. Comparison of damage evolution during thermal cycling in a high purity nano and a conventional thermal barrier coating. Surf. Coat. Technol. 2017, 332, 47–56. [Google Scholar] [CrossRef]
- Yang, X.G.; Geng, R.; Zhou, Y.P. An experimental study of oxidation and thermal fatigue of TBC. J. Aerosp. Power 2003, 2, 195–200. [Google Scholar]
- Yang, X.G.; Geng, R.; Zhou, Y.P. A Study of Thermal Fatigue Life Prediction of TBC. J. Aerosp. Power 2003, 2, 201–205. [Google Scholar]
- Eriksson, R.; Sjöström, S.; Brodin, H.; Johansson, S.; Östergren, L.; Li, X.H. TBC bond coat-top coat interface roughness: Influence on fatigue life and modelling aspects. Surf. Coat. Technol. 2013, 236, 230–238. [Google Scholar] [CrossRef]
- Gupta, M.; Eriksson, R.; Sand, U.; Nylén, P. A diffusion-based oxide layer growth model using real interface roughness in thermal barrier coatings for lifetime assessment. In Proceedings of the International Conference on Surfaces, Coatings and Nanostructured Materials (NANOSMAT), Dublin, Ireland, 15 June 2015; Volume 271, pp. 181–191. [Google Scholar]
- Zhu, W.; Cai, M.; Yang, L.; Guo, J.; Zhou, Y.; Lu, C. The effect of morphology of thermally grown oxide on the stress field in a turbine blade with thermal barrier coatings. Surf. Coat. Technol. 2015, 276, 160–167. [Google Scholar] [CrossRef]
- Editorial Committee of China Aviation Materials Manual. Handbook of Aeronautical Materials of China Wrought and Cast Superalloys; China Standard Press: Beijing, China, 2001; Volume 2, pp. 765–771. [Google Scholar]
- Pan, W.T. A new FOA: Taking the financial distress model as an example. Knowl. Based Syst. 2012, 26, 69–74. [Google Scholar] [CrossRef]
- Yuan, X.; Dai, X.; Zhao, J.; He, Q. On a novel multi-swarm FOA and its application. Appl. Math. Comput. 2014, 233, 260–271. [Google Scholar] [CrossRef]
- Li, B.; Fan, X.; Zhou, K.; Wang, T.J. Effect of oxide growth on the stress development in double-ceramics-layer thermal barrier coatings. Ceram. Int. 2017, 43, 14763–14774. [Google Scholar] [CrossRef]
- Rabiei, A.; Evans, A.G. Failure mechanisms associated with the thermally grown oxide in plasma-sprayed thermal barrier coatings. Acta Mater. 2000, 48, 3963–3976. [Google Scholar] [CrossRef]
- Kim, K.; Kim, D.; Park, K.; Yun, J.; Seok, C.S. Methodology for predicting the life of plasma-sprayed thermal barrier coating system considering oxidation-induced damage. J. Mater. Sci. Technol. 2022, 105, 45–56. [Google Scholar] [CrossRef]
- Wei, H.L.; Yang, X.G.; Qi, H.Y. Study on thermal fatigue life prediction for plasma sprayed thermal barrier coatings on the surface of turbine vane. J. Aerosp. Power 2008, 23, 1–8. [Google Scholar]
Disclaimer/Publisher’s Note: The statements, opinions and data contained in all publications are solely those of the individual author(s) and contributor(s) and not of MDPI and/or the editor(s). MDPI and/or the editor(s) disclaim responsibility for any injury to people or property resulting from any ideas, methods, instructions or products referred to in the content. |
© 2025 by the authors. Licensee MDPI, Basel, Switzerland. This article is an open access article distributed under the terms and conditions of the Creative Commons Attribution (CC BY) license (https://creativecommons.org/licenses/by/4.0/).