Abstract
Delays are a global issue affecting both airports and airlines. Departure delays are particularly likely to propagate across airports, rendering the entire flight network susceptible to increased delay durations. The delay network and its duration fluctuate daily or even hourly across airports. This study investigates the association between departure delay duration and delay network properties. Using various network metrics, we apply a fixed-effect Prais–Winsten regression model within a panel data framework covering the period from 2018 to 2021 for two full-service carriers in Japan. The key findings reveal that higher in-degree centrality is associated with longer departure delays. Betweenness centrality suggests that, in addition to hub airports, some spoke airports may function as delay bridges, thereby increasing delay durations. Eigenvector centrality is linked to shorter but more frequent departure delays across the network, which are more likely to result in frequent delay propagations of shorter durations. The results indicate that some airports may form delay clusters among themselves, potentially extending departure delay durations among connected airports. During the COVID-19 pandemic, the state of emergency contributed to varying associations between network properties and departure delay durations. These outcomes are expected to provide valuable insights for airline delay and schedule management policymakers.
1. Introduction
With the increasing demand for air traffic, a surge in air traffic delays, defined as instances when the actual take-off or landing time of a flight is later than the scheduled time, has been observed worldwide [1,2]. Such delays indicate reduced airport capacity, lack of airline punctuality, passenger dissatisfaction, economic costs, environmental emissions, and loss of passengers’ time. The estimation and prediction of delays are universally recognized as complex tasks [3]. In the United States, 20% of arriving and departing flights were delayed in 2018 [4]. Similarly, in China, prior to the COVID-19 pandemic, the departure punctuality rate at domestic airports was approximately 70%, with an average departure delay of nearly 28 min [1]. In Japan, approximately 9% of domestic flights were delayed in 2022, marking a 5.4% increase from the previous year, with 69,280 flights experiencing delays exceeding 15 min. These delays were primarily caused by prior flight delays or cancelations [5].
Departure delay is an operational classification of flight delays. It can result from a combination of factors, including airline and airport operations, air traffic control, adverse weather, and human-related issues [3,6,7,8]. Departure delay is frequently characterized as the primary causal factor in delay propagation. When airlines operate on tightly coordinated schedules, flights naturally become interdependent. Therefore, a departure delay in one flight can trigger a cascading effect on subsequent flights and connections. Even a single delayed flight can cause a domino effect that can spread delays from one airport to another. This domino effect often disrupts the entire flight network of a particular airline as well as the operations of interconnected airports [3,8,9]. Consequently, departure delays often serve as a networked phenomenon among airports. Therefore, departure delays may exhibit network properties that warrant further investigation.
Departure delay duration is a critical parameter in air traffic management and is characterized differently by various stakeholders. For instance, the Federal Aviation Administration prioritizes departure delays exceeding 15 min to align with airport and airline expectations and enhance passenger satisfaction [3]. In contrast, airports approach departure delays from an operational perspective, focusing on throughput and the average delay duration to manage airport capacity, often treating delays exceeding 10 min as problematic [3]. Airlines measure departure delay durations at the gate within 5 to 15 min of the scheduled time and are more concerned with the maximum delay than the average delay [3,8]. Thus, the departure delay duration is a vital parameter that requires investigation in the context of network representation.
Traditional databases for departure delays typically record information, such as origin and destination airports, scheduled and actual departure times, and delay durations [3]. However, representing departure delays as a network, where airports serve as nodes and delays form the edges, offers a more insightful perspective. This approach facilitates the identification of critical airports within a network that requires particular attention—an analysis that is less efficient with column-oriented databases. Using a network database enables queries such as identifying the most influential airports in terms of delays, identifying airports with similar or dissimilar delay profiles, and detecting patterns of delay occurrences across multiple airports [10].
Despite the extensive research on flight departure delays, limited attention has been paid to exploring the network properties of these delays and their association with delay durations. This study aims to address this research gap by identifying the statistically significant network properties of departure delays and analyzing their relationship with delay durations. We employ a network representation of departure delay data from Japanese domestic airports served by All Nippon Airways (ANA) and Japan Airlines (JAL) between 2018 and 2021. Initially, we calculate the network properties for each airport connected by departure delays on a daily basis, resulting in a dataset containing the daily network properties and the total departure delay duration for each airport. Subsequently, using a Prais–Winsten regression in a panel data framework, we analyze the relationship between the network properties (independent variables) and departure delay durations (dependent variable). To achieve this objective, we examine four network properties: in-degree centrality, betweenness centrality, eigenvector centrality, and transitivity. The representation of network properties as panel data has been utilized in various transportation studies. For example, Kopsidas et al. [11] analyzed the association between network centralities and passenger flow in metro systems using regression models. Shi et al. [12] investigated the spatial distribution of commercial facilities using network centralities, and Wang et al. [13] applied this methodology to analyze taxi travel patterns.
The remainder of this paper is organized as follows. Section 2 reviews the related studies on departure delays and their network characteristics. Section 3 describes the study area, data collection, and data transformation procedures. Section 4 outlines the methodology employed to handle highly correlated network-formed panel data, identify significant network properties, and analyze their relationship with departure delay durations. Section 5 discusses the results and outcomes of the study in detail. Finally, Section 6 concludes the paper with a discussion of the major findings, limitations, and directions for future research.
2. Literature Review
Various studies have examined departure delays. For instance, Tu et al. [14] estimated flight departure delay distribution by focusing on United Airlines and Denver International Airport, which are likely to be helpful for air traffic congestion prediction models using nonparametric statistical methods for daily and seasonal trends. This study contributed to understanding the general structure of departure delays for the entire National Airspace System (NAS) in the United States. Khan et al. [15] integrated machine learning models to predict both departure delays and delay durations by leveraging various sampling techniques to avoid misclassification. They achieved approximately 60% recall accuracy for classifying the delay status and subsequently predicting delay durations at the 30 min and 60 min thresholds. Kim and Park [16] compared the accuracy of predicting departure delays from 2 h to 48 h in advance using various machine learning and deep learning models. A similar study was conducted by Gopalakrishnan and Balakrishnan [17], who compared the delay prediction accuracy of various US airports from 2 h to 24 h using machine learning models. Recently, Mamdouh et al. [18] proposed a Bidirectional Long Short-Term Memory technique to predict departure delays by combining attention mechanisms to enable the model to identify significant and discriminating features that contribute to categorization, with the goal of real-time airport monitoring. In Japan, the characteristics and prediction of delays at both airline and airport levels have been less explored. Kato et al. [19] introduced a statistical method using Independent Component Analysis to identify 20 patterns of flight delays and cancelations at Sendai Airport due to bad weather, airport congestion, and other incidents. Later, Hirata et al. [20] quantified the propagated delays and developed an econometric model to estimate the delay propagation multiplier for a cost–benefit analysis of the Japanese domestic aviation network.
Some studies have used metrics and theories from network science to assess departure delays. For instance, Rebollo and Balakrishnan [21] proposed a network-based model to predict departure delays using the origin–destination pairs of the most influential airports to depict the delay state of the entire NAS. In addition, Gopalakrishnan and Balakrishnan [22] used various centrality metrics to cluster air traffic delay network data from the US National Airspace System to identify the characteristic delay states and types of days. This clustering considered network properties, such as eigenvector centrality and hub/authority scores, revealing that the type of day influences community structures within delay states. Wang et al. [23] attempted to identify universal patterns of departure delay propagation based on the arrival delay of preceding flights. This study used a shifted power or an exponentially truncated shifted power-law delay distribution, which revealed two universal delay propagation classes that characterized the operational efficiency of airlines in mitigating delays. Yang et al. [1] used node sequence data to accurately predict short-term departure delays of transit flights by proposing a new graph machine learning model, namely, a Graph Convolutional Network and Graph Sample and Aggregate. Wang et al. [24] used weighted directed graphs to identify and study the timescales of airport delay interactions within a network using a time-delay stability algorithm to determine statistically significant delay lags between airports. These lags were then encoded into Delay Stability Networks for persistent lags and Delay Lag Networks for lag magnitude, allowing for the quantitative analysis and visualization of airport delay interactions. Wang et al. [25] used the fundamental structural properties of complex networks to compare departure delay networks between the United States and China and found that airports in similar geographical locations exhibited similar delay patterns in both countries. In the Japanese aviation market, Sugishita et al. [2] identified distinct groups of delay propagation patterns with significant differences in total delay time and key airports spreading delays. Additionally, their findings revealed that certain delay patterns are more prominent during specific seasons and that specific network motifs are more frequent in delay networks, which have the potential to aid in predicting air traffic delays.
The majority of research on aviation delays, specifically departure delays, has focused on prediction models or optimization formulations of delay networks. Very few studies have investigated the network properties of departure delays. This type of investigation is required to identify critical airports in the network, model delay propagation, analyze the ripple effects of cascading delays, and match airports with similar delay characteristics in the network. Additionally, there is a scarcity of literature exploring how changes in flight delay networks affect delay duration.
3. Data
In this study, data on Japanese domestic flights from 2018 to 2021 were analyzed using the Official Aviation Guide (OAG) historical flight data [26]. The dataset contains detailed information on each flight, including flight numbers, departure and arrival airports, terminals, gate numbers, scheduled, estimated, and actual departure and arrival times, operating airlines, runway times, and instances of flight cancelations. From this dataset, departure delay information was extracted to construct departure delay networks. The departure delay was calculated as the difference between the actual departure time at the gate and the scheduled departure time. The analysis focused on two full-service carriers in Japan: ANA and JAL.
Daily snapshots of the delay networks were created to represent the departure delays of domestic Japanese flights from 2018 to 2021. In these networks, nodes represent airports, and edges denote flights with departure delays of 1 min or more.
Four network properties were analyzed, consisting of four continuous and two categorical variables. The continuous variables included in-degree centrality, betweenness centrality, eigenvector centrality, and transitivity. The categorical variables were airport type (hub or spoke) and seasonality (quarters 1, 2, 3, and 4). Based on Hanaoka’s study [27], eight airports were categorized as hub airports for domestic flights in Japan: New Chitose (CTS), Fukuoka (FUK), Tokyo International (HND), Narita International (NRT), Chubu Centrair International (NGO), Kansai International (KIX), Osaka International (ITM), and Naha (OKA). These hub airports are shown in Figure 1.
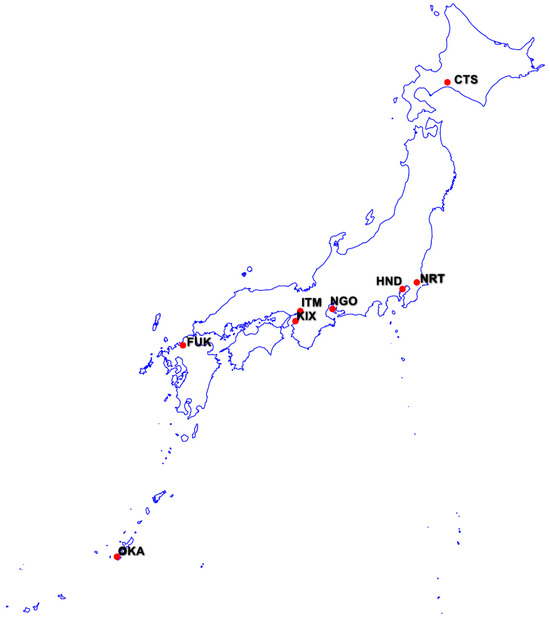
Figure 1.
Eight hub airports in the Japanese domestic air transport network.
For classification purposes, airports were assigned a value of hub = 1 if they were among these eight hubs; otherwise, they were categorized as spoke = 0. Seasonality was divided into four groups: January to March (Q1 = 1), April to June (Q2 = 2), July to September (Q3 = 3), and October to December (Q4 = 4). This study developed a model covering two periods across four individual years, from 2018 to 2021. The years 2018 and 2019 were designated as the pre-COVID-19 phase, while 2020 and 2021 were considered the during-COVID-19 phase. For the pre-COVID-19 period, seasonality was not incorporated; however, for the during-COVID-19 period, seasonality was included because of the multiple rounds of state-of-emergency (SoE) declarations by the Government of Japan. The first SoE lasted from 7 April to 25 May 2020: the second from 8 January to 21 March 2021: and the third from 25 April to 19 June 2021, except for Okinawa, where it was lifted on 30 September 2021. The fourth SoE spanned from 12 July to 30 September 2021 [28]. Figure 2a,b illustrate the frequency of domestic flights and number of delayed departure flights per day for ANA and JAL, respectively, along with the durations of the four SoEs during 2020–2021. The data indicate that both flight frequency and the frequency of delayed departures declined significantly during the first and second SoEs. However, following the lifting of the fourth SoE, flight frequency and delayed departures began to recover, mirroring trends observed during the pre-COVID-19 period.
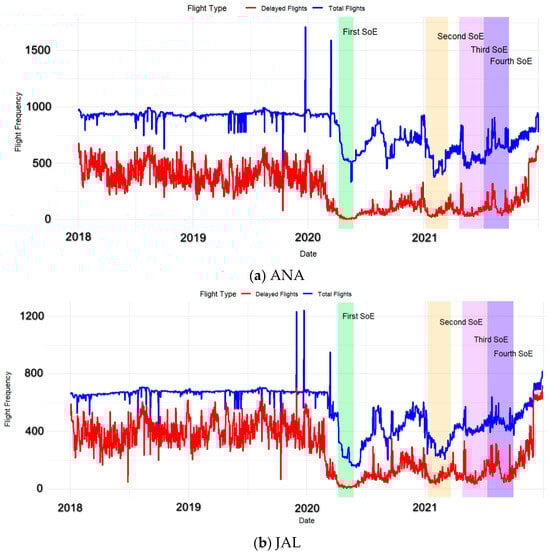
Figure 2.
Variation in the frequency of total flights and departure-delayed flights in domestic regions in Japan from 2018 to 2021.
For each airport and day, the total departure delay duration is calculated as the sum of the departure delay durations for all flights departing from that airport on that day. For instance, if three ANA flights depart from CTS to HND, NRT, and FUK on a given day, and two of these flights experience delays of 1 min or more, two edges are added from CTS to the respective destination airports. This information is used to derive network data, such as the out-degree centrality of CTS and the in-degree centrality of the destination airports. Hypothetically, if the departure delay durations for CTS-HND and CTS-NRT are 5 min and 10 min, respectively, the total departure delay duration for that day would be 15 min. This total departure delay duration is treated as the dependent variable, whereas the other network data are considered independent variables, as detailed in Section 5.1. Not all flights departing from a particular airport experience delays each day. This variability implies that the characteristics of the departure delay network can vary daily. Understanding the associations between changes in departure delay networks and the total daily departure delay duration across airports is of critical importance.
4. Methodology
This study employs a panel data regression model to analyze the association between network properties and the departure delay duration. Network adjacency metrics are utilized to calculate the network properties of each airport for each day, which are subsequently represented as panel data to fit the regression model. This section outlines the detailed applications of network properties and statistical methods.
4.1. Network Properties
In this study, the departure delay data between airports over a four-year period are analyzed. Airports are represented as nodes, whereas departure delays are represented as edges. Based on this data representation, four network properties of the delay network, as previously described, were calculated. For example, in-degree centrality represents the number of delayed flights received by an airport from other airports. In the context of this study, the in-degree centrality measures the total count of flights that departed late from their respective originating airports. It should be noted that this metric differs from arrival delay. A high in-degree centrality value indicates that an airport in the delay network receives a substantial number of delayed departure flights. Betweenness centrality (BC) typically measures the frequency with which a node lies on the shortest path between two other nodes [29]. In this study, BC is examined to evaluate how an airport experiencing a departure delay is connected to other airports, either as a hub or a spoke [30]. This metric reflects the extent to which an airport serves as a bridge between different airport types experiencing departure delays. An increase in BC indicates that certain airports are critical nodes situated on major paths connecting numerous origin–destination pairs. Consequently, delays at these airports are likely to propagate across a wide range of routes. From the perspective of delays, airports with higher BC values generate more delayed departure links to both hub and spoke airports, thereby playing a key role in the spread of delays. Eigenvector centrality (EC) measures the degree to which an airport is connected to other well-connected and influential airports. In the context of departure delays, EC evaluates whether an airport experiencing delays is also connected to other airports that exhibit frequent delays. A higher EC value suggests that delays are more prevalent at airports that are connected to other delay-prone airports. Finally, transitivity quantifies the extent to which a node (in this case, a departure-delayed airport) tends to cluster or form triads within the delay network. This metric reflects the likelihood that two nodes connected to a common node are also directly connected to each other, forming a triangle. High transitivity indicates that the network contains communities or groups of nodes that are densely interconnected. From the perspective of delays, an airport with high transitivity is likely connected to other airports that also experience frequent departure delays, thus forming a triad among themselves. Table 1 provides a detailed mathematical explanation of the network properties.

Table 1.
Mathematical expression and explanation of network properties.
4.2. Panel Data Model Using Prais–Winsten Regression
To identify the significant delay network properties associated with the departure delay duration, once the network properties for each airport on each day were calculated, one-year panel data were utilized to develop four models for the years 2018 through 2021 for ANA and JAL. For each day, the total departure delay duration at each airport was aggregated to form a panel dataset. This study employs unbalanced panel data due to differences in time observations across individuals, with a maximum time observation of 365 days and a maximum of 46 airports. This structure is also referred to as long-panel data, as the time dimension exceeds the individual dimension (i.e., 365 days > 46 airports). Traditionally, panel data modeling involves either fixed-effects or random-effects models. Fixed-effects models facilitate the examination of temporal changes within panels (i.e., airports), whereas random-effects models allow for analysis between panels. After performing the Hausman test [31], the fixed-effects model was determined to be more appropriate for this study.
Network properties are often highly correlated with one another [32], which increases the likelihood of serial correlation, cross-sectional dependence, and heteroscedasticity. To test for cross-sectional dependence or contemporaneous correlation, the Breusch–Pagan Lagrange multiplier test and Pasaran cross-sectional dependence test were employed [33,34]. Serial correlation was assessed using the Lagrange multiplier test [35]. The results indicate the presence of cross-sectional dependence, heteroscedasticity, and serial correlations in the dataset. Considering these findings, a fixed-effects Prais–Winsten regression model with correlated panel-corrected standard errors (PCSEs) was employed. This approach accounts for regression coefficients with robust and reliable standard errors [36,37,38]. The PCSE coefficients were estimated by calculating standard errors and variance–covariance estimates, where the Prais–Winsten regression method assumes disturbances to be heteroscedastic and contemporaneously correlated across panels. Given the unbalanced nature of the panel data, the parameters were estimated using first-order autocorrelation by specifying panel-specific autocorrelation weights based on Ti. Unbalanced panels often contain missing data. To address this issue, a pairwise estimation of the inter-panel covariance matrix of the disturbances was used. This method ensures that all available observations common to each panel contribute to the covariance matrix computation. To the best of our knowledge, the modeling framework employed in this study represents a novel approach for estimating parameters and standard errors in a robust and reliable manner for this type of data representation in the analysis of delay data in the air transport domain.
The dependent variable in this study is the departure delay duration for each airport, whereas the independent variables include the network properties of in-degree, betweenness, eigenvector, and transitivity for each airport per day. Dummy variables for airport type and seasonality are also included as independent variables.
This model can be written as
where yit represents the departure delay duration for airport i at time t, Xit represents the network properties derived for airport i at time t, i represents the individual airports (connected in the departure delay network) (panels), and t = 1, 2, …, Ti (Ti = number of periods in panel i), and µit depicts the disturbances autocorrelated along t or contemporaneously correlated across i. As autocorrelation was specified in our model, we used Prais–Winsten estimates with the generalized least-squares method [36,38] using STATA 15 with the xtpcse library [36].
yit = βXit + µit
5. Results and Discussion
5.1. Summary of Network Properties
Table 2 presents the fundamental properties of the ANA and JAL flight departure delay networks for the period from 2018 to 2021. The number of nodes represents the airports connected by flights operated by each airline, while the number of edges corresponds to the directed edges, indicating the number of departure-delayed flights (≥1 min) between these nodes or airports. Mean path length serves as a measure of network cohesiveness, with smaller values suggesting that nodes are more closely connected.
Table 2.
Departure delay network properties of ANA and JAL.
Table 2 reveals minimal variation in the number of nodes between the pre-COVID-19 (2018–2019) and during-COVID-19 (2020–2021) periods, with at most one or two nodes being omitted for either airline. This consistency suggests that most flights continued to experience departure delays despite the COVID-19 outbreak. Similarly, relatively minor variations were observed in the mean path length, which ranged from 1.90 for ANA to 2.21 for JAL. This indicates that the network structure remained largely stable, as flights continued to operate with departure delays during the COVID-19 period without significant changes in network cohesiveness compared to the pre-COVID-19 period. However, the number of edges decreased notably during the COVID-19 period in the Japanese domestic flight network. This reduction likely reflects a decline in the number of flights between airports due to the surge in COVID-19 cases and subsequent government intervention, as illustrated in Figure 2.
Table 3 provides the basic descriptive statistics of the network properties and total departure delay durations for ANA and JAL from 2018 to 2021. These statistics include the means and standard deviations for all airports during the study period. For ANA, the mean number of incoming flights that departed late (in-degree centrality) was approximately 12, with a standard deviation of 20.67, indicating a substantial variation among airports. The mean BC was 30.09, and the EC was 0.23, both exhibiting relatively large standard deviations. The mean transitivity was 0.62, with a standard deviation of 0.39. The mean value of total departure delay duration was 142.29 min, with a high standard deviation of 489.38, signifying considerable variability in delay durations across connected airports. For JAL, the mean in-degree centrality was 9.28, with a standard deviation of 19.55, which was higher than that for ANA. The mean BC was 44.65, which exceeded that of ANA, while the mean EC was 0.18. The mean value of the total departure delay duration was 103.73 min, which was lower than that of ANA, although the standard deviation was comparable to that of ANA.
Table 3.
Descriptive statistics of network properties.
Table 4 provides the Pearson correlation coefficients for in-degree, betweenness, eigenvector, and transitivity. The results demonstrate that in-degree exhibits a strong correlation with betweenness (>0.85) and a moderate correlation with eigenvector (>0.70). Furthermore, eigenvector and betweenness display a moderate inter-correlation (≥0.70). Notably, transitivity is negatively correlated with all the other variables, a result that merits particular attention. Analysis of these correlation values reveals the potential for multicollinearity among the network properties, particularly between in-degree and betweenness. The Variance Inflation Factor (VIF) was calculated for these variables to assess the severity of multicollinearity. The results confirmed that the VIF values were below 10, indicating acceptable levels of collinearity, which aligns with standard practice [39]. Specifically, the VIF values for ANA and JAL were 4.69 and 6.51 for in-degree, 5.02 and 6.13 for betweenness, 2.25 and 2.28 for eigenvector, and 1.15 and 1.10 for transitivity, respectively. It is critical to note that researchers should not exclude highly correlated variables solely based on their correlation values. The decision to retain or omit such variables depends on the specific objectives of the study. If the primary goal is to identify significant variables, then excluding correlated variables may lead to substantial estimation issues [40]. Accordingly, despite the relatively high correlation between in-degree and betweenness observed in Table 4, both variables were retained in the model for two principal reasons. First, the VIF values were within the acceptable threshold of 10. Second, both network properties play essential roles in analyzing their relationship with the departure delay duration within the delay network.
Table 4.
Pearson correlation coefficients between network centralities for ANA and JAL.
Figure 3a,b display the adjacency matrix tables representing the total departure delay durations (in minutes) for flights departing from various airports between 2018 and 2021. In these figures, both axes correspond to the IATA codes of the airports; further details on the full names of these airports are provided in Appendix A Table A1. For ANA flights, the HND-CTS and OKA-HND routes recorded the highest departure delay durations in both directions during this period. Similarly, for JAL flights, routes HND-OKA, HND-CTS, and HND-FUK exhibited the highest departure delay durations. A review of the adjacency matrices highlights that departure delays were most prevalent on flights originating from HND, ITM, and OKA, affecting a considerable number of connecting airports for both ANA and JAL.
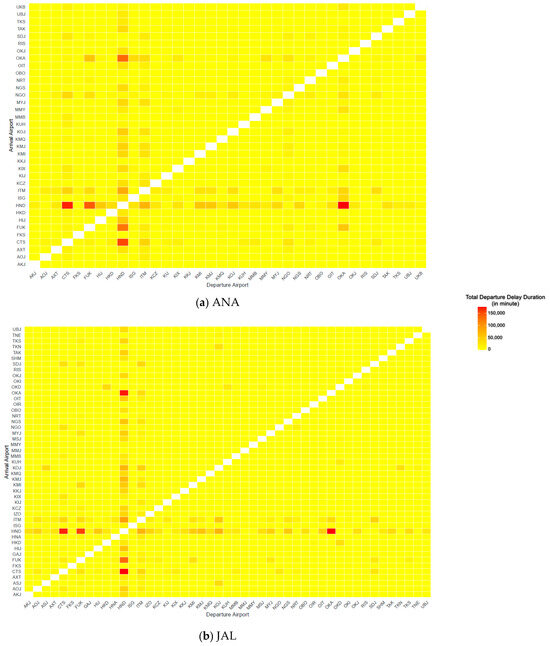
Figure 3.
The adjacency matrix of total departure delay duration (in minutes) of each airport from 2018 to 2021.
5.2. Model Estimation
5.2.1. Pre-COVID-19 Phase
Table 5 presents the estimation results of the Prais–Winsten regression for the pre-COVID-19 phase, aiming to identify the association between significant network properties and departure delay duration for both ANA and JAL. Two models, one for each airline, are estimated for 2018 and 2019. The coefficients for in-degree centrality were 0.410 and 0.515 for ANA and JAL, respectively, at the 1% significance level in 2018, and 0.379 and 0.402 for ANA and JAL, respectively, at the 1% significance level in 2019. These results strongly suggest that the observed relationship is not due to random chance. These estimates can be interpreted as follows: for a given airport in the delay network, on a day when the in-degree centrality is one unit higher than its typical value for that airport, the departure delay duration for each flight may be expected to increase by 0.410 min (ANA, 2018), 0.379 min (ANA, 2019), 0.515 min (JAL, 2018), or 0.402 min (JAL, 2019). This suggests that before the COVID-19 outbreak, the higher the number of arriving flights that departed late, the more likely it was that departure delays would occur at the receiving airports, thereby increasing the daily departure delay duration at these airports. When considering only hub airports, the departure delay duration remained positively associated with in-degree centrality for ANA (β = 0.111 in 2018) and JAL (β = 0.109 in 2018; β = 0.191 in 2019), all at the 1% significance level. This finding potentially indicates that when hub airports receive a higher number of late-departing flights, there is a possibility that the delay duration at these receiving hub airports tends to increase. Figure 4 and Figure 5 present the rankings of all four network properties of each airport based on the departure delays for ANA and JAL, respectively, for each year from 2018 to 2021. HND, ITM, CTS, and FUK ranked among the top five for in-degree centrality in both 2018 and 2019, reflecting the dominance of hub airports in receiving late-departing flights. This dominance aligns with Budd and Ison [41] since hub airports typically handle a significant number of international and domestic flights under normal conditions. Our results align with those of Wu et al. [9], who noted that delayed flights at their origin airports may lead to increased turnaround times at the arrival gate of the receiving airports, which could further contribute to departure delays for subsequent flights. Because our delay network includes both hub and spoke airports, some spoke airports with higher in-degree centrality rankings, such as KMI, MYJ, KOJ, and KMJ (see Figure 4 and Figure 5), were found in the top 10 list for both ANA and JAL. This highlights the influence of certain spoke airports within the delay network and suggests a possible increase in departure delay durations.
Table 5.
Estimation results in the pre-COVID-19 phase (2018 and 2019).
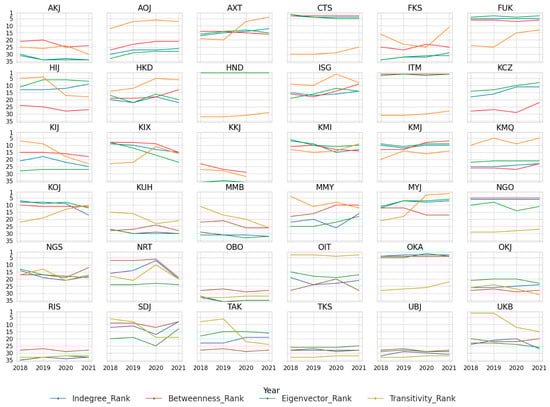
Figure 4.
Ranking of departure delay network properties for airports connecting ANA flights from 2018 to 2021.
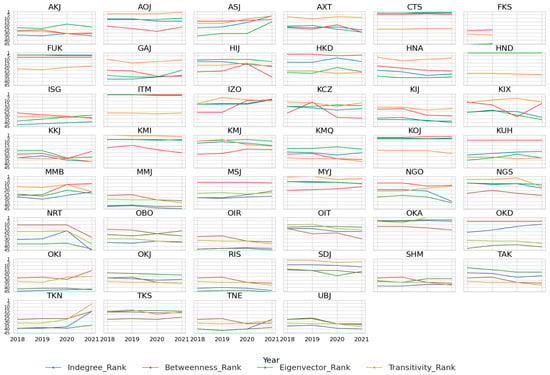
Figure 5.
Ranking of departure delay network properties of each airport connecting JAL flights from 2018 to 2021.
In 2019, for ANA, we observed a different sign in the interaction effect of hub airports with in-degree centrality (β = −0.048, at a 1% significance level). This outcome is plausible because of the presence of outliers in the 2019 data, which may alter the magnitude and direction of the regression coefficients [42]. Figure 2a shows that an outlier in the frequency of delayed flights (denoted in red) occurred in the last quarter of 2019. In our study, we did not exclude outliers because we used specialized data derived from a network database and considered the entire delay network for each day to calculate the network properties for each airport. Therefore, removing outliers could have hindered the proper establishment of relationships and may have resulted in the omission of important information.
An increase in BC suggests that certain airports function as potentially critical hubs that may spread departure delays to other airports, that is, airports with higher BC values are more likely to lie on the shortest path between other airports and serve as bridges for airports that are less directly connected in the network. Our findings indicate that BC is positively associated with departure delay duration for ANA, with coefficients of β = 0.251 in 2018 and β = 0.103 in 2019. However, these results were not statistically significant. Conversely, BC shows a negative association with the departure delay duration for JAL, with β = −0.028 in 2018 at the 1% significance level and β = −0.005 in 2019, although the latter lacks statistical significance. This result suggests that, in the delay network, along with hub airports, some spoke airports may also serve as critical airports. For example, for ANA, spoke airports such as SDJ, KOJ, and KMI were ranked among the top 10 in BC (Figure 4). For JAL, airports including HKD, KOJ, OKD, KUH, and MSJ were ranked in the top 10, along with hub airports. These spoke airports are more likely to be critical within the network when departure delays are a concern. If this is the case, there could be a chance that the departure delay duration is more likely to be longer for ANA, whereas it is more likely to be shorter for JAL. In such instances, one potential measure for ANA flights could involve increasing turnaround time to provide a greater buffer against delays at critical airports.
When focusing exclusively on hub airports, both airlines exhibited a negative association between BC and departure delay duration in 2018 and 2019. However, statistical significance was observed only for JAL, with coefficients of β = −0.143 in 2018 and β = −0.115 in 2019, both at the 1% significance level. These results suggest that the relationship between BC and departure delay duration differs between ANA and JAL when considering the entire delay network; however, similar patterns emerge for both airlines when focusing exclusively on hub airports. When considering only hub airports, both airlines were more likely to experience shorter delays with higher BC values. This suggests that for JAL, connecting flights departing from high-BC airports (in terms of delay) are more likely to encounter shorter delays, particularly if those airports are categorized as hubs. Conversely, spoke airports that act as higher-BC airports (in terms of delay) for JAL are more likely to experience longer departure delays. Figure 5 illustrates that some spoke airports, namely HKD, KOJ, OKD, KUH, and MSJ, ranked third, fourth, sixth, eighth, and ninth in the BC ranking list. This indicates that these airports are high-BC airports in terms of departure delays, making them more prone to longer delays. Zhou et al. [43] and Zanin et al. [44] found that in China, 40–50% of smaller airports are more prone to experience delays in a flight network and engage in delay propagation, whereas, in the USA, Li et al. [45] reported that smaller airports are more likely to be sensitive to delay propagation.
Hub airports are typically prone to frequent departure flights, and it is plausible that the number of delayed departures may also be higher at these airports. However, the observed negative association suggests that the departure delay duration is more likely to be shorter for connecting airports with higher BC. This implication is particularly relevant for hub airports in Japan because, for both ANA and JAL, some domestic airports serve as transit points for both airlines. For example, for JAL, the connecting airports are HND, NRT, and OKA [46], and for ANA, the airports are HND, NRT, ITM, KIX, OKA, and FUK [47]. These airports are already established as hub airports in terms of flight operations and connections and are well equipped to handle domestic transit flights, ensuring minimal departure delays.
In particular, although in-degree centrality and BC exhibit relatively high positive correlations with each other, Figure 4 and Figure 5 reveal that there are airports where the BC ranking exceeds that of in-degree centrality and vice versa. For example, in Figure 5 (for JAL flights), spoke airports HKD, OKD, KUH, and MSJ were ranked 14th, 18th, 26th, and 30th for in-degree centrality in 2018 but ranked 3rd, 6th, 8th, and 9th for BC in the same year. Similar patterns were observed for JAL at these airports in 2019. For ANA, a similar trend was observed for SDJ, which was ranked 11th and 12th in 2019 and 2018 for in-degree centrality, respectively, but ranked 9th for BC in both years. Therefore, it is not uncommon for the coefficients of BC to show an opposite sign to that of in-degree centrality. These two network centralities capture the distinct aspects of the role of spoke airports within the network. Although these spoke airports experience fewer delayed flights, as indicated by their in-degree centrality rankings, their BC rankings suggest that they have the potential to become critical in spreading delays to other airports.
In the case of EC, both ANA and JAL show that an increase in EC is associated with a decrease in the departure delay duration, with results that are statistically significant at the 1% level. Specifically, for ANA, the coefficients are β = −0.046 in 2018 and β = −0.057 in 2019, while for JAL, the coefficients are β = −0.057 in 2018 and β = −0.029 in 2019. This trend persists when focusing exclusively on hub airports, where higher EC is associated with shorter departure delays at the 1% significance level. For ANA, the coefficient is β = −0.011 in 2018, while for JAL, the coefficients are β = −0.023 in 2018 and β = −0.049 in 2019. These findings suggest that, during the pre-COVID-19 phase, higher EC at hub airports was more likely to be linked to reduced delay durations across the delay network. When an airport with a higher number of departure delay links is connected to another airport that also has a higher number of departure delay links, the departure delay duration tends to decrease as EC increases. A higher EC in a delay network may indicate the propagation of delays across connected airports [48]. This is because, when one higher-degree node is connected to another high-degree node, information can be disseminated more rapidly across the network. In the context of our study, an increased EC in the delay network generally leads to a reduction in the delay duration on a daily basis. One possible explanation for this is that some airports exhibit higher EC values in the delay network each day, indicating that they are more likely to have a greater number of delay links connected to other airports with similarly high delay links. Consequently, these delay links tend to produce shorter delay durations. Consequently, the total departure delay duration per day is typically shorter than what would be expected for that airport. Therefore, it is plausible that airports in Japan are more likely to produce shorter delay propagation across the delay network; however, the frequency of these shortened delays could be higher because of higher EC. Jia et al. [49] reported that, in China, larger airlines are more likely to propagate delays slowly but cover a broader area in aviation networks, although they did not report its connection with the duration of the delay. The interaction term between the EC and the hub indicates that hub airports are less prone to longer daily departure delays than spoke airports because of the negative association. This further implies that spoke airports with higher EC are more prone to longer departure delays, which aligns with the BC result that spoke airports may also act as critical airports that generate a significant number of departure-delayed flights with longer durations. For both ANA and JAL, spoke airports, namely KMI, HIJ, KOJ, MYJ, and KMJ, were ranked in the top ten lists of EC rankings (Figure 4 and Figure 5), with the potential to increase departure delay duration. Hub airports in Japan are more likely to have higher EC in terms of delay, such as HND, OKA, ITM, FUK, and CTS (as indicated in Figure 4 and Figure 5), and are connected to other well-connected airports. Here, a potential inconsistency may arise in the implications of in-degree centrality and EC concerning their relationship with delay duration. The positive association between in-degree centrality and delay duration suggests that delays may accumulate at the receiving hub airport since delayed flights arrive from both hub and spoke airports. Consequently, the receiving hubs exhibit a higher number of delay connections. Conversely, in the case of EC, well-connected airports with a higher number of delay connections tend to be linked with other similarly well-connected airports. However, not all airports exhibit high EC values. Fewer airports are strongly interconnected in terms of delay propagation. Consequently, the negative association between EC and delay duration could refer to shorter departure delay durations among these few airports, facilitated by better infrastructure, more efficient ground operations, and well-established procedures for handling irregularities. These capabilities enable faster recovery from delays. Although some airports may be critical in terms of EC, they generally experience shorter departure delay durations. Conversely, the spoke airports mentioned above have higher EC in terms of delay because of a lack of resources, like the hub airports, and thus, are more likely to produce longer departure delay durations.
It is important to note that, for ANA in 2019, the interaction between hub airports and EC showed a positive association with delay duration (β = 0.048) at the 1% significance level. As mentioned previously, the presence of an outlier in 2019 may have altered the sign of the coefficient, thereby affecting the interpretation of the results.
In the case of transitivity, both airlines in 2019 exhibited a negative association between departure delay duration and transitivity, suggesting a tendency to experience shorter delay durations. Specifically, for ANA, the coefficient was β = −0.001 at the 1% significance level, while for JAL, the coefficient was β = −0.0001, though the latter was not statistically significant. This relationship also holds for ANA in 2018. However, a positive association was observed for JAL in 2018. The transitivity property behaves differently for JAL when focusing on hub airports. For ANA, the association was negative, with β = −0.007 in 2018 and β = −0.004 in 2019, both at the 1% significance level. In contrast, for JAL, the association was positive, with β = 0.005 in 2018 and β = 0.006 in 2019, both statistically significant at the 1% level. For JAL, these results suggest that hub airports are more likely to form triads with two other airports (i.e., transitivity) that frequently experience departure delays and are more likely to encounter longer delay durations. In other words, higher transitivity is associated with an increased likelihood of delays within airport triads. This implies that, if an airport in a tightly connected group (via delay edges) experiences departure delays, these delays are more likely to propagate within the group, thereby creating localized triads of delayed flights. Consequently, the departure delay duration tends to increase among interconnected airports. For example, for ANA, airports such as KCZ, UKB, OIT, HIJ, TAK, KMQ, KIJ, and ISG ranked in the top 10 transitivity rankings in both 2018 and 2019, indicating that these airports are more likely to have higher transitivity, meaning that they are more likely to form departure delay triads. Similarly, for JAL, spoke airports such as KMI, MYJ, SDJ, AOJ, NGS, and KMJ were found in the top 10 transitivity ranking lists in both pre-COVID-19 years. This result aligns with that of Lonzius and Lange [50], who indicated that routing strength, which focuses on frequent flights between certain airports, is associated with longer delays. Although arrival delays were examined, the airport-cluster analogy coincides with our results. Li et al. [49] found that among smaller airports, delay clustering is prominent in the US aviation network. In addition, Zhou et al. [43] reported that the flight network in China tends to create dense delay propagation clusters. Given both the positive and negative associations between transitivity and departure delay duration, it may be important to monitor certain airports on a daily basis where departure delay links are produced at a higher rate within themselves. In this context, a shorter departure delay duration should not be overlooked, as in certain situations, this shorter duration may shift to a longer duration owing to various unobserved factors.
5.2.2. During-COVID-19 Phase
Table 6 presents the estimation results of network properties during the COVID-19 phase, with the only distinction from the pre-COVID-19 analysis being the inclusion of seasonality as a categorical variable (i.e., January to March as Q1, April to June as Q2, July to September as Q3, and October to December as Q4). This categorization allowed for an understanding of the differences in departure delay networks resulting from the four rounds of SoEs declared between 2020 and 2021 during the COVID-19 pandemic in Japan. From Table 6, it is evident that during the initial phase of the COVID-19 outbreak in 2020, in-degree centrality was positively associated with departure delay duration for both ANA (β = 0.629) and JAL (β = 0.662) at the 1% significance level, indicating an increase in departure delay duration. When focusing on hub airports, both airlines exhibited a tendency toward longer departure delays (significant positive association) in 2020 and 2021; however, statistical significance at the 1% level was only observed in 2021, with β = 0.162 for ANA and β = 0.192 for JAL. The results suggest that during the COVID-19 pandemic, flights departing late from origin airports were more likely to cause longer departure delays at destination airports. Figure 2 illustrates the significant decrease in the number of departure-delayed flights for both ANA and JAL during the first SoE. These results indicate that the departure delay duration tended to increase despite the number of delayed flights decreasing during these time periods. Figure 4 and Figure 5 confirm that hub airports were ranked among the top for in-degree centrality, specifically HND, ITM, OKA, CTS, and FUK. During the COVID-19 pandemic in the United States, flights arriving late at hub airports were more likely to experience increased delays, with gate delays increasing substantially compared to the pre-COVID-19 phase, potentially owing to labor shortages that may have restricted airlines from achieving on-time departures [51,52]. Additionally, the turnaround time during the COVID-19 period was reported to have increased at terminals, which may have contributed to longer ground times, further exacerbating departure delay durations at receiving airports despite a decrease in the number of flights and passengers [53].
Table 6.
Estimation results in the during-COVID-19 phase (2020 and 2021).
When accounting for seasonality, both ANA and JAL exhibit similar associations in 2020 and 2021, with consistent coefficient signs across each year. In 2020, statistically significant results were found only for Q2 and Q4, where a negative relationship was observed between in-degree centrality and departure delay duration. For ANA, the coefficients were −0.399 in Q2 and 0.173 in Q4, whereas for JAL, the coefficients were −0.324 in Q2 and −0.421 in Q4. In 2021, the relationship shifted for both airlines, with all quarters from Q2 to Q3 showing positive associations with the delay duration, indicating longer delays than in Q1. However, statistical significance at the 1% level was only observed in Q4, with β = 0.935 for ANA and β = 1.03 for JAL. At the onset of the COVID-19 pandemic, the reduction in flight numbers and departure-delayed flights may have contributed to shorter departure delays for both airlines. However, in 2021, as operations began to recover following the fourth SoE, longer delays emerged within the expanded delay network connections, a pattern similar to that of the pre-COVID-19 phase. However, this outcome was evident only when considering seasonality variation.
For both ANA and JAL, BC was negatively associated with departure delay duration, indicating shorter departure delays in 2020, with β = −0.129 for ANA and β = −0.016 for JAL. However, only JAL’s estimate was statistically significant at the 10% level. In 2021, this trend reversed, with BC being positively associated with longer delay durations for both airlines (β = 0.013 for ANA and β = 0.065 for JAL), although only JAL’s result was statistically significant at the 1% level. When focusing solely on hub airports, flights operated by JAL showed a negative association with departure delay duration in 2020 (β = −0.064 at the 1% significance level) and 2021 (β = −0.064 at the 1% significance level), although the standard error differed between the two years. For ANA, this association was not statistically significant. These findings suggest that during the COVID-19 phase, hub airports with higher BC were more likely to experience shorter departure delays, whereas spoke airports with higher BC tended to experience longer delays. Figure 4 and Figure 5 show that KOJ, HKD, OKD, KUH, MSJ, and IZO ranked in the top ten for BC in both years. This indicates that, during the COVID-19 phase, spoke airports were more likely to act as critical nodes in terms of departure delays, making them more vulnerable to longer delay durations. These airports may have lacked the capacity and personnel to enforce stringent COVID-19 measures, such as temperature screening, physical distancing, and restricted terminal access [54,55]. Consequently, these airports may have become more susceptible to delays in connecting with other airports, thereby contributing to longer delay durations. Notably, during the first SoE in Q2 2020, both ANA and JAL experienced an increase in delay duration associated with higher BC. A similar pattern was observed in Q3 and Q4 of 2020. During this period, the total number of flights and departure-delayed flights decreased (Figure 2). In 2021, BC exhibited a negative association with the departure delay duration across Q2, Q3, and Q4 for both airlines. Notably, the Q4 results were statistically significant at the 1% level, suggesting that a higher BC during these periods contributed to shorter delays for both ANA and JAL flights. Consequently, both ANA and JAL displayed an entirely opposite relationship between 2020 and 2021 when seasonality was considered, with the initial phase of COVID-19 tending to increase the delay duration, whereas later years showed a tendency for a decreased delay duration. The three rounds of SoEs in 2021 may have influenced these shifts in the relationship compared with 2020 when only one SoE occurred.
EC was generally negatively associated with departure delay duration in 2020, indicating a reduction in delay duration, with coefficients of β = −0.017 for ANA and β = −0.043 for JAL. A similar pattern was observed when focusing solely on hub airports in 2021, with coefficients of β = −0.012 for ANA and β = −0.013 for JAL, reflecting a consistent negative relationship. However, in 2021, the opposite trend emerged, showing a positive association between EC and departure delay duration. For ANA, the coefficient was β = 0.009, though it lacked statistical significance, while for JAL, the coefficient was β = 0.010, with significance at the 10% level. During Q2 of 2020, which coincided with the first SoE and Q4 of the same year, JAL experienced increased delay durations. In 2021, the coefficients for both airlines remain consistent across all quarters, indicating a persistent negative association between EC and departure delay duration throughout each quarter and SoE. The interaction with seasonality indicates that as flight and delay networks gradually recovered in 2021, airports began exhibiting delay-based EC patterns resembling the pre-COVID-19 times, characterized by frequent but shorter-duration delay propagation across the network.
In the case of transitivity, delayed flights operated by both ANA and JAL exhibited shorter departure delay durations in 2020 but experienced longer delays in 2021. A similar trend to that observed in 2020 was evident in 2021 when focusing solely on hub airports, with β = −0.002 at the 10% significance level for ANA and β = −0.0004, which lacked statistical significance, for JAL. Regarding seasonality, transitivity contributed to longer departure delay durations for Q2, Q3, and Q4 of 2020. This suggests that following the declaration of the first SoE on 7 April 2020, clusters of airports emerged and circulated delays among themselves, thereby leading to increased delay durations. However, in Q4 of 2021, both ANA and JAL demonstrated a negative association between transitivity and departure delay, indicating that higher transitivity during that period corresponded to shorter delay durations.
From the preceding discussion, an important pattern during the COVID-19 phase was identified: the association between network properties and departure delay duration differed in 2021 compared to 2020 and pre-COVID-19. During the initial phase of the COVID-19 pandemic in 2020, the number of domestic and delayed flights decreased significantly (Figure 2), particularly following the declaration of the first SoE. After the end of the first SoE, the frequency of delayed flights increased slightly and remained moderately perturbed until the fourth SoE in 2021. Despite the declaration of three consecutive SoEs in 2021, the frequency of delayed-departure flights remained higher than that in 2020. This could explain the changes in the observed relationship patterns. Additionally, during 2021, a recovery trend was noted in the total number of flights and delayed-departure flights. Consequently, the coefficient signs may have also shifted compared with 2020. In 2021, we observed variations in the coefficient signs of seasonal interactions with network properties. This outcome is expected because network recovery following a disruption may lead to perturbed characteristics during the entire network reformation process. Furthermore, it is possible to obtain both intuitive and counterintuitive results [56,57] that align with our findings regarding the regression coefficients of all network properties.
6. Conclusions
This study was conducted to examine the relationship between network properties and departure delay duration in Japanese domestic aviation, focusing on two full-service carriers, JAL and ANA, from 2018 to 2021, considering both the pre-COVID-19 and during-COVID-19 phases. The analysis examines various network properties that characterize the daily departure delay network of connecting airports and investigates the relationship between these properties and the departure delay duration using a Prais–Winsten regression model with fixed effects, accounting for serial correlation, heteroskedasticity, and contemporaneous correlation.
The key findings from the analysis indicate that, during the pre-COVID-19 phase, higher in-degree centrality was associated with longer departure delays for both ANA and JAL, suggesting that airports receiving more delayed flights tended to experience longer delays. During the COVID-19 phase, for hub airports, a positive association between in-degree centrality and delay duration was observed for both airlines. This association changed to shorter durations for both ANA and JAL in 2021. This result indicates not only compounding delays at the receiving airports but also the longer departure delay durations that may translate into network-wide cascading delays if airline fleets are tightly scheduled at the receiving airports.
In contrast, increased betweenness centrality generally corresponded to reduced delay durations at hub airports during the pre-COVID-19 phase. However, certain spoke airports, such as SDJ, KOJ, and KMI for ANA and HKD and KOJ, OKD, KUH, and KMI for JAL, may have acted as critical airports in terms of delays and were more likely to experience longer departure delays. During the COVID-19 phase, betweenness centrality was negatively associated with delays in 2020 but positively associated with delays for both ANA and JAL in 2021. Certain spoke airports, such as KOJ, HKD, OKD, KUH, MSJ, and IZO, acted as critical airports that tended to experience longer delays.
During the pre-COVID-19 phase, eigenvector centrality was associated with shorter departure delays for both airlines, indicating that airports connected to highly central airports experienced frequent but shorter delay durations and were more likely to propagate delays with shorter durations among connected airports. In the during-COVID-19 phase, eigenvector centrality yielded results similar to those observed during the pre-COVID-19 phase.
Transitivity effects vary by airline and whether one focuses on hubs or the entire network. ANA often exhibited a negative association (more transitive triads linked to shorter delays), whereas JAL at times showed a positive association (higher transitivity associated with longer delays). Focusing only on hubs yielded contrasting signs, suggesting airline-specific network structures. In 2020, higher transitivity mostly coincided with shorter delays, potentially owing to overall fewer flights and a partial network collapse. By 2021, higher transitivity often reflected localized clusters of delayed flights, lengthening delays in those triads. Several quarters (especially Q3 and Q4 of 2020) showed that transitive clusters could prolong delays owing to localized COVID-related disruptions.
This comparative result shows that the key network properties generally hold consistent explanatory power for delay duration under normal (pre-COVID-19) conditions. During COVID-19, the relationships became more unpredictable, driven by external factors such as SoEs and reduced flights. These patterns during the pandemic period underscore how extreme disruptions can affect delay networks and their relationship with delay duration. One might assume that fewer flights during COVID-19 inherently reduce overall delays. Our results challenge this assumption by demonstrating that smaller network connections can sometimes experience proportionally longer delays.
From the above discussion, our study of how network properties relate to flight departure delay duration shows that, in some cases, higher values of properties are linked to longer delays, and, in some cases, higher values seem to be connected with shorter delays. Understanding these associations can significantly assist Japan’s Air Traffic Management Center (ATMC) in reducing the risk of network-wide disruptions through collaborative decision-making with other airports [58]. In Japan, Fukuoka ATMC oversees domestic air traffic flows, such as flow control and route management, in coordination with three Area Control Centers located in Tokyo, Kobe, and Fukuoka [58,59]. These flow-control measures include ground delay programs, minutes-in-trail, ground stops (for pre-flight), miles-in-trail, speed adjustments, and airborne holding (for in-flight conditions) [60]. From our findings, if the in-degree centrality of delayed flights at the origin airports increases, this typically signals a buildup of delays at the receiving airports. When the number of delayed flights from either the hub or spoke airports is high, the ATMC can recommend speed reductions or increase miles-in-trail on inbound flights to mitigate the overall delay durations at the destination. In terms of betweenness centrality, even airports with lower in-degree (often spokes) can still spread long-lasting delays when their betweenness is high and positively linked to departure delay duration. By tracking it, ATMC can track airports that are most likely to amplify or transfer delays to other airports. Even if these airports do not have a higher number of delayed flights (lower in-degree), their bridging role makes them crucial in controlling the overall delay propagation. Meanwhile, when eigenvector centrality shows a positive link with delay duration, it flags the risk of extensive delays spread across highly interconnected airports with lengthy durations. Here, real-time monitoring and strategic adjustments—such as modifying flight schedules, holding patterns, or route assignments—could help mitigate the downstream impact of delays. Conversely, instances in which a negative association exists may reveal opportunities to reduce the delay impacts since they imply a shorter duration of delay propagation among fewer but highly interconnected airports. Understanding these different effects enables the ATMC to design targeted measures to prevent network configurations from worsening delays and to take advantage of those that help reduce them. Finally, a positive link between transitivity and delay duration means that groups of airports may fall into a cycle in which delays reinforce each other over a longer duration. In these cases, ATMC may consider some targeted actions, such as adjusting flight spacing that could help break the cycle and reduce disruptions. Conversely, a negative relationship suggests that some airport clusters are better at dispersing delays with shorter delay durations, offering practices that could be adopted in more vulnerable areas of the network where the delay durations are high among the airport clusters. These results can be applied in parallel with Japan’s ATMC. We recommend that delay-related network properties be monitored collectively rather than in isolation and further emphasize the correlation of these properties with each delayed flight’s duration. We believe that these network-based properties of delay networks help shift to trajectory-based air traffic management operations from the traditional airspace-based operation that the Japan Civil Aviation Bureau has envisioned to establish CARATS: Collaborative Actions for Renovation of Air Traffic Systems in Japan [61,62]. This enabled a clearer assessment of the number of flights affected and the overall severity of delays, allowing for more effective intervention measures.
This study has certain limitations along with various opportunities for future research. One key limitation is that it establishes only a regression-based association between network properties and departure delay duration rather than identifying a causal relationship. As observed in the findings discussed earlier, the association between network properties and delay duration often exhibited inconsistencies across different years and among the various network metrics. This finding suggests the dynamic nature of this relationship. Furthermore, the potential influence of confounding factors may have contributed to the observed inconsistencies in the associations between delay network metrics. To address these limitations, future research should focus on establishing a causal relationship between network properties and delay duration by incorporating causal inference-based methodologies (e.g., graphical causal models and do-calculus) to account for confounding effects and temporal variations. In addition, this study does not consider the entire departure delay network connecting all JAL and ANA flights as a single network for analysis. Low-cost carriers are also popular in Japan, and a future comparison of the departure delay network properties between full-service carriers and low-cost carriers would be valuable. Weather data that could have provided further insight were not included in this study. Future research could explore the analysis of arrival delays and their connection to departure delays to determine how they both contribute to the overall network, offering a more realistic understanding of delay network characteristics and their eventual propagation. This study is designed for daily delayed networks and durations. The proposed framework can be applied to investigate the relationship at more granular timestamps, such as 1 h, 4 h, and 6 h delay networks. Moreover, the current study framework should be tested and transferred to other delay networks in other regions to establish a generalization of the outcomes that may eventually lead to a causal explanation of this relationship. In particular, in the USA and UK, where centralized air traffic management may incur substantial delays [63], this study can help assess the vulnerability of the delay network by leveraging both the delay network properties and the corresponding delay duration. In addition, comprehensive and quality-controlled flight delay data beyond 2021 are unavailable during the analysis period. Therefore, we limited our objective to examining the relationship between normal operations (pre-COVID-19) and operations during a major external shock (COVID-19). This allowed us to highlight how key network properties behaved under stable conditions versus extreme disruptions. A future study investigating the entire post-pandemic period from 2022 onward could enhance our understanding of long-term delay network resilience.
Author Contributions
Conceptualization, S.N.S.; methodology, S.N.S.; software, S.N.S.; validation, S.N.S. and K.S.; formal analysis, S.N.S.; investigation, S.N.S.; resources, S.H.; data curation, S.N.S.; writing—original draft preparation, S.N.S.; writing—review and editing, S.N.S., K.S. and S.H.; visualization, S.N.S.; supervision, K.S. and S.H.; project administration, S.H.; funding acquisition, S.H. All authors have read and agreed to the published version of the manuscript. All the authors have read and agreed to the published version of this manuscript.
Funding
This study received no external funding.
Data Availability Statement
The data analyzed in this study are available on OAG historical flight data (https://www.oag.com/historical-flight-data, accessed on 9 February 2025).
Conflicts of Interest
The authors declare no conflicts of interest.
Appendix A
Table A1.
Considered airports in Japan with IATA codes.
Table A1.
Considered airports in Japan with IATA codes.
| Airport Name | IATA Code | Airport Name | IATA Code |
|---|---|---|---|
| Kansai International Airport | KIX | Yamagata Airport | GAJ |
| Narita International Airport | NRT | Amami Airport | ASJ |
| Chubu Centrair International Airport | NGO | Aomori Airport | AOJ |
| Tokyo International Airport (Haneda Airport) | HND | Fukushima Airport | FKS |
| Osaka International Airport (Itami Airport) | ITM | Hanamaki Airport | HNA |
| Akita Airport | AXT | New Ishigaski Airport | ISG |
| Asahikawa Airport | AKJ | Izumo Airport | IZO |
| New Chitose Airport | CTS | Kobe Airport | UKB |
| Fukuoka Airport | FUK | Matsumoto Airport | MMJ |
| Hakodate Airport | HKD | Memanbetsu Airport | MMB |
| Hiroshima Airport | HIJ | Miyako Airport | MMY |
| Kagoshima Airport | KOJ | Nanki-Shirahama Airport | SHM |
| Kitakyushu Airport | KKJ | Okayama Airport | OKJ |
| Kochi Airport | KCZ | Oki Airport | OKI |
| Kushiro Airport | KUH | Okushiri Airport | OIR |
| Kumamoto Airport | KMJ | Rishiri Airport | RIS |
| Matsuyama Airport | MYJ | Tanegashima Airport | TNE |
| Miyazaki Airport | KMI | Tokunoshima Airport | TKN |
| Nagasaki Airport | NGS | Yonaguni Airport | OGN |
| Naha Airport | OKA | Komatsu Airport | KMQ |
| Niigata Airport | KIJ | Misawa Airport | MSJ |
| Oita Airport | OIT | Nagoya (Komaki) Airport | NKM |
| Sendai Airport | SDJ | Okadama Airport | OKD |
| Takamatsu Airport | TAK | Tokushima Airport | TKS |
| Obihiro Airport | OBO | New Ishigaki Airport | ISG |
| Yamaguchi-Ube Airport | UBJ | Kitakyushu Airport | KKJ |
References
- Yang, Z.; Chen, Y.; Hu, J.; Song, Y.; Mao, Y. Departure delay prediction and analysis based on node sequence data of ground support services for transit flights. Transp. Res. Part C 2023, 152, 104217. [Google Scholar] [CrossRef]
- Sugishita, K.; Arisawa, K.; Hanaoka, S. Delay propagation patterns in Japan’s domestic air transport network. Transp. Res. Interdiscip. Perspect. 2024, 27, 101235. [Google Scholar] [CrossRef]
- National Academies of Sciences, Engineering, and Medicine (NASEM). Defining and Measuring Aircraft Delay and Airport Capacity Thresholds; The National Academies Press: Washington, DC, USA, 2014. [Google Scholar] [CrossRef]
- Bureau of Transportation Statistics. Available online: https://www.bts.gov/ (accessed on 26 March 2020).
- Ye, B.; Liu, B.; Tian, Y.; Wan, L. A methodology for predicting aggregated flight delays in airports based on supervised learning. Sustainability 2020, 12, 2749. [Google Scholar] [CrossRef]
- Statista. 2023. Available online: https://www.statista.com/statistics/1280563/japan-share-domestic-flights-delayed/ (accessed on 29 August 2024).
- CAAC. Civil Aviation Administration of China Report No.88; CAAC: Beijing, China, 2021.
- Choi, S.; Kim, Y.J.; Briceno, S.; Mavris, D. Prediction of weather-induced airline delays based on machine learning algorithms. In Proceedings of the IEEE/AIAA 35th Digital Avionics Systems Conference, Sacramento, CA, USA, 25–29 September 2016. [Google Scholar]
- Wu, C.-L. Airlines Operations and Delay Management: Insights from Airline Economics, Networks and Strategic Schedule Planning; Ashgate Publishing Limited: Farnham, UK, 2010. [Google Scholar]
- Bechberger, D.; Perryman, J. Graph Databased in Action; Manning Publications Co.: Shelter Island, NY, USA,, 2020. [Google Scholar]
- Kopsidas, A.; Douvaras, A.; Kepaptsoglou, K. Exploring the association between network centralities and passenger flows in metro systems. Appl. Netw. Sci. 2023, 8, 69. [Google Scholar] [CrossRef]
- Shi, X.; Liu, D.; Gan, J. A study on the relationship between road network centrality and the spatial distribution of commercial facilities. Sustainability 2024, 16, 3920. [Google Scholar] [CrossRef]
- Wang, D.; Gong, Y.; Zhang, X.; Lin, Y. The impact of multiscale urban road network centralities on taxi travel: A case study in Shenzhen. Complexity 2022, 13, 1780667. [Google Scholar] [CrossRef]
- Tu, Y.; Ball, M.O.; Jank, W.S. Estimating flight departure delay distributions-A statistical approach with long-term trend and short-term pattern. J. Am. Stat. Assoc. 2008, 103, 112–125. [Google Scholar] [CrossRef]
- Khan, W.A.; Ma, H.-L.; Chung, S.-H.; Wen, X. Hierarchical integrated machine learning model for predicting flight departure delays and duration in series. Transp. Res. Part C 2021, 129, 103225. [Google Scholar] [CrossRef]
- Kim, S.; Park, E. Prediction of flight departure delays caused by weather conditions adopting data-driven approaches. J. Big Data 2024, 11, 11. [Google Scholar] [CrossRef]
- Gopalkrishnan, K.; Balakrishnan, H. A comparative analysis of models for predicting delays in air traffic networks. In Proceedings of the 12th USA/Europe Air Traffic Management Research and Development Seminar (ATM 2017), Seattle, WA, USA, 27–30 June 2017. [Google Scholar]
- Mamdouh, M.; Ezzat, M.; Hefny, H. Improving flight delays prediction by developing attention-based bidirectional LSTM network. Expert Syst. Appl. 2024, 238, 121747. [Google Scholar] [CrossRef]
- Kato, H.; Kimura, Y.; Okumura, M.; Tsukai, M. Analysis of flight delays and cancellations at Sendai airport. J. Jpn. Soc. Civ. Eng. 2008, 25, 723–729. [Google Scholar] [CrossRef][Green Version]
- Hirata, T.; Kodato, W.; Matayoshi, N. Flight delay propagation model for cost benefit analysis in Japanese domestic aviation network. J. Jpn. Soc. Civ. Eng. 2018, 74, 959–970. [Google Scholar] [CrossRef] [PubMed]
- Rebollo, J.J.; Balakrishnan, H. Characterization and prediction of air traffic delays. Transp. Res. Part C 2014, 44, 231–241. [Google Scholar] [CrossRef]
- Gopalkrishnan, K.; Balakrishnan, H.; Jordan, R. Clusters and Communities in Air Traffic Delay Networks; American Control Conference (ACC): Boston, MA, USA, 2016; pp. 3782–3788. [Google Scholar] [CrossRef]
- Wang, Y.; Cao, Y.; Zhu, C.; Wu, F.; Hu, M.; Duong, V.; Watkins, M.; Barzel, B.; Stanley, H.E. Universal patterns in passenger flight departure delays. Sci. Rep. 2020, 10, 6890. [Google Scholar] [CrossRef] [PubMed]
- Wang, Y.; Li, M.Z.; Gopalkrishnan, K.; Liu, T. Timescales of delay propagation in airport networks. Transp. Res. Part E 2022, 16, 102687. [Google Scholar] [CrossRef]
- Wang, Y.; Zheng, H.; Wu, F.; Chen, J.; Hansen, M. A comparative study of flight delay networks of the USA and China. J. Adv. Transp. 2020, 2020, 1369591. [Google Scholar] [CrossRef]
- OAG Historical Flight Data. 2023. Available online: https://www.oag.com/historical-flight-data (accessed on 23 July 2023).
- Hanaoka, S. Low-cost Carriers in the Japanese Aviation Market. In Airline Economics in Asia; Fu, X., Peoples, J., Eds.; Emerald Publishing Limited: Leeds, UK, 2018; pp. 9–31. [Google Scholar] [CrossRef]
- Okamoto, S. State of emergency and human mobility during the COVID-19 pandemic in Japan. J. Transp. Health 2022, 26, 101405. [Google Scholar] [CrossRef]
- Newman, M. Networks, 2nd ed.; Oxford University Press: Oxford, UK, 2018. [Google Scholar]
- An, W. A tale of twin dependence: A new multivariate regression model and an FGLS estimator for analyzing outcomes with network dependence. Sociol. Methods Res. 2023, 52, 1947–1980. [Google Scholar] [CrossRef]
- Greene, W.H. Econometric Analysis, 7th ed.; Prentice Hall: Upper Saddle River, NJ, USA, 2012. [Google Scholar]
- Cimenler, O.; Reeves, K.A.; Skvoretz, J. A regression analysis of researchers’ social network metrics on their citation performance in a college of engineering. J. Informetr. 2014, 8, 667–682. [Google Scholar] [CrossRef]
- Breusch, T.S.; Pagan, A.R. The Lagrange multiplier test and its applications to model specification in econometrics. Rev. Econ. Stud. 1980, 47, 239–253. [Google Scholar] [CrossRef]
- Pesaran, M.H. General Diagnostic Tests for Cross Section Dependence in Panels; Cambridge Working Papers in Economics No: 0435; Faculty of Economics; University of Cambridge: Cambridge, UK, 2004. [Google Scholar]
- Baltagi, B.H.; Feng, Q.; Kao, C. A Lagrange multiplier test for cross-sectional dependence in a fixed effects panel data model. J. Econom. 2012, 170, 164–177. [Google Scholar] [CrossRef]
- Hoechle, D. Robust standard errors for panel regressions with cross-sectional dependence. Stata J. 2007, 7, 281–312. [Google Scholar] [CrossRef]
- Prais, S.J.; Winsten, C.B. Trend Estimators and Serial Correlation; Working Paper 383; Cowles Commission: Chicago, IL, USA, 1954. [Google Scholar]
- Beck, N.K.; Katz, J.N. What to do (and not to do) with time-series cross section data. Am. Political Sci. Rev. 1995, 89, 634–647. [Google Scholar] [CrossRef]
- James, G.; Witten, D.; Hastie, T.; Tibshirani, R. An Introduction to Statistical Learning, 2nd ed.; Springer: Berlin/Heidelberg, Germany, 2021. [Google Scholar]
- Tay, R. Correlation, variance inflation and multicollinearity in regression model. J. East. Asia Soc. Transp. Stud. 2017, 12, 2006–2015. [Google Scholar] [CrossRef]
- Budd, L.; Ison, S. Air Transport Management: An International Perspective; Routledge: New York, NY, USA, 2017. [Google Scholar]
- Aggarwal, C.C. Outlier Analysis, 2nd ed.; Springer: Berlin/Heidelberg, Germany, 2017. [Google Scholar]
- Zhou, F.; Jiang, G.; Lu, Z.; Wang, Q. Evaluation and analysis of the impact of airport delays. Sci. Program. 2022, 2, 7102267. [Google Scholar] [CrossRef]
- Zanin, M.; Belkoura, S.; Zhu, Y. Network analysis of Chinese air transport delay propagation. Chin. J. Aeronaut. 2017, 30, 491–499. [Google Scholar] [CrossRef]
- Li, Q.; Wu, L.; Guan, X.; Tian, Z. Interplay of network topologies in aviation delay propagation: A complex network and machine learning analysis. Phys. A Stat. Mech. Its Appl. 2024, 638, 1296222. [Google Scholar] [CrossRef]
- Japan Airlines (JAL) Connection Information. Available online: https://www.jal.co.jp/jp/en/dom/boarding/onto/ (accessed on 12 October 2024).
- All Nippon Airways (ANA) Transit Information. Available online: https://www.ana.co.jp/en/jp/guide/boarding-procedures/checkin/domestic/transit/ (accessed on 12 October 2024).
- Kang, J.; Yang, S.; Shan, X.; Bao, J.; Yang, Z. Exploring delay propagation causality in various airport networks with attention-weighted recurrent graph convolution method. Aerospace 2023, 10, 453. [Google Scholar] [CrossRef]
- Jia, Z.; Cai, X.; Hu, Y.; Ji, J.; Jiao, Z. Delay propagation network in air transport systems based on refined nonlinear granger causality. Transp. B Transp. Dyn. 2022, 10, 586–598. [Google Scholar] [CrossRef]
- Lonzius, C.; Lange, A. Aircraft routing clusters and their impact on airline delays. J. Air Transp. Manag. 2024, 114, 102493. [Google Scholar] [CrossRef]
- Yimga, J. The airline on-time performance impacts of the COVID-19 pandemic. Transp. Res. Interdiscip. Perspect. 2021, 10, 100386. [Google Scholar] [CrossRef] [PubMed]
- Xu, J.; Dai, L.; Hansen, M. Flight time and flight traffic before, during and after the pandemic: What has changed. Transp. Res. Rec. 2024, 2678, 203–216. [Google Scholar] [CrossRef]
- Schultz, M.; Evler, J.; Asadi, E.; Preis, H.; Fricke, H.; Wu, C.L. Future aircraft turnaround operations considering post-pandemic requirements. J. Air Transp. Manag. 2020, 89, 101886. [Google Scholar] [CrossRef] [PubMed]
- Operational Considerations for Managing COVID-19 Cases or Outbreak in Aviation, Interim Guidance. Available online: https://iris.who.int/bitstream/handle/10665/331488/WHO-2019-nCoV-Aviation-2020.1-eng.pdf?sequence=1 (accessed on 30 September 2024).
- Measures to Prevent COVID-19 Infection at Narita Airport. Available online: https://www.narita-airport.jp/en/company/media-center/news/20200612-prevent-corona/ (accessed on 30 September 2024).
- Gao, J.; Barzel, B.; Barabási, A.L. Universal resilience patterns in complex networks. Nature 2016, 530, 307–312. [Google Scholar] [CrossRef] [PubMed]
- Moutsinas, G.; Guo, W. Node-Level Resilience Loss in Dynamic Complex Networks. Sci. Rep. 2020, 10, 3599. [Google Scholar] [CrossRef]
- Nakagawa, T. Overview of ATM center in Japan. In Proceedings of the Seminar and Regional Instructors Workshops on New CNS/ATM Systems Basic Training in Vietnam, Ho Chi Minh City, Vietnam, 15 March 2012. [Google Scholar]
- MLIT to Abolish Sapporo Area Control Center in Effort to Increase Traffic Processing Capacity. 2024. Available online: https://japanaviationhub.com/news/sapporo-area-control-center-abolishment/ (accessed on 27 January 2025).
- Implementation of Collaborative Air Traffic Flow Management, Agenda Item 32: Aviation Safety and Air Navigation Regional Implementation Coordination Mechanisms. 2022. Available online: https://www.icao.int/Meetings/a41/Documents/WP/wp_139_en.pdf (accessed on 27 January 2025).
- Overview of Air Navigation Services in Japan. 2024. Available online: https://www.mlit.go.jp/en/koku/content/001758772.pdf (accessed on 27 January 2025).
- Hirata, T.; Shimuzu, A.; Mimura, D.; Yai, T. Analysis of airborne delay characteristics of flights controlled by ground-holding: Case of the flights to Tokyo International Airport. J. East. Asia Soc. Transp. Stud. 2013, 10, 2210–2222. [Google Scholar] [CrossRef]
- Campanelli, B.; Fleurquin, P.; Arranz, A.; Etxebarria, I.; Ciruelos, C.; Eguíluz, V.M.; Ramasco, J.J. Comparing the modeling of delay propagation in the US and European air traffic networks. J. Air Transp. Manag. 2016, 56, 12–18. [Google Scholar] [CrossRef]
Disclaimer/Publisher’s Note: The statements, opinions and data contained in all publications are solely those of the individual author(s) and contributor(s) and not of MDPI and/or the editor(s). MDPI and/or the editor(s) disclaim responsibility for any injury to people or property resulting from any ideas, methods, instructions or products referred to in the content. |
© 2025 by the authors. Licensee MDPI, Basel, Switzerland. This article is an open access article distributed under the terms and conditions of the Creative Commons Attribution (CC BY) license (https://creativecommons.org/licenses/by/4.0/).